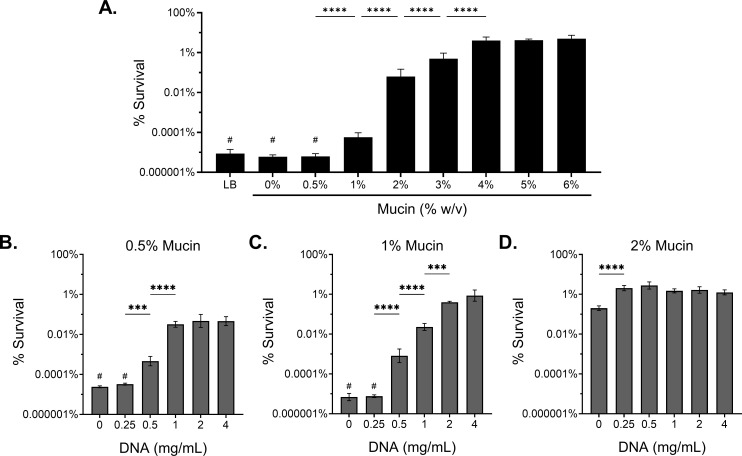
Fig 2.
Increasing mucus polymer concentration drives antibiotic tolerance to tobramycin. Percent survival of mPAO1 after 24 h treatment with 300 µg/mL tobramycin in (A) LB and SCFM2 with increasing % (wt/vol) mucin without eDNA or SCFM2 at a consistent mucin concentration of (B) 0.5%, (C) 1%, or (D) 2%(wt/vol) with increasing HMW eDNA. Data represent the mean ± SD of n ≥ 3 biological replicates. Statistical differences were analyzed using one-way ANOVA with Tukey’s multiple comparison correction. ***P < 0.001, ****P < 0.0001. # indicates no P. aeruginosa recovered after antibiotic treatment (limit of detection, 102 CFU/mL).

