

SUMMARY
Amino acids are required for cell growth and proliferation, but it remains unclear when and how amino acid availability impinges on the proliferation-quiescence decision. Here, we used time-lapse microscopy and single-cell tracking of cyclin-dependent kinase 2 (CDK2) activity to assess the response of individual cells to withdrawal of single amino acids and found strikingly different cell-cycle effects depending on the amino acid. For example, upon leucine withdrawal, MCF10A cells complete two cell cycles and then enter a CDK2-low quiescence, whereas lysine withdrawal causes immediate cell-cycle stalling. Methionine withdrawal triggers a restriction point phenotype similar to serum starvation or Mek inhibition: upon methionine withdrawal, cells complete their current cell cycle and enter a CDK2-low quiescence after mitosis. Modulation of restriction point regulators p21/p27 or cyclin D1 enables short-term rescue of proliferation under methionine and leucine withdrawal, and to a lesser extent lysine withdrawal, revealing a checkpoint connecting nutrient signaling to cell-cycle entry.
In brief
Amino acids are key inputs for cell growth and proliferation. Using time-lapse single-cell microscopy, Rong et al. found that cell-cycle arrest upon methionine and leucine starvation is mainly regulated by restriction point regulators, while cell-cycle arrest upon lysine withdrawal is mainly caused by inhibition of protein synthesis.
Graphical Abstract

INTRODUCTION
Mammalian cells integrate the availability of diverse cell-cycle inputs such as growth factors and nutrients and then decide to commit to the cell cycle to proceed through G1, S, G2, and M phases or to enter quiescence (G0), a transient state of cell-cycle exit. Cell-cycle entry is dysregulated in nearly all types of cancer, demonstrating the importance of the cellular decision to proliferate or remain quiescent.
Growth factor signaling is a key input into the proliferation-quiescence decision, with the mitogen-activated protein kinase (MAPK) pathway as the nexus of many growth factor signals. Activation of the MAPK signaling pathway, consisting of RAF, MEK, and ERK, leads to the activation of several transcription factors that then promote the transcription of cyclin D and the activation of cyclin-dependent kinases 4/6 and 2 (CDK4/6 and CDK2). CDK4/6 and CDK2 phosphorylate the retinoblastoma tumor-suppressor protein (Rb), which releases the master cell-cycle transcription factor E2F to drive cell-cycle commitment.1 Thus, commitment to a new cell cycle can be marked by the activation of CDK2 or the hyper-phosphorylation of Rb.2,3
Amino acids, the building blocks of proteins, are also key inputs for proliferation and are required for macromolecular biosynthesis. Amino acid starvation inhibits cell growth by inactivating the mammalian target of rapamycin (mTOR) signaling pathway and suppressing general protein synthesis via activation of the integrated stress response (ISR) kinase general control non-derepressible 2 (GCN2).4–8 The two well-characterized substrates of mTORC1 are p70-S6 kinase (S6K) and the eukaryotic initiation factor 4E (eIF4E) binding protein (4E-BP).9,10 In response to environmental cues such as growth factors and nutrients, activation of mTORC1 results in phosphorylation of S6K, which in turn phosphorylates ribosomal protein S6 to promote protein synthesis. Phosphorylation of 4E-BP by mTORC1 relieves its inhibition of eIF4E, which is required for cap-dependent translation. In mammalian cells, amino acid withdrawal leads to reduced transfer RNA (tRNA) charging and activation of GCN2, which phosphorylates the α subunit of eIF2 (eIF2α).11,12 eIF2α phosphorylation inhibits global protein synthesis but promotes translation of activating transcription factor 4 (ATF4), which enacts a cytoprotective transcriptional program that includes the activation of amino acid synthesis pathways (Figure 1A).13–15
Figure 1. Connection of upstream amino acid signaling to cell-cycle progression.
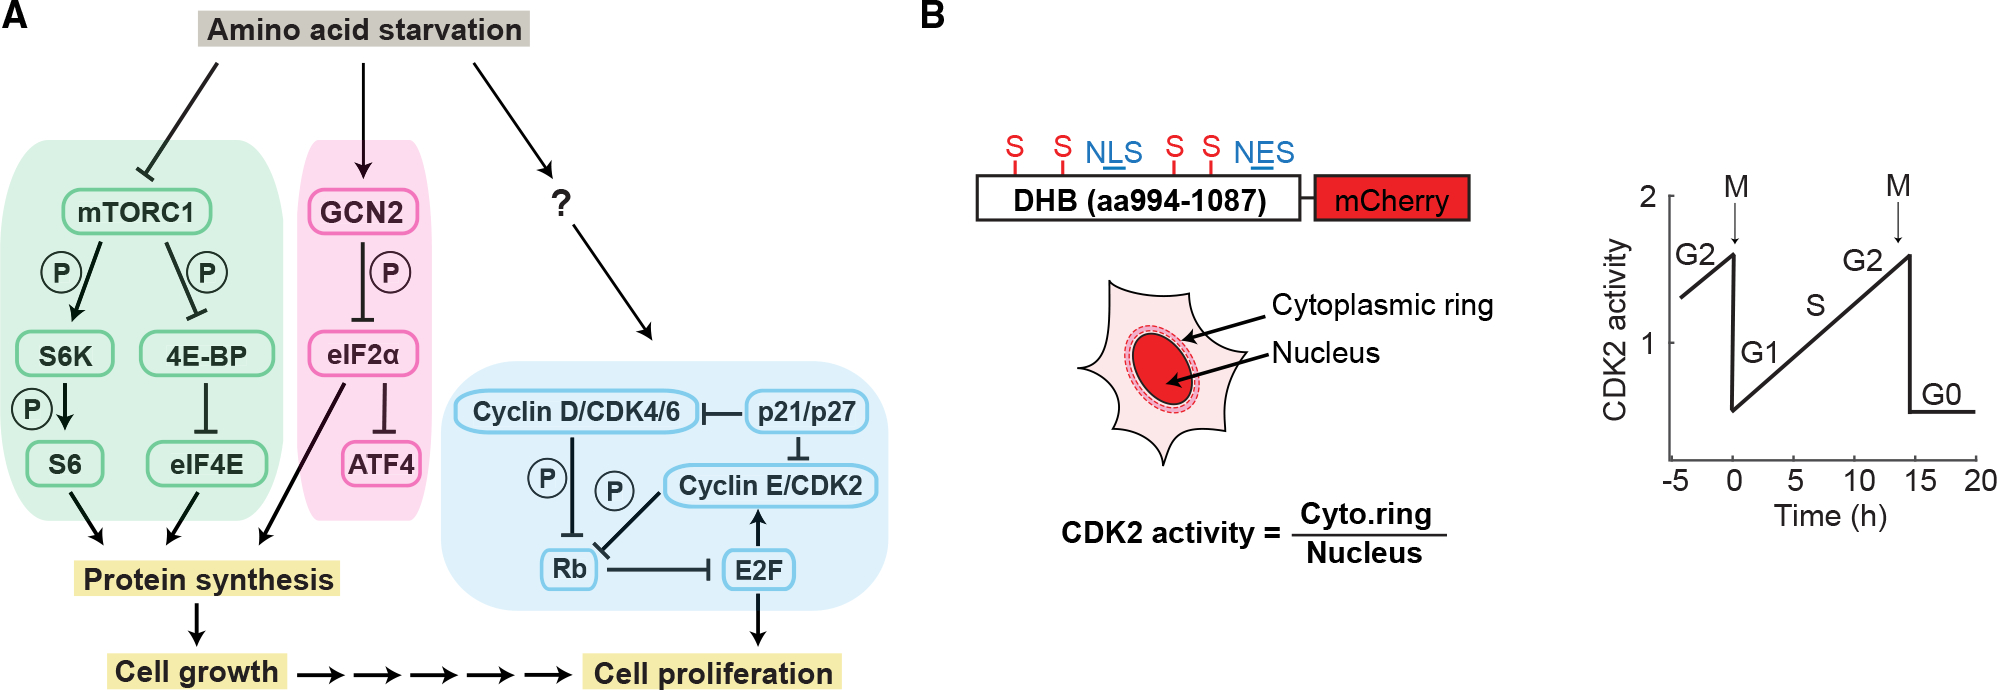
(A) Signaling pathways controlling protein synthesis, cell growth, and cell proliferation. Multiple sequential arrows are meant to indicate an indirect multistep process. P means the kinase phosphorylates the substrate.
(B) Schematic of a genetically encoded live-cell sensor for CDK2 activity and sensor behavior during proliferation and quiescence. Adapted from Spencer et al.2
Cell proliferation is often coordinated with cell growth.16 In classic models, cell-cycle arrest upon acute amino acid withdrawal is considered a secondary consequence of stalled protein synthesis and/or cell growth inhibition.17,18 In this model, low amino acid levels inactivate mTOR, and protein synthesis is downregulated due to mTOR-dependent control of translation and other direct mechanisms (e.g., ribosome stalling), resulting in insufficient synthesis of the protein machinery needed for cell growth and cell-cycle progression.
Classic models of mammalian cell-cycle control are largely based on bulk analysis of starved or chemically synchronized cells, methods that inherently induce stress and alter the natural behavior of cycling cells. For example, in 1974, Pardee described the restriction point as the point of cell-cycle commitment after which cells no longer need mitogens or amino acids to complete the current cell cycle.19 Using cells emerging from a serum-starvation-induced or amino-acid-starvation-induced quiescence, Pardee concluded that both serum and amino acid signal integration occurs during G1 prior to the restriction point.19 However, the application of modern single-cell time-lapse imaging of CDK2 activity (Figure 1B) allows for analysis of cell-cycle commitment decisions in asynchronously cycling cells. This approach has revealed that cells integrate the availability of growth factor signals in the previous (mother) cell cycle to choose, upon completion of mitosis, between proliferation (marked by Rb hyper-phosphorylation and increasing CDK2 activity, “CDK2inc”) and quiescence (marked by Rb hypophosphorylation and low CDK2 activity, “CDK2low”).2,20,21 p21 and p27 further tune the proliferation-quiescence decision by inhibiting CDK activity in response to stress.22–24 We therefore sought to revisit how amino acid limitation impinges on the cell cycle.
Here, we acutely withdrew each of the 20 amino acids and assessed the cell-cycle response using time-lapse microscopy of CDK2 activity. We found that withdrawal of different single amino acids causes strikingly different cell-cycle effects. We therefore tested whether the regulation of the proliferation-quiescence decision by amino acid signaling occurs via specific signaling pathways or checkpoints rather than simply secondary effects of insufficient protein synthesis. Our results reveal the dynamics and complexity of cell-cycle regulation by nutrient signaling pathways.
RESULTS
Acute withdrawal of different amino acids leads to differing cell-cycle effects
To assess how amino acid insufficiency impinges on the cell cycle to induce quiescence, we filmed MCF10A mammary epithelial cells responding to acute withdrawal of each of the 20 single amino acids and counted the number of cells in each frame using a histone-2B nuclear marker. Withdrawal of different single amino acids from full DMEM/F-12-based media resulted in differing effects on proliferation, ranging from nearly unaffected (tryptophan) to severely affected (methionine, lysine, and cysteine/cystine) (Figure 2A). No apoptosis was observed under these conditions. Unexpectedly, the response to amino acid withdrawal was not correlated with whether the amino acid withdrawn was classified as “essential,” “non-essential,” or “conditionally essential.” For example, withdrawal of the essential amino acid tryptophan showed near-normal proliferation rates, whereas withdrawal of the non-essential amino acid arginine hindered proliferation (Figure 2A).
Figure 2. Acute withdrawal of different amino acids leads to differing cell-cycle effects.
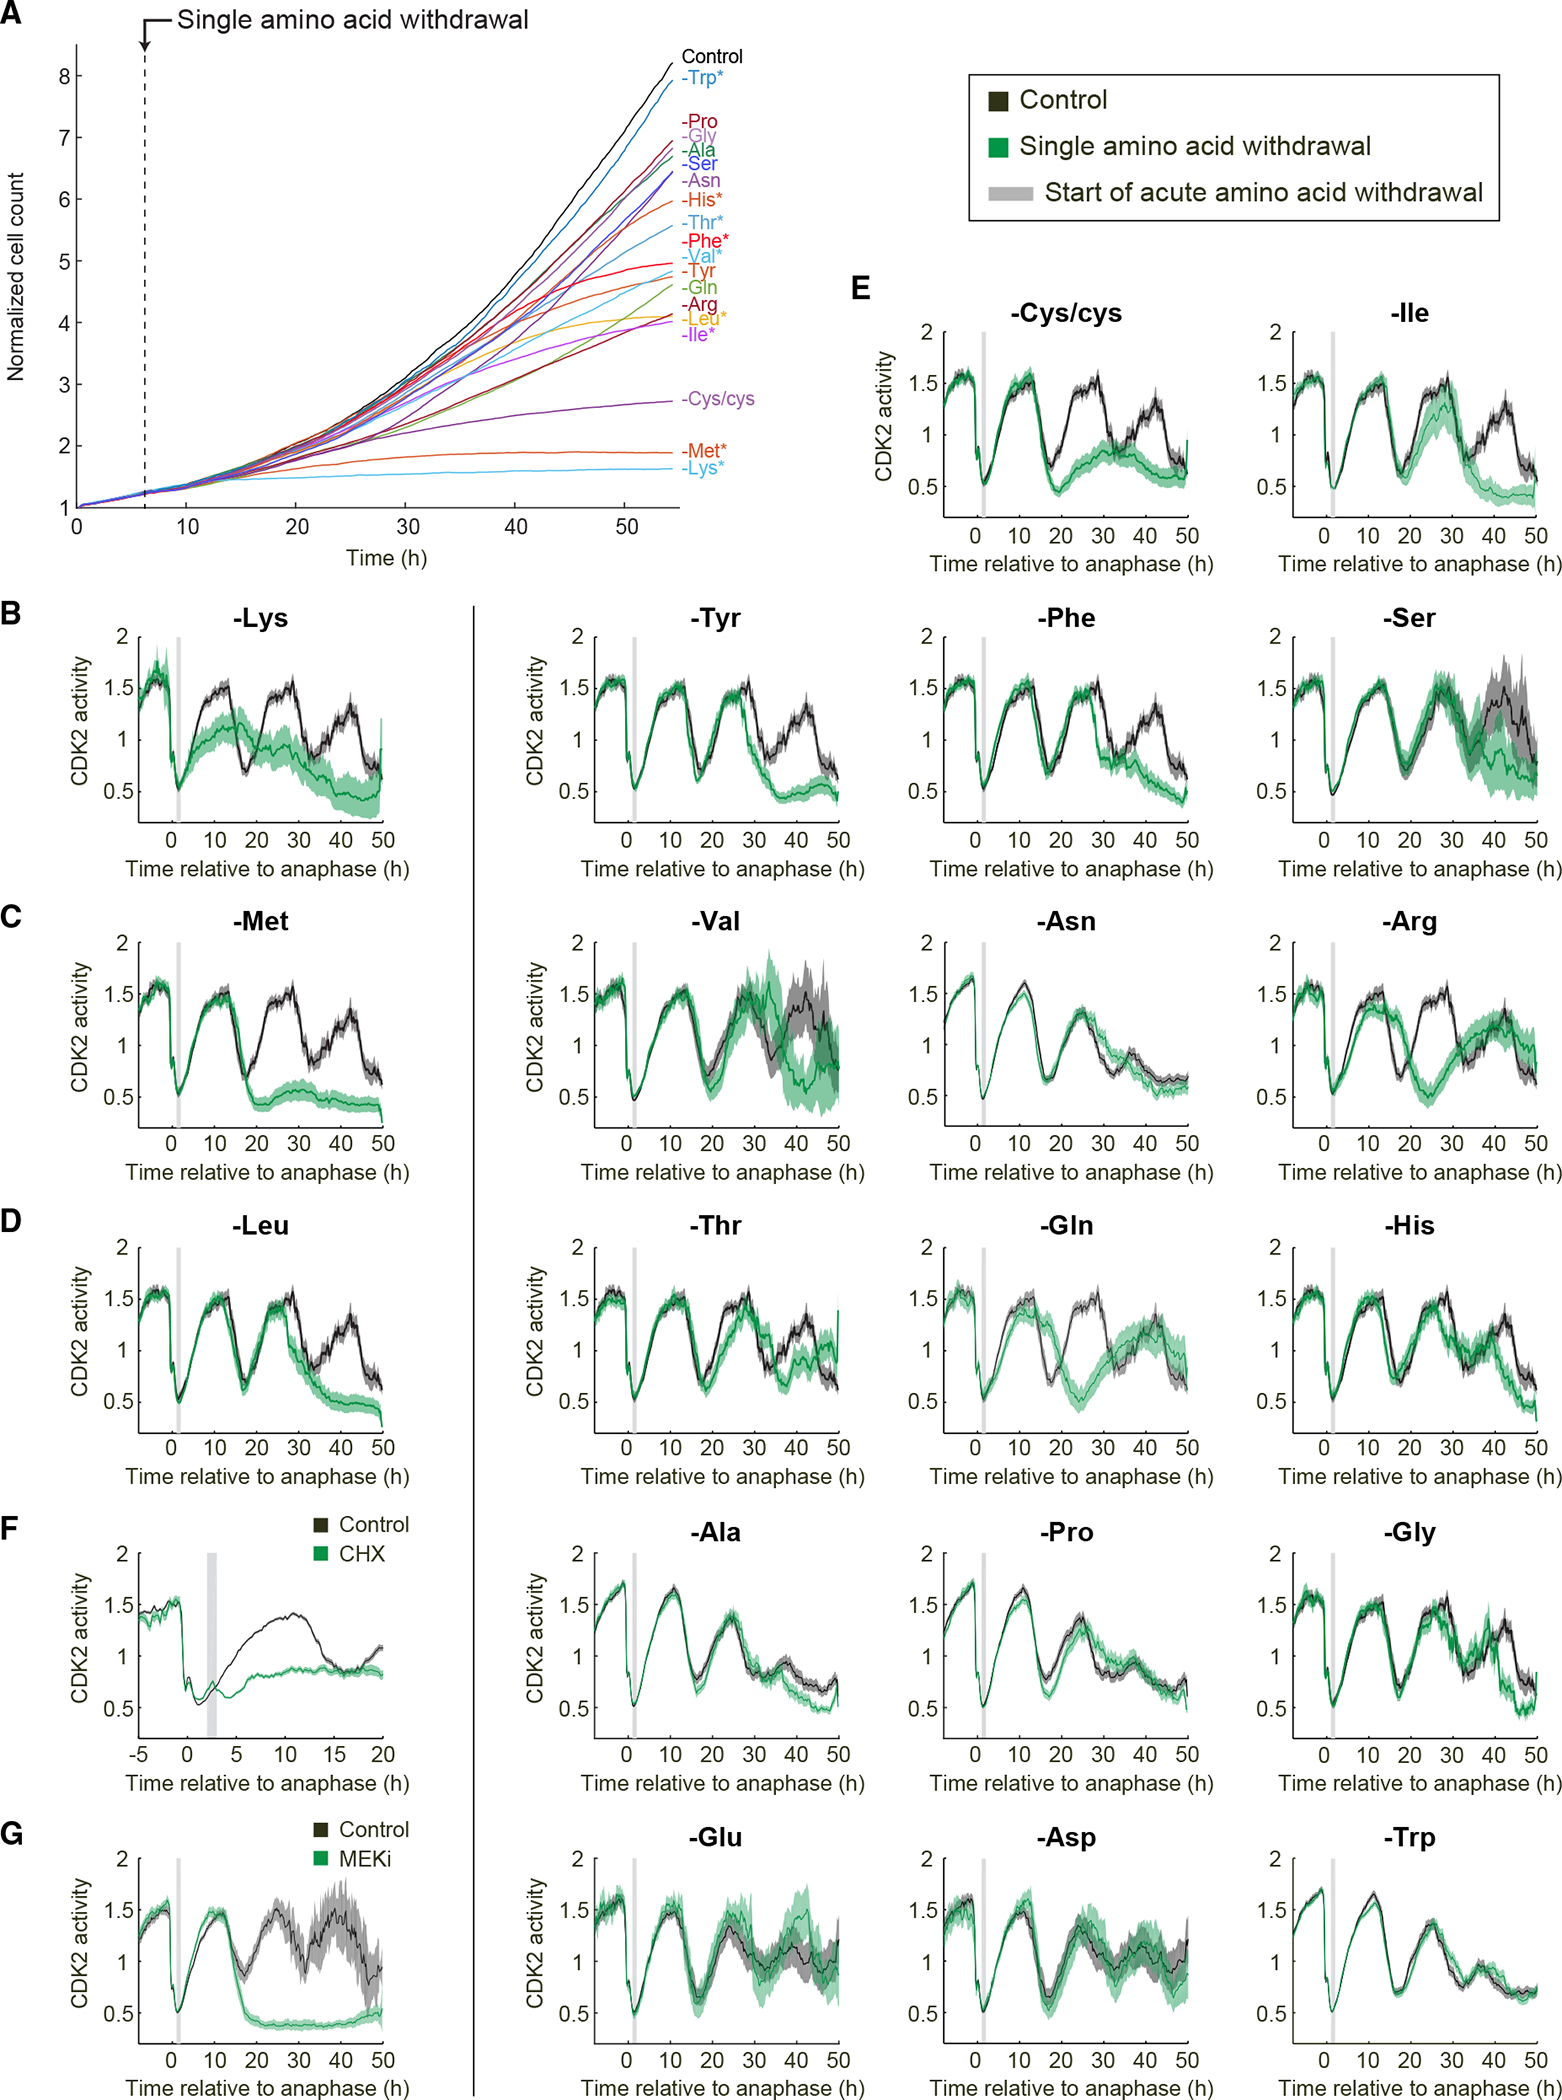
(A) Normalized cell count for single amino acid withdrawal in MCF10A cells with regular horse serum. Dashed line marks the moment when amino acids are withdrawn. Stars mark essential amino acids.
(B–G) Population average and 95% confidence interval of CDK2 activity in MCF10A cells with regular horse serum. Asynchronously cycling cells were first imaged in full-growth medium for 16 h. The movie was then paused, and cells were treated with 5 μg/mL cycloheximide (F) or 100 nM Mek inhibitor (G) or subjected to amino acid withdrawal (B–E) before restarting the movie. To visualize only cells in early G1 phase at the time of perturbation, asynchronously cycling cells were selected for plotting if they underwent anaphase 1–2 h before the perturbation, marked by the gray bar. Images in (E) are ordered by similarity of response: Cys/cys withdrawal in MCF10A cells is similar to Met withdrawal; Ile, Tyr, Phe, Ser, and Val withdrawals are similar to Leu withdrawal; Asn, Arg, Thr, and Gln withdrawal caused slower current or next cell-cycle progression; and His, Ala, Pro, Gly, Glu, Asp, and Trp withdrawal had mild to no effect on cell-cycle progression within 48 h of withdrawal. All plots in (B)–(G) contain at least 125 single-cell traces per condition.
Since serum contains amino acids, individual amino acids withdrawn from media containing serum might be incompletely removed. We therefore repeated the experiment in MCF10A cells using dialyzed horse serum and obtained similar results, although cells proliferated somewhat less well overall, likely because the dialysis process also removes essential vitamins and other nutrients (Figures S1A and S1B).
We next used time-lapse microscopy and single-cell tracking of CDK2 activity to follow the responses of thousands of individual cells to acute withdrawal of each of the 20 amino acids. In unperturbed cells, CDK2 activity drops in mitosis and then increases steadily throughout the cell cycle until the next mitosis.2 Immediate stalling of the cell cycle in response to perturbations can be identified as a mid-cell-cycle plateau of CDK2 activity, and G0 or quiescence can be identified when cells enter a prolonged CDK2low state after completion of mitosis.2,22,25 We computationally synchronized cells by only plotting the cells that experienced amino acid withdrawal in early G1 phase of the cell cycle. We observed various cell-cycle responses depending on the amino acid that was acutely withdrawn, ranging from entry into quiescence after the subsequent mitosis for the majority of cells (methionine, cysteine/cystine), entry into quiescence after exactly two mitoses (e.g., leucine, isoleucine, tyrosine), prolonged current cell cycle (e.g., arginine, asparagine, glutamine), stalled current cell cycle (lysine), or minimal effect on proliferation (e.g., tryptophan, glycine) (Figures 2B–2E). Again, similar results were obtained for MCF10A cultured in media with dialyzed horse serum (Figures S1A and S1B).
To probe these findings in more detail, we selected three amino acids (lysine, methionine, leucine) with different phenotypes for further study. According to the classic model, insufficient protein synthesis is the primary cause of cell-cycle arrest upon amino acid withdrawal. Consistent with this notion, upon lysine withdrawal, the cell cycle stalls rapidly and indefinitely (Figure 2B), and the single-cell traces show that all cells fail to complete the cell cycle (Figure S1C). This type of cell-cycle stalling phenotype is expected if protein synthesis were severely inhibited. Consistent with this idea, we note that lysine is the most common amino acid in ribosomal proteins.26 To compare this phenotype to chemical inhibition of protein synthesis, we treated cells with cycloheximide, a ribosome elongation inhibitor. Upon treatment with 5 μg/mL cycloheximide, CDK2 activity rapidly stalled at an intermediate level (Figure 2F). Thus, lysine withdrawal displays a cell-cycle-stalling behavior that suggests an arrest due to insufficient protein synthesis.
By contrast, methionine withdrawal triggers a restriction point phenotype similar to serum starvation or Mek inhibition (Figures 2C, 2G, and S1C)2 wherein cells complete the remaining 15 h current cell cycle at the standard rate and then enter a CDK2low quiescence after the subsequent mitosis. Relatedly, upon leucine starvation, cells finish two normal cell cycles at the standard rate and then enter a CDK2low quiescence after the second mitosis (Figures 2D and S1C). Similar results were obtained in retinal pigment epithelium RPE-hTERT cells (Figure S1D). These phenotypes are distinct from an arrest caused by insufficient protein synthesis and suggest cell-cycle arrest due to a specific signaling pathway or checkpoint that links upstream methionine and leucine availability to cell-cycle commitment.
Intracellular amino acid levels drop upon methionine, leucine, and lysine withdrawal, and cells sense this drop
We next examined how cells are able to continue cell-cycle progression for over 15 h in the absence of methionine and leucine before entering quiescence. We tested three hypotheses: (1) intracellular amino acid concentrations are not dropping upon amino acid withdrawal, (2) the mTORC1 and ISR pathways are not sensing the drop in amino acid levels, and (3) protein translation rates are not being affected by amino acid withdrawal (Figure 3A). We first used gas chromatography-mass spectrometry (GC-MS) to test whether the intracellular single amino acid concentrations were dropping after acute amino acid withdrawal or whether compensatory amino acid transport, recycling, or synthesis mechanisms were buffering a drop in amino acid levels. In both MCF10A and RPE-hTERT cells, the intracellular concentration of each of these amino acids dropped within 15 min of withdrawal, while the concentration of other amino acids remained unperturbed or increased slightly (Figure 3B and S2A). Thus, the intracellular amino acid levels are indeed being rapidly depleted, yet in the case of methionine or leucine withdrawal, cells are nevertheless able to complete one or two cell cycles before arresting.
Figure 3. Measurement of intracellular amino acid levels, amino acid sensing, and translation rate.
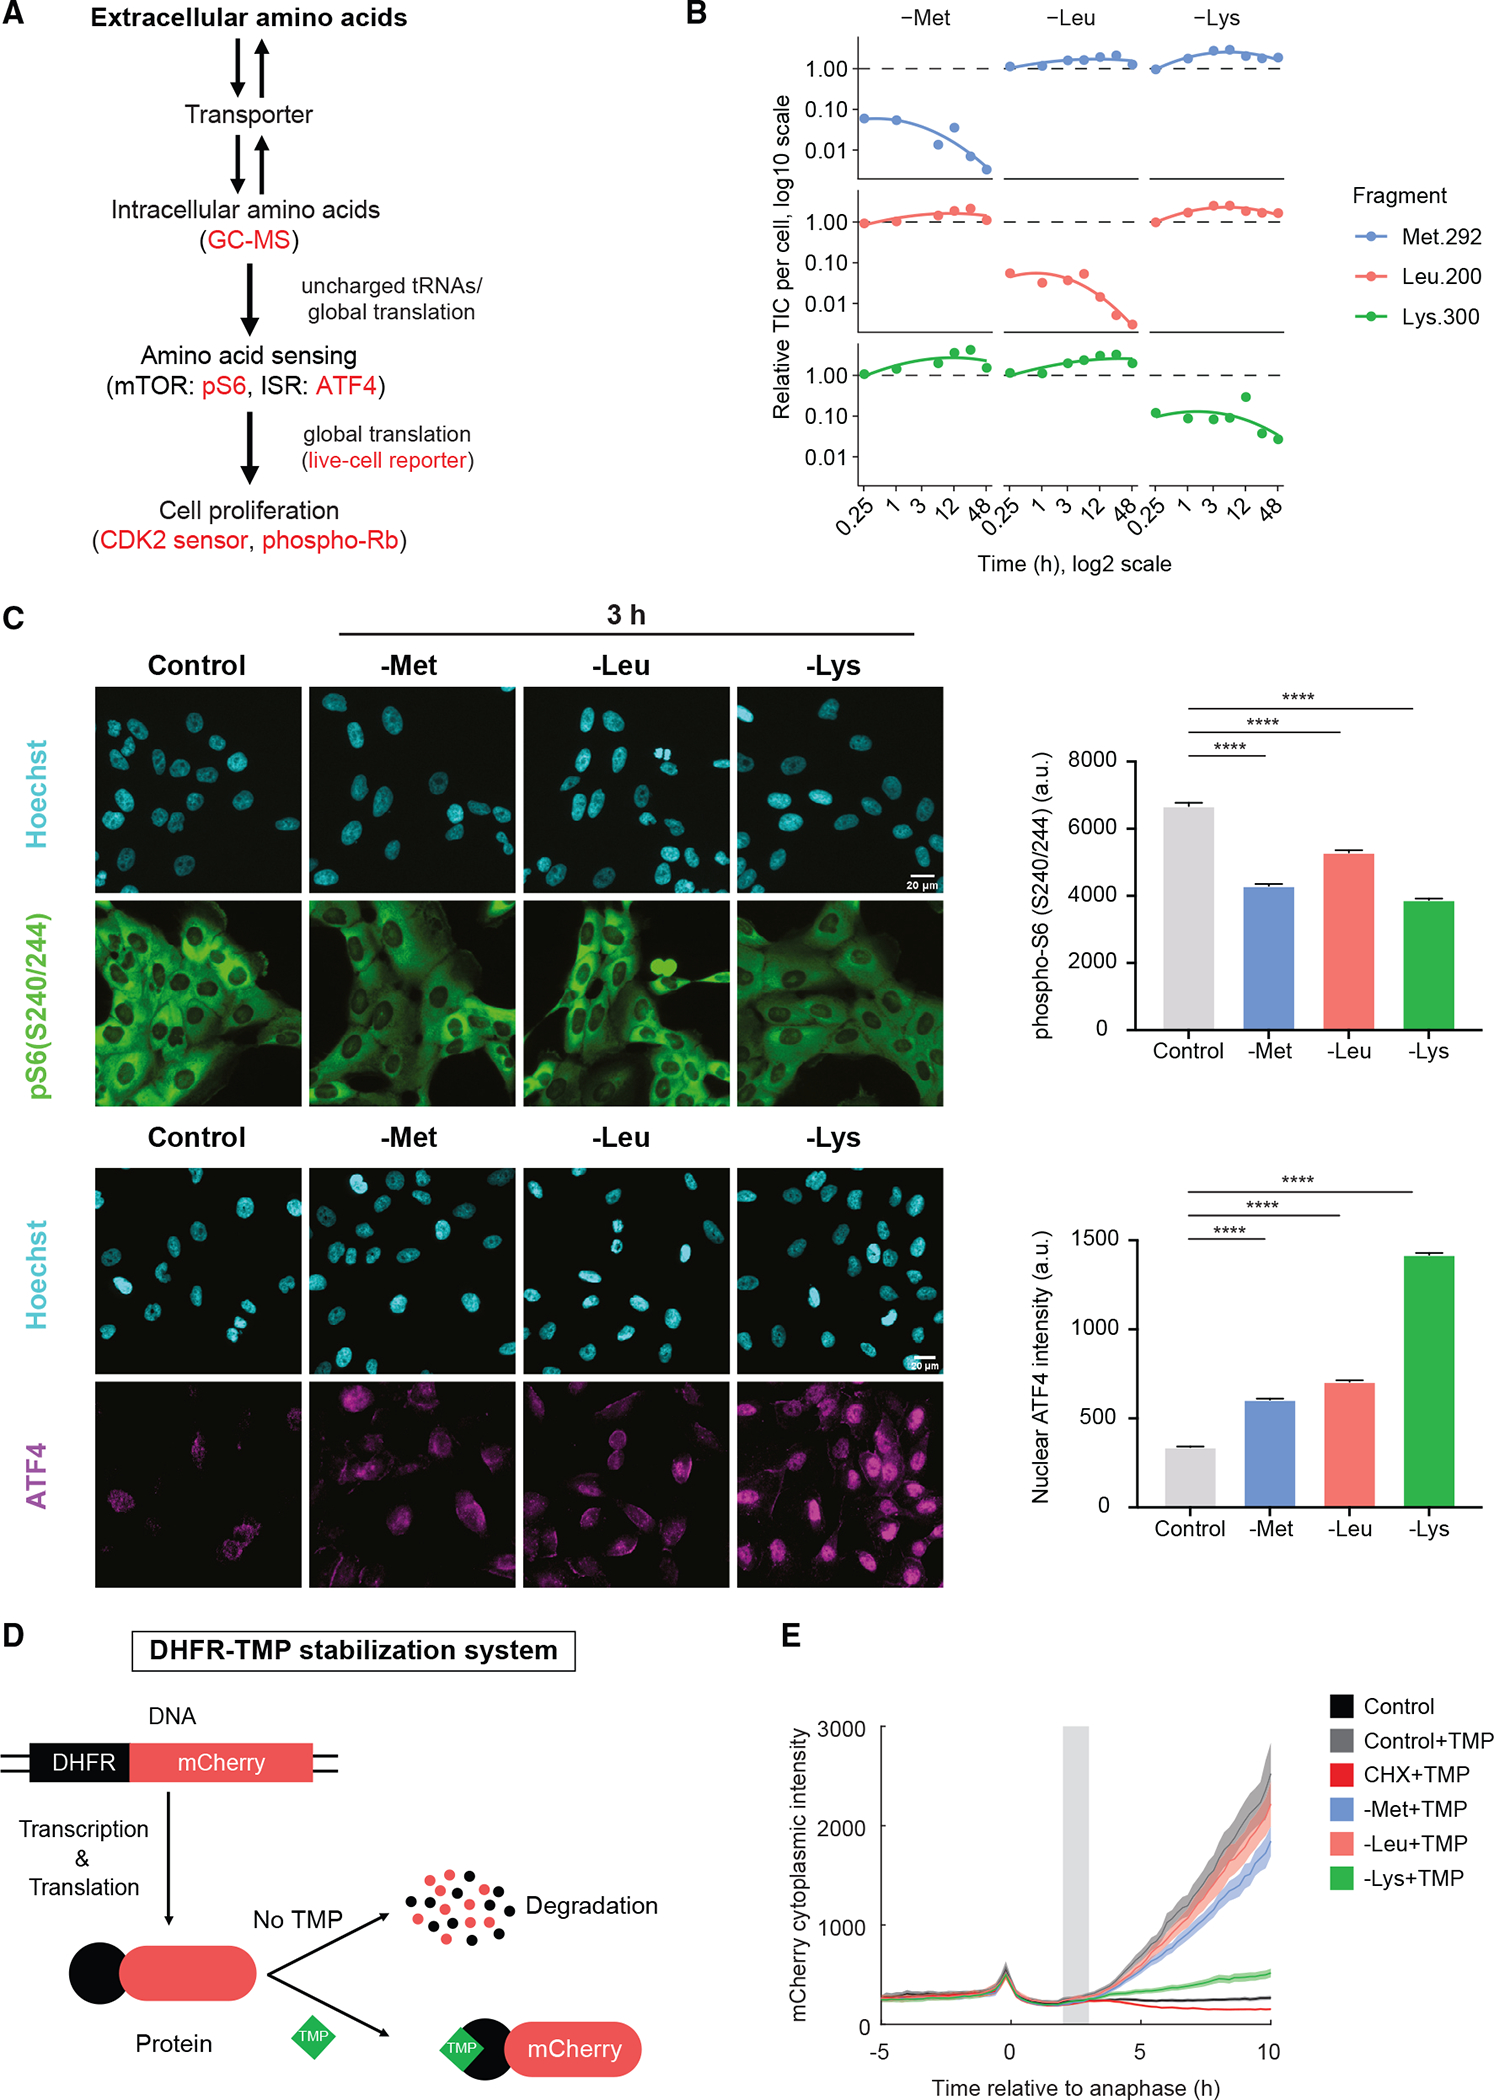
(A) Schematic of how extracellular amino acids control cell proliferation. Methods/markers used in this study to measure each process are labeled red.
(B) GC-MS quantification of intracellular single amino acid concentrations in MCF10A cells grown in regular horse serum after acute amino acid withdrawal for 0.25, 1, 3, 6, 12, 24, and 48 h. TIC, normalized total ion counts. Dashed lines indicate levels of each amino acid in full-growth media.
(C) Immunofluorescence images and quantification of phospho-S6(Ser240/244) and ATF4 protein in MCF10A cells grown in regular horse serum after 3 h single amino acid withdrawal. Cyan, Hoechst; green, phospho-S6(Ser240/244); magenta, ATF4. Error bars indicate 95% confidence intervals. Scale bars: 20 μm. Statistical analyses were performed using permutation test: ****p < 0.0001. All plots contain at least 4,700 cells per condition.
(D) Schematic of a live-cell protein synthesis reporter using TMP-induced DHFR-mCherry constructs. TMP, trimethoprim.
(E) Measurement of protein synthesis rates in MCF10A cells grown in regular horse serum using DHFR-mCherry live-cell reporter. Cells were first imaged in full-growth medium, and then the indicated amino acid was acutely withdrawn at the gray bar. All curves contain at least 180 cells.
Adaptive mechanisms that allow cells to recycle and scavenge essential nutrients are important for survival in nutrient-depleted conditions. Amino acids are recycled through autophagy and can be scavenged through macropinocytosis.27,28 To test whether amino acid recycling or scavenging mechanisms were buffering the perturbation, we treated cells with the autophagy inhibitor chloroquine (CQ) and the macropinocytosis inhibitor 5-(N-Ethyl-N-isopropyl)-amiloride (EIPA), with and without amino acid starvation, for 48 h and measured the fraction of cycling cells by immunofluorescence for phospho-Rb. We detected fewer proliferating (Rb hyper-phosphorylated) cells upon methionine, leucine, and lysine withdrawal with 10 μM CQ (Figures S3A and S3C) and 5 mM EIPA (Figures S3B and S3D), suggesting that autophagy and protein scavenging play a partial role in the observed cellular responses to individual amino acid deprivation.
In the absence of select amino acids, the mTOR signaling pathway will be inactivated and the ISR will be induced if the level of the amino acid is sufficiently low. To determine whether signaling pathways might account for the differential effect of withdrawal of these amino acids, we performed immunofluorescence for two common markers, phospho-S6(Ser240/244) and ATF4, which are downstream effectors of the mTOR and the ISR signaling pathways, respectively. In the presence of regular serum, acute withdrawal of each of the three amino acids caused significant elevation of ATF4 and reduced phospho-S6 within 3 h, with lysine eliciting the strongest effect (Figure 3C). Similar results were obtained for ATF4 in RPE-hTERT cells (Figure S2B). Thus, although cells sensed the deprivation of methionine and leucine within 3 h, they were nevertheless able to complete one or two cell cycles before arresting.
Protein synthesis rates correlate with the rapidity of proliferation arrest
We next tested whether protein synthesis was rapidly perturbed upon acute amino acid withdrawal. We adapted a live-cell protein synthesis reporter in which mCherry is fused to an unstable E. coli dihydrofolate reductase (DHFR) domain.29,30 The DHFR-mCherry reporter is thus continually synthesized but continually degraded. Addition of trimethoprim (TMP) blocks this degradation, allowing the mCherry fluorescence to accumulate and serve as a proxy for the rate of protein synthesis (Figure 3D). As negative controls, we monitored the mCherry signal in the absence of TMP or upon treatment of cells with cycloheximide plus TMP and saw no mCherry signal, as expected. As a positive control, addition of TMP to cells in full-growth media revealed rapid accumulation of mCherry. Leucine and methionine caused only a mild reduction in protein synthesis. By contrast, lysine withdrawal caused a near complete block of protein synthesis (Figure 3E). We conclude that insufficient protein synthesis is the likely cause of the rapid cell-cycle stalling observed upon lysine withdrawal.
Amino acid signaling funnels through cyclin D1, p21, and p27 to regulate cell-cycle entry
Since methionine withdrawal caused cell-cycle arrest at the restriction point, we examined the roles of three restriction point regulators: the CDK4/6 activator cyclin D1 and CDK2 inhibitors p21 and p27 (Figure 4A). Importantly, the ratio of cyclin D1 to p21 and p27 has been shown to regulate cell-cycle entry following contact inhibition, reduced mitogens, or increased stress signaling.24,31,32 Furthermore, p21 and p27 were previously shown to be induced by leucine and histidine withdrawal, respectively.33,34 We therefore hypothesized that cyclin D1 levels might drop or that p21 and p27 might be induced upon amino acid withdrawal with kinetics that match the specific timing of CDK2 inhibition and cell-cycle exit for the different amino acids. First, to test whether cyclin D1 or p21 levels might respond to amino acid withdrawal, we performed time-lapse microscopy of two 3-color MCF10A cell lines harboring (1) either cyclin D1 or p21 tagged at the endogenous locus with the fluorescent protein mCitrine (mCitrine-cyclin D1 or mCitrine-p21), (2) the CDK2 activity sensor, and (3) a histone-2B nuclear marker for cell tracking.
Figure 4. Amino acid signaling funnels through cyclin D1, p21, and p27 to regulate cell-cycle entry.
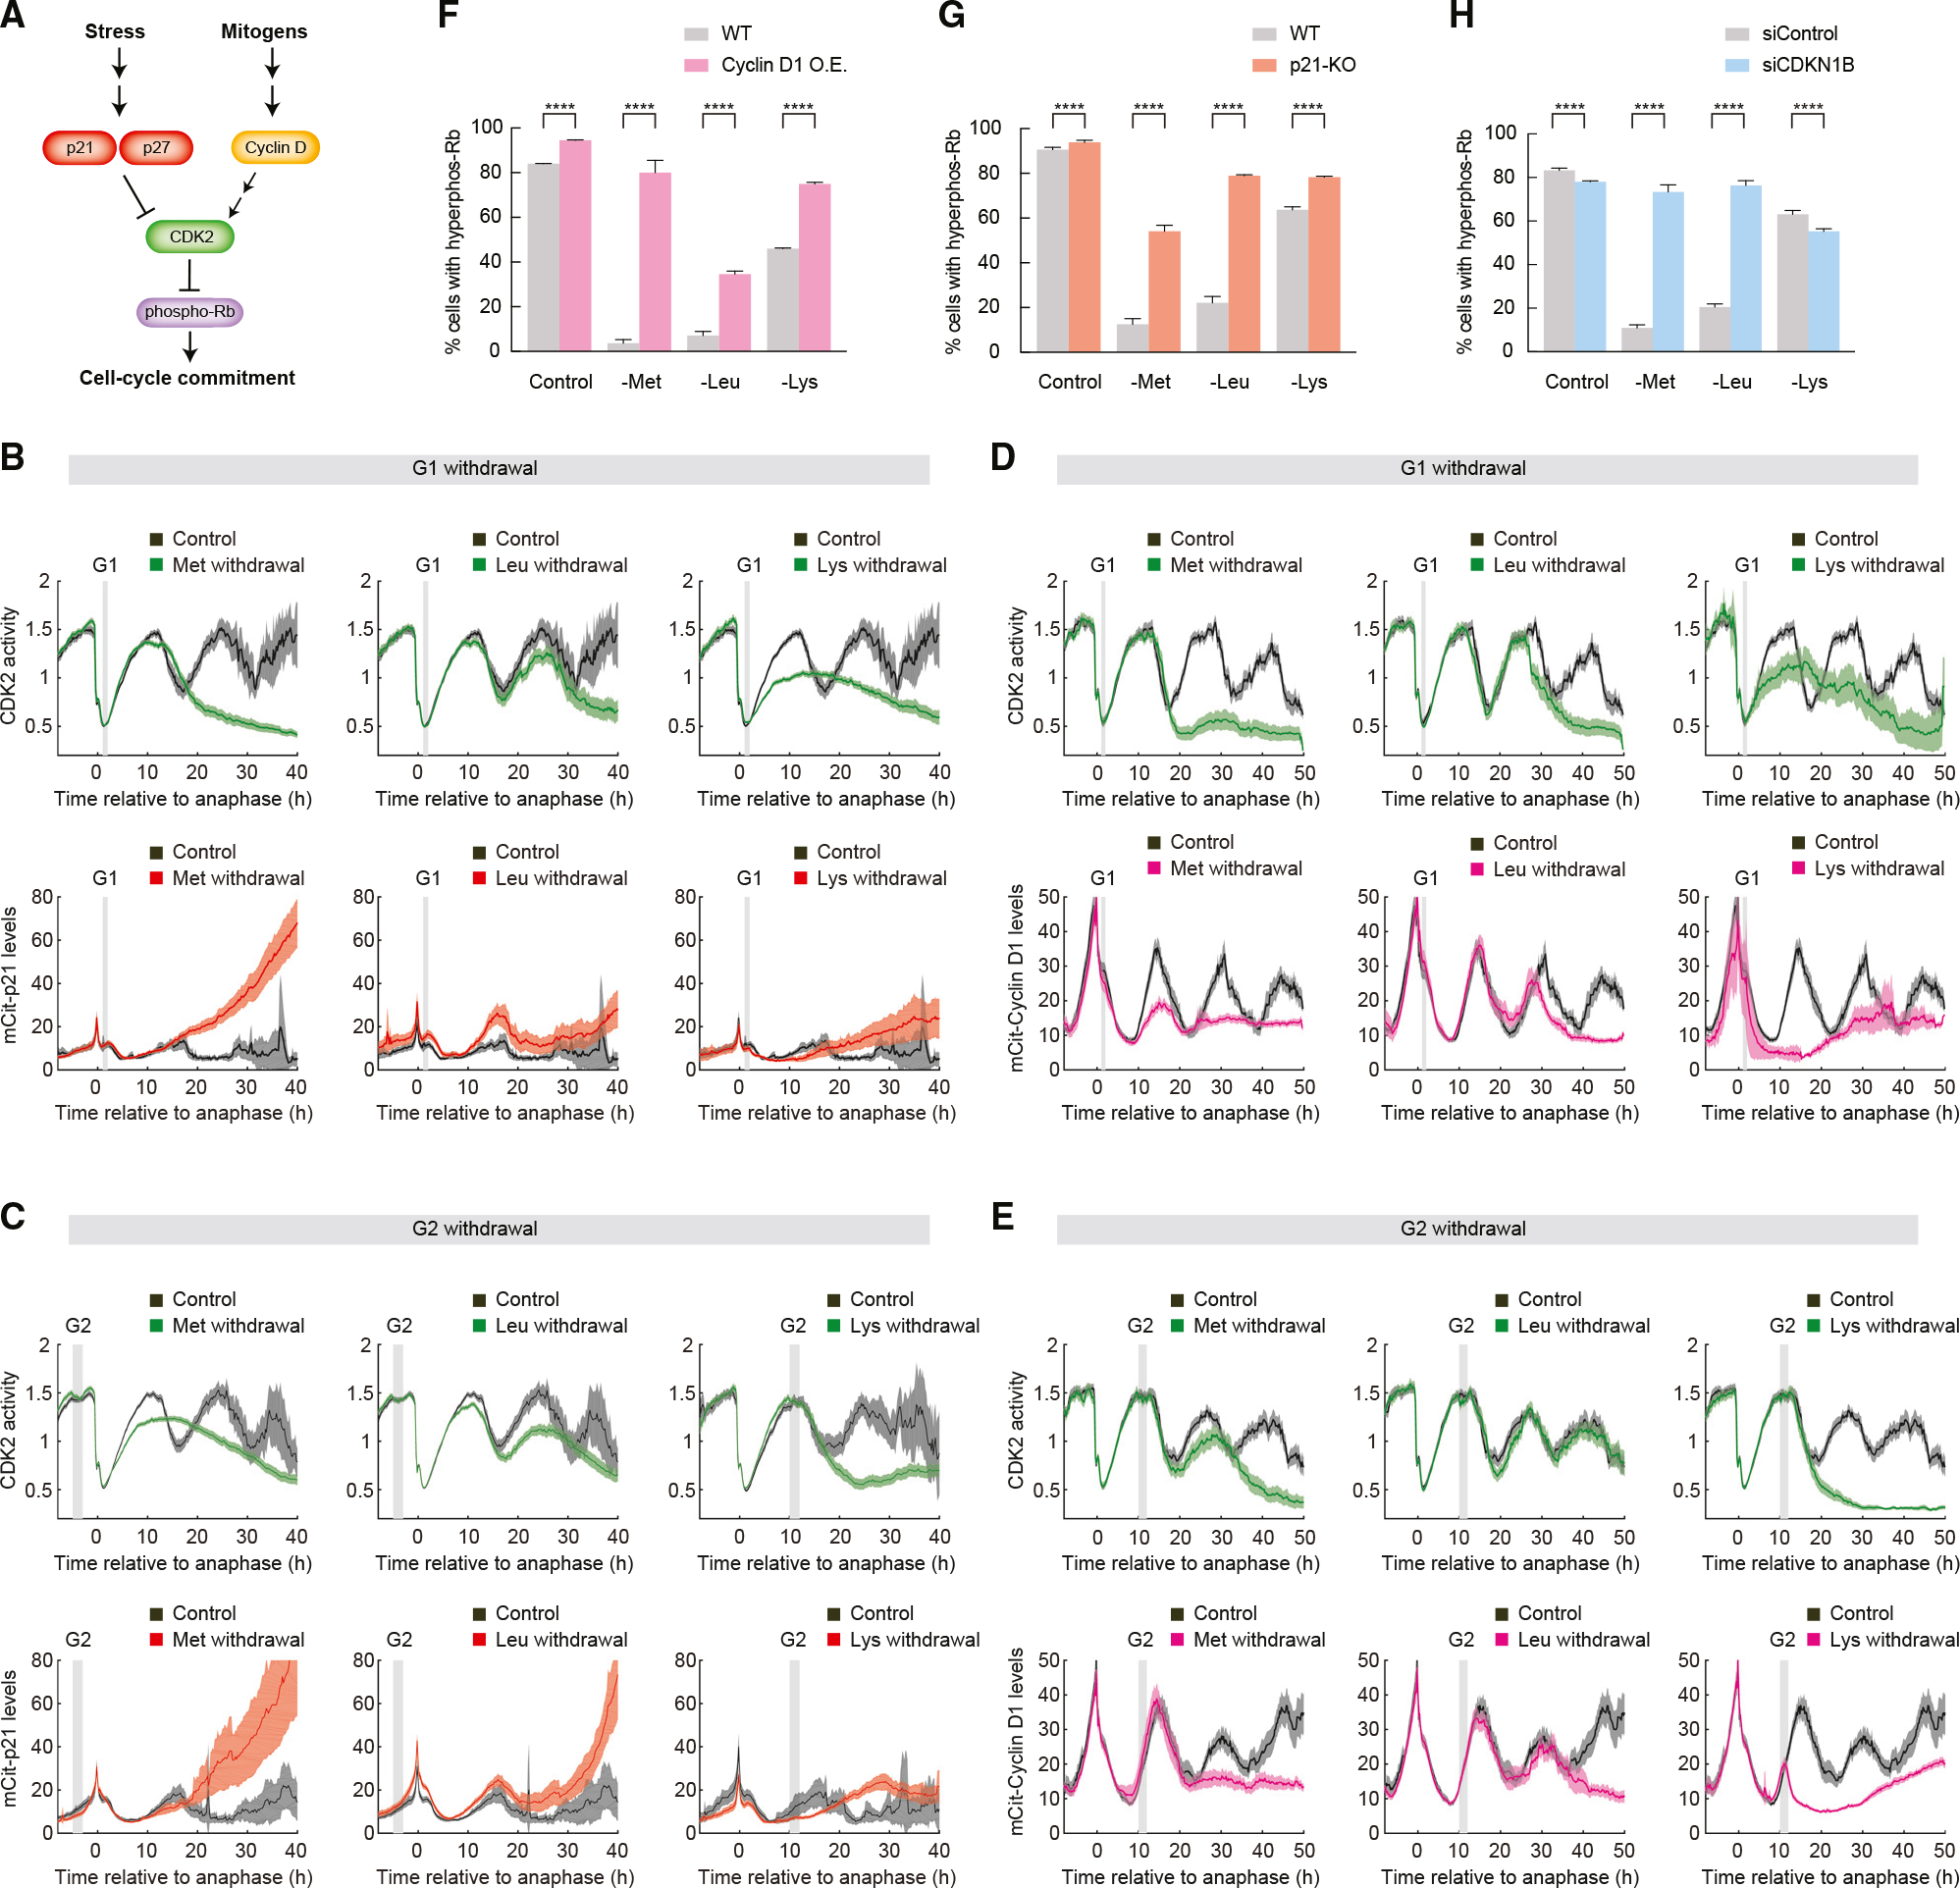
(A) Schematic of key mediators involved in cell-cycle commitment.
(B–E) Population average and 95% confidence interval of CDK2 activity and endogenous p21 (B and C) or endogenous cyclin D1 (D and E) in MCF10A cells grown in regular horse serum. Cells were first imaged in full-growth media for 16 h before the indicated amino acid was acutely withdrawn. In (B) and (D), cells were selected for plotting if they completed anaphase 1–2 h before amino acid withdrawal (a G1-phase withdrawal). In (C) and (E), cells were selected for plotting if they completed anaphase 10–12 h before amino acid withdrawal (a G2-phase withdrawal), marked by the gray bar. All plots contain at least 75 cells per condition.
(F–H) Quantification of percentage of MCF10A cells with hyper-phosphorylated Rb (Ser807/811) in wild-type (WT), cyclin D1 overexpression (F), p21 knockout (G), or p27 small interfering RNA (siRNA) knockdown (H) conditions. Cells were grown in regular horse serum; the indicated amino acid was withdrawn for 48 h. Error bars indicate 95% confidence intervals. Statistical analyses were performed using permutation test: ****p < 0.0001. All plots contain at least 18,000 cells per condition.
When methionine was withdrawn in early G1 phase of the cell cycle, endogenous p21 remained low until mitosis, after which p21 levels rose steeply, causing inhibition of CDK2 activity and entry into quiescence upon completion of mitosis (Figures 4B and 4C). These cell-cycle dynamics are reminiscent of p21 induction causing CDK2 inhibition and cell-cycle arrest in newly born daughter cells that experienced replication stress in the previous cell cycle.22 By contrast, p21 levels rose only modestly upon leucine or lysine withdrawal (Figures 4B and 4C). Using immunofluorescence, we also saw that p27 levels were modestly upregulated upon withdrawal of each of the three amino acids in MCF10A and were more strongly upregulated in RPE-hTERT cells (Figures S4A and S4B). Similar results were seen when the withdrawal was performed in S-phase cells (Figure S4C).
In unperturbed cycling cells, cyclin D1 dynamics display a U-shape wherein cyclin D1 levels fall in G1, are low in S phase, and rise again in G2 phase to set up the subsequent cell cycle.25 When the MAPK pathway is blocked in G1 phase via inhibition of Mek, cyclin D1 levels fail to rise in G2 phase, causing entry into a CDK2low quiescence after mitosis.20 This occurs because without cyclin D1, CDK4/6 cannot initiate phosphorylation of Rb, which is needed to liberate E2F to transcribe cyclin E and drive CDK2 activity. Similar to Mek inhibition, lysine withdrawal in G1 phase completely prevented cyclin D1 levels from rising in G2 phase (Figure 4D). Methionine withdrawal in G1 phase also caused a strong reduction in cyclin D1 levels in G2 phase (Figure 4D). By contrast, withdrawal of leucine in G1 phase did not affect cyclin D1 levels in the first G2 phase and caused only a mild reduction in cyclin D1 in the second G2 phase (Figure 4D). Similar results were seen when the withdrawal was performed in S-phase cells (Figure S4D).
Since the cyclin D1 concentration in a mother cell’s G2 phase determines the fraction of daughter cells born into proliferation or quiescence,20,32 we reanalyzed our data to examine cells that were in G2 phase when each amino acid was withdrawn. When lysine was withdrawn in G2 phase, we saw an immediate and dramatic drop in cyclin D1 levels within 1 h (Figures 4E and S4D). Given that the half-life of cyclin D1 is only 10–30 min35 and that cyclin D1 mRNAs persist at high levels even after 3 h lysine starvation (Figures S4E and S4F), the extreme drop in G2 phase of cyclin D1 levels upon lysine withdrawal is likely due to inhibition of protein synthesis.
To test whether cyclin D1, p21, and p27 are key regulators directly controlling cell-cycle commitment upon amino acid starvation, we made use of existing p21-null cells,36 knocked down p27, or overexpressed cyclin D1, and withdrew methionine, leucine, or lysine. We used a DHFR-mCherry-cyclin D1 construct to overexpress cyclin D1 via the addition of TMP and measured the fraction of cycling cells by immunofluorescence for phospho-Rb. Note that cells experiencing lysine withdrawal have a relatively high fraction of cells with hyper-phosphorylated Rb because lysine withdrawal stalls cells in S phase, where phospho-Rb levels are high. We confirmed this reduced rate of DNA replication under lysine withdrawal by measuring the rate of EdU incorporation during a 15 min pulse (Figure S4G). By contrast, methionine and leucine withdrawal sends cells into quiescence, where Rb becomes hypo-phosphorylated.
Overexpression of cyclin D1 nearly completely (methionine) or partially (leucine and lysine) rescued Rb phosphorylation 48 h after withdrawal (Figures 4F and S5). Loss of p21 or p27 also partially rescued cell proliferation at 48 h after withdrawal (Figures 4G, 4H, and S5). Similar results were obtained for p21 and p27 in RPE-hTERT cells, with the relative contribution of each regulator varying to some extent (Figures S4H and S4I).
Cyclin D1 is the strongest effector for lysine, but this may simply be due to reduced translation, given cyclin D1’s short half-life. Cyclin D1 also has a strong effect on methionine, and the fraction of proliferating cells is strongly rescued by overexpression of cyclin D1. Induction of p21 is the strongest effector for halting the cell cycle upon methionine and leucine starvation but does not seem to be a player in arresting the cell cycle under lysine withdrawal. Thus, cyclin D1, p21, and p27 each contribute to different degrees in regulating the proliferation-quiescence decision upon methionine and leucine starvation. We therefore propose a new model that includes a cell-growth-independent axis to link upstream amino acid signaling to downstream cell proliferation. In this new model, cells use different mechanisms to control cell proliferation depending on which amino acid is withdrawn. Cell-cycle arrest upon lysine withdrawal is mainly caused by inhibition of protein synthesis with a smaller component from restriction point regulators, while cell-cycle arrest upon methionine and leucine starvation is mainly controlled by restriction point regulators (Figure 5).
Figure 5. Classical and updated models describing the control of proliferation vs. quiescence by amino acid signaling.
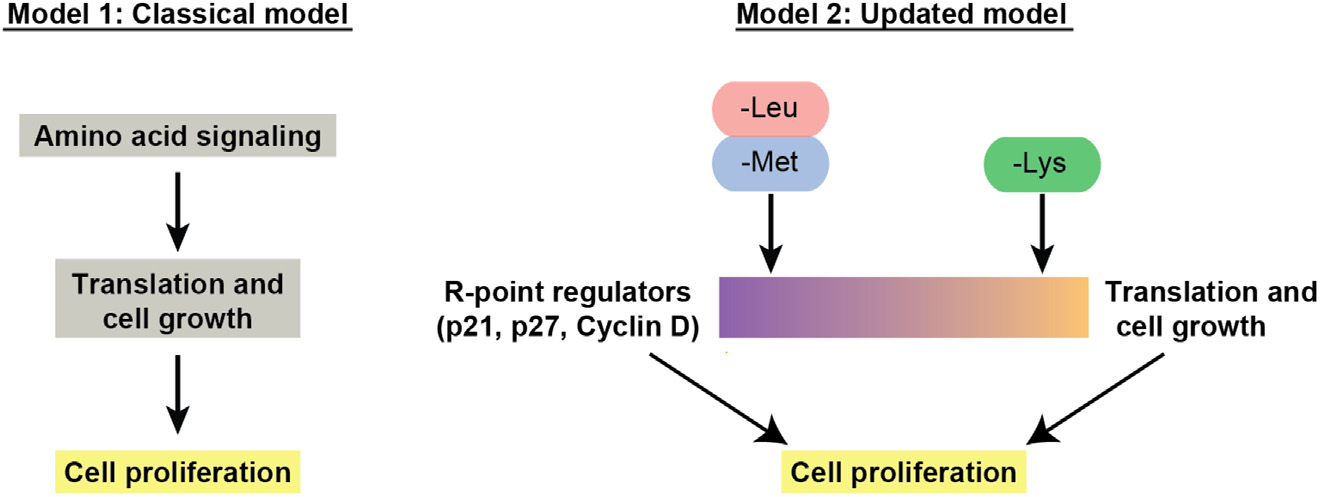
In classical models, mTOR functions as a primary integrator of upstream amino acid signaling to control translation and cell growth, and cells stop cycling due to the secondary effects of insufficient protein synthesis. We propose an updated model that includes a cell-growth-independent mechanism. In this updated model, cells use multiple mechanisms to control cell proliferation upon withdrawal of individual amino acids. Cell-cycle arrest upon methionine and leucine starvation is mainly regulated by restriction point regulators with a smaller component from inhibition of protein synthesis, while cell-cycle arrest upon lysine withdrawal is mainly caused by inhibition of protein synthesis with a smaller component from restriction point regulators.
DISCUSSION
Amino acids are the major nutrients for protein biosynthesis, and limitation of some amino acids inhibits cell growth and cell proliferation. However, how amino acid signaling specifically controls the proliferation-quiescence decision in mammalian cells is poorly understood. Using single-cell tracking of asynchronously cycling cells, we observed that different single amino acid withdrawals displayed distinct cell-cycle arrest phenotypes. Thus, there is not a universal mechanism for cell-cycle arrest following amino acid withdrawal.
We found that entry into quiescence upon methionine starvation is not simply a secondary effect of cessation of protein synthesis. Upon acute methionine starvation, cells can continue cycling for over 10 h to finish their current cell cycle and then enter into a CDK2low quiescent state after mitosis, displaying a classic restriction point phenotype.2 p21 is strongly induced and cyclin D1 is suppressed upon methionine withdrawal, and depletion of p21 or p27 or overexpression of cyclin D1 can temporarily rescue cell proliferation despite methionine withdrawal. Relatedly, we previously reported that overexpression of cyclin D1 can rescue a Mek-inhibition-induced proliferation defect.20
Due to its short half-life, cyclin D1 protein levels function as a readout of global translation rate and thereby regulate proliferation in response to amino acid or mitogen limitation.20 Consistently, lysine withdrawal causes an immediate block of protein synthesis, an immediate and extreme drop in cyclin D1 levels, and rapid cell-cycle stalling. By contrast, methionine withdrawal causes a mild reduction in protein synthesis and a more moderate reduction in cyclin D1 levels and allows for completion of the current cell cycle. Leucine withdrawal minimally affects protein synthesis or cyclin D1 levels within the current cell cycle, and cells are able to complete two additional mitoses before cyclin D1 levels drop and cells enter quiescence.
p21 and p27 are upregulated to varying degrees upon single amino acid withdrawal. Although several stresses can induce p21, the accumulation of p21 by amino acid withdrawal is not caused by the p53-dependent DNA damage response.33 Instead, a major p21 transcript variant in both murine and human cells contains decoy 5′ upstream open reading frames (uORFs), and amino acid withdrawal causes activation of the ISR and translational upregulation of p21.33,37,38 This uORF architecture may be the mechanism driving the upregulation of p21 protein upon methionine and leucine starvation in mammalian cells.
In classical models, mTOR functions as a primary integrator of upstream amino acid signaling to control cell growth through macromolecular biosynthesis, which drives proliferation.4,17 Here, we propose a restriction point signaling axis for cell-cycle progression upon amino acid withdrawal. In this model, methionine and leucine withdrawal funnel strongly through cyclin D1, p21, and p27 to regulate cell-cycle entry by regulating CDK activity. By contrast, cell-cycle arrest under lysine withdrawal is dominated by a reduction in translation. However, even with the strong inhibition of protein synthesis seen with lysine withdrawal, cell-cycle arrest can be partially and temporarily overcome by knocking out p21 or overexpressing cyclin D1.
In summary, our data support a dual model in which the proliferation-quiescence decision under amino acid limitation is controlled both by both restriction point regulators and by protein-synthesis-dependent mechanisms, supporting the notion that mammals evolved multiple mechanisms to regulate cell proliferation and cell growth.17,39 A quantitative, dynamic, and mechanistic understanding of how cells make the proliferation-quiescence decision under amino acid limitation could reveal new approaches for cancer therapy via dietary restriction.
Limitations of the study
The results presented in this study were performed primarily in non-cancerous MCF10A cells, with many experiments repeated in non-cancerous RPE-hTERT cells. While these two cell lines behave similarly, the effects of amino acid withdrawal on cell proliferation could be cell-type dependent. Further work is needed to investigate how normal primary cells and various types of cancer cells respond to acute withdrawal of each of the 20 amino acids. Notably, given that the distinct phenotypes observed in Figures 2B–2E do not correlate with the essential/non-essential/conditionally essential classification of amino acids, the basis for the distinct phenotypes we observed remains to be uncovered. One possible contributing factor is the reservoir of charged tRNAs in a cell since the levels of uncharged tRNAs affect both amino acid sensing and global protein synthesis rates.
STAR★METHODS
RESOURCE AVAILABILITY
Lead contact
Further information and requests for resources and reagents should be directed to and will be fulfilled by the lead contact, Sabrina Spencer (sabrina.spencer@colorado.edu).
Materials availability
Newly generated materials in this study are available from the lead contact upon request.
Data and code availability
Microscopy and all other data reported in this paper will be shared by the lead contact upon request.
The cell-tracking code for the image analysis pipeline is publicly available on GitHub at https://github.com/scappell/Cell_tracking and https://github.com/tianchengzhe/EllipTrack. Additional original code has been deposited at Zenodo and is publicly available as of the date of publication. The DOI is listed in the key resources table.
Any additional information required to reanalyze the data reported in this paper is available from the lead contact upon request.
KEY RESOURCES TABLE.
| REAGENT or RESOURCE | SOURCE | IDENTIFIER |
|---|---|---|
|
| ||
| Antibodies | ||
|
| ||
| Rabbit anti-ATF4 at 1:250 | Cell Signaling Technology | 11815 |
| Rabbit anti-phospho-S6 (Ser240/244) at 1:250 | Cell Signaling Technology | 2215 |
| Rabbit anti-Cyclin D1 (SP4) at 1:500 | Lab Vision | RM-9104-S0 |
| Rabbit anti-p21 at 1:250 | Cell Signaling Technology | 2947 |
| Mouse anti-p27 at 1:250 | BD Biosciences | 610241 |
| Rabbit anti-phospho-Rb (Ser807/811) (D20B12) at 1:500 | Cell Signaling Technology | 8516 |
| Alexa Fluor 546 anti-mouse secondary at 1:500 | Thermo Fisher | A-11030 |
| Alexa Fluor 647 anti-mouse secondary at 1:500 | Thermo Fisher | A-21236 |
| Alexa Flour 546 anti-rabbit secondary at 1:500 | Thermo Fisher | A-11035 |
| Alexa Fluor 647 anti-rabbit secondary at 1:500 | Thermo Fisher | A-21245 |
|
| ||
| Chemicals, Peptides, and Recombinant Proteins | ||
|
| ||
| Hoechst | Biotium | 40046 |
| Mek inhibitor | Selleckchem | PD-0325091 |
| Cycloheximide | Enzo Life Science | ALX-380-269-G001 |
| Chloroquine | Sigma-Aldrich | AAJ6445914 |
| 5-(N-Ethyl-N-isopropyl)-Amiloride | Selleckchem | S9849 |
| Trimethoprim | Thermo Fisher | AAJ6305303 |
| DharmaFECT 1 | Dharmacon | T-2001-02 |
| DMEM/F-12 | Thermo Fisher | 11039047 |
| DMEM/F-12 w/o Amino Acids, L-Glutamine, Glucose, Sodium Pyruvate | USBiological | D9807-11 |
| Horse Serum | Life Tech | 16050–122 |
| Dialyzed Equine Serum | Valley Biomedical | AS3053 |
| EGF | Peprotech | AF-100-15 |
| Hydrocortisone | Sigma-Aldrich | H0888 |
| Insulin | Sigma-Aldrich | I1882 |
| Cholera Toxin | Sigma-Aldrich | C8052 |
| Collagen | Advanced BioMatrix | 5015 |
|
| ||
| Critical commercial assays | ||
|
| ||
| ViewRNA™ ISH Cell Assay Kit | Thermo Fisher | QVC0001 |
| CCND1 FISH probes | Thermo Fisher | VA6-16943 |
|
| ||
| Experimental models: Cell lines | ||
|
| ||
| MCF10A | ATCC | CRL-10317 |
| RPE-hTERT | ATCC | CRL-4000 |
| MCF10A H2B-mTurq DHB-mVenus DHFR-mCherry | This study | N/A |
| MCF10A H2B-mTurq DHB-mVenus DHFR-mCherry-Cyclin D1 | (Yang et al., 2017)32 | N/A |
| mCitrine-CCND1 MCF10A | (Gookin et al., 2017)25 | N/A |
| mCitrine-CDKN1A MCF10A | (Moser et al., 2018)21 | N/A |
| p21-null MCF10A | (Bachman et al., 2004)36 | N/A |
| Oligonucleotides | ||
| siCDKN1A | IDT | hs.Ri.CDKN1A.13.1 hs.Ri.CDKN1A.13.3 |
| siCDKN1B | IDT | hs.Ri.CDKN1B.13.1 hs.Ri.CDKN1B.13.2 |
| siControl | Horizon Discovery | D-001810-02-05 |
|
| ||
| Other | ||
|
| ||
| 96-well glass bottom plate | Cellvis | Cat#P96-1.5H-N |
|
| ||
| Software and algorithms | ||
|
| ||
| MATLAB R2020a | Mathworks | N/A |
| Adobe Illustrator 2022 | Adobe | N/A |
| ImageJ | Fiji | N/A |
| Tracking code for MCF10A cells | (Cappelletal., 2016)40 | https://github.com/scappell/Cell_tracking |
| Tracking code for RPE hTERT cells | (Tian et al., 2020)41 | https://github.com/tianchengzhe/EllipTrack |
| Microscopy image analysis scripts for plotting tracedata mat files | Spencer Lab | https://doi.org/10.5281/zenodo.10052240 |
EXPERIMENTAL MODEL AND STUDY PARTICIPANT DETAILS
Cell culture
MCF10A cells were obtained from ATCC (Cat# CRL-10317, RRID:CVCL_0598) and maintained in Dulbecco’s Modified Eagle Medium/Nutrient Mixture F-12 (DMEM/F12, Gibco) supplemented with 5% (v/v) horse serum (Gibco), 20 ng/mL epidermal growth factor (EGF, Sigma-Aldrich), 0.5 mg/mL hydrocortisone (Sigma-Aldrich, St. Louis, MO), 100 ng/mL cholera toxin (Sigma-Aldrich), 10 μg/mL insulin (Thermo Fisher), and penicillin/streptomycin. RPE-hTERT cells were obtained from ATCC (Cat# CRL-4000, RRID:CVCL_4388) and cultured in DMEM/F12 with 10% (v/v) fetal bovine serum (FBS), 1X Glutamax, and penicillin/streptomycin. All cells were cultured at 37°C with 5% CO2.
Stable cell lines
MCF10A cells with mCitrine knocked into the CCND1 or CDKN1A gene locus were described previously.21,25 These cells also express H2B-mTurquoise for cell tracking and DHB-mCherry as a CDK2 activity sensor. To generate the cells expressing a live-cell reporter to measure protein synthesis rate, the previously described MCF10A cells expressing H2B-mTurquoise and DHB-mVenus were transduced with retrovirus encoding DHFR-mCherry (pCru5-DHFR-mCherry) and sorted by FACS on the fluorescent colors they carry to establish triple-color-positive cell lines.
METHOD DETAILS
Withdrawal of single amino acids
Single amino acid withdrawal media was prepared from DMEM/F-12 powder without amino acids, without L-glutamine, without glucose, and without sodium pyruvate, supplemented according to this recipe: 3.151 g/L additional glucose, 0.5 mM sodium pyruvate, 1x Glutamax, 18.75 mg/L glycine, 31.29 mg/L cysteine·HCl, 17.56 mg/L cysteine·HCl·H2O, 31.48 mg/L histidine·HCl·H2O, 54.47 mg/L isoleucine, 91.25 mg/L lysine·HCl, 17.24 mg/L methionine, 35.48 mg/L phenylalanine, 26.25 mg/L serine, 53.45 mg/L threonine, 9.02 mg/L tryptophan, 55.79 mg/L tyrosine·2Na·2H2O, 147.5 mg/L arginine·HCl, 59.05 mg/L leucine, 4.45 mg/L alanine, 7.5 mg/L asparagine·H2O, 6.65 mg/L aspartic acid, 7.35 mg/L glutamic acid, 17.25 mg/L proline, and 52.85 mg/L valine. Media was prepared in batches of 2 L; the pH was adjusted to 7.2–7.4 with HCl, and medium was vacuum-filtered and supplemented with either 5% regular or dialyzed horse serum for MCF10A and 10% regular FBS for RPE-hTERT.
Inhibitors
Mek inhibitor, PD-0325091 (S1036, Selleckchem) at 100 nM; chloroquine (Sigma-Aldrich, AAJ6445914) at 10 μM; 5-(N-Ethyl-N-isopropyl)-Amiloride (Selleckchem, S9849) at 5 μM; trimethoprim (Thermo Fisher AAJ6305303) at 5 μM; cycloheximide (Enzo Life Science, ALX-380–269-G001) at 50 μg/mL in Figure 3E for complete translation inhibition and at 5 μg/mL in Figure 2F to reduce translation rate.
Immunofluorescence
Cells were fixed with 4% paraformaldehyde for 10 min, washed 3 times with PBS, then permeabilized in 0.1% Triton X-100 for 10 min at room temperature. Standard protocols were then used for immunofluorescent staining: cells were first blocked in 3% BSA for 1 h at 37°C, primary antibodies were incubated in 3% BSA overnight at 4°C, cells were washed three times in PBS, secondary antibodies were then incubated at room temperature for 1 h, cells were washed three times in PBS before being incubated with Hoechst at 1:10,000 at room temperature for 10 min. Imaging was done on a Nikon Ti-E with a 10× 0.45 NA objective with the appropriate filter applied.
RNA FISH staining
Cells were fixed with 4% paraformaldehyde for 15 min at room temperature. CCND1 RNA FISH (Thermo Fisher, VA6–16943) was carried out using the ViewRNA ISH Cell Assay kit (Thermo Fisher QVC0001) following the manufacturer’s protocol. Cell were permeabilized for 30 min and mRNA probes were hybridized for 4 h at 40°C. Exposure times were set to 600 ms for Cy5.
siRNA transfection
siRNA oligos were synthesized either by IDT: CDKN1A (hs.Ri.CDKN1A.13.1, hs.Ri.CDKN1A.13.3), CDKN1B (hs.Ri.CDKN1B.13.1, hs.Ri.CDKN1B.13.2), or by Horizon Discovery: Negative Control siRNA (D-001810–02-05). siRNA transfections were performed using the DharmaFECT 1 (Dharmacon, #T-2001–02) reagent as described by the manufacturer. For IF, the transfection mix was added to cells with 25 nM final concentration for siCDKN1A, siCDKN1B and siControl and removed after 6 h. Cells were then cultured in full-growth media for another 10 h at which time single amino acids were withdrawn. Cells were then fixed 48hr later for immunofluorescence.
Intracellular amino acid quantitation
MCF10A and RPE-hTERT cells were seeded at 500,000 cells per well in six-well plates overnight in complete media. The following day media was replaced with fresh rich media 2 h before amino acid withdrawal. Cells were washed twice with PBS and replaced with acute amino acid withdrawal media. After 0.25, 1, 3, 6, 12, 24, and 48 h, cells were rinsed twice with ice-cold saline and extracted using ice-cold 80% methanol in water with 4 μg/mL norvaline (Sigma-Aldrich N7627) per sample. The soluble supernatant after spinning extracts at 21000 ×g for 10 min at 4°C was transfered to a fresh tube and dried under nitrogen gas. Polar metabolites were derivatized to form methoxime-tBDMS derivatives by incubation with 24 μL 2% methoxylamine hydrochloride in pyridine (or MOX reagent; ThermoFisher TS–45950) and heating at 37°C for 1 h, followed by addition of 30 μL N–methyl–N–(tert–butyldimethylsilyl) trifluoroacetamide +1% tert–Butyldimethylchlorosilane (Sigma-Aldrich 375934) and heating at 80°C for 2 h. Derivatized samples were analyzed by GC-MS using a DB-35MS column (30 m × 0.25 mm i.d. × 0.25 μm, Agilent J&W Scientific) installed in an Agilent 7890B gas chromatograph linked to an Agilent 5977B mass spectrometer. Metabolite ion counts were determined by integrating characteristic GCMS ion fragments for each amino acid derivative (NIST Chemistry WebBook) using the El Maven software v11.0 (Eluci-data), corrected for natural isotope abundance using the R package IsoCorrectoR,42 and normalized to 1) the mean-normalized internal norvaline standard ion count and 2) a cell count collected from an identical 6-well plate processed in parallel.
Live-cell imaging
Cells were plated on a 96-well plate (Cellvis P96–1.5H-N) coated with collagen (Advanced BioMatrix, #5015) at least 16 h prior to the start of imaging and at a density such that cells were sub-confluent throughout the imaging period. Cells were imaged on a Nikon Inverted Microscope Eclipse Ti-E PFS (Nikon) with a Spectra X light engine (Lumencor), a 10× 0.45 NA objective and appropriate filter sets. Images were taken by a Zyla 5.5 sCMOS camera (Andor) or an ORCA-Flash 4.0 CMOS camera (Hamamatsu) at a frequency of one frame per 12 min. During the imaging, cells were kept in a humidified, 37°C chamber with 5% CO2. Light exposure time for each image was: 30 ms for CFP, 300 ms for YFP in mCitrine-Cyclin D1 or mCitrine-p21, 70–100 ms for YFP in DHB-mVenus, 70–100 ms for DHB-mCherry, 300ms for DHFR-mCherry, 600 ms for mIFP. Two or four sites were imaged per well with their positions spaced apart so that the exposure area for each site did not overlap with other sites. For experiments involving drugs, cells were first imaged in full-growth media for 16–20 h; the movie was then paused and drugs were added by exchanging 50% of the media in each well with media containing a 2X drug concentration. For experiments involving amino acid withdrawal, cells were washed three times with media without any amino acids and then the amino acid withdrawal media was applied.
QUANTIFICATION AND STATISTICAL ANALYSIS
Image processing and single-cell tracking
Segmentation and tracking of MCF10A cells were performed using a published pipeline40 (code available at https://github.com/scappell/Cell_tracking). The RPE-hTERT cells were tracked using EllipTrack,41 a global cell-tracking method for hard-to-track cells (code available at https://github.com/tianchengzhe/EllipTrack).
Segmented cell nuclei were tracked by screening the nearest future neighbor. The background of each image was subtracted using top-hat filtering after illumination bias correction for the indicated channel. Mean nuclear intensities were measured by averaging the background-subtracted pixel intensities in each nucleus as defined by a segmented nuclear mask. CDK2 activity was calculated as the ratio of cytoplasmic to nuclear median sensor fluorescence, with the cytoplasmic component measured in a 4-pixel wide cytoplasmic ring outside of the nuclear mask.
In live-cell experiments, each daughter cell was classified as CDK2inc if the CDK2 activity was above y = 0.5 at 3 h (MCF10A) or 5hr (RPE-hTERT) after anaphase, otherwise the cell was classified as CDK2low. Only cells that were actively proliferating (CDK2inc) at the time of perturbation were selected for plotting. Traces that end within 3 h after anaphase were not classified.
Statistics
All data presented in all figures are from three biological replicates, except for Figure S3, which had two biological replicates. For bar graphs used in the paper, all data are plotted as means ±95% confidence intervals. For violin plots used in the paper, thick lines represent the median values, and thin bars above and below each median represent the interquartile ranges of the distribution. The full distributions are displayed by the full range of the violin shape, with the width along the violin corresponding with the value frequency. Statistical tests were performed using a permutation test (1,000 permutations performed per test) or a t test in MATLAB. The permutation test MATLAB function was accessed via MathWorks File Exchange (retrieved Feburary 17, 2023; https://github.com/lrkrol/permutationTest). Significance levels are reported as p values <0.05 (*), 0.01 (**), 0.001 (***) and 0.0001 (****) with corresponding star notations. Throughout, ‘n.s.’ denotes no statistical significance (p > 0.05).
Supplementary Material
Highlights.
Withdrawal of different amino acids leads to different cell-cycle arrest phenotypes
Cells rapidly sense the drop of intracellular amino acid levels upon withdrawal
Methionine withdrawal triggers a restriction point phenotype
Lysine withdrawal triggers rapid cell-cycle arrest due to lack of protein synthesis
ACKNOWLEDGMENTS
We thank H. Yang for the MCF10A DHFR-mCherry-cyclin D1 cell line. We thank all members of the laboratory of S.L.S. for general help and feedback on the manuscript. We thank Theresa Nahreini for her expertise and assistance with cell sorting. We thank BioFrontiers Computing Core for computing support. This work was supported by NIH Training Grant T32 GM 8759-16 (to Y.R.); R35CA242379 (to M.G.V.H.); P30CA014051 (to M.G.V.H.); the Ludwig Center at MIT, the Lustgarten Foundation, and the MIT Center for Precision Cancer Medicine (to M.G.V.H.); an American Cancer Society Research Scholar Grant (RSG-18-008-01) (to S.L.S.); and an NIH Director’s New Innovator Award (DP2-CA238330-01) (to S.L.S.).
Footnotes
DECLARATION OF INTERESTS
M.G.V.H. discloses that he is a scientific advisor for Agios Pharmaceuticals, iTeos Therapeutics, Sage Therapeutics, Auron Therapeutics, and Droia Ventures.
SUPPLEMENTAL INFORMATION
Supplemental information can be found online at https://doi.org/10.1016/j.celrep.2023.113539.
REFERENCES
- 1.Matthews HK, Bertoli C, and de Bruin RAM (2022). Cell cycle control in cancer. Nat. Rev. Mol. Cell Biol. 23, 74–88. [DOI] [PubMed] [Google Scholar]
- 2.Spencer SL, Cappell SD, Tsai FC, Overton KW, Wang CL, and Meyer T (2013). The proliferation-quiescence decision is controlled by a bifurcation in CDK2 activity at mitotic exit. Cell 155, 369–383. [DOI] [PMC free article] [PubMed] [Google Scholar]
- 3.Weinberg RA (1995). The retinoblastoma protein and cell cycle control. Cell 81, 323–330. [DOI] [PubMed] [Google Scholar]
- 4.Fingar DC, Richardson CJ, Tee AR, Cheatham L, Tsou C, and Blenis J (2004). mTOR controls cell cycle progression through its cell growth effectors S6K1 and 4E-BP1/eukaryotic translation initiation factor 4E. Mol. Cell Biol. 24, 200–216. [DOI] [PMC free article] [PubMed] [Google Scholar]
- 5.Heitman J, Movva NR, Hiestand PC, and Hall MN (1991). FK 506-binding protein proline rotamase is a target for the immunosuppressive agent FK 506 in Saccharomyces cerevisiae. Proc. Natl. Acad. Sci. USA 88, 1948–1952. [DOI] [PMC free article] [PubMed] [Google Scholar]
- 6.Sabatini DM (2017). Twenty-five years of mTOR: Uncovering the link from nutrients to growth. Proc. Natl. Acad. Sci. USA 114, 11818–11825. [DOI] [PMC free article] [PubMed] [Google Scholar]
- 7.Sabatini DM, Erdjument-Bromage H, Lui M, Tempst P, and Snyder SH (1994). RAFT1: a mammalian protein that binds to FKBP12 in a rapamycin-dependent fashion and is homologous to yeast TORs. Cell 78, 35–43. [DOI] [PubMed] [Google Scholar]
- 8.Ye J, Kumanova M, Hart LS, Sloane K, Zhang H, De Panis DN, Bobrovnikova-Marjon E, Diehl JA, Ron D, and Koumenis C (2010). The GCN2-ATF4 pathway is critical for tumour cell survival and proliferation in response to nutrient deprivation. EMBO J. 29, 2082–2096. [DOI] [PMC free article] [PubMed] [Google Scholar]
- 9.Fingar DC, Salama S, Tsou C, Harlow E, and Blenis J (2002). Mammalian cell size is controlled by mTOR and its downstream targets S6K1 and 4EBP1/eIF4E. Genes Dev. 16, 1472–1487. [DOI] [PMC free article] [PubMed] [Google Scholar]
- 10.Nojima H, Tokunaga C, Eguchi S, Oshiro N, Hidayat S, Yoshino K.i., Hara K, Tanaka N, Avruch J, and Yonezawa K (2003). The mammalian target of rapamycin (mTOR) partner, raptor, binds the mTOR substrates p70 S6 kinase and 4E-BP1 through their TOR signaling (TOS) motif. J. Biol. Chem. 278, 15461–15464. [DOI] [PubMed] [Google Scholar]
- 11.Qiu H, Dong J, Hu C, Francklyn CS, and Hinnebusch AG (2001). The tRNA-binding moiety in GCN2 contains a dimerization domain that interacts with the kinase domain and is required for tRNA binding and kinase activation. EMBO J. 20, 1425–1438. [DOI] [PMC free article] [PubMed] [Google Scholar]
- 12.Dong J, Qiu H, Garcia-Barrio M, Anderson J, and Hinnebusch AG (2000). Uncharged tRNA activates GCN2 by displacing the protein kinase moiety from a bipartite tRNA-binding domain. Mol. Cell. 6, 269–279. [DOI] [PubMed] [Google Scholar]
- 13.Harding HP, Zhang Y, Zeng H, Novoa I, Lu PD, Calfon M, Sadri N, Yun C, Popko B, Paules R, et al. (2003). An integrated stress response regulates amino acid metabolism and resistance to oxidative stress. Mol. Cell. 11, 619–633. [DOI] [PubMed] [Google Scholar]
- 14.Palam LR, Baird TD, and Wek RC (2011). Phosphorylation of eIF2 facilitates ribosomal bypass of an inhibitory upstream ORF to enhance CHOP translation. J. Biol. Chem. 286, 10939–10949. [DOI] [PMC free article] [PubMed] [Google Scholar]
- 15.Wek RC (2018). Role of eIF2alpha Kinases in Translational Control and Adaptation to Cellular Stress. Cold Spring Harbor Perspect. Biol. 10, a032870. [DOI] [PMC free article] [PubMed] [Google Scholar]
- 16.Xie S, Swaffer M, and Skotheim JM (2022). Eukaryotic Cell Size Control and Its Relation to Biosynthesis and Senescence. Annu. Rev. Cell Dev. Biol. 38, 291–319. [DOI] [PubMed] [Google Scholar]
- 17.Dowling RJO, Topisirovic I, Alain T, Bidinosti M, Fonseca BD, Petroulakis E, Wang X, Larsson O, Selvaraj A, Liu Y, et al. (2010). mTORC1-mediated cell proliferation, but not cell growth, controlled by the 4E-BPs. Science 328, 1172–1176. [DOI] [PMC free article] [PubMed] [Google Scholar]
- 18.Foster DA, Yellen P, Xu L, and Saqcena M (2010). Regulation of G1 Cell Cycle Progression: Distinguishing the Restriction Point from a Nutrient-Sensing Cell Growth Checkpoint(s). Genes Cancer 1, 1124–1131. [DOI] [PMC free article] [PubMed] [Google Scholar]
- 19.Pardee AB (1974). A restriction point for control of normal animal cell proliferation. Proc. Natl. Acad. Sci. USA 71, 1286–1290. [DOI] [PMC free article] [PubMed] [Google Scholar]
- 20.Min M, Rong Y, Tian C, and Spencer SL (2020). Temporal integration of mitogen history in mother cells controls proliferation of daughter cells. Science 368, 1261–1265. [DOI] [PMC free article] [PubMed] [Google Scholar]
- 21.Moser J, Miller I, Carter D, and Spencer SL (2018). Control of the Restriction Point by Rb and p21. Proc. Natl. Acad. Sci. USA 115, E8219–E8227. [DOI] [PMC free article] [PubMed] [Google Scholar]
- 22.Arora M, Moser J, Phadke H, Basha AA, and Spencer SL (2017). Endogenous Replication Stress in Mother Cells Leads to Quiescence of Daughter Cells. Cell Rep. 19, 1351–1364. [DOI] [PMC free article] [PubMed] [Google Scholar]
- 23.Barr AR, Cooper S, Heldt FS, Butera F, Stoy H, Mansfeld J, Novák B, and Bakal C (2017). DNA damage during S-phase mediates the proliferation-quiescence decision in the subsequent G1 via p21 expression. Nat. Commun. 8, 14728. [DOI] [PMC free article] [PubMed] [Google Scholar]
- 24.Fan Y, and Meyer T (2021). Molecular control of cell density-mediated exit to quiescence. Cell Rep. 36, 109436. [DOI] [PMC free article] [PubMed] [Google Scholar]
- 25.Gookin S, Min M, Phadke H, Chung M, Moser J, Miller I, Carter D, and Spencer SL (2017). A map of protein dynamics during cell-cycle progression and cell-cycle exit. PLoS Biol. 15, e2003268. [DOI] [PMC free article] [PubMed] [Google Scholar]
- 26.Ishii K, Washio T, Uechi T, Yoshihama M, Kenmochi N, and Tomita M (2006). Characteristics and clustering of human ribosomal protein genes. BMC Genom. 7, 37. [DOI] [PMC free article] [PubMed] [Google Scholar]
- 27.Salloum G, Bresnick AR, and Backer JM (2023). Macropinocytosis: mechanisms and regulation. Biochem. J. 480, 335–362. [DOI] [PubMed] [Google Scholar]
- 28.Florey O, and Overholtzer M (2019). Macropinocytosis and autophagy crosstalk in nutrient scavenging. Philos. Trans. R. Soc. Lond. B Biol. Sci. 374, 20180154. [DOI] [PMC free article] [PubMed] [Google Scholar]
- 29.Han K, Jaimovich A, Dey G, Ruggero D, Meyuhas O, Sonenberg N, and Meyer T (2014). Parallel measurement of dynamic changes in translation rates in single cells. Nat. Methods 11, 86–93. [DOI] [PMC free article] [PubMed] [Google Scholar]
- 30.Iwamoto M, Björklund T, Lundberg C, Kirik D, and Wandless TJ (2010). A general chemical method to regulate protein stability in the mammalian central nervous system. Chem. Biol. 17, 981–988. [DOI] [PMC free article] [PubMed] [Google Scholar]
- 31.Chen JY, Lin JR, Tsai FC, and Meyer T (2013). Dosage of Dyrk1a shifts cells within a p21-cyclin D1 signaling map to control the decision to enter the cell cycle. Mol. Cell. 52, 87–100. [DOI] [PMC free article] [PubMed] [Google Scholar]
- 32.Yang HW, Chung M, Kudo T, and Meyer T (2017). Competing memories of mitogen and p53 signalling control cell-cycle entry. Nature 549, 404–408. [DOI] [PMC free article] [PubMed] [Google Scholar]
- 33.Lehman SL, Cerniglia GJ, Johannes GJ, Ye J, Ryeom S, and Koumenis C (2015). Translational Upregulation of an Individual p21Cip1 Transcript Variant by GCN2 Regulates Cell Proliferation and Survival under Nutrient Stress. PLoS Genet. 11, e1005212. [DOI] [PMC free article] [PubMed] [Google Scholar]
- 34.Leung-Pineda V, Pan Y, Chen H, and Kilberg MS (2004). Induction of p21 and p27 expression by amino acid deprivation of HepG2 human hepatoma cells involves mRNA stabilization. Biochem. J. 379, 79–88. [DOI] [PMC free article] [PubMed] [Google Scholar]
- 35.Diehl JA, Zindy F, and Sherr CJ (1997). Inhibition of cyclin D1 phosphorylation on threonine-286 prevents its rapid degradation via the ubiquitin-proteasome pathway. Genes Dev 11, 957–972. [DOI] [PubMed] [Google Scholar]
- 36.Bachman KE, Blair BG, Brenner K, Bardelli A, Arena S, Zhou S, Hicks J, De Marzo AM, Argani P, and Park BH (2004). p21(WAF1/CIP1) mediates the growth response to TGF-beta in human epithelial cells. Cancer Biol. Ther. 3, 221–225. [DOI] [PubMed] [Google Scholar]
- 37.Gartel AL, Radhakrishnan SK, Serfas MS, Kwon YH, and Tyner AL (2004). A novel p21WAF1/CIP1 transcript is highly dependent on p53 for its basal expression in mouse tissues. Oncogene 23, 8154–8157. [DOI] [PubMed] [Google Scholar]
- 38.Radhakrishnan SK, Gierut J, and Gartel AL (2006). Multiple alternate p21 transcripts are regulated by p53 in human cells. Oncogene 25, 1812–1815. [DOI] [PubMed] [Google Scholar]
- 39.Darnell AM, Subramaniam AR, and O’Shea EK (2018). Translational Control through Differential Ribosome Pausing during Amino Acid Limitation in Mammalian Cells. Mol. Cell. 71, 229–243.e11. [DOI] [PMC free article] [PubMed] [Google Scholar]
- 40.Cappell SD, Chung M, Jaimovich A, Spencer SL, and Meyer T (2016). Irreversible APC(Cdh1) Inactivation Underlies the Point of No Return for Cell-Cycle Entry. Cell 166, 167–180. [DOI] [PMC free article] [PubMed] [Google Scholar]
- 41.Tian C, Yang C, and Spencer SL (2020). EllipTrack: A Global-Local Cell-Tracking Pipeline for 2D Fluorescence Time-Lapse Microscopy. Cell Rep. 32, 107984. [DOI] [PubMed] [Google Scholar]
- 42.Heinrich P, Kohler C, Ellmann L, Kuerner P, Spang R, Oefner PJ, and Dettmer K (2018). Correcting for natural isotope abundance and tracer impurity in MS-MS/MS- and high-resolution-multiple-tracer-data from stable isotope labeling experiments with IsoCorrectoR. Sci. Rep. 8, 17910. [DOI] [PMC free article] [PubMed] [Google Scholar]
Associated Data
This section collects any data citations, data availability statements, or supplementary materials included in this article.
Supplementary Materials
Data Availability Statement
Microscopy and all other data reported in this paper will be shared by the lead contact upon request.
The cell-tracking code for the image analysis pipeline is publicly available on GitHub at https://github.com/scappell/Cell_tracking and https://github.com/tianchengzhe/EllipTrack. Additional original code has been deposited at Zenodo and is publicly available as of the date of publication. The DOI is listed in the key resources table.
Any additional information required to reanalyze the data reported in this paper is available from the lead contact upon request.
KEY RESOURCES TABLE.
| REAGENT or RESOURCE | SOURCE | IDENTIFIER |
|---|---|---|
|
| ||
| Antibodies | ||
|
| ||
| Rabbit anti-ATF4 at 1:250 | Cell Signaling Technology | 11815 |
| Rabbit anti-phospho-S6 (Ser240/244) at 1:250 | Cell Signaling Technology | 2215 |
| Rabbit anti-Cyclin D1 (SP4) at 1:500 | Lab Vision | RM-9104-S0 |
| Rabbit anti-p21 at 1:250 | Cell Signaling Technology | 2947 |
| Mouse anti-p27 at 1:250 | BD Biosciences | 610241 |
| Rabbit anti-phospho-Rb (Ser807/811) (D20B12) at 1:500 | Cell Signaling Technology | 8516 |
| Alexa Fluor 546 anti-mouse secondary at 1:500 | Thermo Fisher | A-11030 |
| Alexa Fluor 647 anti-mouse secondary at 1:500 | Thermo Fisher | A-21236 |
| Alexa Flour 546 anti-rabbit secondary at 1:500 | Thermo Fisher | A-11035 |
| Alexa Fluor 647 anti-rabbit secondary at 1:500 | Thermo Fisher | A-21245 |
|
| ||
| Chemicals, Peptides, and Recombinant Proteins | ||
|
| ||
| Hoechst | Biotium | 40046 |
| Mek inhibitor | Selleckchem | PD-0325091 |
| Cycloheximide | Enzo Life Science | ALX-380-269-G001 |
| Chloroquine | Sigma-Aldrich | AAJ6445914 |
| 5-(N-Ethyl-N-isopropyl)-Amiloride | Selleckchem | S9849 |
| Trimethoprim | Thermo Fisher | AAJ6305303 |
| DharmaFECT 1 | Dharmacon | T-2001-02 |
| DMEM/F-12 | Thermo Fisher | 11039047 |
| DMEM/F-12 w/o Amino Acids, L-Glutamine, Glucose, Sodium Pyruvate | USBiological | D9807-11 |
| Horse Serum | Life Tech | 16050–122 |
| Dialyzed Equine Serum | Valley Biomedical | AS3053 |
| EGF | Peprotech | AF-100-15 |
| Hydrocortisone | Sigma-Aldrich | H0888 |
| Insulin | Sigma-Aldrich | I1882 |
| Cholera Toxin | Sigma-Aldrich | C8052 |
| Collagen | Advanced BioMatrix | 5015 |
|
| ||
| Critical commercial assays | ||
|
| ||
| ViewRNA™ ISH Cell Assay Kit | Thermo Fisher | QVC0001 |
| CCND1 FISH probes | Thermo Fisher | VA6-16943 |
|
| ||
| Experimental models: Cell lines | ||
|
| ||
| MCF10A | ATCC | CRL-10317 |
| RPE-hTERT | ATCC | CRL-4000 |
| MCF10A H2B-mTurq DHB-mVenus DHFR-mCherry | This study | N/A |
| MCF10A H2B-mTurq DHB-mVenus DHFR-mCherry-Cyclin D1 | (Yang et al., 2017)32 | N/A |
| mCitrine-CCND1 MCF10A | (Gookin et al., 2017)25 | N/A |
| mCitrine-CDKN1A MCF10A | (Moser et al., 2018)21 | N/A |
| p21-null MCF10A | (Bachman et al., 2004)36 | N/A |
| Oligonucleotides | ||
| siCDKN1A | IDT | hs.Ri.CDKN1A.13.1 hs.Ri.CDKN1A.13.3 |
| siCDKN1B | IDT | hs.Ri.CDKN1B.13.1 hs.Ri.CDKN1B.13.2 |
| siControl | Horizon Discovery | D-001810-02-05 |
|
| ||
| Other | ||
|
| ||
| 96-well glass bottom plate | Cellvis | Cat#P96-1.5H-N |
|
| ||
| Software and algorithms | ||
|
| ||
| MATLAB R2020a | Mathworks | N/A |
| Adobe Illustrator 2022 | Adobe | N/A |
| ImageJ | Fiji | N/A |
| Tracking code for MCF10A cells | (Cappelletal., 2016)40 | https://github.com/scappell/Cell_tracking |
| Tracking code for RPE hTERT cells | (Tian et al., 2020)41 | https://github.com/tianchengzhe/EllipTrack |
| Microscopy image analysis scripts for plotting tracedata mat files | Spencer Lab | https://doi.org/10.5281/zenodo.10052240 |