

Abstract
Traditionally, the left frontal and parietal lobes have been associated with language production while regions in the temporal lobe are seen as crucial for language comprehension. However, recent evidence suggests that the classical language areas constitute an integrated network where each area plays a crucial role both in speech production and perception. We used functional MRI to examine whether observing speech motor movements (without auditory speech) relative to non-speech motor movements preferentially activates the cortical speech areas. Furthermore, we tested whether the activation in these regions was modulated by task difficulty. This dissociates between areas that are actively involved with speech perception from regions that show an obligatory activation in response to speech movements (e.g. areas that automatically activate in preparation for a motoric response). Specifically, we hypothesized that regions involved with decoding oral speech would show increasing activation with increasing difficulty. We found that speech movements preferentially activate the frontal and temporal language areas. In contrast, non-speech movements preferentially activate the parietal region. Degraded speech stimuli increased both frontal and parietal lobe activity but did not differentially excite the temporal region. These findings suggest that the frontal language area plays a role in visual speech perception and highlight the differential roles of the classical speech and language areas in processing others’ motor speech movements.
Keywords: mirror neurons, motor speech, speech perception, Broca’s area
Although Broca’s area has been classically associated with motor speech production, recent evidence suggests that it is also involved in speech perception. For example, a handful of functional MRI (fMRI) studies have implicated Broca’s area in lip reading (Hall et al., 2005; Campbell et al., 2001; Calvert, et al., 2000) as well as passive listening and watching of others speech motor movements (Skipper et al., 2005). Crucially, the studies by Hall et al. and Campbell et al. found that Broca’s area was modulated during lip reading but not when subjects watched non-speech oral movements (gurning). These findings suggest that cognitive processing of motor speech movements is special and distinguishable from non-speech motor movements even when auditory input is not present.
Although fMRI can reveal areas involved in a given cognitive task, it cannot adjudicate which areas are essential for successful completion of that task. In contrast, data from brain damaged patients can determine that task success depends on the preservation of particular cortical areas (Rorden & Karnath, 2004). One way to investigate the importance of Broca’s area for the visual perception of speech motor movements would be to compare the performance of patients with strokes that either include or spare Broca’s area. Along with the left insula, Broca’s area has been identified as the critical lesion location that causes apraxia of speech (AOS; Bates et al., 2003; Bonilha et al., 2006; Dronkers, 1996; Hillis et al., 2004; Ogar et al., 2006). Thus, patients with AOS would be expected to show impaired perception of motor speech movements but not oral motor movements void of communicative intent. Schmid and Ziegler (2006) examined this issue directly and found that non-fluent aphasic patients (of whom eight also had AOS) did not have greater difficulty matching ‘speech-speech’ motor movements compared to ‘nonspeech-nonspeech’ motor movements. Furthermore, there was a strong correlation between the patients’ performance on both tasks and their AOS severity score. Unfortunately this study did not include lesion data, but it can be tentatively inferred that most patients had Broca’s area involvement based on their non-fluent speech output. It could be deduced, albeit indirectly, that frontal lesions including Broca’s area may impair the visual perception of speech and non-speech motor movements. Such a conclusion would contradict the fMRI results by Hall et al (2005) and Campbell et al (2001) who did not report Broca’s area activation associated with observing non-speech motor movements. Therefore, the role of the frontal cortex in visual speech perception remains controversial. It is possible that the speech-specific brain activations observed using fMRI reflect an automatic preparation for motoric response or strong white matter connections between the posterior and anterior cortical speech areas rather than a direct role in perception.
One way to resolve this issue would be to vary the difficulty of the perceptual task and examine the potential changes in activity in a given region of interest (ROI). If Broca’s area is directly involved with speech perception then one would expect that the amount of brain activity would correspond with task difficulty. On the other hand, if the role of Broca’s area in speech processing is purely production-specific one would not expect a task-related change in activity. One possible confound is that increasing task difficulty will lead to relatively global changes in blood flow (which is what fMRI is indirectly measuring), even in regions not specifically involved with the task. Such an increase would be seen in the case of both speech and non-speech stimuli. Therefore, we need to compare four conditions: speech versus non-speech each compared with easy and hard difficulty. If Broca’s area is involved specifically in visual speech perception one would expect an interaction effect: with difficulty related increased activity observed for speech but not non-speech stimuli.
While limited research has focused on the role of Broca’s area in the perception of speech and non-speech motor movements, even less is known about the contribution of the two remaining speech areas – the left superior temporal lobe (Wernicke’s area) and the left inferior parietal lobe (recently termed ‘Geschwind’s area by Catani et al., 2005). The differences in speech impairment among stroke patients with selective lesions to Broca’s area, Wernicke’s area, and the inferior parietal lobe certainly highlights the roles of these areas in speech and language processing (for discussion see Hickock & Poeppel, 2007). However, the particular role of each of these areas in monitoring the speech motor movements of others is unclear. Based on the concept of mirror neurons (neurons which fire during the execution as well as the perception of the same action), Iacoboni and Wilson (2006) proposed a general model in which the relationship among these areas can be reconciled to support both language processing as well as the imitation of others. In short, they suggest that Broca’s area encodes the goal of an action, the superior temporal lobe provides higher order description of the percept, and the inferior parietal lobe provides somatosensory feedback. It is important to note that Broca’s area, Wernicke’s area, and the inferior parietal lobe are though to correspond to the macaque F5, PF, and the superior temporal sulcus (STS) where mirror neurons have been found (di Pellegrino et al., 1992; Gallese et al., 1996; Rizzolatti et al, 2001; Rizzolatti & Craighero, 2004).
Since the classical language areas have an established role in speech production, and are also proposed to constitute a human mirror neuron system, it is important to examine how these regions contribute to the perception of others’ speech. Thus, the purpose of this study was twofold: First, to assess cortical activity associated with visual discrimination of speech and non-speech motor movements in three regions of interest in the left hemisphere representing the classical language areas – the posterior, inferior frontal gyrus (BA 44 and inferior BA 6); the inferior parietal lobe (BA 40); and the posterior superior temporal lobe (BA 22). Second, the differential recruitment of these ROIs was examined as a function of task difficulty by varying the quality of the visual representation of the stimuli. Using this manipulation, it should be possible to determine the contribution of each cortical area in the visual discrimination of speech versus non-speech motor movements. Based on evidence suggesting that Broca’s area includes articulatory maps that are taxed for speech production (Guenther, 2006; Guenther et al, 2006; Bohland & Guenther, 2006) as well as speech perception (Hickock & Poeppel, 2007), we predicted differential modulation of Broca’s area activity depending on stimulus clarity. In addition, we explored task related activity in the left parietal lobe and Wernicke’s area. It is important to note that two prefrontal ROIs were selected based on evidence suggesting that inferior BA 6, rather than BA 44 may be the homologue of area F5 of the macaque (Petrides et al., 2005). However, since numerous papers have described BA 44 as the homologue of F5 we also included it as a frontal ROI along with BA 6 (Rizzolati & Arbib, 1998, Petrides et al., 2005).
Materials and Methods
Participants:
Twenty participants were initially recruited from the undergraduate and graduate student body at the University of South Carolina. The final analysis was based on the fourteen subjects (age: 19–29) who exhibited occipital activation to the visual stimuli relative to rest (this analysis is orthogonal to our later statistical tests, and ensures that a robust hemodynamic response could be modeled for each individual). Eight were females and all were right handed and did not report a history of neurological or psychiatric problems. Potential participants were also excluded based in impaired visual acuity (i.e., if they used glasses or corrective lenses). Prior to study inclusion, each participant gave informed consent for study enrollment, following a protocol approved by our institution’s institutional review board.
fMRI task:
The task involved visual discrimination of pairs of video clips showing either speech or non-speech motor movements which were presented on a computer screen back projected via a mirror mounted on the MRI headcoil. All video clips showed a speaker whose face was visible below the nose. Video clips lasting 800 ms each were played in pairs with 400 ms separating the two; every pair contained either two speech, or two non-speech movements. The task was to decide whether the two successive video clips were identical or different from each other (with half of the trials presenting identical clips and the other half using different videos). Participants responded using a response glove fitted to the left hand: pressing the index finger for repeated video clips and the middle finger when the two video clips differed. As the video clips were silent, the participants were forced to make a purely visual discrimination between paired stimuli. To estimate changes in cortical activity as a function of increased task difficulty, half of the second video clips of each stimulus pair were degraded by decreasing the frame rate 30 frames per second to 3 frames per second. During a 16-minute fMRI run, a total of 160 stimulus pairs were presented; of the 80 stimulus pairs that included motor speech movements, 40 presented the second video clip at a normal frame rate (30 frames/sec) while the remaining 40 showed the second video clip at a degraded rate (3 frames/sec). The split between normal and degraded frame rate was the same for the 80 stimulus pairs depicting non-speech oral movements. Thus, the stimulus paradigm included a two-by-two design where the two factors were ‘oral movements’ (speech vs. non-speech) and ‘video frame rate’ (normal vs. degraded) (Table 1). Presentation of speech and non-speech oral movements was randomized with a mean inter-stimulus-interval of 4 seconds (range: 2–6 seconds). Crosshairs located in the middle of the video screen were shown between stimuli. The task instructions were as follows: “You are about to see pairs of video clips showing a person making oral movements. Half of the stimulus pairs will include videos where the frame rate has been reduced. Regardless of the frame rate, your task is to determine whether the two video clips showed the same or different movements by pressing the index finger for a correct match and the middle finger for an incorrect match.”
Table 1.
Distribution of stimulus pairs among the two conditions (speech vs. non-speech motor movements) presented at two different frame rates (normal vs. degraded). Half of the stimulus pairs in each cell was presented as a correct match (same motor movement shown twice in a row) and the other half was shown as an incorrect match (two different motor movements).
| Speech movements | Non-speech movements | |
|---|---|---|
| Normal frame rate | 20 correct matches | 20 correct matches |
| (30 frames/sec) | 20 incorrect matches | 20 incorrect matches |
| Degraded frame rate | 20 correct matches | 20 correct matches |
| (3 frames/sec) | 20 incorrect matches | 20 incorrect matches |
The oral speech movements were composed of ten nonsense syllables. These included: /pa/, /bu/, /fa/, /ha/, /la/, /mu/, /na/, /pou/, /shei/, and /sha/. The 10 non-speech motor movements consisted of: unilateral tongue lateralization, bilateral tongue lateralization, tongue protrusion, puffing of the cheeks, raising the upper lip (and showing the upper teeth), biting the lower lip, lip contraction showing upper and lower teeth, unilateral lip contraction, complete mouth opening, and tongue thrust in left cheek. All stimuli were used in the paradigm and the number of stimulus presentations of each was controlled across the conditions.
MRI:
All MRI data were collected using a Siemens Trio 3T with a twelve-channel headcoil. The specifics of the fMRI sequence were as follows: TR = 2.500 ms, TE = 35 ms; matrix = 64 × 64; voxel size = 3.25 mm × 3.25 mm × 3.5 mm; number of slices = 36. During the 16 minute fMRI scan, a total of 384 echo planar (EPI) volumes covering the whole supratentorial brain were collected. To improve normalization of EPI data, all participants were also scanned using a high resolution T1-weighted MRI protocol with the following parameters: TI of 900ms, a TR of 2250ms between TFE shots and a 9 degree flip angle, TE = 4.52ms, 160-slices with an isotropic 1mm resolution and a 256 × 256 matrix. The T1-MRI was used as an intermediary volume to improve the co-registration in the fMRI analysis.
fMRI analysis:
The first level fMRI analysis utilized multi-linear analysis contained within the 5.63 version of FMRIB’s Software Library (FSL; www.fmrib.ox.ac.uk/fsl). The following pre-statistics processing was applied; motion correction using linear image registration (Jenkinson 2002); slice-timing correction using Fourier-space time-series phase-shifting; non-brain removal using FMRIB’s brain extraction tool (Smith 2002); spatial smoothing using a Gaussian kernel of FWHM 5mm; mean-based intensity normalization of all volumes by the same factor; highpass temporal filtering (Gaussian-weighted least-squares straight line fitting, with sigma=50.0s). Time-series statistical analysis was carried out using a general linear model based analysis of first level (time series) data with local autocorrelation correction (Woolrich 2001). Z (Gaussianised T) statistic images were thresholded using clusters determined by Z > 2.3 and a (corrected) cluster significance threshold of p = 0.05 (Worsley 1992). Registration to high resolution and standard images was carried out using the linear image registration tool contained within FSL (Jenkinson, 2001; 2002).
An initial lower level analysis was performed to detect regional blood flow changes associated with each of the four stimulus classes (normal speech, degraded speech, normal non-speech, degraded non-speech). For each condition, the voxelwise effect size and variance was computed relative to baseline (using the other three conditions as regressors to account for variability). The beginning of the BOLD response was modeled as an event from the beginning of the second video clip in each stimulus pair.
To compare cortical activity associated with discrimination of speech and non-speech motor movements, a higher level analysis was carried out utilizing the FMRIB’s Local Analysis of Mixed Effects stage 1 (Beckmann, 2003; Woolrich, 2004). Z (Gaussianised T) statistic images were thresholded using clusters determined by Z > 2.3 and a (corrected) cluster significance threshold of p = 0.05 (Worsley 1992). Local maxima for the higher level activation maps were extracted using the Talairach Daemon (Lancaster et al., 1997).
A Region of Interest (ROI) analysis was conducted in which intensity of activation was compared across the two conditions (watching speech motor movements vs. non-speech motor movements) and two levels (normal video frame rate vs. degraded frame rate) for each of the four designated ROIs. ROI analyses can offer substantially more statistical power for testing a priori predictions than conventional voxel-by-voxel analyses by pooling noisy data across anatomically meaningful regions and eliminating the need for familywise error correction. Left hemisphere ROIs were extracted from the Brodmann area map included in MRIcro (Rorden & Brett, 2000). This image was generated by Krish Singh who warped an image from Drury and Van Essen (1997) to standard stereotaxic space. It should be noted that an image is probabilistic in nature: Brodmann’s Areas are histologically defined and can not be precisely mapped using currently available in-vivo MRI (Amunts et al., 2004). Based on Petrides et al., (2005) who implied that the inferior lateral portion of BA 6 is the human homologue of the macaque F5, only the portion of BA 6 that lies caudal to BA 44 was utilized as a ROI. The size of the ROIs was as follows: BA 6 = 9.62cc; BA 44 = 9.61cc; BA 40= 15.2cc; and BA 22 = 10.42cc. A two-by-two ANOVA within subjects was utilized to compare the intensity of activation measured in Z-scores in each ROI. As peak activation can vary within a ROI from one subject to the next simply due to anatomical differences in brain structure, the top 10% of voxels showing the highest activity were averaged for our ROI analysis.
Results
All participants completed the task with greater than 91% overall accuracy (mean = 94.89; SD = 3.22; range = 91% to 99%). A two-by-two ANOVA revealed a main effect (F = 14.3; p = .0009) of ‘frame rate’ where stimulus pairs including a degraded video clip were discriminated with lower accuracy than pairs where both clips were shown at a normal frame rate. No main effects were obtained for the type of oral movements (F = 0.1; p = .99) and the interaction between types of oral movements and video frame rate was not statistically significant (F = .23; p = .63).
To examine cortical activity associated with task completion, regardless of condition or frame rate, a higher level analysis was conducted which included all lower level analyses. This analysis revealed a common cortical network mostly including posterior areas commonly associated with visual perception (BA 18 and 19) (Figure 1). Other areas that showed increased activity included the right fusiform gyrus (BA 18) as well as the bilateral medial frontal gyri (BA 6 and 32) and the left middle frontal gyrus (BA 6) (Table 2).
Figure 1.
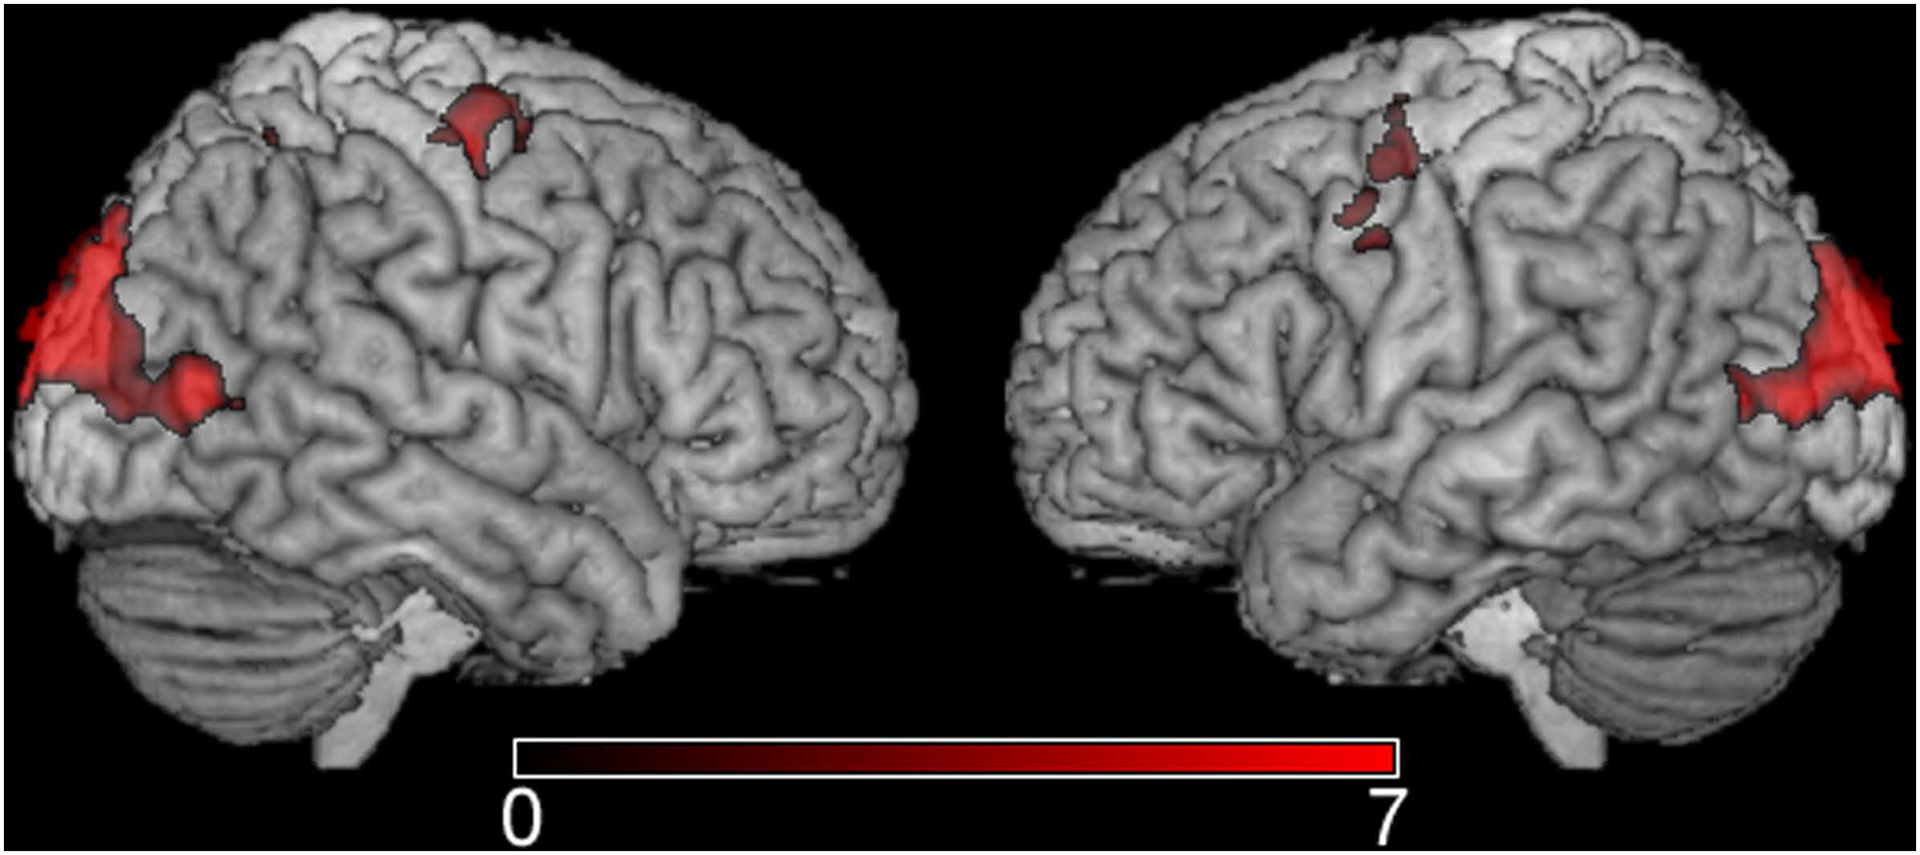
The mean statistical map showing cortical activity associated with all stimulus presentations regardless of condition or frame rate. Images are shown in standard space and neurological view – the color scale represents Z-scores.
Table 2.
Local maxima for 1) observing all stimulus presentations; 2) the contrast ‘speech motor movements > non-speech motor movements’; 3) the contrast ‘non-speech motor movements > speech motor movements’; and 4) the contrast ‘degraded frame rate > normal frame rate.’
| All stimuli | ||||||
|---|---|---|---|---|---|---|
| Z | x | y | z | Hemisphere | Location | BA |
| 6.06 | 18 | −94 | 18 | Right | Cuneus | 18 |
| 5.33 | −22 | −96 | 20 | Left | Middle Occipital Gyrus | 18 |
| 5.03 | −36 | −78 | 4 | Left | Middle Occipital Gyrus | 19 |
| 5.01 | 26 | −86 | 30 | Right | Cuneus | 19 |
| 4.84 | −8 | −98 | 20 | Left | Cuneus | 18 |
| 3.39 | 25 | −76 | −6 | Right | Fusiform gyrus | 18 |
| 3.75 | −6 | 2 | 52 | Left | Medial Frontal Gyrus | 6 |
| 3.53 | −42 | −4 | 52 | Left | Precentral Gyrus | 6 |
| 3.48 | 10 | 14 | 42 | Right | Medial Frontal Gyrus | 32 |
| 3.47 | −48 | 0 | 36 | Left | Precentral Gyrus | 6 |
| 3.45 | −30 | −4 | 46 | Left | Medial Frontal Gyrus | 6 |
| 3.36 | −4 | 16 | 42 | Left | Cingulate Gyrus | 32 |
| ‘Speech motor movements > non-speech motor movements’ | ||||||
| Z | x | y | z | Hemisphere | Location | BA |
| 7.06 | −64 | −22 | 6 | Left | Sup. Temporal Gyrus | 22 |
| 6.92 | −50 | −4 | 50 | Left | Precentral Gyrus | 6 |
| 6.38 | −48 | 22 | −6 | Left | Inf. Frontal Gyrus | 47 |
| 8.56 | 32 | −92 | −2 | Right | Inf. Occipital Gyrus | 18 |
| 8.11 | −24 | −94 | −4 | Left | Lingual Gyrus | 18 |
| 8.1 | 28 | −100 | 12 | Right | Middle Occipital Gyrus | 18 |
| 7.45 | 60 | −24 | 0 | Right | Sup. Temporal Gyrus | 22 |
| 5.34 | 60 | −6 | −4 | Right | Middle Temporal Gyrus | 21 |
| 5.12 | 68 | −16 | 6 | Right | Sup. Temporal Gyrus | 42 |
| 6.12 | −4 | 6 | 62 | Left | Sup. Frontal Gyrus | 6 |
| ‘Non-speech motor movements > speech motor movements’ | ||||||
| Z | x | y | z | Hemisphere | Location | BA |
| 6.23 | 50 | −60 | −2 | Right | Inf. Temporal Gyrus | 19 |
| 6.17 | −20 | −76 | 54 | Left | Precuneus | 7 |
| 6.14 | −16 | −70 | 60 | Left | Sup. Parietal Lobule | 7 |
| 6.06 | 40 | −76 | 40 | Right | Precuneus | 19 |
| 5.99 | −64 | −32 | 28 | Left | Inf. Parietal Lobule | 40 |
| 5.7 | −4 | −58 | 68 | Left | Postcentral Gyrus | 7 |
| 3.85 | −30 | −12 | 48 | Left | Middle Frontal Gyrus | 6 |
| ‘Degraded frame rate > normal frame rate’ | ||||||
| Z | X | y | z | Hemisphere Location | Location | BA |
| 4.25 | 32 | −60 | 50 | Right | Superior Parietal Lobule | 7 |
| 3.99 | 28 | −70 | 28 | Right | Precuneus | 31 |
| 3.85 | −26 | −64 | 38 | Left | Precuneus | 7 |
| 4.48 | 44 | −70 | −12 | Right | Fusiform Gyrus | 19 |
| 3.79 | 36 | −52 | −12 | Right | Fusiform Gyrus | 37 |
| 3.69 | 44 | −82 | 6 | Right | Middle Occipital Gyrus | 19 |
| 4.07 | −50 | −78 | −4 | Left | Middle Occipital Gyrus | 19 |
| 3.98 | −46 | −78 | −6 | Left | Inferior Occipital Gyrus | 19 |
| 3.94 | −32 | −74 | −6 | Left | Lingual Gyrus | 18 |
Discrimination of either speech or non-speech motor movements recruited distinct cortical networks. The contrast ‘speech motor movements > non-speech motor movements’ revealed greatest neurological activity the bilateral superior temporal lobe (BA 22), and the left posterior, inferior frontal lobe including BA 6, 44, and 47 (Table 2). Other areas that showed greater modulation associated with discrimination of speech motor movements included the bilateral occipital gyrus (BA 18) and the left medial, superior frontal gyrus (BA 6). The opposite contrast ‘non-speech motor movements > speech motor movements’ revealed increased activity in the inferior temporal gyrus (BA 19), the bilateral precuneus (BA 7), as well as the inferior parietal lobule (BA 40). Greater activity associated with discriminating non-speech compared to speech motor movements was also revealed in the left, superior middle frontal gyrus (BA 6).
To examine the effect of video frame rate on brain activity, normal frame rate (30 frames/sec) was compared to degraded frame rate (3 frames/sec) regardless of stimulus type (speech vs. non-speech movements). The contrast ‘degraded frame rate > normal frame rate’ revealed increased activity in the following cortical areas: superior parietal lobe (BA 7), bilateral precuneus (BA 31 and BA 7), right fusiform gyrus (BA 19 and BA 37), the bilateral occipital lobe (BA 18 and BA 19) and area V5 (BA 19) (Table 2). The opposite contrast was non significant.
BA 6 and BA 44 –
The overall activity in the left inferior BA 6 was higher for discriminating speech compared to non-speech motor movements, F = 13.3; p = .00029 (Figure 3). Note that this effect is mainly driven by the difference among speech and non-speech stimuli viewed at the degraded frame rate. Similarly, a main effect was revealed for frame rate where greater activity was noted for the decreased frame rate, F = 12.1; P = .0041. There was a significant interaction between oral movements and frame rate (F = 11.6; p = .0047) where greater speech compared to non-speech discrimination related activity was found for the degraded frame rate (t = 4.77; p < .0004) but not for the normal frame rate (t = 1.29; p = .22). A very similar pattern was observed for discriminating speech and non-speech motor movements in BA 6 and BA 44 (Figure 3) where main effects were revealed in BA 44 for oral movements (F = 17.5; p = .0011 ) and frame rate, F = 19.0; p = .0008. The crucial interaction between oral movements and frame rate also reached statistical significance, F = 7.79; p = .015.
Figure 3.
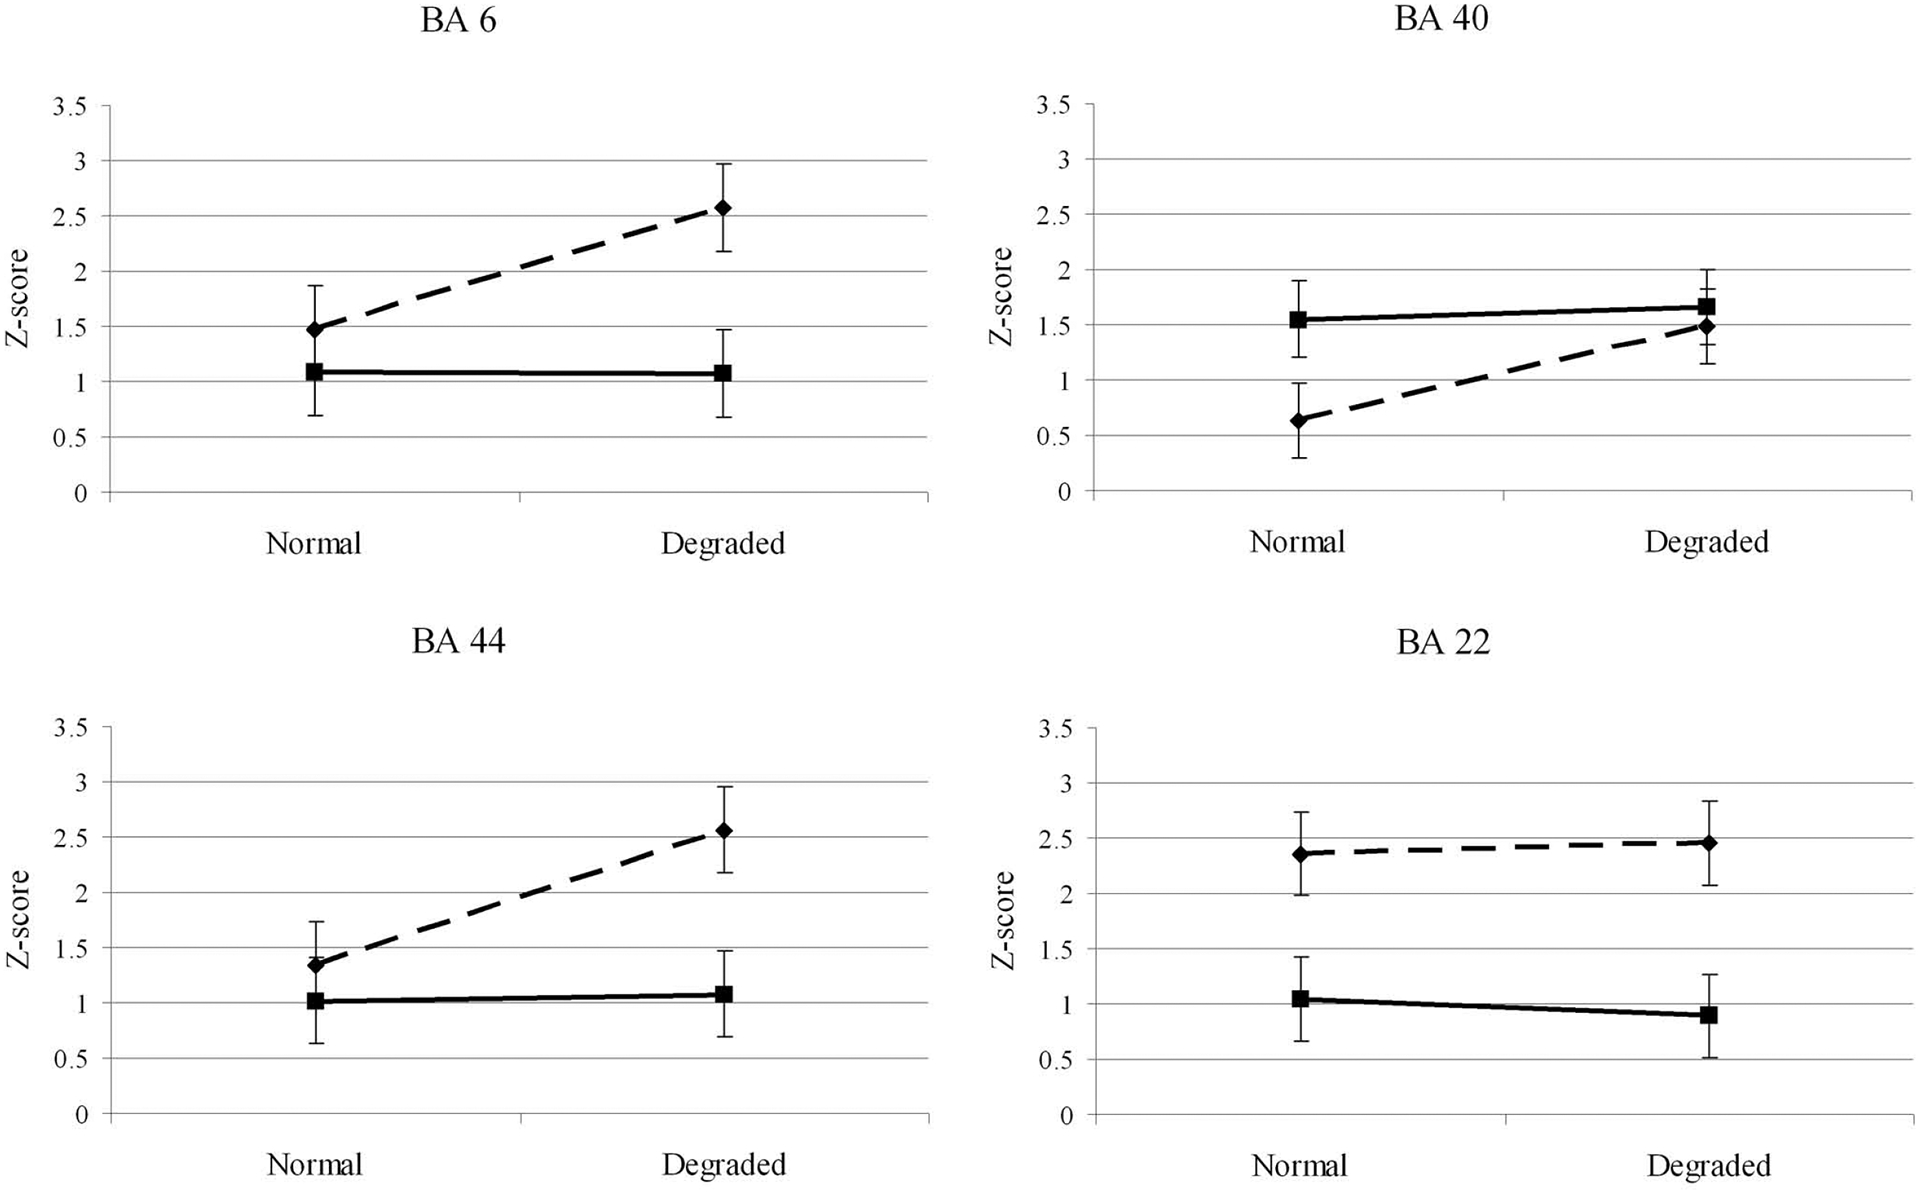
Mean cortical activity in selected regions of interest during visual discrimination of speech (dotted line) and non-speech (solid line) motor movements. The vertical axis shows the mean Z-score for the top 10% of voxels in each region. The horizontal axis illustrates the effect of showing videos at normal (30 frames/sec) or degraded (3 frames/sec) frame rates. The dotted lines show activation for viewing speech motor movements, while the solid line indicates activation when watching non-speech motor movements.
BA 40 –
Unlike the frontal areas, significantly higher activation in BA 40 was associated with discriminating non-speech compared to speech motor movements, F = 8.36; p = .013 (Figure 3). Higher activity was nonetheless associated with discriminating motor movements presented at the lower frame rate, F = 17.3; p = .0011. The interaction between oral movements and frame rate was not significant, F = 3.83; p = .07. Nevertheless, discriminating the degraded speech motor movements compared to undegraded induced significantly higher activity in BA 40 (t = 3.86; p = .002). This was not the case for discrimination of non-speech motor movements where degradation did not influence the intensity of BA 40 activity (t = .50; p = .62).
BA 22 –
The only comparison within BA 22 that reached statistical significance was a main effect for oral movements where higher activity was noted for discriminating speech compared to non-speech motor movements, F = 50.1; p < .0001 (Figure 3).
Discussion
This study examined cortical activity associated with visual discrimination of speech and non-speech motor movements in cortical areas commonly associated with speech and language processing. The results of the whole brain analysis suggest that the inferior BA 6 and BA 44 are modulated by the visual perception of others’ speech movements, especially at the degraded frame rate. In contrast, the inferior BA 6 and BA 44 do not seem to be actively involved in the perception of non-speech motor movements since the whole brain analysis did not reveal activity in these brain areas during the discrimination at either frame rate. Although the overall activity in BA 40 was lower during the discrimination of speech compared to non-speech motor movements, it showed more robust speech related changes in cortical activity in the degraded compared to the normal video frame rate; this was not the case for non-speech motor movements. Even though BA 22 exhibited considerably greater cortical activity during the discrimination of speech rather than non-speech motor movements, it did not respond differently to normal or degraded frame rate in either condition.
Based on these results, it is clear that the frontal speech areas are selectively modulated by task difficulty during visual discrimination of speech motor movements but not during discrimination of non-speech motor movements. In other words, these areas treat the visual perception of motor speech movements as special. In particular, the left posterior inferior frontal gyrus appears to be involved in successful visual parsing of motor speech movements as greater activity was associated with decreased frame rate. Davis et al. (2005) showed a similar effect; increased left hemisphere activity in the posterior, inferior frontal gyrus and the superior temporal lobe was associated with degraded (auditory) speech intelligibility. Not surprisingly, their results implicated a different area for auditory speech perception (superior temporal lobe modulation) compared to the present finding of frontal motor area modulation in the current study. Nevertheless, it is clear that listeners benefit from seeing the face of the speaker. For example, Van Wassenhove et al. (2005) have demonstrated that visual presentation of a speaker speeds up cortical processing of auditory speech by the listener compared to when only auditory speech is present. It is common for listeners to repeat a misheard word to decipher its meaning; thus, solving a perceptual problem with production. The suggestion that speech perception is integrally tied to speech production is certainly not new. In their motor theory of speech perception, Liberman and colleagues (Liberman & Mattingly, 1972, 1985; Mattingly & Liberman, 1970) suggested that speech perception is accomplished by reconstructing the motoric programs necessary to produce a given speech sound. Their theory has been much debated (Blumstien & Cooper, 1972); even so, it is possible that frontal motor area activity during the motor speech perception reflects reliance on motor processing to accomplish speech perception. The fact that activity in this region is modulated by degradation of the visual speech motor signal suggests that this activity does not reflect passive association arising due to the strong connections from the posterior perceptual areas (such as the superior temporal lobe). It is pertinent to point out here that our results only address visual perception of speech movements associated with sub-lexical speech and do not pertain to language comprehension per se (for discussion of the role of Broca’s area in language comprehension see: Bornkessel et al., 2005; Caplan et al., 1998; Friederici et al., 2000; Friederici, 2006; Gandour et al., 2002; Zatorre et al., 1996; Poldrack et al., 1998; and Stromswold et al., 1994).
The current data suggest that at the visual perceptual level, motor speech movements are treated specially – at least when compared to oral movements that do not have specific communicative intent. With regard to the role of Broca’s area in speech motor perception, a strong view would contend that Broca’s area is speech specific – as demonstrated by the fact that its destruction invariably leads to apraxia of speech (Hillis et al., 2004) – or dependent on language background. The latter was demonstrated by Gandour and colleagues (2002) who found increased Broca’s area activity associated with auditory discriminations of vowels and consonants in Thai speakers but only for consonant discriminations in English speakers. The critical point here is that segmentation of vowels and consonants is crucial for phonological processing in Thai but only for consonants in English suggesting that Broca’s area activity associated with speech processing is dependent on linguistic experience. In contrast to a strong view that assumes speech specific Broca’s area activity, a more general position would suggest that speech motor movements, like other goal directed movements, are executed for a specific purpose – to communicate with others. Thus, the frontal area activity may reflect goal specificity since non-speech motor movements did not incite similar activation. Neuronal firing in the macaque F5 during the observation of goal directed movements (di Pellegrino et al., 1992; Kohler et al., 2002; Umilta et a., 2001) would support this account if F5 in the macaque and Broca’s area in the human are indeed homologous. A similar, but perhaps a more specific explanation of the role of Broca’s area in the perception of others’ actions was presented by Fadiga and Craighero (2006) who suggested that Broca’s area supports general meaningful action recognition. The speech stimuli used in the current study consisted of nonsense syllables. Thus, if Broca’s area decodes the goal of the action, the present data would support such an account. That is, speech motor movements are easily distinguished from non-speech motor movements suggesting that the “goal” of the action in this case simply would have to be considered speech production (which always has a communicative intent).
In a recent position paper, Iacoboni and Wilson (2006) suggested that the traditional language areas (Broca’s area, Wernicke’s area, and the inferior parietal lobe) could be considered as components of a more general neural network that supports the perception of others’ actions and, thereby, learning via imitation. They suggested two components of a functional-anatomical neural network that processes goal directed behavior where a forward model predicts the sensory effects (supported by the superior temporal lobe and the inferior parietal lobe) of an action (initiated in the posterior, inferior frontal lobe) and an inverse model which receives input representing a desired sensory state from the superior temporal lobe that projects to the frontal mirror neuron areas via the parietal lobe. The final output of this inverse model would be the motor program used to imitate an action. In the inverse model, the superior temporal lobe describes incoming stimuli, regardless of context. Excluding activity in the inferior parietal lobe, the present data are consistent with this proposition where superior temporal lobe activity did not change depending on stimulus clarity. Conversely, the posterior, inferior frontal lobe should be differentially modulated by the transparency of the stimuli since encoding the sensory state and the goal of an observed action required increased effort. Given that the model is driven by goal directed actions, discrimination of non-speech motor movements, regardless of difficulty, should not differentially activate the neural network. Nevertheless, activity in the inferior parietal lobe (receives input representing a desired sensory state of an action) was not consistent with the model since greater activity associated with speech compared to non-speech motor movements was not revealed at either frame rate.
So far, we have discussed the present findings within a general theoretical framework focused on goal-directed actions. However, it also appropriate to explore how the findings relate to specific theories of speech motor processing. After all, the cortical areas that were examined have historically been integrally related to speech and language processing. The Directions Into Velocities of Articulators (DIVA) model proposed by Guenther and colleagues (Guenther, 2006; Guenther et al, 2006; Bohland & Guenther, 2006) provides a detailed account of the neuroanatomical basis of speech production. Put simply, the DIVA model includes subsystems similar to those suggested by Iacoboni and Wilson (2006): a feedforward system where speech sound maps in the left frontal operculum directly activate the motor cortex for speech production and a feedback system where auditory maps in the superior temporal lobe and somatosensory maps in the inferior parietal lobe also influence the motor cortex.
Although the DIVA model is focused specifically on speech production, it also has implications for the present data. If speech sound maps are represented in the traditional motor areas of the frontal lobe they could be used as templates for speech (auditory and visual) perception. Visual perception of articulation by others could activate frontal speech sound maps that are closely tied to the motor plan executed to produce the same speech sounds. When the visual presentation of motor speech movements is degraded, the matching process becomes more demanding - calling for increased neural activity. This is similar to what is proposed in Hickock and Poeppel’s (2007) Dual Stream model of the neuroanatomical substrates of speech perception. It suggests a dorsal processing stream that maps acoustic speech signals from the posterior speech areas in the temporal lobes to frontal lobe articulatory networks. Likewise, Halle and Steven’s (1962) “analysis-by-synthesis” model suggests that speech production and perception are integrally linked and that incoming speech is matched to previously heard signals (templates).
Given that the DIVA model does not include motor maps in the posterior, inferior frontal gyrus to match non-speech motor movements, observing those movements should not result in increased inferior frontal activity. Auditory maps in the superior temporal lobe, however, should not respond differently to normal and degraded visual motor speech since no auditory stimulation was included here. We suggest that the increased activity in the left superior temporal lobe during the speech movement condition reflects strong white matter connections between the frontal speech-motor areas and the middle and superior temporal lobe via the arcuate fasciculus. Consistent with the DIVA model, activation of the frontal articulatory maps results in corresponding temporal lobe activity for the purpose of parallel feedback. This is also consistent with the Dual Stream model of speech perception (Hickock & Poeppel, 2007) which suggests a dorsal processing stream including frontal areas that process articulatory movements for the purpose of speech production and perception as well as posterior areas which parse auditory speech (middle and superior temporal gyrus) and integrate phonology with articulatory movements (left posterior inferior parietal lobe). Our data suggest that left frontal areas (BA 44 and inferior BA 6) are recruited for visual speech perception, especially when the stimuli are degraded. The superior temporal lobe, however, does not respond differentially to visual speech depending on stimulus clarity suggesting that it does not play an active role in visual speech perception (in the absence of auditory speech). These findings are consistent with data that show that patients with apraxia of speech do not have difficulty with auditory speech discrimination (Square-Storer, Darley, and Sommers, 1988) but show degraded performance on visual discrimination of speech movements of others (Schmid & Ziegler, 2006).
Greater cortical activity associated with discriminating video clips shown at the degraded compared to normal frame (regardless of types of stimuli) rate was mainly revealed in brain areas typically associated with biological motion (Bonda, Petrides, Ostry, & Evans, 1996; Peelen, Wiggett, & Downing, 2006; Vaina et al, 2001). This was a somewhat surprising finding since the opposite effect (greater activity associated with the normal compared to the degraded frame rate) would have seemed more clear-cut. However, it is important to note that participants did not engage in a passive perceptual task. Rather, they were required to make comparisons between video clips where the first video was always shown at a normal frame rate and half of the second video clip in each stimulus pair was shown at either normal or degraded frame rate. Thus, successful task completion required participants to maintain the first video in short term memory for comparison to the second video clip. Moreover, to discriminate among clips shown at different frame rates, participants either would need to imagine the normal clip shown at a degraded frame rate or vice versa. We suggest that this process would induce greater recruitment of cortical areas associated with biological motion compared to when both clips in a stimulus pair are shown at the normal frame rate. This difference in activity among the normal and degraded conditions also highlights another difference among the stimuli; the video clips showing either speech or non-speech motor movements could have differed based on features other than the fact that half create speech sounds. For example, the motor movements were not controlled across the speech and non-speech conditions based on factors such as number of movements, effort needed to create these movements, and novelty. Therefore, it is conceivable that our findings reflect something not related to the speech vs. non-speech dichotomy. Nevertheless, consistent with our hypothesis (speech and non-speech stimuli differentially modulate Broca’s area depending on stimulus clarity) the stimuli were designed to represent clearly distinguishable speech and non-speech oral movements.
Although different theoretical models may account for the present data, it is clear that the visual discrimination of others’ motor speech movements activates the traditional language areas to different degree depending on stimulus clarity. So, when we observe someone else talking, the areas excited in our own brains overlap with the network that we use to speak. Our results show that that motor speech movements are special compared to non-speech movements. Whether this special nature reflects the inherent communicative goal of speech or whether speech movements – goal driven or not – are special simply because of their linguistic nature remains unclear.
Figure 2.
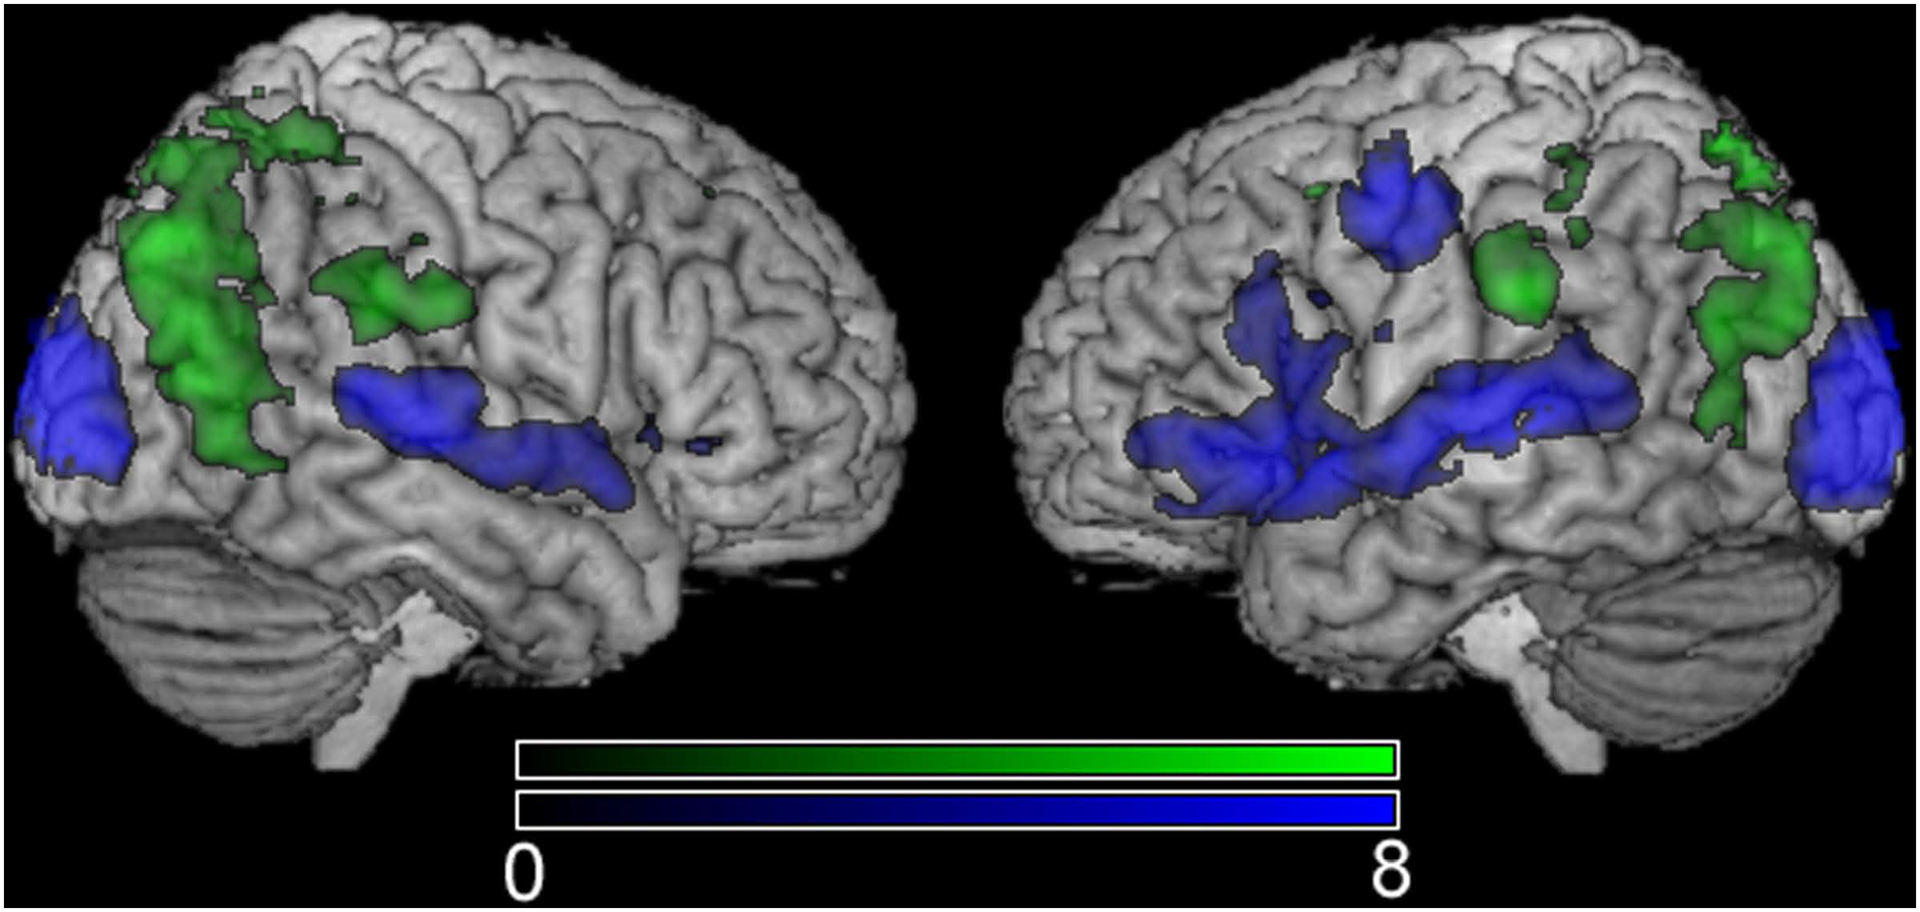
Contrasts among the two study conditions: ‘speech > non-speech’ is shown in the blue color scale and ‘non-speech > speech’ is shown in the green color scale.
Acknowledgements
This work was supported by grants (DC005915 & DC008355) to JF from the NIDCD; GCB was supported by a grant from NINDS (NS042047); CR was supported by a grant from NINDS (NS054266).
Footnotes
Publisher's Disclaimer: This is a PDF file of an unedited manuscript that has been accepted for publication. As a service to our customers we are providing this early version of the manuscript. The manuscript will undergo copyediting, typesetting, and review of the resulting proof before it is published in its final citable form. Please note that during the production process errors may be discovered which could affect the content, and all legal disclaimers that apply to the journal pertain.
References
- Amunts K, Weiss PH, Mohlberg H, Pieperhoff P, Eickhoff S, Gurd JM, Marshall JC, Shah NJ, Fink GR, Zilles K (2004) Analysis of neural mechanisms underlying verbal fluency in cytoarchitectonically defined stereotaxic space – The roles of Brodmann areas 44 and 45. NeuroImage 22: 42–56. [DOI] [PubMed] [Google Scholar]
- Bates E, Wilson SM, Ayse PS, Dick F, Sereno MI, Knight RT, et al. (2003) Voxel-based lesion-symptom mapping. Nature Neuroscience 6; 448–450. [DOI] [PubMed] [Google Scholar]
- Beckmann CF, Jenkinson M, Smith SM (2003) General multilevel linear modeling for group analysis in FMRI. Neuroimage 20: 1052–1063. [DOI] [PubMed] [Google Scholar]
- Blumstein S, Cooper W (1972) Identification versus discrimination of distinctive features in speech perception. Q J Exp Psychol 24: 207–214. [DOI] [PubMed] [Google Scholar]
- Bohland JW, Guenther FH (2006) An fMRI investigation of syllable sequence production. NeuroImage 32: 821–841. [DOI] [PubMed] [Google Scholar]
- Bonda E, Petrides M, Ostry D, Evans A (1996) Specific involvement of human parietal systems and the amygdale in the perception of biological motion. J. Neurosci 16; 3737–3744. [DOI] [PMC free article] [PubMed] [Google Scholar]
- Bonilha L, Moser D, Rorden C, Baylis GC, Fridriksson J (2006) Speech apraxia without oral apraxia: can normal brain function explain the physiopathology? Neuroreport 17: 1027–1031. [DOI] [PubMed] [Google Scholar]
- Bornkessel I, Zysset S, Friederici AD, von Cramon DY, Schlesewsky M (2005) Who did what to whom? The neural basis of argument hierarchies during language comprehension. Neuroimage. 15;26(1):221–33. [DOI] [PubMed] [Google Scholar]
- Calvert GA, Campbell R, Brammer MJ (2000) Evidence from functional magnetic resonance imaging of crossmodal binding in the human heteromodal cortex. Curr Biol 10: 649–657. [DOI] [PubMed] [Google Scholar]
- Campbell R, MacSweeney M, Surguladze S, Calvert G, McGuire P, Suckling J, Brammer MJ, David AS (2001) Cortical substrates for the perception of face actions: an fMRI study of the specificity of activation for seen speech and for meaningless lower-face acts (gurning). Brain Res Cogn Brain Res 12: 233–243. [DOI] [PubMed] [Google Scholar]
- Caplan D, Alpert N, Waters G, (1998) Effects of syntactic structure and propositional number on patterns of regional cerebral blood flow. J Cogn Neurosci. 10(4):541–52. [DOI] [PubMed] [Google Scholar]
- Catani M, Jones DK, ffytche DH (2005) Perisylvian language networks of the human brain. Ann Neurol 57: 8–16. [DOI] [PubMed] [Google Scholar]
- Davis MH, Johnsrude IS, Hervais-Adelman A, Taylor K, McGettigan C. (2005) Lexical information drives perceptual learning of distorted speech: evidence from the comprehension of noise-vocoded sentences. J Exp Psychol Gen. 134(2): 222–41. [DOI] [PubMed] [Google Scholar]
- di Pellegrino G, Fadiga L, Fogassi L, Gallese V, Rizzolatti G (1992) Understanding motor events: a neurophysiological study. Exp Brain Res 91: 176–180. [DOI] [PubMed] [Google Scholar]
- Dronkers NF (1996) A new brain region for speech: The insula and articulatory planning. Nature 384; 159–161. [DOI] [PubMed] [Google Scholar]
- Fadiga L, Craighero L (2006) Hand actions and speech representation in Broca’s area. Cortex 42: 486–490. [DOI] [PubMed] [Google Scholar]
- Friederici AD, Meyer M, von Cramon DY. (2000) Auditory language comprehension: an event-related fMRI study on the processing of syntactic and lexical information. Brain Lang. 74(2):289–300. [DOI] [PubMed] [Google Scholar]
- Friederici AD.(2006) Broca’s area and the ventral premotor cortex in language: functional differentiation and specificity. Cortex. 42(4):472–5. [DOI] [PubMed] [Google Scholar]
- Gallese V, Fadiga L, Fogassi L, Rizzolatti G (1996) Action recognition in the premotor cortex. Brain 119 ( Pt 2): 593–609. [DOI] [PubMed] [Google Scholar]
- Gandour J, Wong D, Lowe M, Dzemidzic M, Satthamnuwong N, Tong Y, Li X (2002) A cross-linguistic FMRI study of spectral and temporal cues underlying phonological processing. J Cogn Neurosci. 14; 1076–87. [DOI] [PubMed] [Google Scholar]
- Guenther FH (2006) Cortical interactions underlying the production of speech sounds. J Commun Disord 39: 350–365. [DOI] [PubMed] [Google Scholar]
- Guenther FH, Ghosh SS, Tourville JA (2006) Neural modeling and imaging of the cortical interactions underlying syllable production. Brain Lang 96: 280–301. [DOI] [PMC free article] [PubMed] [Google Scholar]
- Hall DA, Fussell C, Summerfield AQ (2005) Reading fluent speech from talking faces: typical brain networks and individual differences. J Cogn Neurosci 17: 939–953. [DOI] [PubMed] [Google Scholar]
- Hickock G, Poeppel D, (2007) The cortical organization of speech processing. Nat Rev Neurosci. 8(5):393–402 [DOI] [PubMed] [Google Scholar]
- Hillis AE, Work M, Barker PB, Jacobs MA, Breese EL, Maurer K (2004) Re-examining the brain regions crucial for orchestrating speech articulation. Brain 127: 1479–1487. [DOI] [PubMed] [Google Scholar]
- Iacoboni M, Wilson SM (2006) Beyond a single area: motor control and language within a neural architecture encompassing Broca’s area. Cortex 42: 503–506. [DOI] [PubMed] [Google Scholar]
- Jenkinson M, Bannister P, Brady M, Smith S (2002) Improved optimization for the robust and accurate linear registration and motion correction of brain images. Neuroimage 17: 825–841. [DOI] [PubMed] [Google Scholar]
- Jenkinson M, Smith S (2001) A global optimisation method for robust affine registration of brain images. Med Image Anal 5: 143–156. [DOI] [PubMed] [Google Scholar]
- Kohler E, Keysers C, Umilta MA, Fogassi L, Gallese V, Rizzolatti G (2002) Hearing sounds, understanding actions: action representation in mirror neurons. Science 297: 846–848. [DOI] [PubMed] [Google Scholar]
- Lancaster JL, Summerlin JL, Rainey L, Freitas CS, Fox PT (1997), The Talairach Daemon, a database server for Talairach Atlas Labels. Neuroimage 5(4):S633. [Google Scholar]
- Liberman AM & Mattingly IG (1985). The motor theory of speech perception revised. Cognition, 21, 1–36. [DOI] [PubMed] [Google Scholar]
- Liberman AM, Mattingly IG, & Turvey MT. (1972). Language codes and memory codes. In: Coding Processes in Human Memory, Melton AW and Martin E, Eds. (pp. 307–334) V.H. Winston and Sons. [Google Scholar]
- Mattingly IG & Liberman AM. (1970). The speech code and the physiology of language. In: Information Processing in the Nervous System, Leibovic KN, Ed. (pp. 97–117). Springer Verlag. [Google Scholar]
- Ogar J, Slama H, Dronkers N, Amici S, Gorno-Temini ML (2005) Apraxia of Speech: An overview. Neurocase 11; 427–432. [DOI] [PubMed] [Google Scholar]
- Peelen MV, Wiggett AJ, Downing PE (2006) Patterns of fMRI activity dissociate overlapping functional brain areas that respond to biological motion. Neuron 49; 815–822. [DOI] [PubMed] [Google Scholar]
- Petrides M, Cadoret G, Mackey S (2005) Orofacial somatomotor responses in the macaque monkey homologue of Broca’s area. Nature 435: 1235–1238. [DOI] [PubMed] [Google Scholar]
- Poldrack RA, Wagner AD, Prull M, Desmond JE, Glover GH, & Gabrieli JDE (1999) Functional specialization for semantic and phonological processing in the left inferior prefrontal cortex. NeuroImage,10,15–35. [DOI] [PubMed] [Google Scholar]
- Rizzolatti G, Arbib MA (1998) Language within our grasp. Trends Neurosci 21: 188–194. [DOI] [PubMed] [Google Scholar]
- Rizzolatti G, Craighero L (2004) The mirror-neuron system. Annu Rev Neurosci 27: 169–192. [DOI] [PubMed] [Google Scholar]
- Rizzolatti G, Fogassi L, Gallese V (2001) Neurophysiological mechanisms underlying the understanding and imitation of action. Nat Rev Neurosci 2: 661–670. [DOI] [PubMed] [Google Scholar]
- Rorden C, Brett M (2000) Stereotaxic display of brain lesions. Behav Neurol 12: 191–200. [DOI] [PubMed] [Google Scholar]
- Rorden C, Karnath HO (2004) Using human brain lesions to infer function: a relic from a past era in the fMRI age? Nat Rev Neurosci 5: 813–819. [DOI] [PubMed] [Google Scholar]
- Schmid G, Ziegler W (2006) Audio-visual matching of speech and non-speech oral gestures in patients with aphasia and apraxia of speech. Neuropsychologia 44: 546–555. [DOI] [PubMed] [Google Scholar]
- Skipper JI, Nusbaum HC, Small SL (2005) Listening to talking faces: motor cortical activation during speech perception. Neuroimage 25: 76–89. [DOI] [PubMed] [Google Scholar]
- Smith MS (2002) Fast robust automated brain extraction. 17: 143–155. [DOI] [PMC free article] [PubMed] [Google Scholar]
- Stromswold K (1994) The cognitive and neural bases of language acquisition. Cogn. Neurosci [Google Scholar]
- Square-Storer P, Darley FL, Sommers RK (1988) Nonspeech and speech processing skills in patients with aphasia and apraxia of speech. Brain and Language 33; 65–85. [DOI] [PubMed] [Google Scholar]
- Umilta MA, Kohler E, Gallese V, Fogassi L, Fadiga L, Keysers C, Rizzolatti G (2001) I know what you are doing. a neurophysiological study. Neuron 31: 155–165. [DOI] [PubMed] [Google Scholar]
- Vaina LM, Solomon J, Chowdhury s, Sinha P, Belliveau JW (2001) Functional neuroanatomy of biological motion perception in humans. Proc. Natl. Acad. Sci. USA 98; 11656–11661. [DOI] [PMC free article] [PubMed] [Google Scholar]
- Van Essen DC, Drury HA (1997) Structural and Functional Analyses of Human Cerebral Cortex Using a Surface-Based Atlas. In. pp 7079–7102. [DOI] [PMC free article] [PubMed]
- van Wassenhove V, Grant KW, Poeppel D (2005) Visual speech speeds up the neural processing of auditory speech. Proc Natl Acad Sci U S A 102: 1181–1186. [DOI] [PMC free article] [PubMed] [Google Scholar]
- Woolrich MW, Behrens TE, Beckmann CF, Jenkinson M, Smith SM (2004) Multilevel linear modelling for FMRI group analysis using Bayesian inference. Neuroimage 21: 1732–1747. [DOI] [PubMed] [Google Scholar]
- Woolrich MW, Ripley BD, Brady M, Smith SM (2001) Temporal Autocorrelation in Univariate Linear Modeling of FMRI Data. NeuroImage 14: 1370–1386. [DOI] [PubMed] [Google Scholar]
- Worsley KJ, Evans AC, Marrett S, Neelin P (1992) A three-dimensional statistical analysis for CBF activation studies in human brain. J Cereb Blood Flow Metab 12: 900–918. [DOI] [PubMed] [Google Scholar]
- Zatorre RJ, Meyer E, Gjedde A, Evans AC (1996) PET studies of phonetic processing of speech: review, replication, and reanalysis. Cereb Cortex 6(1):21–30. [DOI] [PubMed] [Google Scholar]