Summary
Intratumor heterogeneity underlies cancer evolution and treatment resistance, but targetable mechanisms driving intratumor heterogeneity are poorly understood. Meningiomas are the most common primary intracranial tumors and are resistant to all medical therapies, and high-grade meningiomas have significant intratumor heterogeneity. Here we use spatial approaches to identify genomic, biochemical, and cellular mechanisms linking intratumor heterogeneity to the molecular, temporal, and spatial evolution of high-grade meningiomas. We show divergent intratumor gene and protein expression programs distinguish high-grade meningiomas that are otherwise grouped together by current classification systems. Analyses of matched pairs of primary and recurrent meningiomas reveal spatial expansion of sub-clonal copy number variants associated wtih treatment resistance. Multiplexed sequential immunofluorescence and deconvolution of meningioma spatial transcriptomes using cell types from single-cell RNA sequencing show decreased immune infiltration, decreased MAPK signaling, increased PI3K-AKT signaling, and increased cell proliferation are associated with meningioma recurrence. To translate these findings to preclinical models, we use CRISPR interference and lineage tracing approaches to identify combination therapies that target intratumor heterogeneity in meningioma cell co-cultures.
Meningiomas comprise more than 40% of primary intracranial tumors1,2, and approximately 1% of humans will develop a meningioma in their lifetime3. Bioinformatic investigations have shed light on mechanisms underlying meningioma tumorigenesis4–11, but current meningioma classification systems can be confounded by intratumor heterogeneity12,13. Although the majority of meningiomas are low-grade and follow a benign clinical course, high-grade meningiomas are particularly heterogeneous13,14 and are prone to recurrence and decreased survival despite treatment with surgery and radiotherapy15. Systemic therapies remain ineffective or experimental for meningiomas16, and intratumor heterogeneity and tumor evolution in response to treatment have not been a focus in remote or recent clinical trials for patients with meningiomas17–20.
Here we test the hypothesis that understanding spatial genomic, biochemical, and cellular mechanisms linking intratumor heterogeneity to tumor evolution may reveal druggable dependencies. To do so, we use spatial transcriptomic and protein profiling approaches to study clinical samples from high-grade human meningiomas (Fig. 1). When integrated with clinically established histological or bulk molecular approaches for meningioma classification6,14,21, multiplexed sequential immunofluorescence (seqIF), and spatial deconvolution of meningioma single-cell transcriptomes, our results elucidate how intratumor heterogeneity influences the molecular (Fig. 2), temporal (Fig. 3, 4), and spatial evolution (Fig. 5, 6) of the most common primary intracranial tumor1,2. To validate these findings and generate a platform for testing personalized systemic therapies to treat high-grade meningiomas, we use CRISPR interference (CRISPRi)22 and fluorescent labeling of human meningioma cells in preclinical co-culture models to identify combinations of FDA-approved small molecules that inhibit intratumor heterogeneity and block meningioma growth (Fig. 7).
Fig. 1. Experimental design and workflow.
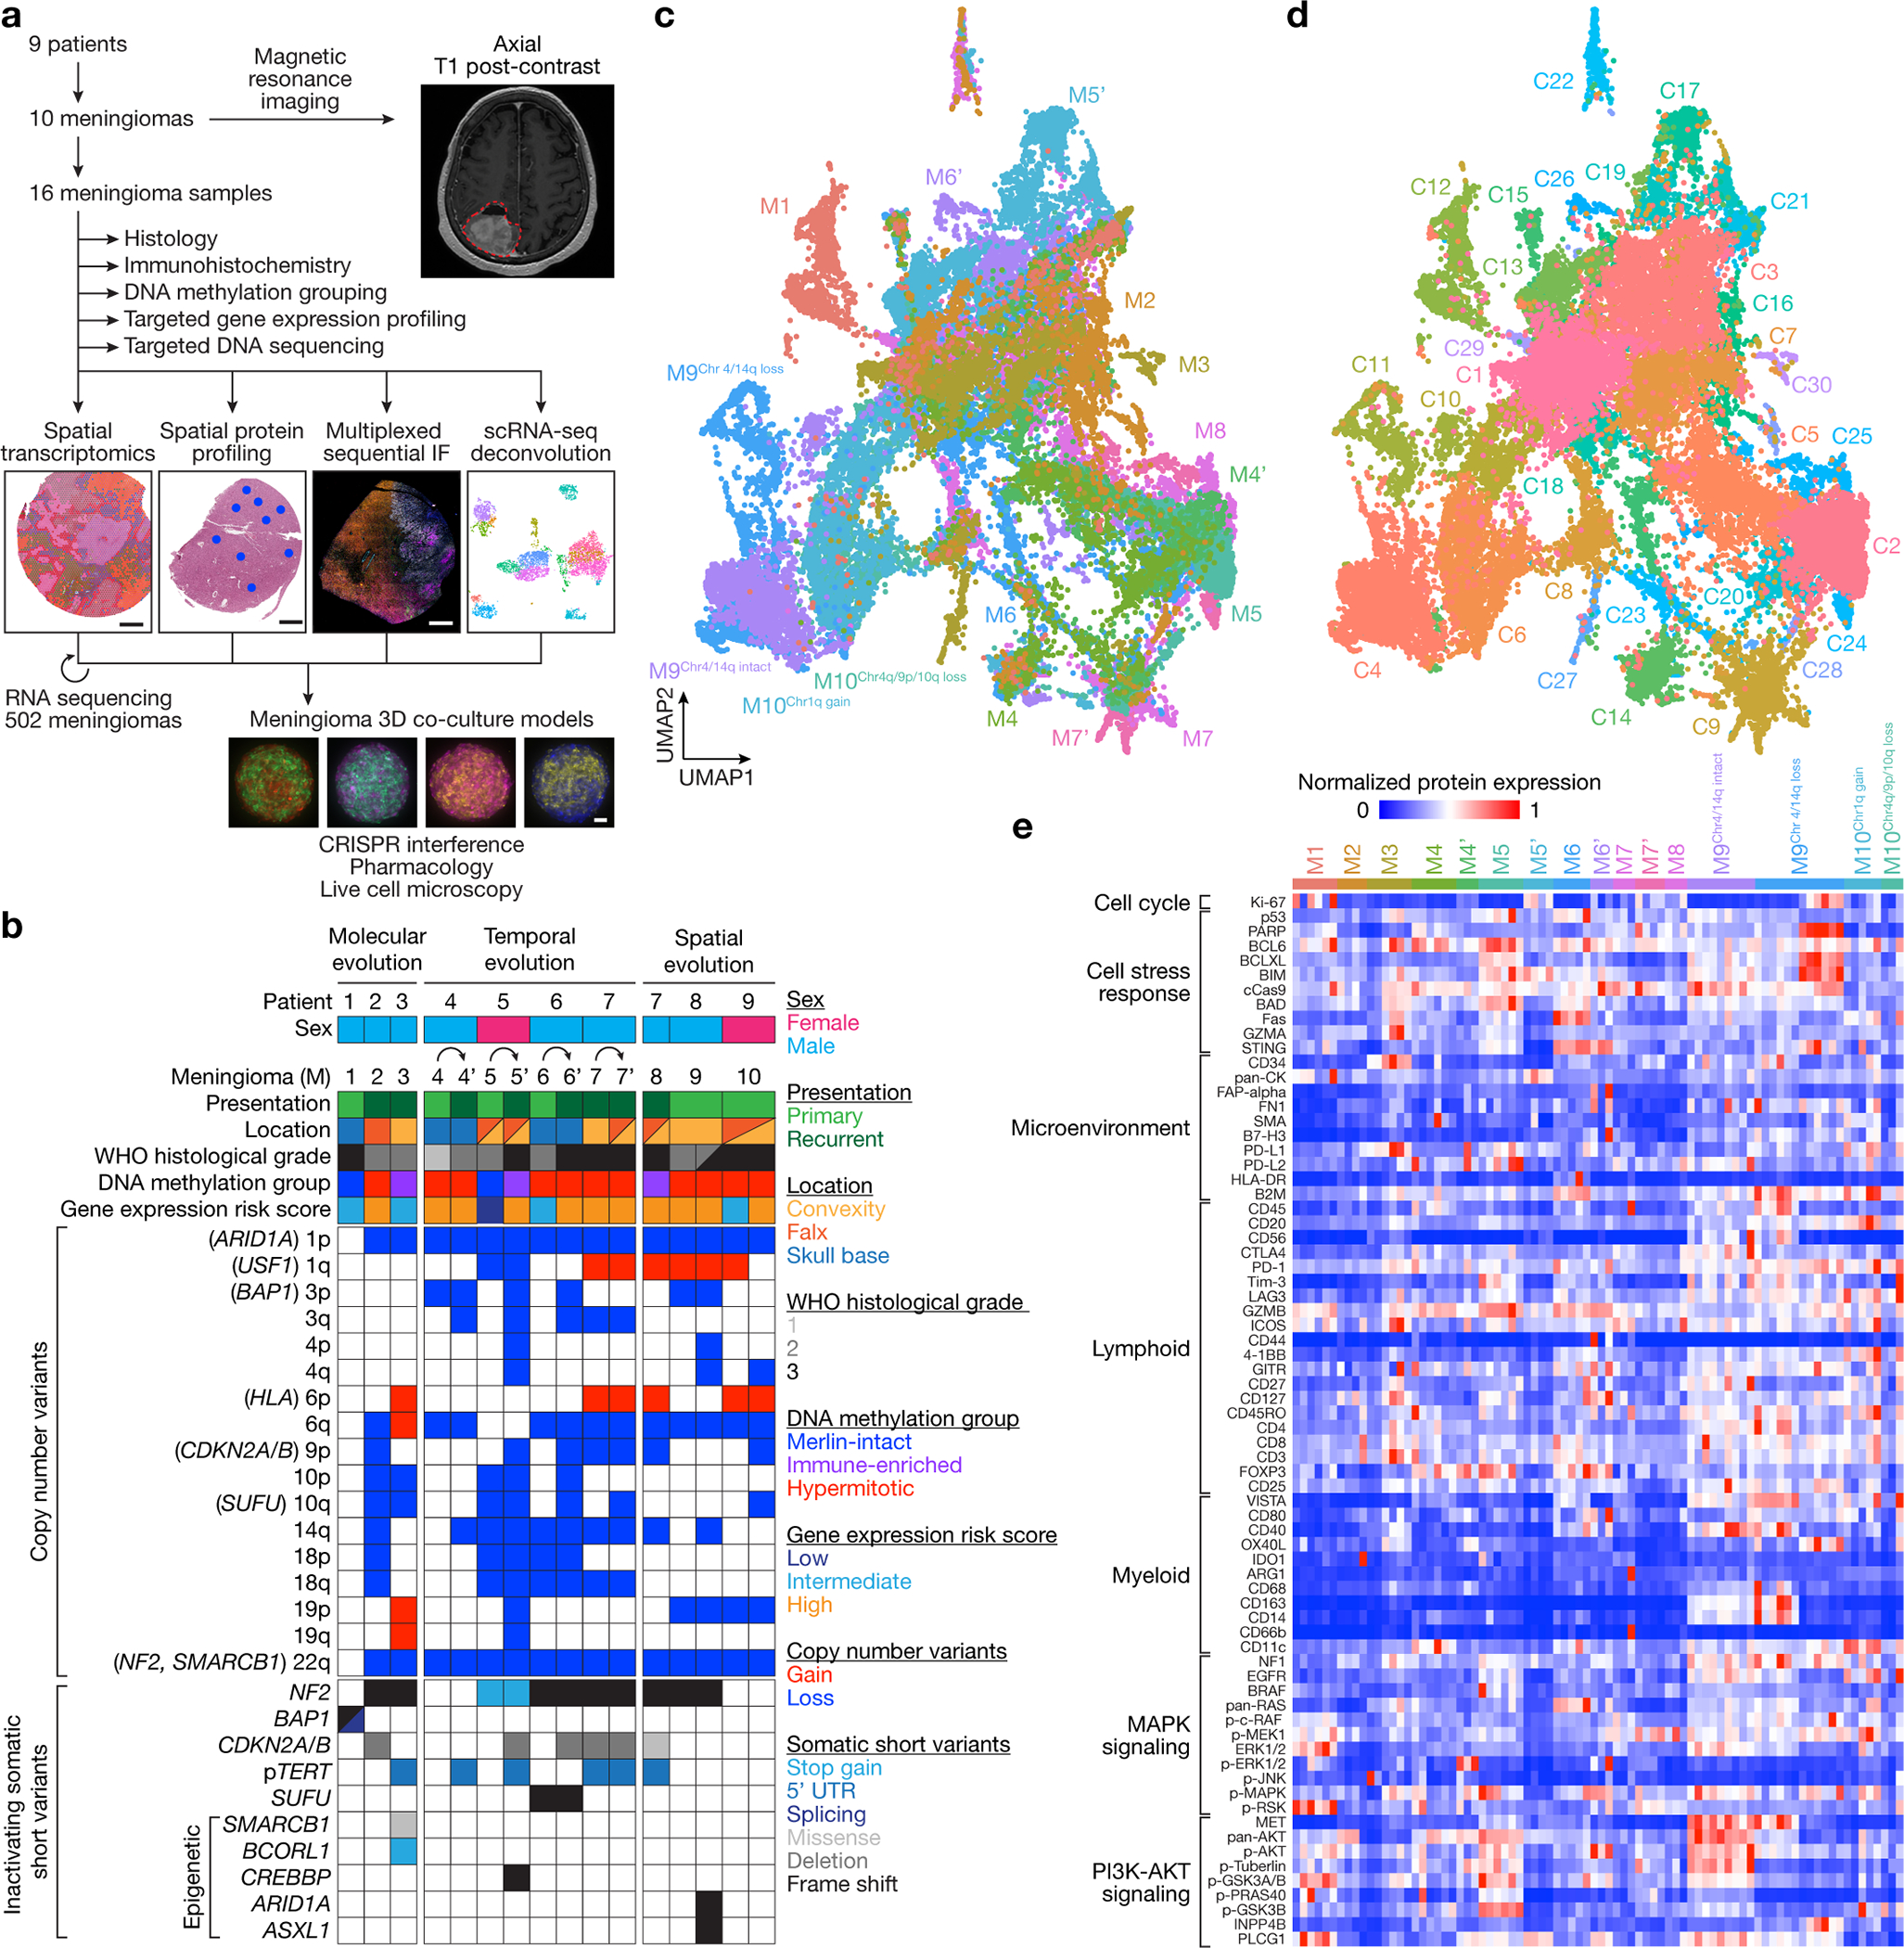
a, 16 high-grade meningioma samples from 10 meningiomas that were resected from 9 patients were analyzed using comprehensive histologic, immunohistochemical, and bulk and spatial bioinformatic techniques, including spatial transcriptomics, spatial protein profiling, multiplexed sequential immunofluorescence microscopy, and spatial deconvolution of meningioma single-cell RNA sequencing. Results were validated using RNA sequencing from 502 meningiomas, and CRISPR interference, pharmacology, and live cell imaging of meningioma 3D co-culture models. Scale bars, 1mm for meningiomas and 100μm for meningioma 3D co-cultures. b, Oncoprint comprised of the clinical, histologic, genetic, epigenetic, and gene expression features of the meningioma samples in this study. c, Uniform manifold approximation and projection (UMAP) of 38,718 meningioma spatial transcriptomes after Harmony batch correction shaded by sample of origin. d, UMAP of meningioma spatial transcriptomes after Harmony batch correction shaded by unsupervised hierarchical clusters. e, Heatmap of meningioma spatial protein profiling comprised of 72 proteins from 82 regions revealing significant inter- and intratumor heterogeneity. Sub-analyses of protein profiling across high-grade meningiomas based on this heatmap and Supplementary Table 5 are provided in Fig. 2k, 4a, 7d, and Extended Data Fig. 8c.
Fig. 2. High-grade meningiomas are distinguished by divergent intratumor gene and protein expression programs.
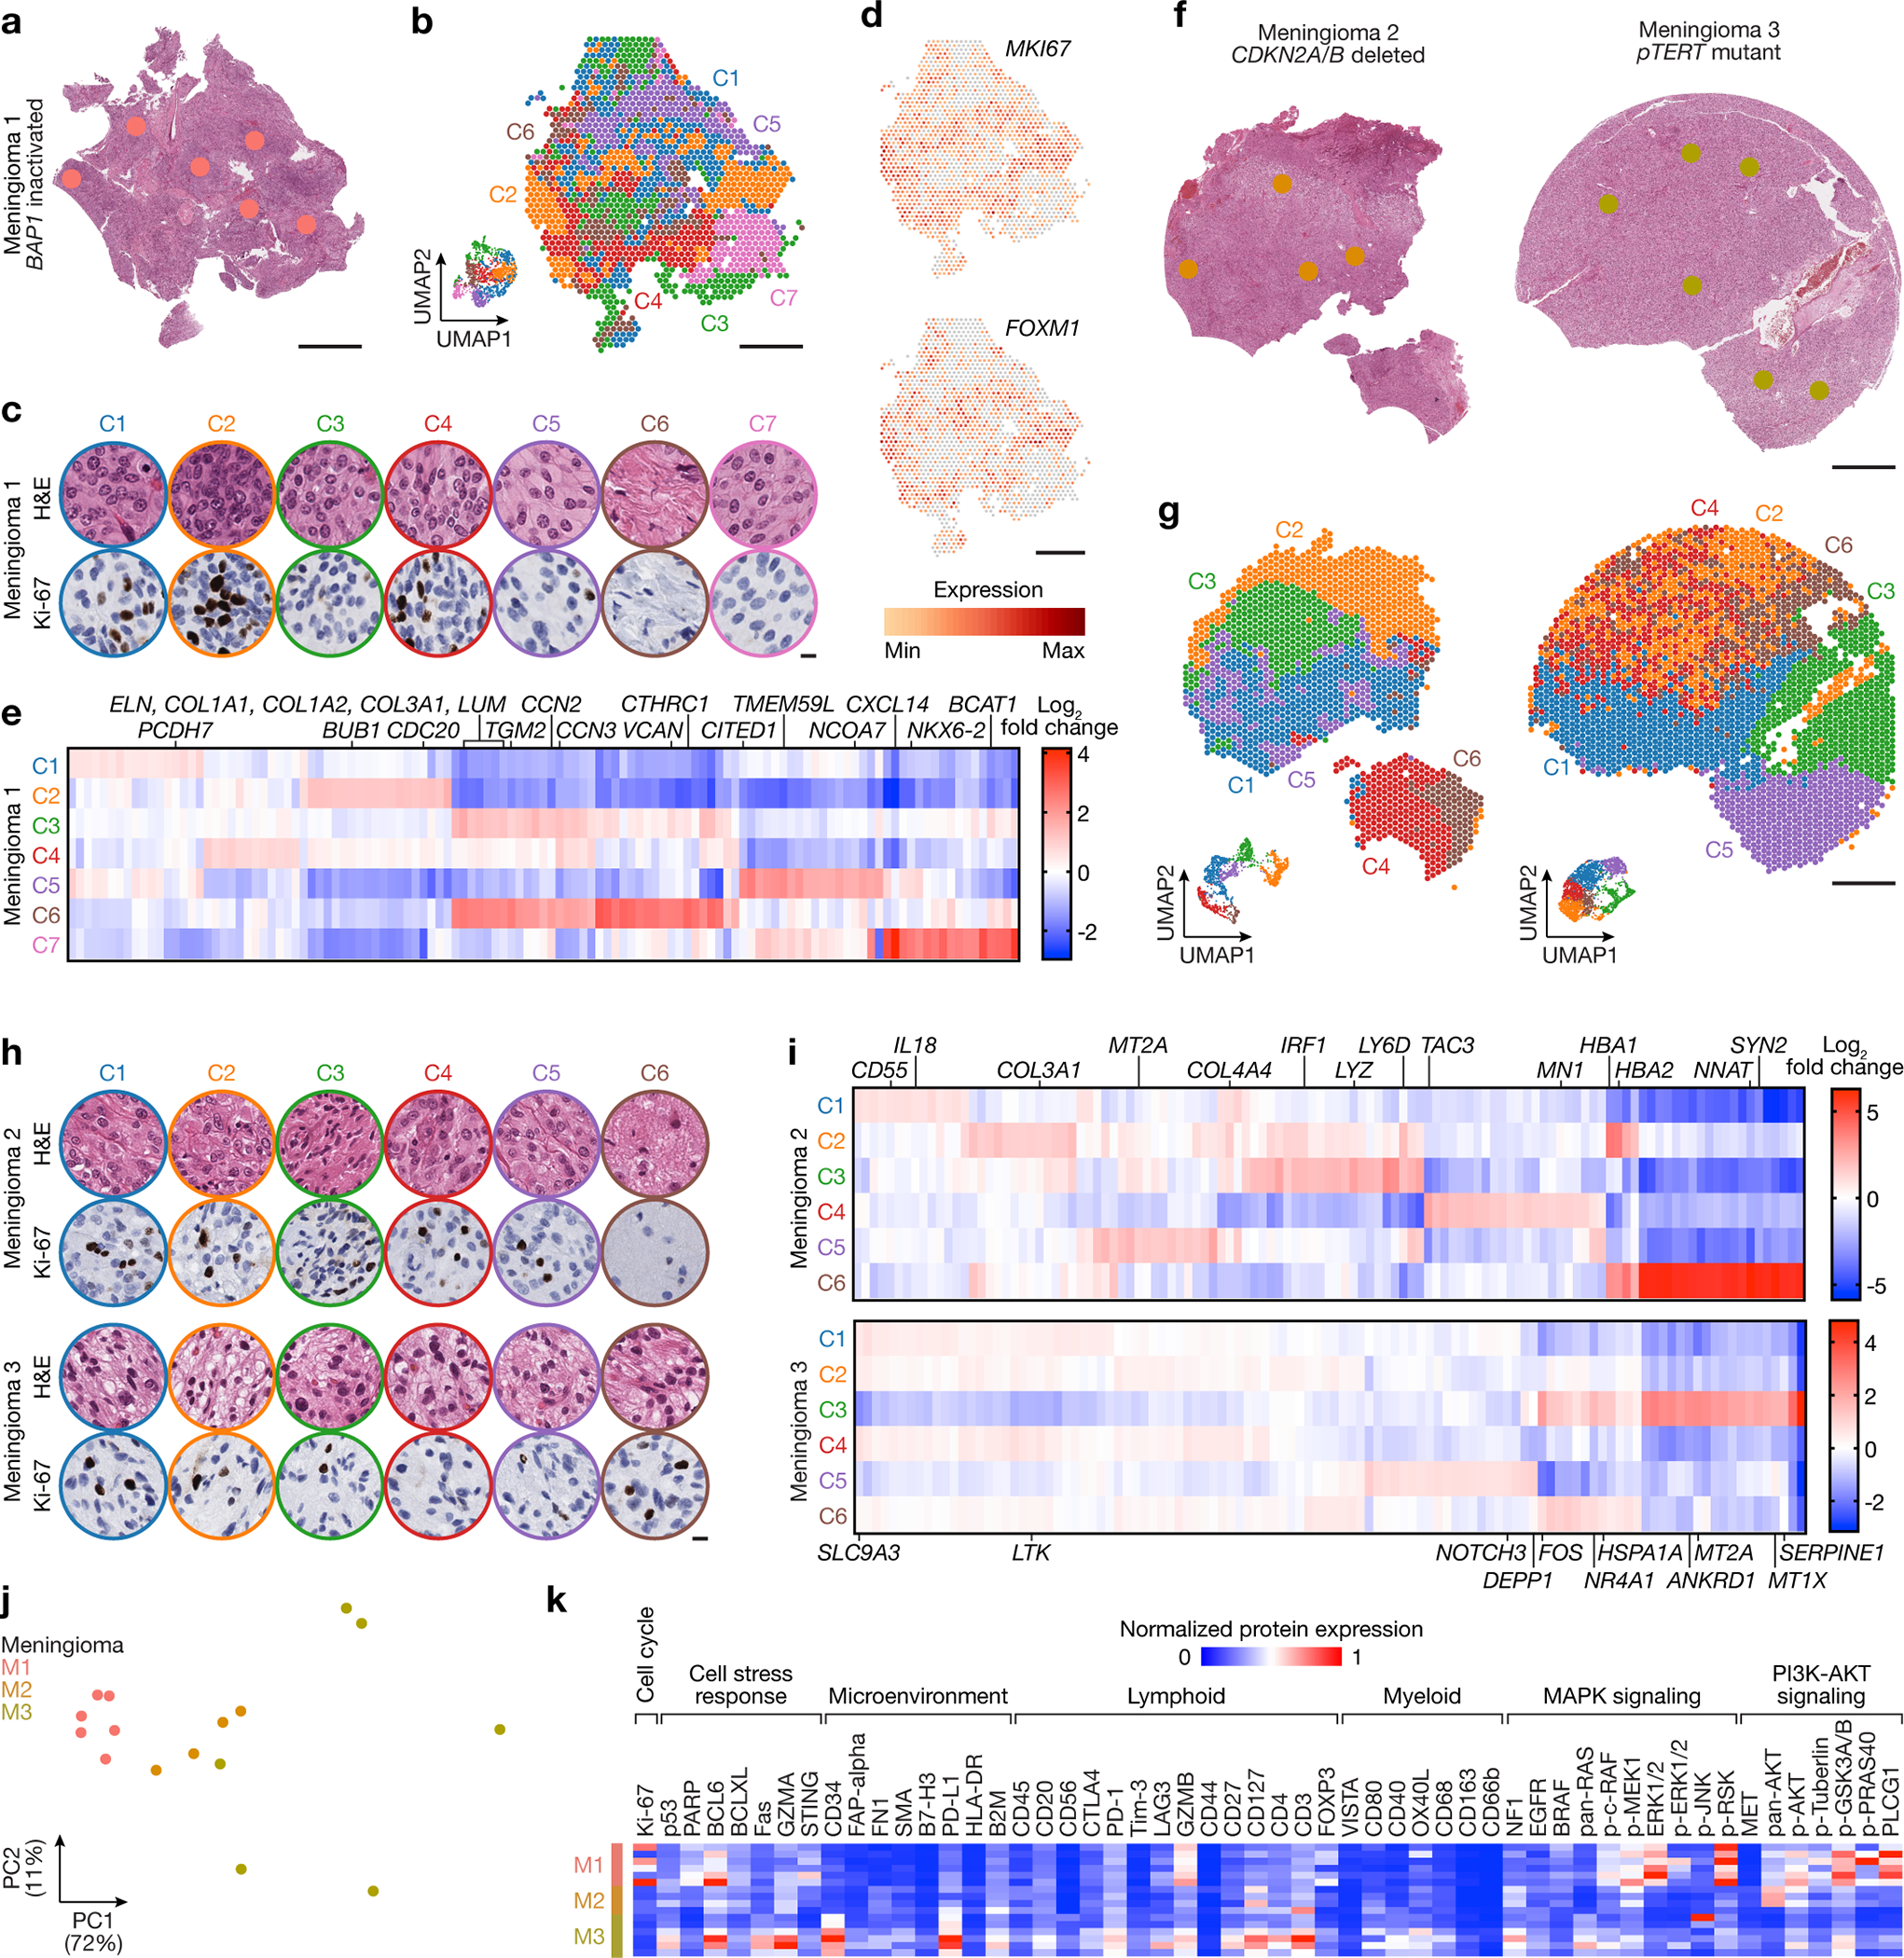
Spatial transcriptomics and protein profiling of meningiomas 1–3 (M1–3) with driver mutations associated with adverse clinical outcomes, such as BAP1 loss (M1), CDKN2A/B loss (M2), or TERT promoter mutation (M3). a, M1 H&E-stained section showing regions of spatial protein profiling. Scale bar, 1mm. b, Spatial distribution of unsupervised hierarchical spatial transcriptome clusters from M1. Insert shows Uniform manifold approximation and project (UMAP) analysis of M1 spatial transcriptomes. Scale bar, 1mm. c, Representative H&E morphology and Ki-67 immunohistochemistry (IHC) of spatial transcriptome clusters from M1. Colors correspond to spatial transcriptomes from b. Scale bar, 10μm. d, Spatial distribution and expression of MKI67 or FOXM1 transcripts from M1. Scale bar, 1mm. e, Top 119 differentially expressed genes across unsupervised hierarchical spatial transcriptome clusters from M1. f, M2 (left) or M3 (right) H&E-stained sections showing regions of spatial protein profiling. Scale bar, 1mm. g, Spatial distribution of unsupervised hierarchical spatial transcriptome clusters from M2 (left) or M3 (right). Inserts show UMAP analyses of M2 or M3 spatial transcriptomes. Scale bar, 1mm. h, Representative H&E morphology and Ki-67 IHC of spatial transcriptome clusters from M2 (top) or M3 (bottom). Colors correspond to spatial transcriptomes from g. Scale bar, 10μm. i, Top differentially expressed genes across unsupervised hierarchical spatial transcriptome clusters from M2 (top, 115 genes) or M3 (bottom, 110 genes). j, Principal component (PC) analysis of spatial protein profiling from M1–3. k, Differentially expressed spatial proteins from M1–3 (all with Student’s t test, one-sided, p≤0.05 for head-to-head comparisons of one meningioma to at least one other meningioma).
Fig 3. Spatial expansion of sub-clonal copy number variants underlies high-grade meningioma recurrence.
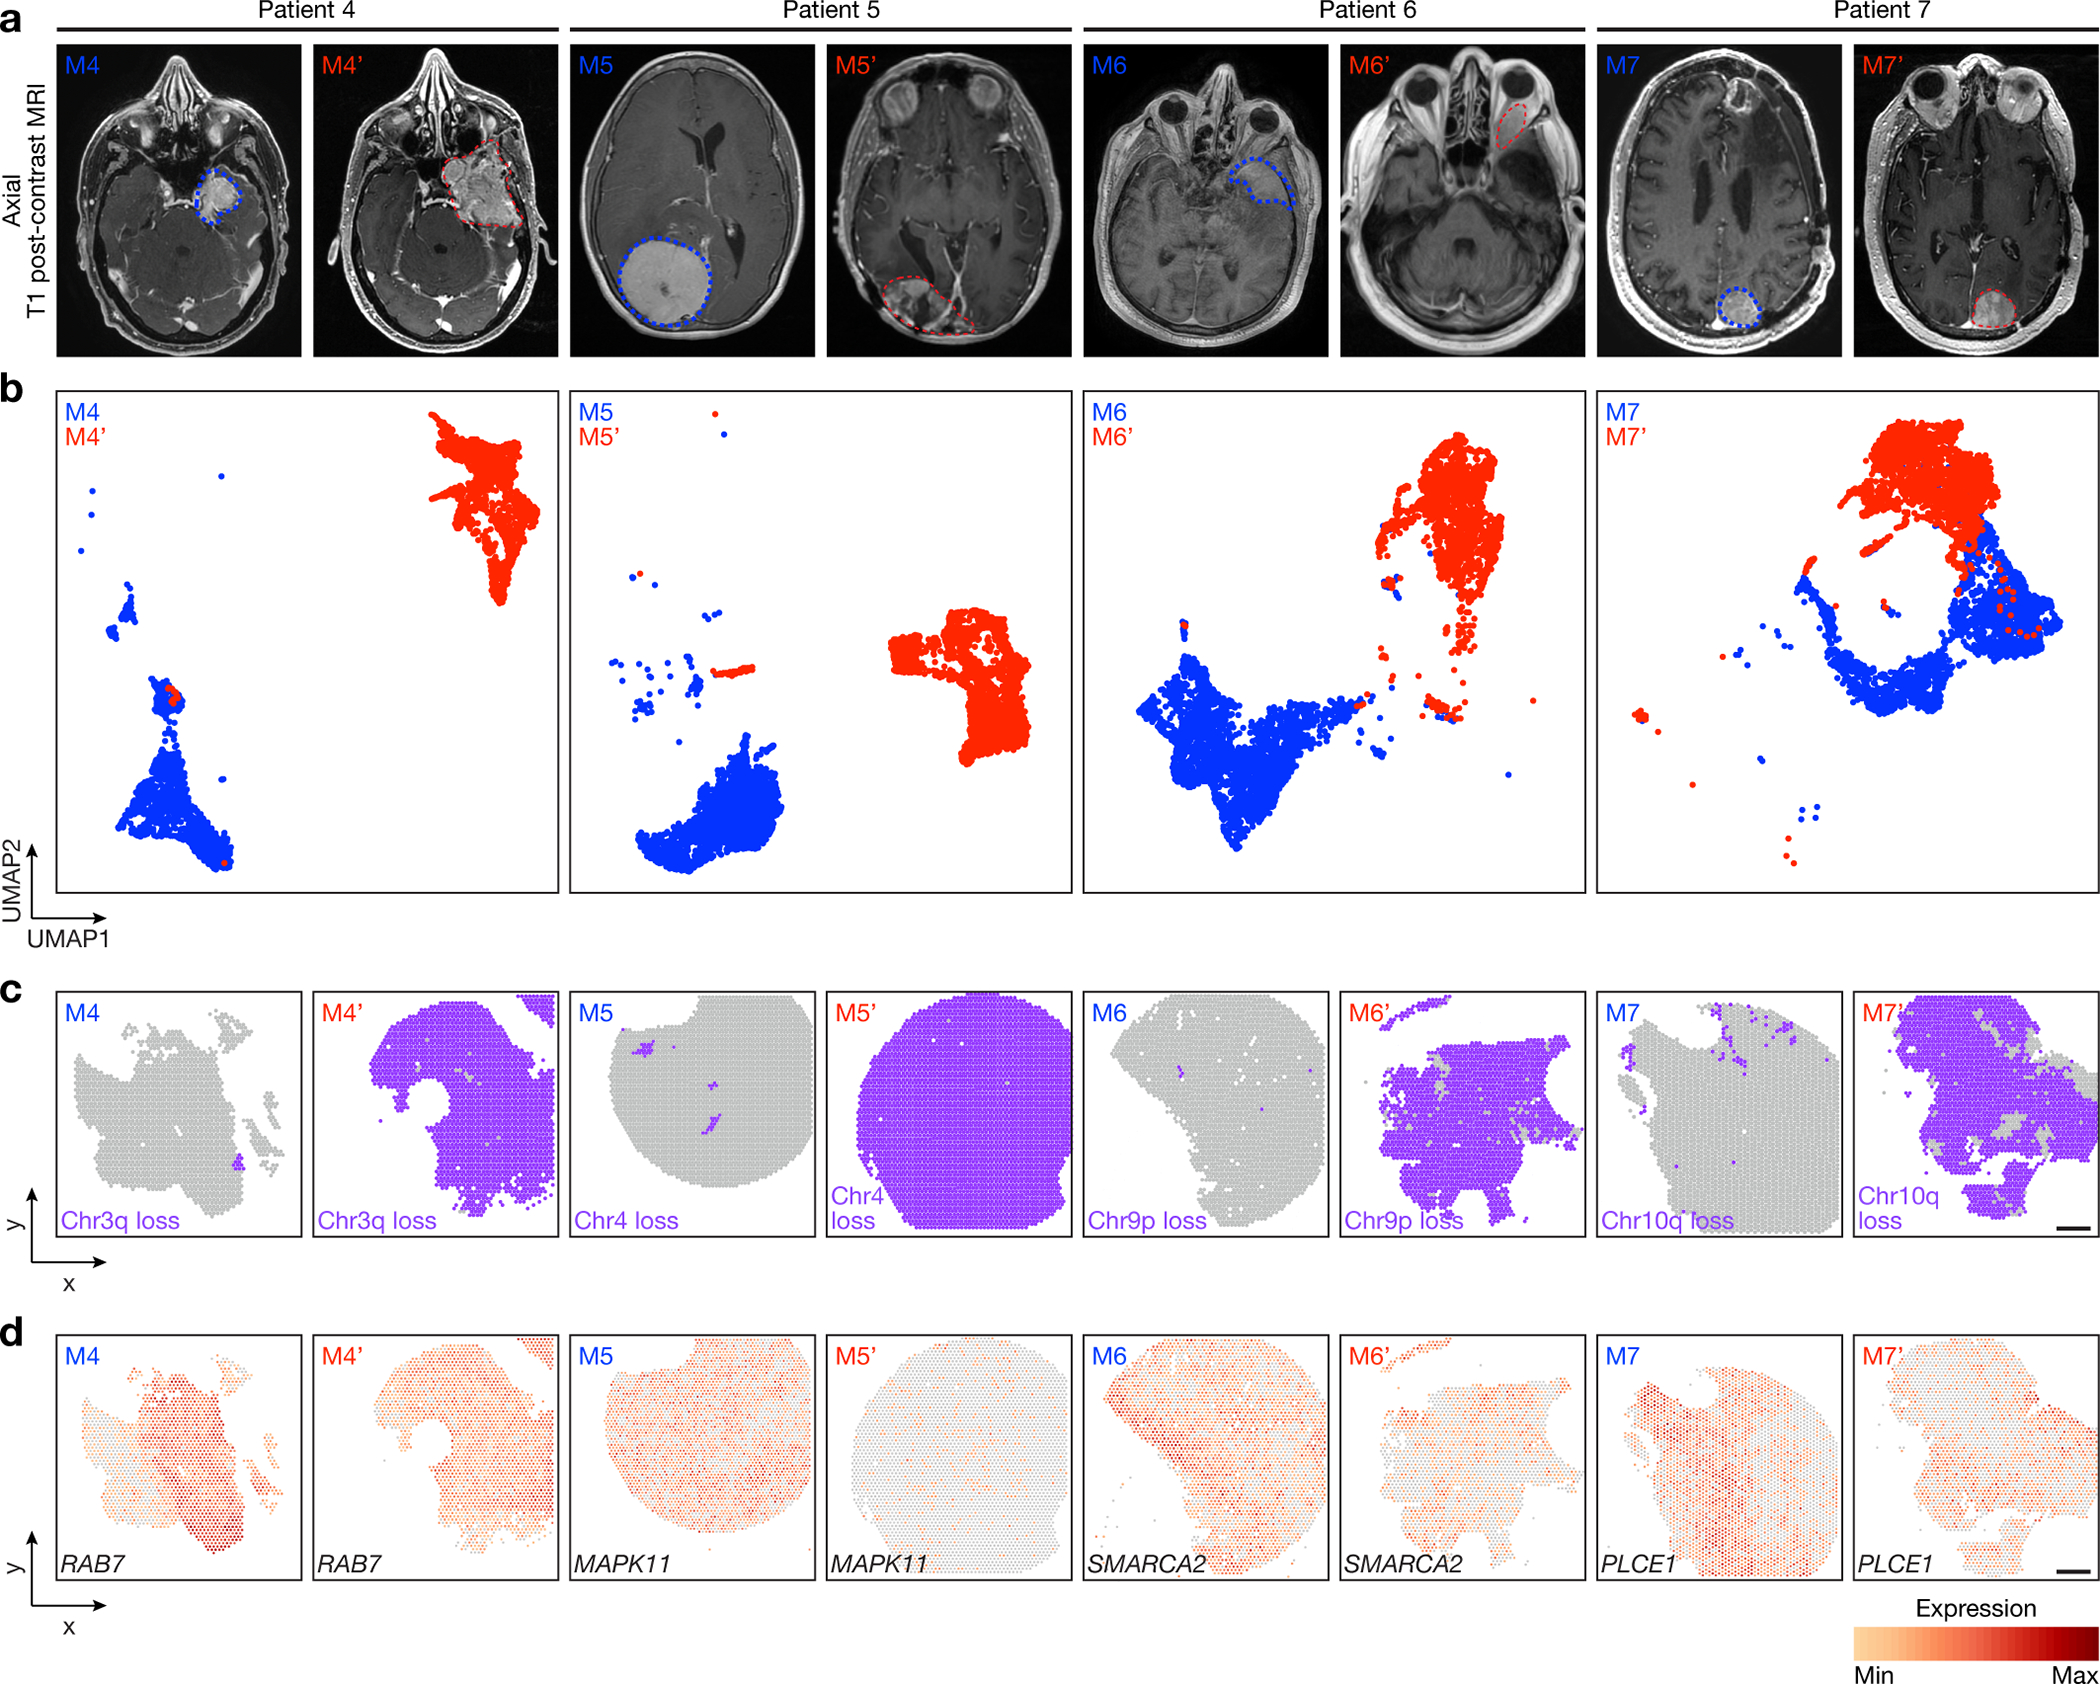
Spatial transcriptomics and protein profiling of matched pairs of primary and recurrent meningiomas from patients 4–7 (M4 and M4’, M5 and M5’, M6 and M6’, and M7 and M7’). a, Preoperative T1 post-contrast magnetic resonance imaging (MRI) of matched pairs of primary (blue, M4, M5, M6, M7) and recurrent (red, M4’, M5’, M6’, M7’) meningiomas. b, UMAP analysis of matched pairs of primary and recurrent meningioma spatial transcriptomes after Harmony batch correction. Scale bar, 1mm. c, Spatial distribution of unsupervised hierarchical spatial transcriptome clusters harboring divergent copy number variants from InferCNV. Scale bar, 1mm. d, Spatial distribution of differentially expressed genes associated with copy number variants across matched pairs of primary and recurrent meningiomas. Scale bar, 1mm.
Fig. 4. Decreased immune infiltration, decreased MAPK signaling, increased PI3K-AKT signaling, and increased cell proliferation underlie high-grade meningioma recurrence.
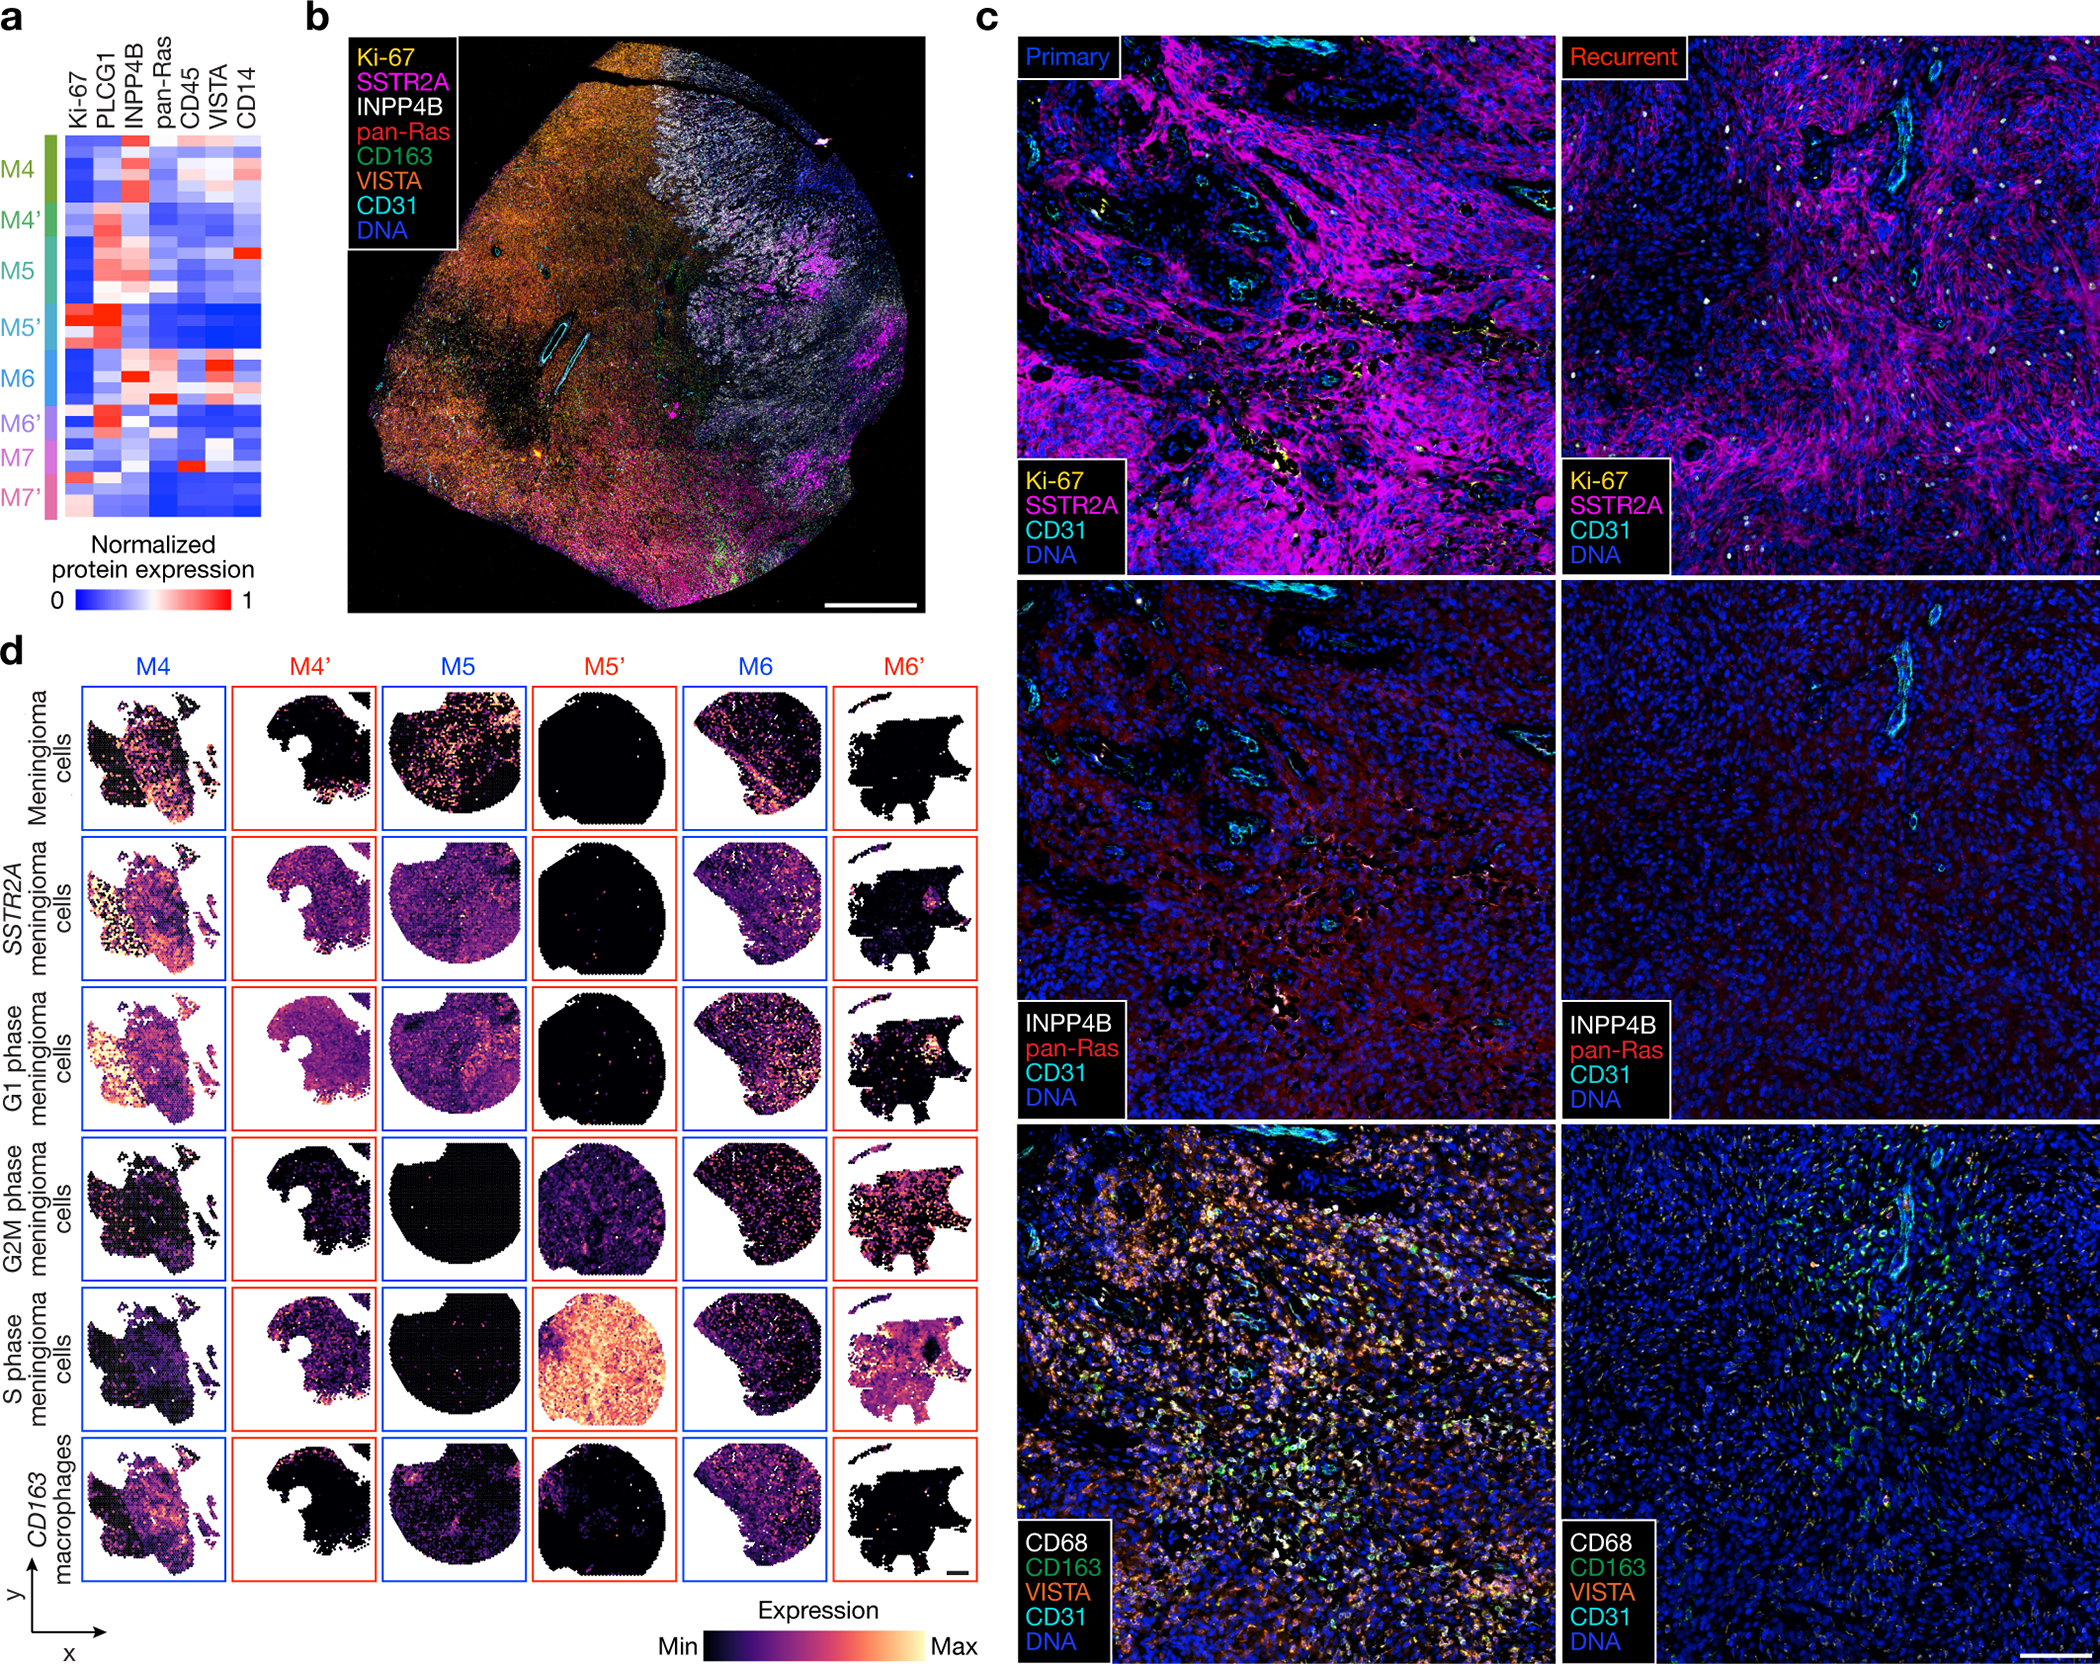
a, Differentially expressed spatial proteins from M4–7’ (all with Student’s t test, one-sided, p≤0.05 for at least 3 of 4 primary versus recurrent meningioma comparisons). b, Representative image of multiplexed seqIF microscopy showing intratumor heterogeneity of signaling mechanisms and cell types in the region of M9 with WHO grade 2 (left) and WHO grade 3 (right) histology, as well as ARID1A and Chr4/14q loss. Scale bar, 1mm, single low power field provided. c, Multiplexed seqIF microscopy showing temporal evolution of signaling mechanisms and cell types in primary versus recurrent meningiomas. Images from M4 and M4’ that are representative of matched pairs of primary and recurrent meningiomas from patients 4–7 (M4 and M4’, M5 and M5’, M6 and M6’, and M7 and M7’). Scale bar, 100μm, similar across 3 high-power field replicates per tumor. d, Spatial deconvolution of meningioma single-cell RNA sequencing showing temporal evolution of cell types from matched pairs of primary (blue) and recurrent (red) meningiomas. Scale bar, 1mm.
Fig 5. Regionally distinct sub-clonal spatial transcriptomes underlie histological heterogeneity in high-grade meningioma.
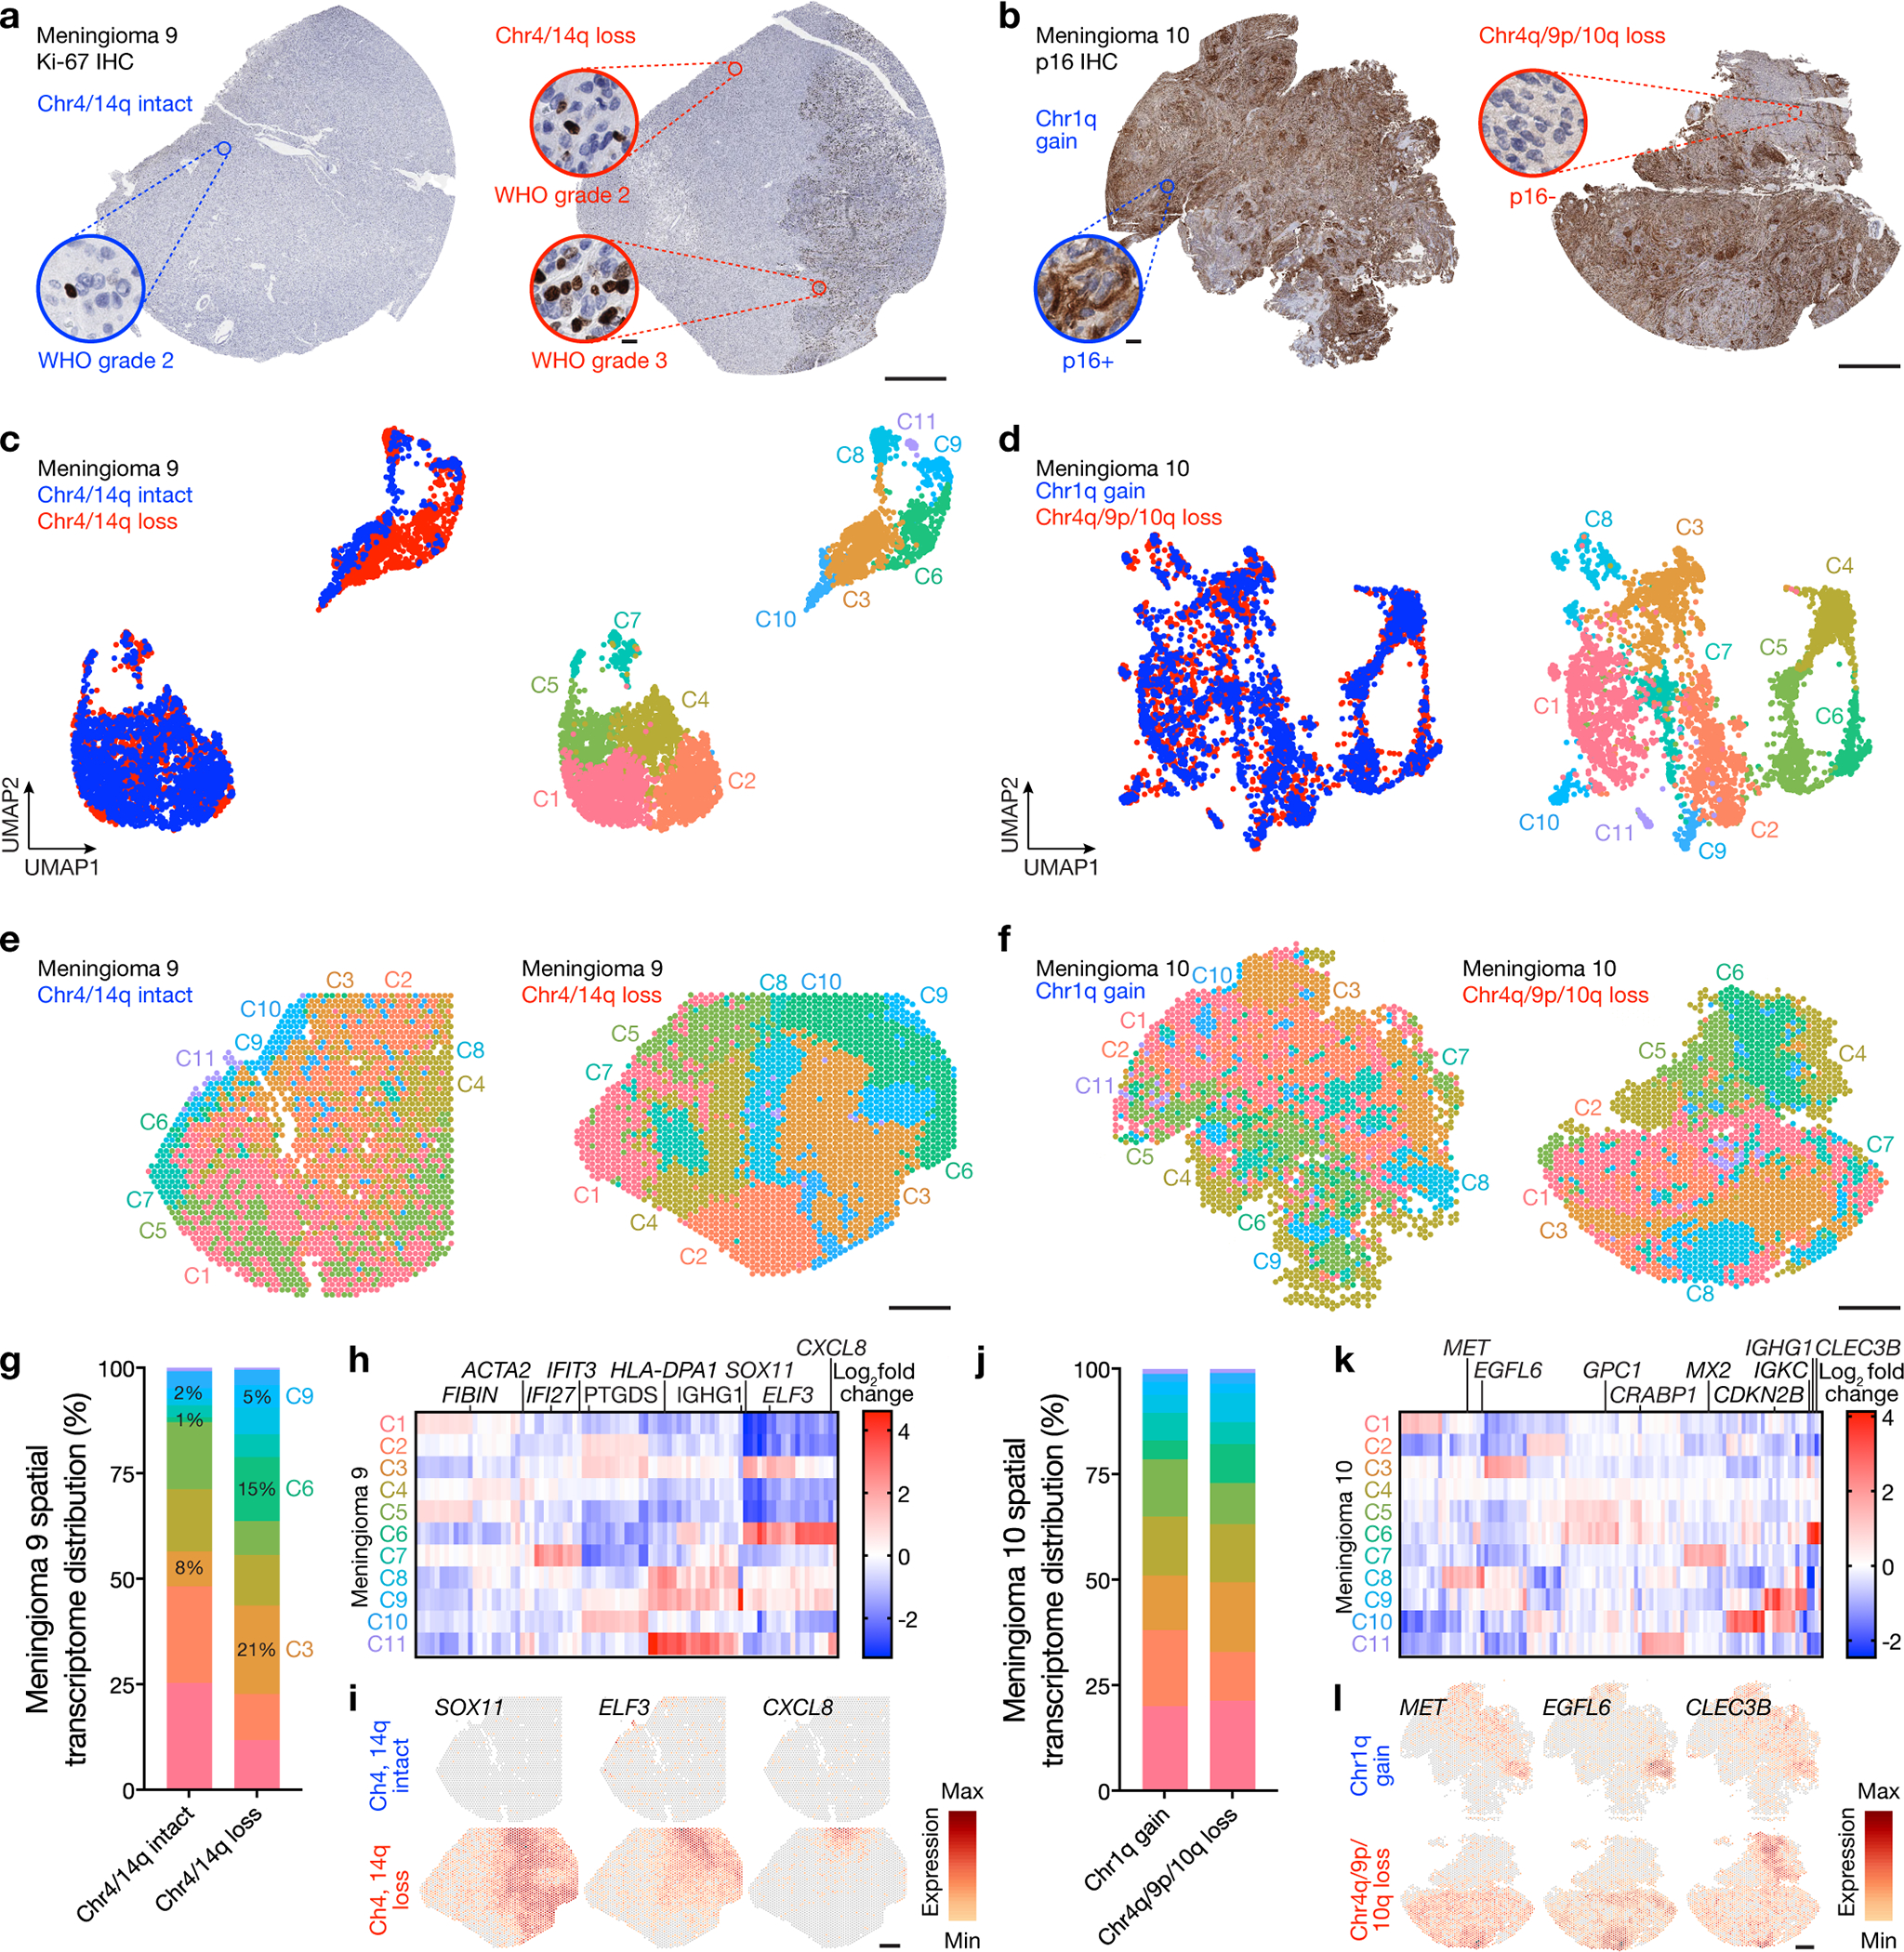
a, Ki-67 immunohistochemistry (IHC) of regionally distinct samples from M9 demonstrating heterogeneous histological (WHO grade 2 or 3), mutational (ARID1A, ASXL1), and cytogenetic (chromosome 4, 14q) features (Fig. 1b). b, p16 IHC of regionally distinct samples from M10 demonstrating heterogeneous histological (p16, Ki-67) and cytogenetic (chromosome 1q, 4q, 9p, 10q) features (Fig. 1b). c, UMAP analysis of M9 spatial transcriptomes after Harmony batch correction shaded by region of origin (left) or unsupervised hierarchical clusters (right). Scale bar, 1mm. d, UMAP analysis of M10 spatial transcriptomes after Harmony batch correction shaded by region of origin (left) or unsupervised hierarchical clusters (right). Scale bar, 1mm. e, Spatial distribution of unsupervised hierarchical spatial transcriptome clusters from M9 after Harmony batch correction. Scale bar, 1mm. f, Spatial distribution of unsupervised hierarchical spatial transcriptome clusters from M10 after Harmony batch correction. Scale bar, 1mm. g, Distribution of unsupervised hierarchical spatial transcriptome clusters from M9 after Harmony batch correction. Spatial transcriptome clusters correlating with WHO grade 3 histology are annotated. h, Top 89 differentially expressed genes across unsupervised hierarchical spatial transcriptome clusters from M9. I, Spatial distribution of differentially expressed genes associated with histological variability across regionally distinct samples from M9. Scale bar, 1mm. j, Distribution of unsupervised hierarchical spatial transcriptome clusters from M10 after Harmony batch correction. k, Top 110 differentially expressed genes across unsupervised hierarchical spatial transcriptome clusters from M10. l, Spatial distribution of differentially expressed genes associated with histological variability across regionally distinct samples from M10. Scale bar, 1mm.
Fig. 6. High-grade meningiomas are distinguished by regionally distinct intratumor immune infiltration, MAPK signaling, PI3K-AKT signaling, and cell proliferation.
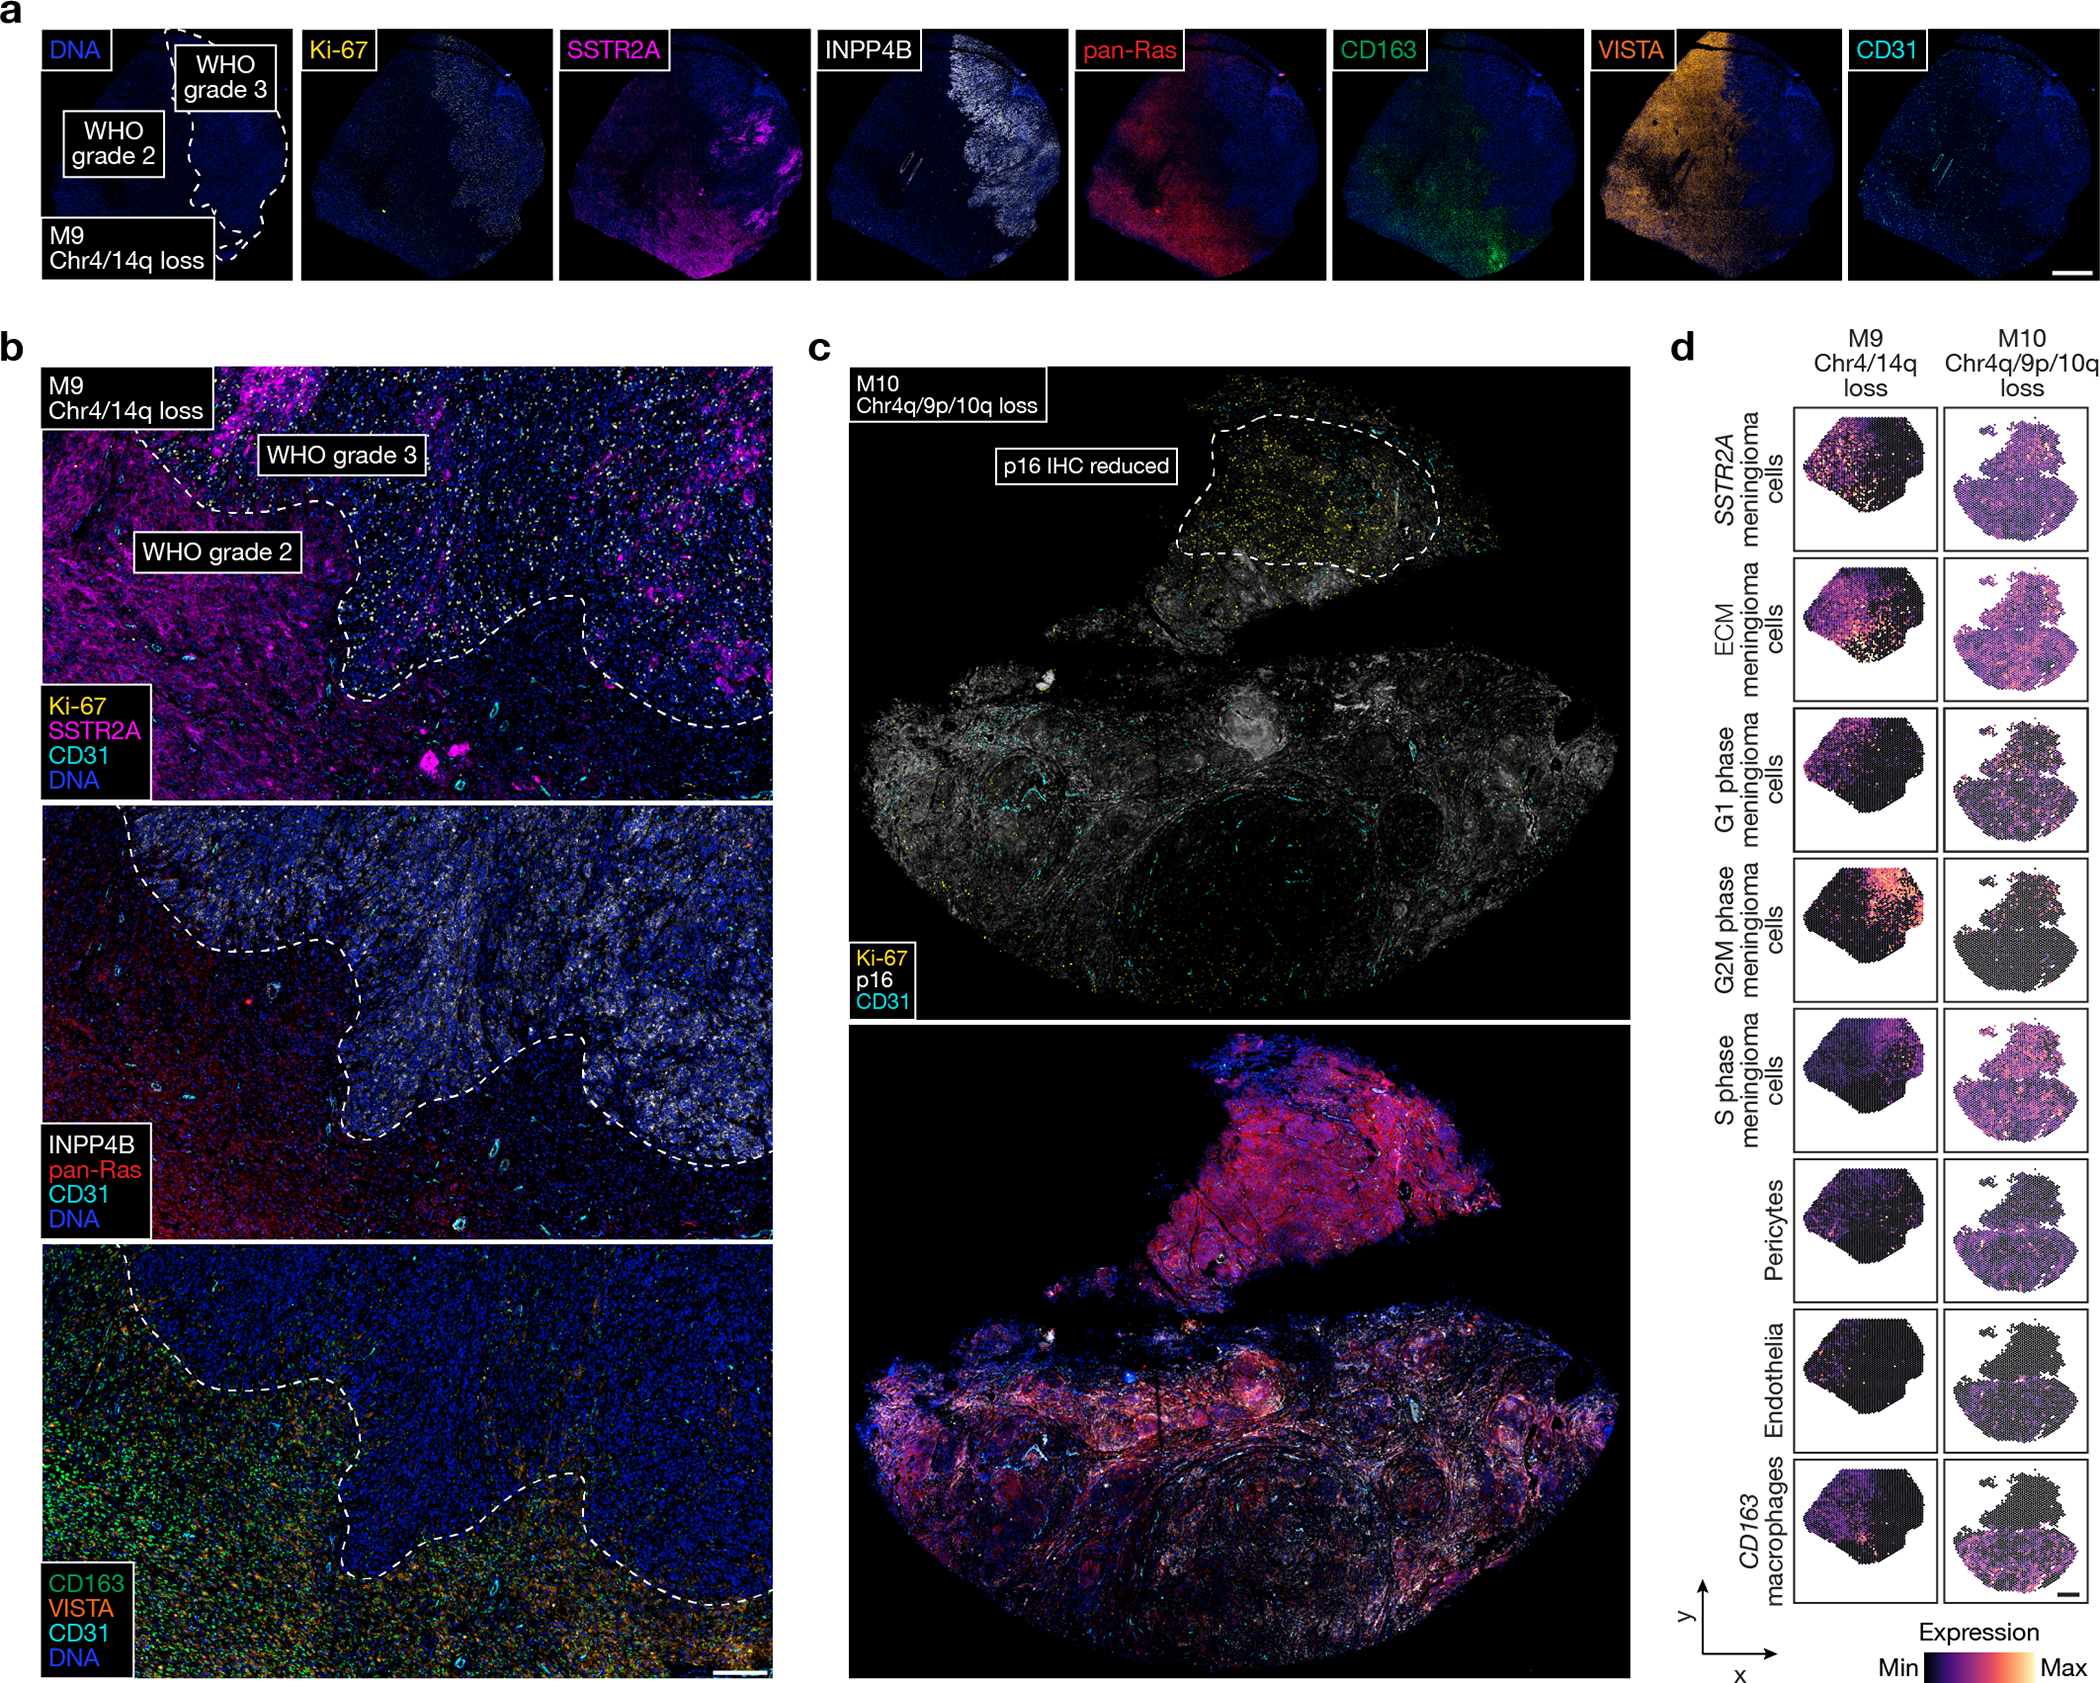
a, Multiplexed seqIF microscopy showing intratumor heterogeneity of signaling mechanisms and cell types in the region of M9 with WHO grade 2 (left) and WHO grade 3 (right) histology, as well as ARID1A and Chr4/14q loss. Scale bar, 1mm. b, Multiplexed seqIF microscopy showing M9 from a at higher magnification. Scale bar, 200μmm, similar across 3 high-power field replicates. c, Multiplexed seqIF microscopy showing intratumor heterogeneity of signaling mechanisms in the region of M10 with reduced immunostaining for p16 (top) and Chr4q/9p/10q loss. Scale bar, 1mm, single low power field provided. d, Spatial deconvolution of meningioma single-cell RNA sequencing showing spatial evolution of cell types from in M9 in a and b (left) or M10 in c (right). Scale bar, 1mm.
Fig 7. A preclinical platform for testing personalized systemic therapies to overcome intratumor heterogeneity in high-grade meningiomas.
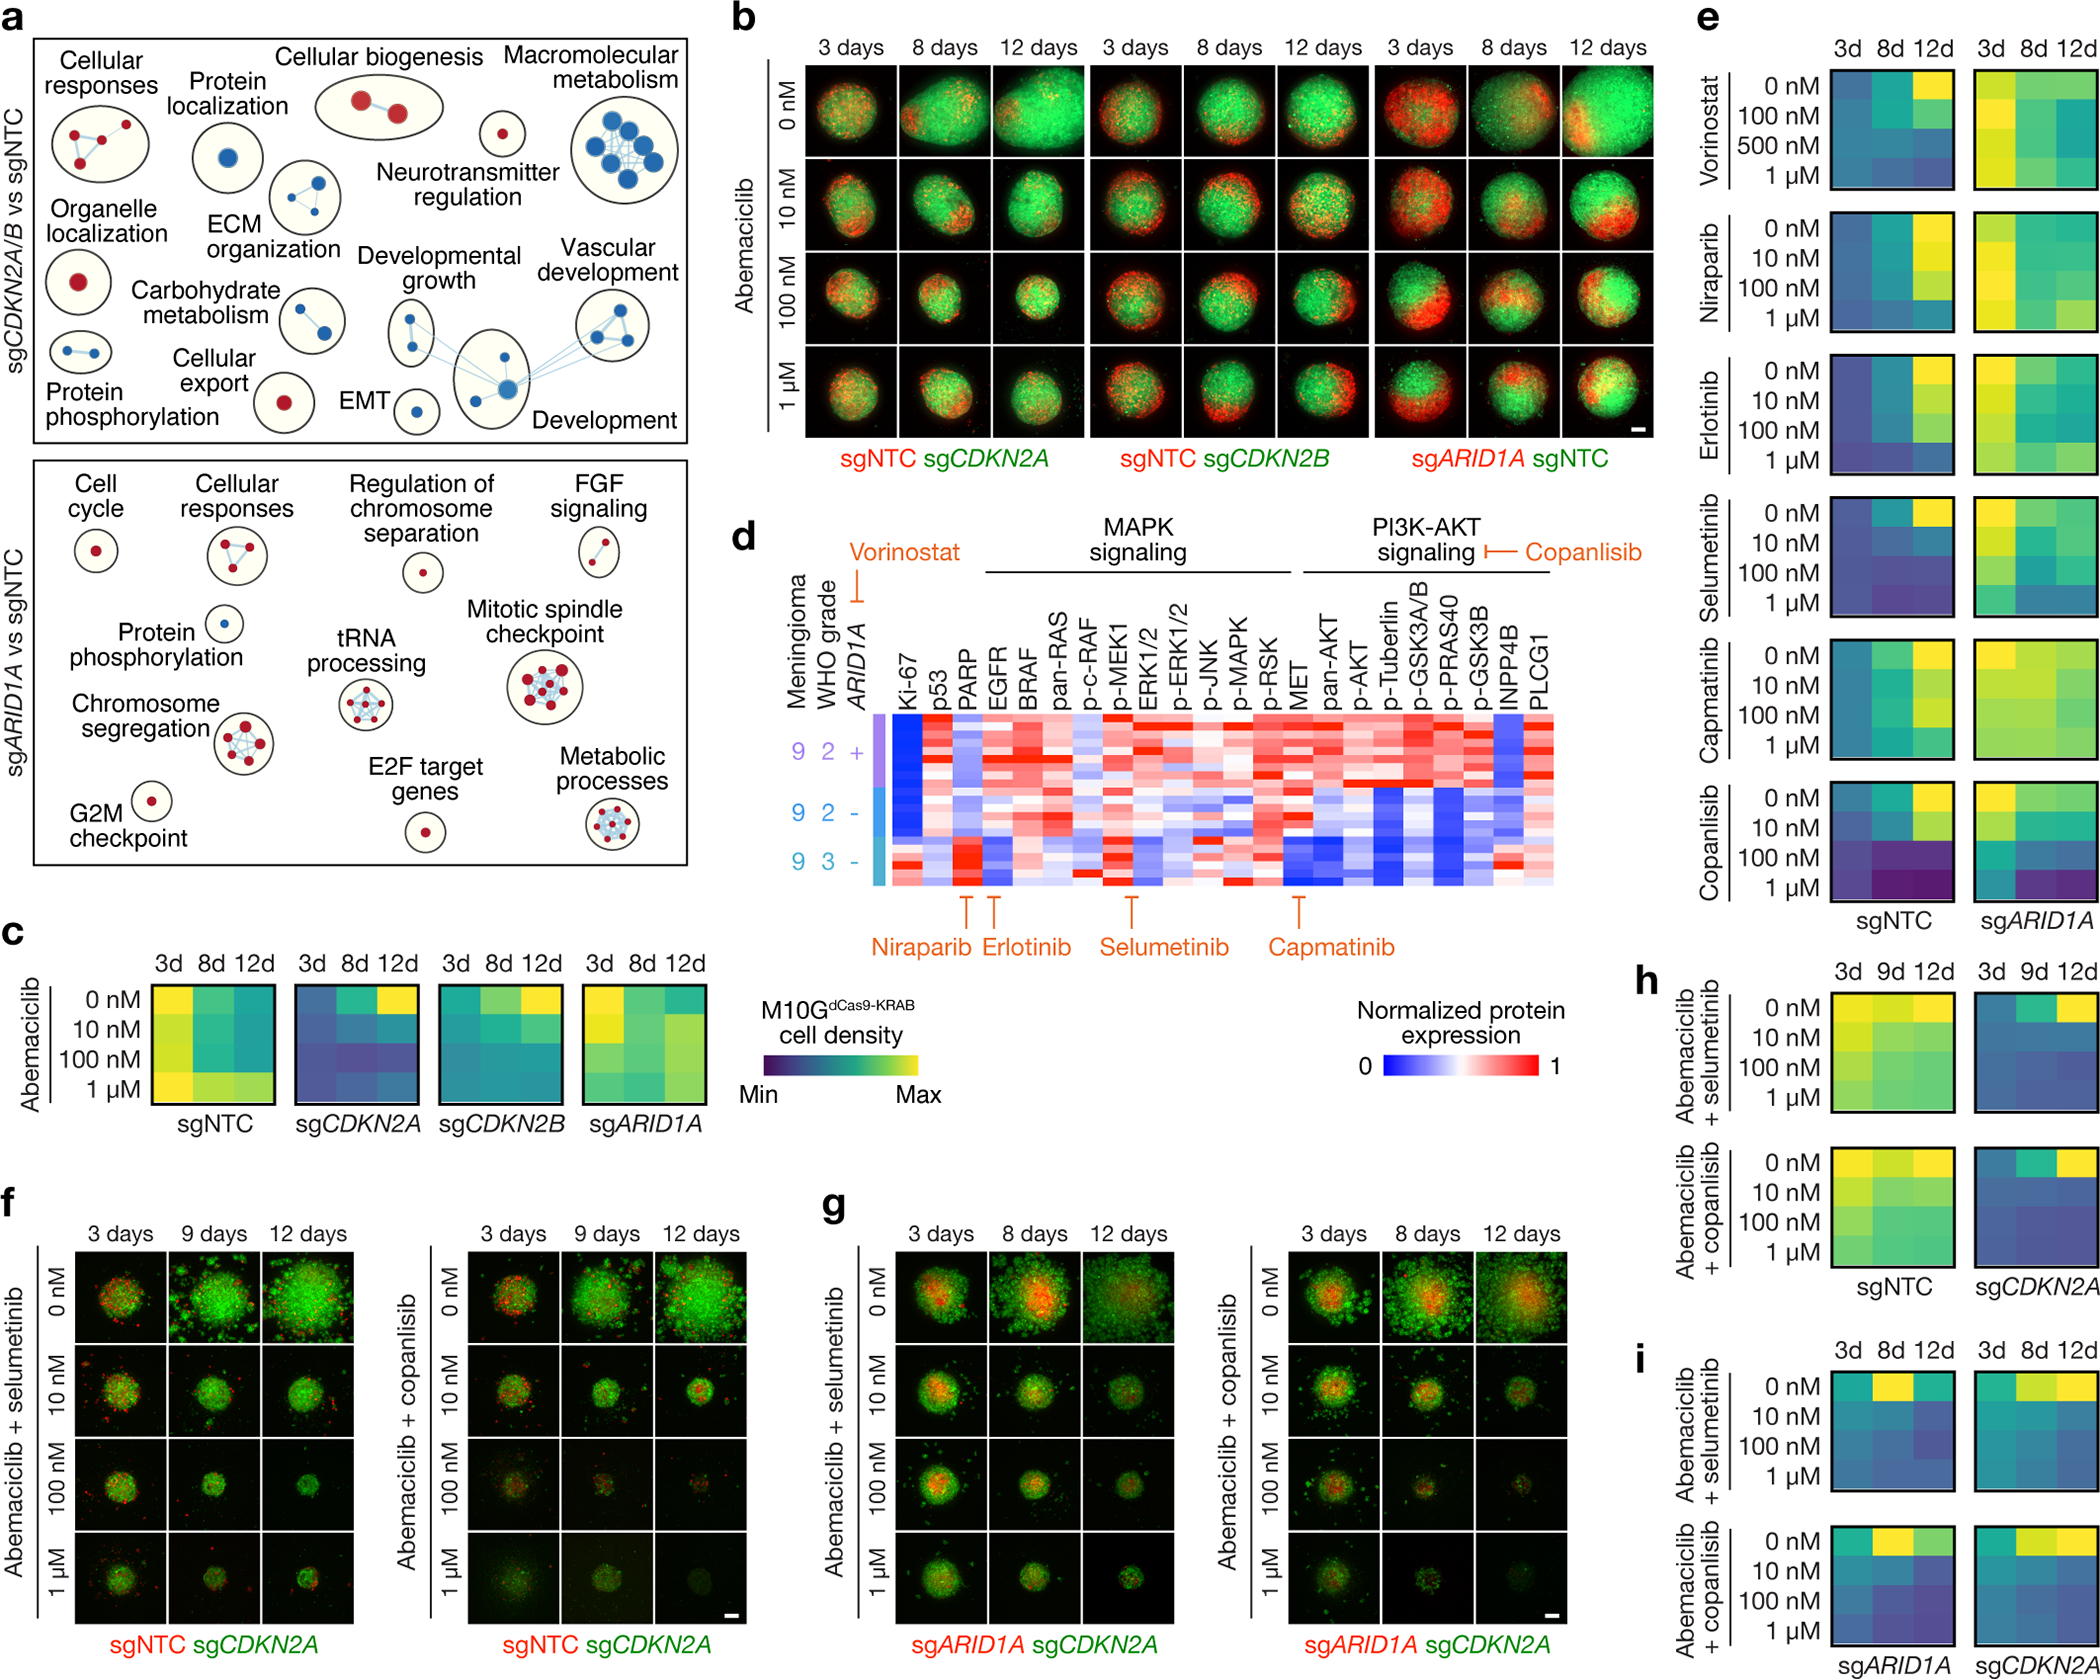
a, Network of gene circuits distinguishing M10GdCas9-KRAB meningioma cells expressing sgNTC (n=3), sgCDKN2A (n=3), sgCDKN2B (n=3), or sgARID1A (n=3) using RNA sequencing. Nodes represent pathways and edges represent shared genes between pathways (p≤0.05, FDR≤0.05). Red nodes are enriched and blue nodes are suppressed in experimental versus sgNTC control conditions. b, Abemaciclib treatments of 3D co-cultures of M10GdCas9-KRAB meningioma cells expressing sgNTC, sgCDKN2A, sgCDKN2B, or sgARID1A. Scale bar, 100μm. c, Quantification of abemaciclib treatments of 3D co-cultures of M10GdCas9-KRAB meningioma cells expressing sgNTC, sgCDKN2A, sgCDKN2B, or sgARID1A. Representative of 8–10 biological replicates per condition. d, Differentially expressed spatial proteins from M9 (all with Student’s t test, one-sided, p≤0.05 for at least 2 of 3 regionally distinct comparisons). e, Quantification of molecular therapy treatments of 3D co-cultures of M10GdCas9-KRAB meningioma cells expressing sgNTC or sgARID1A. Representative of 8–10 biological replicates per condition. Scale from c. f, Combination molecular therapy treatments of 3D co-cultures of M10GdCas9-KRAB meningioma cells expressing sgCDKN2A or sgNTC. Scale bar, 100μm. g, Combination molecular therapy treatments of 3D co-cultures of M10GdCas9-KRAB meningioma cells expressing sgCDKN2A or sgARID1A. Scale bar, 100μm. h, Quantification of combination molecular therapy treatments of 3D co-cultures of M10GdCas9-KRAB meningioma cells expressing sgCDKN2A or sgNTC. Representative of 8 biological replicates per condition. Scale from c. i, Quantification of combination molecular therapy treatments of 3D co-cultures of M10GdCas9-KRAB meningioma cells expressing sgCDKN2A or sgARID1A. Representative of 8 biological replicates per condition. Scale from c.
Experimental design and workflow
To define mechanisms underlying meningioma intratumor heterogeneity and evolution, 16 intracranial samples from 10 high-grade meningiomas (designated M1–10) that were resected from 9 patients were assembled for clinical, histological, and molecular analyses (Fig. 1a, Supplementary Table 1). Histological and molecular analyses of all samples were performed using the most recent criteria from the World Health Organization (WHO) Classification of Tumors of the Central Nervous System14, including targeted next generation DNA sequencing23 to define SSVs and CNVs that are associated with high-grade meningioma classification and adverse clinical outcomes8,9,24–27 (Supplementary Tables 1 and 2). All samples were analyzed using immunohistochemistry (IHC) for cell proliferation (Ki-67), cell cycle regulation (p16), and chromatin markers (H3K27me3), each of which can also be associated with clinical outcomes for patients with meningiomas28–30. DNA methylation grouping6 and targeted gene expression profiling21 were performed on all samples (Supplementary Tables 1 and 3). These comprehensive clinical, histological, and molecular analyses identified clinical samples with suitable RNA content to study the molecular (M1–3), temporal (M4–7), and spatial evolution (M8–10) of human meningiomas (Fig. 1b).
Spatial transcriptomic profiling of 50μm regions from continuous arrays tiled across 6mm cores was performed on all meningiomas using an approach that integrates approximately 10 cells per capture area31 (Extended Data Fig. 1a). Core selection for each sample was guided by morphological or IHC heterogeneity of whole mount formalin-fixed paraffin-embedded (FFPE) tumor sections. Spatial transcriptomes were aligned with hematoxylin and eosin (H&E) histological images using unique oligonucleotide barcodes corresponding to array positions (Extended Data Fig. 1b). The Harmony bioinformatic pipeline was used for sample integration and batch-correction32 (Extended Data Fig. 1c), and uniform manifold approximation and projection (UMAP) analysis of 38,718 spatial transcriptomes demonstrated 30 spatial gene expression programs across 16 high-grade meningioma samples (range: 4–15 programs/sample) (Fig. 1c, d, Extended Data Fig. 2a–c and Supplementary Table 4). Six spatial gene expression programs that included transcriptomes from all samples were distinguished by enrichment of genes involved in neural development (SIM2, VIT in C1 and C7), angiogenesis (THBS2, HHIP in C3), meningeal homeostasis and neurotransmitter processing (PTGDS, LCNL1 in C5), bone differentiation (MAP1LC3C, ALPL in C9), and differentiation of the neural crest (S100A, S100B in C14), a multipotent embryonic cell population that gives rise to the meninges33,34 (Extended Data Fig. 2a–c and Supplementary Table 4).
Spatial protein profiling of 200μm regions from 6mm cores was performed on all high-grade meningiomas using an approach that integrates approximately 190 cells per capture area35 (range 115–283 cells/region). Laser microdissection and next generation sequencing was used to quantify binding of 72 antibodies that were conjugated to unique oligonucleotide barcodes from 82 regions (range: 3–12 regions/sample), revealing significant intratumor and intertumor heterogeneity across high-grade meningiomas (Fig. 1e and Supplementary Table 5). Principal component analysis of spatial protein profiling data demonstrated divergent biochemical mechanisms within and across high-grade meningiomas (Extended Data Fig. 2d).
Using these clinical, histological, molecular, and spatial data, the study cohort was divided into 3 groups to study genomic, biochemical, and cellular mechanisms underlying intratumor heterogeneity in the context of molecular (Fig. 2), temporal (Fig. 3, 4), and spatial evolution of meningiomas (Fig. 5, 6). Findings were validated using multiplexed seqIF microscopy, spatial deconvolution of meningioma single-cell transcriptomes, and bulk RNA sequencing from 502 meningiomas6,11 alongside CRISPR interference, pharmacology, and live cell imaging in preclinical meningioma 3D co-culture models (Fig. 7).
Divergent intratumor gene and protein expression programs
The WHO defines meningioma grades according to histological features such as mitotic count and brain invasion, and rare molecular features such as CDKN2A/B homozygous deletions or hotspot TERT promoter mutations that are sufficient for diagnosis of WHO grade 3 meningioma14. Most WHO grade 1 meningiomas can be effectively treated with surgery or radiotherapy, but many WHO grade 2 or grade 3 (high-grade) meningiomas, which account for 20–30% of cases1,2, are resistant to treatment and cause significant neurological morbidity and mortality16. Morphological features can influence meningioma WHO grading, and rhabdoid morphology associated with inactivating BAP1 mutation has also been associated with high-grade behavior36. Thus, current clinical classification systems group meningiomas with different oncogenic mutations into the same high-grade group, which may not provide an optimal framework for clinical trials. To determine if high-grade meningiomas were associated with convergent or divergent intratumor gene or protein expression programs, spatial genomic and biochemical mechanisms were studied across high-grade meningiomas harboring either BAP1 inactivation (M1), CDKN2A/B homozygous deletion (M2), or TERT promoter mutation (M3) from 3 different patients (Extended Data Fig. 3a, b and Supplementary Table 1). Results from high-grade meningiomas were compared to an additional 4,426 spatial transcriptomes from histologically WHO grade 1 meningiomas (LGM1, LGM2) that lacked unfavorable CNVs or somatic short variants that are associated with adverse clinical outcomes (Supplementary Table 6).
Spatial gene expression programs in M1 correlated with morphological features and immunostaining for Ki-67 (Fig. 2a–c). Spatial transcriptomes with increased immunostaining for Ki-67 (C2, C4) were enriched in MKI67 and FOXM1, a driver of meningioma cell proliferation that is enriched in high-grade meningiomas and meningiomas from the Hypermitotic DNA methylation group6,37 (Fig. 2d). Differential expression analysis of spatial transcriptomes identified 2 clusters (C3, C6) that were distinguished by expression of collagens (COL1A1, COL1A2, COL3A1) and other extracellular matrix genes (LUM, ELN, VCAN) and correlated with regions of increased connective tissue on H&E sections (Fig. 2a, c, e and Extended Data Fig. 3b). The remaining spatial gene expression programs in M1 were comprised of variably cellular tumor with differential expression of Wnt pathway (CTHRC1, TMEM59L), inflammatory (CXCL14), cell proliferation (CCN2, CCN3, CITED1, BCAT1, NCOA7), cell differentiation (NKX6–2), or cell adhesion genes (PCDH7, TGM2) (Fig. 2e). Clusters with increased immunostaining for Ki-67 were distinguished by non-overlapping cell proliferation genes (BUB1, CDC20 in C2, CCN3 in C4) (Fig. 2d, e), suggesting regionally distinct mechanisms that activate the cell cycle exist in individual meningiomas.
Spatial gene expression programs in M2 and M3 also demonstrated heterogeneous ontologies that correlated with morphological features (Fig. 2f–i and Extended Data Fig. 3b). Differential expression analysis of spatial transcriptomes in M2 revealed a connective tissue and hemorrhagic cluster (COL3A1, COL4A4, HBA1, HBA2 in C2), a brain parenchyma cluster (NNAT, SYN2 in C6), and 4 other clusters comprised of variably cellular tumor that were distinguished by enrichment of inflammatory and immune genes (IRF1, CD55, IL18, LYZ, LY6D) (Fig. 2f, h, i and Extended Data Fig. 3b). C4 was comprised of brain-invasive meningioma with enrichment of oncogenic (MN1) and tissue invasion (TAC3) genes. C5 from M2 and C3 from M3 showed decreased expression of inflammatory and immune genes but enrichment of MT2A, which is implicated in cell stress, homeostasis, and differentiation38,39. Other cell stress genes and DNA damage response genes were enriched in C3 from M3 (HSP1A, NR4A1, ANKRD1), and the 5 other spatial gene expression programs in M3 were distinguished by differential expression of ion transport, cell stress, and immune genes that were not differentially expressed in M1 or M2 (SLC9A3, LTK, DEPP1, HSP1A, NOTCH3, FOS, SERPINE1, MT1X) (Fig. 2i). Sample integration and batch-correction with Harmony was unable to identify conserved spatial gene expression programs across M1–3 (Extended Data Fig. 3c–e).
Differential expression analysis of spatial transcriptomes from M1–3 and LGM1–2 following sample integration and batch-correction with Harmony identified 10 clusters across the 5 tumors, with reduced diversity and number of clusters in WHO grade 1 meningiomas compared to high-grade meningiomas (Chi-squared test, p<0.0001) (Extended Data Fig. 4a–c). LGM1 was comprised of spatial transcriptomes from a single cluster (C2, 1788/1813, 99%) that was distinguished by expression of tumor suppressor genes (EGR2, EGR3) (Extended Data Fig. 4d). LGM2 was comprised of spatial transcriptomes from C1 (1879/2613, 72%) and C7 (717/2613, 27%), both of which were associated with expression of tumor suppressor and immune microenvironment genes (SFRP1, SCG2) (Extended Data Fig. 4d). In contrast, spatial transcriptomes from high-grade meningiomas were enriched in cell proliferation genes (MKI67, FOXM1) (Extended Data Fig. 4e).
To determine if spatial CNV heterogeneity underlies differences in the diversity or number of spatial gene expression programs in WHO grade 1 versus high-grade meningiomas, inferCNV40,41 was used to define CNVs from M1–3 and LGM1–2 spatial transcriptomes. Spatial transcriptomes from WHO grade 1 meningiomas did not demonstrate divergent CNVs across clusters, and instead showed concordant CNVs to those identified using bulk next generation sequencing (Extended Data Fig. 4f, Supplementary Table 6). In contrast, spatial transcriptomes from high-grade meningiomas were distinguished by divergent CNVs, including loss of chromosome 18 in C9 compared to C4 and C6 in M3, and multiple chromosome losses (1p, 8p, 9, 19q) in C5 compared to C8 and C10 in M2 (Extended Data Fig. 4f).
WHO grade 1 meningiomas also demonstrated reduced number and diversity of spatial transcriptomic clusters when analyzed separately from high-grade meningiomas. Differential expression analysis of the 4,426 spatial transcriptomes from LGM1–2 identified 5 clusters (Extended Data Fig. 4g–j), whereas analysis of 5,889 spatial transcriptomes from M1–3 identified 13 clusters (Extended Data Fig. 3c–e). Of the 5 clusters from LGM1–2, LGM1 was comprised of C2, C4, and C5, which were distinguished by expression of tumor suppressor genes (EGR2, EGR3) (Extended Data Fig. 4k). C5 was further associated with expression of immune genes (IGHG1, IGHM) that correlated with immune cell infiltration of the dura on H&E sections (Extended Data Fig. 4l). C1 was private to LGM2 and was distinguished by expression of tumor suppressor and immune microenvironment genes (SFRP1, SCG2). C3, which was shared across WHO grade 1 meningiomas, was associated with expression of the endothelial genes (PLVAP, VWF, CD34) and correlated with regions of increased vasculature on H&E sections (Extended Data Fig. 4k, l).
Spatial protein profiling validated divergent signaling mechanisms across spatial transcriptomes from high-grade meningiomas, and revealed heterogeneous cell proliferation, stress, microenvironment, immune, and growth factor signaling pathways in M1–3 (Fig. 2j–k). In support of these data, differential expression analyses using bulk RNA sequencing data from independent meningiomas with BAP1 inactivation (n=5), CDKN2A/B homozygous deletion (n=30), or TERT promoter mutation (n=7)6,11 showed differences in diverse cell proliferation (MKI67, FOXM1, CCN2, CCN3, CITED1, BCAT1, NCOA7, BUB1, CDC20), differentiation (CTHRC1, MT2A, NKX6–2), tissue invasion and adhesion (LUM, TAC3, PCDH7, TGM2), immune (CXCL14, IL18, LYZ, LY6D), and tumor suppressor genes (WT1, MN1) (Supplementary Table 7). Thus, high-grade meningiomas with different oncogenic mutations that are grouped together by current clinical classification systems are distinguished by divergent intratumor gene and protein expression programs.
Spatial sub-clonal copy number variants, signaling mechanisms, and cell types
Surgery is the mainstay of meningioma treatment, but postoperative radiotherapy is recommended to reduce the risk of high-grade meningioma recurrence2,42. Nevertheless, local recurrence of high-grade meningioma is common15, and recurrence is the leading cause of death in patients with meningiomas that are resistant to standard interventions43. Mechanisms underlying meningioma resistance to treatment are poorly understood. To address this, spatial genomic, biochemical, and cellular mechanisms were studied in the context of histological and molecular classification systems across matched pairs of primary (M4–7) and recurrent (M4’–7’) high-grade meningiomas that were treated with radiotherapy between primary and recurrent resections (Fig. 3a, Extended Data Fig. 5a and Supplementary Table 1).
Histological analysis showed higher WHO grades and increased immunostaining for Ki-67 in paired recurrent versus primary meningiomas (Fig. 1b and Extended Data Fig. 5a). Bulk molecular approaches demonstrated higher gene expression risk scores21, increased CNV burdend, and aggressive oncogenic mutations such as TERT promoter mutation or CDKN2A/B homozygous deletion in paired recurrent versus primary meningiomas (Fig. 1b and Supplementary Table 2, 3). Spatial gene expression programs were divergent in paired primary and recurrent meningiomas despite sample integration and batch-correction with Harmony (Fig. 3b and Extended Data Fig. 5b–d). Incorporation of CNVs can improve prognostic models for meningioma outcomes8,9, but the spatial architecture and evolution of meningioma CNVs over time is incompletely understood. To determine if spatial expansion of sub-clonal CNVs underlies high-grade meningioma recurrence, inferCNV was used to deconvolve CNVs from paired primary and recurrent meningioma spatial transcriptomes (Extended Data Fig. 6a). Spatial projection validated CNVs that were identified in recurrent but not in primary meningiomas from paired samples using targeted next generation DNA sequencing (Fig. 1b, 3c and Supplementary Table 2). Spatial projection also identified clonal CNVs from recurrent meningiomas in sub-clonal spatial transcriptomes from paired primary tumors that were below the limit of detection using bulk molecular approaches (Fig. 1b, 3c). In support of these data, spatial transcriptomes demonstrated decreased expression of MAPK target genes (RAB7, MAPK11, PLCE1) and epigenetic regulators (SMARCA2) that were lost through copy number deletions in paired recurrent versus primary meningiomas (Fig. 3d). Interestingly, an intracranial meningioma overlying the frontal cortex (M8) also demonstrated divergent histological, SSV, CNV, and spatial transcriptomic architecture compared to patient-matched primary (M7) and recurrent (M7’) meningiomas overlying the occipital cortex (Fig. 1b, Extended Data Fig. 7a–i and Supplementary Table 1). These data suggest regionally distinct meningiomas can be associated with divergent genomic features even within individual patients.
To determine if the diverse genomic mechanisms underlying high-grade meningioma recurrence were associated with convergent or divergent biochemical and cellular phenotypes, spatial protein profiling (Fig. 4a and Extended Data Fig. 8a–d) was performed alongside multiplexed seqIF to stain and image whole mount sections of primary (M4–7) and recurrent (M4’–7’) meningiomas (Fig. 4b, c, Extended Data Fig. 8e and Supplementary Table 8). Principal component analysis of spatial protein profiling data demonstrated divergent biochemical mechanisms in primary versus recurrent tumors (Extended Data Fig. 8a, b), but inspection of individual proteins revealed conserved trends underlying high-grade meningioma recurrence (Extended Data Fig. 8c). Proteins associated with cell proliferation (Ki-67) and PI3K-AKT signaling (PLCG1) were enriched in recurrent meningiomas, whereas proteins associated with MAPK signaling (pan-Ras), immune signaling (CD45, VISTA, CD14), and PI3K-AKT inhibition (INPP4B) were suppressed in recurrent meningiomas (Fig. 4a and Extended Data Fig. 8d). In support of these findings, multiplexed seqIF showed Ki-67 was enriched in recurrent versus primary meningioma cells that were marked by expression of SSTR2A44 (Fig. 4c). Primary meningiomas were enriched in pan-Ras, INPP4B, macrophages (CD68, CD163) that were concentrated in the perivascular niche (CD31), and VISTA, an inhibitor of T cell activation (Fig. 4c). Meningioma responses to immune checkpoint inhibitors that target T cells19,20 appear less robust compared to other tumors where such therapies are now standard of care45–52, and multiplexed seqIF showed T cells marked by CD4 or CD8 were rare in either primary or recurrent meningiomas (Extended Data Fig. 8e). To validate these findings, meningioma cell types were deconvolved from spatial transcriptomes using single-cell RNA sequencing of 57,114 cells from 8 meningioma samples representing all DNA methylation groups6. Spatial deconvolution of single-cell types showed CD163 macrophages, differentiated meningioma cells, SSTR2A meningioma cells, and G1 phase meningioma cells were decreased in recurrent versus primary meningiomas (Fig. 4d). Cycling G2M phase and S phase meningioma cells were enriched in recurrent versus primary meningiomas (Fig. 4d).
To test the generalizability of these findings, MAPK and PI3K-AKT target gene expression was analyzed in primary (n=403) versus recurrent meningiomas (n=99) using bulk RNA sequencing data from independent meningiomas6,11. In support of results from spatial approaches, MAPK target genes such as DUSP1 (p=0.0013) and SPRY1 (p=0.0059) were suppressed and PI3K-AKT target genes53 such as SMC6 (p=0.0011), LSM4 (p=0.0001), and LARS (p=0.0007) were enriched in recurrent versus primary meningiomas as well as in meningiomas with prior radiotherapy versus no prior radiotherapy (Supplementary Table 9).
Regionally distinct sub-clonal spatial transcriptomes, signaling mechanisms, and cell types
High-grade meningiomas can arise de novo, progress from lower grade meningiomas54–56, or may show only focal evidence of high-grade transformation57. Thus, regionally distinct histological or genomic intratumor heterogeneity can influence meningioma classification12,13, but the identity and spatial relationships among mechanisms associated with intratumor heterogeneity in high-grade meningiomas are unknown. To address this, spatial genomic and cellular mechanisms were studied across high-grade meningiomas demonstrating regionally distinct intratumor heterogeneity (M9–10) (Fig. 5a–b, Extended Data Fig. 9a–c and Supplementary Table 1).
Histological analyses of M9 revealed a well-demarcated area of increased cellularity, increased immunostaining for Ki-67, and increased mitotic count that was sufficient for diagnosis of WHO grade 3 meningioma in 1 of 2 regionally distinct cores (Fig. 5a). Both cores from M9 were otherwise comprised of WHO grade 2 histology, lower immunostaining for Ki-67, Hypermitotic meningioma DNA methylation grouping, and high gene expression risk scores but showed divergent SSVs inactivating epigenetic regulators (ARID1A, ASXL1) and divergent CNVs deleting chromosomes 4 and 14q that were only identified in the core with WHO grade 3 histology (Fig. 1b). Histological analyses of M10 revealed WHO grade 3 meningioma with mosaic immunostaining for p16 that inversely correlated with immunostaining for Ki-67 in 2 regionally distinct cores (Fig. 5b and Extended Data Fig. 9b). Both cores from M10 classified in the Hypermitotic meningioma DNA methylation group but showed divergent gene expression risk scores and divergent CNVs amplifying chromosome 1q or deleting chromosomes 4q, 9p, and 10q (Fig. 1b).
Spatial gene expression programs were analyzed across regionally distinct high-grade meningioma cores after sample integration and batch-correction with Harmony (Fig. 5c–f). Clusters C3, C6, and C9 in M9 correlated with WHO grade 3 histology (Fig. 5a, e) and differential expression analysis of spatial transcriptomes revealed shared enrichment of embryonic transcription factors (SOX11, ELF3) but divergent expression of meningeal homeostasis (PTGDS in C3) and immune genes (CXCL8 in C6, HLA-DPA1 and IGHG1 in C9) in WHO grade 3 regions (Fig. 5g–i). Clusters C2, C8, and C10 in M9 correlated with WHO grade 2 histology that was immediately adjacent to the WHO grade 3 region and lacked embryonic transcription factor expression but was enriched in meningeal homeostasis (PTGDS in C2 and C10) and immune genes (HLA-DPA1 in C8). Clusters C1, C4, C5, and C7 in M9 correlated with WHO grade 2 histology that was distant from the WHO grade 3 region and was enriched in tissue differentiation (FIBIN in C1 and C5, ACTA2 in C4) and innate immune genes (IFI27 and IFIT3 in C7). M10 clusters C4, C5, and C6 correlated with reduced immunostaining for p16 (Fig. 5b, f), and differential expression analysis of spatial transcriptomes revealed shared enrichment of cell signaling and proliferation genes (GPC1, CRABP1) but divergent expression of immune genes in these regions (IGHG1, IGKC, CLEC3B in C6) (Fig. 5j–l). Cluster C8 correlated with intermediate immunostaining for p16 and demonstrated divergent cell signaling and proliferation genes (MET, EGFL6), which supports the hypothesis that regionally distinct mechanisms activating the cell cycle can exist in individual meningiomas (Fig. 2d, e). The remainder of M10 showed diffusely positive immunostaining for p16 and was enriched in senescence and cell cycle regulation genes (MX2 in C7, CDKN2B in C9 and C10). Multiplexed seqIF showed that Ki-67 was enriched in the WHO grade 3 region of M9 and in the region of M10 with reduced immunostaining for p16 (Fig. 6a–c). Moreover, M9 and M10 showed regionally distinct expression of pan-Ras, INPP4B, CD68, CD163, VISTA, and the pericyte marker CD31. Spatial deconvolution of meningioma single-cell types6 validated regionally distinct changes in CD163 macrophages, pericytes, endothelia, SSTR2A meningioma cells, extracellular matrix (ECM) remodeling meningioma cells, and G1/G2M/S phase meningioma cells in M9 and M10 (Fig. 6d). Thus, in support of the genomic, biochemical, and cellular phenotypes underlying temporal evolution of high-grade meningiomas (Fig. 3, 4 and Extended Data Fig. 5–8), regionally distinct cell proliferation, cell signaling, and immune mechanisms underlie spatial evolution of high-grade meningiomas.
Personalized systemic therapy to overcome intratumor heterogeneity
Sub-clonal evolution underlies tumor recurrence and treatment resistance58–62, but preclinical models of intratumor heterogeneity or tumor evolution in response to treatment are lacking. To develop reagents to study high-grade meningioma heterogeneity and evolution in response to treatment, patient-derived WHO grade 2 M10G meningioma cells stably expressing CRISPRi machinery (M10GdCas9-KRAB)6,13 were transduced with sgRNAs suppressing (1) the cell cycle inhibitors CDKN2A (sgCDKN2A) or CDKN2B (sgCDKN2B), (2) the epigenetic regulator ARID1A (sgARID1A), or (3) non-targeted control sgRNAs (sgNTC) (Extended Data Fig. 10a). RNA sequencing of triplicate M10GdCas9-KRAB cultures revealed CDKN2A/B suppression inhibited developmental and metabolic gene expression programs, whereas ARID1A suppression induced metabolic and mitotic gene expression programs (Fig. 7a and Supplementary Table 10). These data suggest drivers of high-grade meningioma intratumor heterogeneity may be associated with non-overlapping therapeutic vulnerabilities. In support of this hypothesis, preclinical experiments demonstrate meningiomas with loss of cell cycle regulators are susceptible to CDK4/6 inhibitors such as abemaciclib6, and meningiomas with loss of epigenetic regulators may be susceptible to histone deacetylase inhibitors such as vorinostat10.
To identify pharmacologic strategies to inhibit intratumor heterogeneity in high-grade meningiomas, M10GdCas9-KRAB cells transduced with sgCDKN2A/B, sgARID1A, or sgNTC were reciprocally labeled with red or green fluorescence proteins and assembled into 3D co-cultures for live cell microscopy. Abemaciclib blocked the growth of M10GdCas9-KRAB cells with CDKN2A/B suppression but did not block the growth of M10GdCas9-KRAB cells with ARID1A suppression or with expression of sgNTCs (Fig. 7b, c). Thus, to identify therapeutic vulnerabilities underlying meningiomas with loss of epigenetic regulators, spatial protein profiling was analyzed across 21 regions with or without SSVs inactivating ARID1A from M10 (Fig. 1e). These data revealed regionally distinct vulnerabilities to small molecule inhibitors of the DNA damage response (niraparib), EGFR signaling (erlotinib), MEK/ERK signaling (selumetinib), MET signaling (capmatinib), and PI3K-AKT signaling (copanlisib) (Fig. 7d). Vorinostat, niraparib, erlotinib, selumetinib, and copanlisib blocked the growth of M10GdCas9-KRAB cells expressing sgNTC, and selumetinib and copanlisib blocked the growth of cells with ARID1A suppression (Fig. 7e). To determine if combination molecular therapy could overcome intratumor heterogeneity in high-grade meningiomas, 3D co-cultures of M10GdCas9-KRAB cells expressing sgCDKN2A and sgNTC (Fig. 7f), or sgCDKN2A and sgARID1A (Fig. 7g), were treated with abemaciclib and selumetinib, or abemaciclib and copanlisib. Combination molecular therapy blocked the growth of meningioma cells with loss of CDKN2A and loss of ARID1A in both co-culture conditions and attenuated the growth of meningioma cells expressing sgNTC (Fig. 7h, i). These findings were validated using the IOMM-Lee meningioma cell line63, which has loss of CDKN2A/B64, and SF12964 cells, which were derived from a WHO grade 3 meningioma with homozygous CDKN2A/B deletion that developed resistance to abemaciclib in a patient who underwent reoperation for tumor progression6. Treatment of IOMM-Lee cells stably expressing CRISPRi machinery and sgARID1A or sgNTC again demonstrated that combination molecular therapy blocked the growth of all relevant clones in fluorescent 3D co-culture models (Extended Data Fig. 10b–d). Abemaciclib, selumetinib, and abemaciclib plus selumetinib had no effect on the growth of SF12964 cells, but copanlisib and abemaciclib plus copanlisib attenuated the growth of this cell line (Extended Data Fig. 10e). Thus, high-grade meningiomas with loss of cell cycle and/or epigenetic regulators may be susceptible to combination molecular therapy blocking CDK4/6, MEK/ERK signaling, and PI3K-AKT signaling, but heterogeneity across tumors suggest that individualized pharmacologic strategies may be necessary.
Discussion
Here we integrate spatial transcriptomics, spatial protein profiling, multiplexed seqIF, and spatial deconvolution of single-cell transcriptomes across high-grade meningiomas to identify genomic, biochemical, and cellular mechanisms linking intratumor heterogeneity to molecular, temporal, and spatial evolution. Our results reveal divergent intratumor gene and protein expression programs distinguish high-grade meningiomas that are otherwise grouped together by the World Health Organization Classification of Central Nervous System Tumors14, one of the systems that is currently used to determine patient eligibility on clinical trials16.
Analyses of matched pairs of primary and recurrent meningiomas reveal spatial expansion of sub-clonal copy number variants, decreased immune cell infiltration, decreased MAPK signaling, increased PI3K-AKT signaling, and increased cell proliferation underlie treatment resistance and tumor recurrence. We identify divergent temporal evolution in recurrent versus primary meningiomas, suggesting that molecular analyses guiding clinical decision-making should be performed on recurrent tumor tissue rather than archival samples from prior resections. Our results also indicate that regionally distinct spatial evolution represents a barrier to accurate tumor classification and should be considered during histological or molecular analyses of meningiomas.
More broadly, we show feasibility of assessing spatially distinct subclones harboring prognostically relevant CNVs that could be considered as part of risk-stratification algorithms for tumor grading. We find regionally distinct high-grade meningioma samples displaying histological and molecular heterogeneity are associated with spatial gene expression programs that correlate with intratumor heterogeneity and cell proliferation.
To translate these findings to preclinical models, we use CRISPRi and lineage tracing approaches in human meningioma co-culture models to identify combinations of FDA-approved molecular therapies that target intratumor heterogeneity and block meningioma growth. We show this system can enable medium-throughput screening of pharmacologic strategies that may be useful for treating tumors that are resistant to standard interventions. Clinical trials of abemaciclib (NCT02523014) or selumetinib (NCT03095248) as monotherapy for meningiomas are ongoing, but our data suggest that combination molecular therapy may be necessary to target all relevant clones within a tumor, rather than only the dominant clone as is often done in clinical practice.
In sum, our results establish a foundation for personalized systemic therapy to treat patients with high-grade meningiomas and provide a framework for understanding mechanisms and therapeutic vulnerabilities driving intratumor heterogeneity and tumor evolution.
Methods
Inclusion and ethics
This study complied with all relevant ethical regulations and was approved by the University of California San Francisco (UCSF) Institutional Review Board (13–12587, 17–22324, 17–23196 and 18–24633). As part of routine clinical practice at UCSF, all patients who were included in this study signed a written waiver of informed consent to contribute deidentified data to research projects.
Meningiomas, clinical data, histology, and light microscopy
The study cohort consisted of 16 samples from 10 clinically aggressive meningiomas and 2 samples from 2 histologically WHO grade 1 meningiomas that were resected from 11 patients at UCSF from 2009 to 2022. Patient demographics, adjuvant treatments, and clinical outcomes were recorded from the electronic medical record (Supplementary Table 1, 6). Magnetic resonance imaging studies were reviewed to define meningioma locations and clinical outcomes. Detailed pathologic examination of the entire cohort was performed by a board-certified neuropathologist (C-H.G.L) to assess for histological or molecular heterogeneity. Histological and molecular grading were assigned using the 2021 WHO Classification of Central Nervous System Tumors14. For bulk sequencing analyses, meningioma tissue was isolated from formalin-fixed, paraffin-embedded (FFPE) blocks using biopsy punches (Integra Miltex Instruments, cat# 33-31-P/25). Genomic DNA was extracted from macro-dissected FFPE tumor tissue using the QIAamp DNA (Qiagen, cat# 56404) and the QIAamp RNeasy FFPE Tissue Kits (Qiagen, cat# 73504) at UCSF. For spatial profiling assays, 6 mm cores were punched from FFPE blocks using biopsy punches, and serial sections were mounted onto glass slides for spatial transcriptomic, protein profiling, H&E histology, or immunohistochemistry. DV200% values were calculated for candidate cases using the RNA 6000 Nano Kit (Agilent, cat# 5067-1511) and the 2100 Bioanalyzer Expert Software (vB.02.10) to ensure proper quality RNA for analysis. Clinically validated immunohistochemistry for Ki-67 (DAKO, 1:50 dilution, MIB1 clone, cat# M7240), H3K27me3 (Cell Signaling, 1:50 dilution, C36B11 clone, cat# 9733, and p16 (MTM Labs, undiluted, E6H4 clone, cat# 9511) were performed at UCSF on core mounts with appropriate controls using a Leica Bond III platform and imaged using light microscopy on an BX43 microscope with standard objectives (Olympus). Images were obtained and analyzed using the Olympus cellSens Standard Imaging Software package (v1.16).
DNA methylation profiling and analysis
Genomic DNA underwent bisulfite conversion using the EZ DNA Methylation kit (Zymo Research, cat# D5004), followed by amplification, fragmentation, and hybridization to Infinium EPIC 850k Human DNA Methylation BeadChips (Illumina, cat# 20020530) according to manufacturer’s instructions at the Molecular Genomics Core at the University of Southern California (Los Angeles, CA). Bioinformatic analysis was performed in R (v3.6.1). Meningioma DNA methylation data were preprocessed using the SeSAMe pipeline (Bioconductor v3.10) as previously described6,65. In brief, probes were filtered and analyzed using normal-exponential out-of-band background correction, nonlinear dye bias correction, p-value with out-of-band array hybridization masking, and β value calculation (β=methylated/[methylated+unmethylated]). Meningioma samples were assigned to Merlin-intact, Immune-enriched, or Hypermitotic DNA methylation groups using a support vector machine classifier, as previously described6.
Targeted DNA sequencing and analysis
Targeted DNA sequencing was performed using the UCSF500 NGS panel, as previously described23. In brief, this capture-based next-generation DNA sequencing assay targets all coding exons of 479 cancer-related genes, select introns, and upstream regulatory regions of 47 genes to enable detection of structural variants such as gene fusions and DNA segments at regular intervals along each chromosome to enable genome-wide copy number and zygosity analyses, with a total sequencing footprint of 2.8 Mb (Supplementary Table 2). Multiplex library preparation was performed using the KAPA Hyper Prep Kit (Roche, cat# 07962355001). Hybrid capture of pooled libraries was performed using a custom oligonucleotide library (Nimblegen SeqCap EZ Choice). Captured libraries were sequenced as paired-end reads on an Illumina NovaSeq 6000 at >200x coverage for each sample. Sequence reads were mapped to the reference human genome build GRCh37 (hg19) using the Burrows-Wheeler aligner (v0.7.17). Recalibration and deduplication of reads was performed using the Genome Analysis Toolkit (v4.3.0.0). Coverage and sequencing statistics were determined using Picard (v2.27.5) CalculateHsMetrics and CollectInsertSizeMetrics. Single nucleotide variant and small insertion/deletion mutation calling was performed with FreeBayes, Unified Genotyper, and Pindel. Large insertion/deletion and structural alteration calling was performed with Delly. Variant annotation was performed with Annovar. Single nucleotide variants, insertions/deletions, and structural variants were visualized and verified using Integrative Genome Viewer (v.2.16.0). Genome-wide copy number and zygosity analysis was performed by CNVkit and visualized using NxClinical (Biodiscovery, v6.0).
Targeted RNA sequencing and analysis
Targeted gene expression profiling was performed using a hybridization and barcode-based RNA sequencing NanoString panel, with quality control from internal negative and spike-in positive controls on the NanoString nCounter Analysis System at the San Francisco Veterans Affairs Core (San Francisco, CA). 200 ng of total RNA per sample was hybridized to barcoded reporter probes and biotin-conjugated capture probes from a custom codeset targeting genes of interest at 65C for 16 hours according to manufacturer instruction. Hybridization mixtures were washed and target/probe complexes were purified and bound to streptavidin coated cartridges. Cartridges were scanned on the nCounter Digital Analyzer with a FOV setting of 550. Gene expression risk scores spanning 0 to 1, with a greater value denoting higher risk of recurrence, were calculated using a previously trained and validated algorithm based on Lasso Cox regression and bootstrap aggregation using log2-transformed, housekeeping gene normalized gene expression counts from a 34-gene signature as input. Previously identified cutoffs were used (low risk ≤0.3761, high risk >0.5652)21.
Spatial transcriptome sequencing and analysis
Spatial transcriptomic profiling was performed on FFPE sections with DV200% values >50% using the 10x Genomics Visium Spatial assay (v1, cat# 1000336). 6 mm cores were mounted within capture areas on Visium glass slides, deparaffinized, stained with H&E, and imaged at the Gladstone Institutes Histology Core (San Francisco, CA). Libraries were prepared according to manufacturer instructions at the Gladstone Institutes Genomics Core (San Francisco, CA). Libraries were sequenced on an Illumina NovaSeq 6000 instrument at the UCSF Center for Advanced Technology. Sequencing was performed with the recommended protocol (read 1: 28 cycles, i7 index read: 10 cycles, i5 index read: 10 cycles, and read 2: 91 cycles). FASTQ sequencing files and histology images were processed using the 10x SpaceRanger pipeline and the Visium Human Transcriptome Probe Set v1.0 GRCh38–2020-A. Data were visualized using the 10x Loupe Browser software (v6.3.0). Principal component analysis (PCA) was run on the normalized filtered feature-barcode matrix to reduce the number of feature (e.g. gene) dimensions. Uniform manifold approximation and projection (UMAP) analysis was used to visualize spatial transcriptomes in a 2D space. Graph-based clustering was performed to cluster spatial transcriptomes with related expression profiles together based on their concordance in PCA space. Differential expression analyses were performed using mean gene expression in each cluster, log2 fold-change of gene mean expression in a cluster relative to all other spatial transcriptomes, and a p-value denoting gene expression significance in each cluster relative to spatial transcriptomes in other clusters. P-values in each cluster were adjusted for false discovery rate to account for the number of genes being tested. Heatmaps of spatial transcriptomic data were generated in the Loupe Browser, which considers the top N genes for each cluster, sorted by log2 fold-change (by default N = 120/X, where X is the total number of spatial transcriptome clusters). Heatmaps were generated using hierarchical clustering with euclidean distance and average linkage.
Spaceranger generated filtered feature matrices were imported into a Seurat object (v4.3.0, arguments min.cells=3, min.features=100) using R (v4.2.1) and RStudio (v2022.07.2 Build 576) (Supplementary Table 4). The individual count matrices were normalized by nFeature_RNA count (subset=nFeature_RNA>1500 and nFeature_RNA<9500) and integrated with Harmony (v0.1.1). Optimal cluster resolution was determined using Clustree (v0.5.0, analyzing resolutions 5, 2, 1, 0.9, 0.8, 0.7, 0.6, 0.6, 0.5, 0.4, 0.3, 0.1, 0.0), and subsequent principal component (npcs=30) and UMAP (dims=1:30, min.dist=0.2) analyses were performed. UMAP projections and cluster distributions were visualized in the Loupe browser after combining spatial transcriptomic data from individual capture areas using the 10x Spaceranger aggr pipeline (v2.0.0). CNV analysis from spatial transcriptomes was performed using inferCNV (v1.14.0) and spatialinferCNV (v0.1.0). Capture areas of interest were combined with an additional capture area containing a geographic population of non-neoplastic cells, using the 10x Spaceranger aggr pipeline and Harmony, as described above. The cluster distribution was visually assessed in the Loupe browser to identify the cluster containing non-neoplastic tissue such as brain or endothelial. All cluster annotations were exported into a csv file and imported into R, along with the aggregate filtered feature matrix. The count matrix, annotated clusters, and a gene order file were input into inferCNV (arguments: cutoff=0.1, cluster_by_groups=TRUE, HMM = TRUE, denoise=TRUE) to generate a six-state CNV probability model for each spatial transcriptomic cluster. Deconvolution of meningioma cell types from single-cell RNA sequencing was performed using SCDC (v 0.0.0.9000). To do so, each spatial transcriptome was treated as a pseudobulked RNA sequencing dataset and leveraged against known cell types from a reference single-cell RNA sequencing dataset comprised of 57,114 cells from 8 human meningioma samples representing all DNA methylation groups6. Spatial and single-cell transcriptomic data were separately processed for quality control using QC filtering, normalization, dimensionality reduction, and clustering. Single-cell transcriptomic data were subsampled to 1000 cells per cell type, and the top differentially expressed genes were selected for each cell type. Using this expression set, spatial transcriptomes were deconvolved to yield a matrix with predicted proportions of cell type for each spatial transcriptome, which were visualized using SpatialFeatureplot (Seurat v3).
Spatial protein profiling and analysis
Spatial protein profiling was performed on FFPE sections using the NanoString Digital Spatial Profiler at the UCSF Laboratory for Cell Analysis Genome Core (San Francisco, CA). Meningioma sections were labeled with DAPI and a multiplexed cocktail of 72 oligo-conjugated antibodies (Supplementary Table 5) using human protein panel modules generated at NanoString Technologies (Seattle, WA). H&E stained whole slide images were overlayed on fluorescent DAPI projections and 200μm regions of interest were annotated based on histological and morphological heterogeneity by a board-certified neuropathologist (C-H.G.L). Oligonucleotides were released from regions of interest using ultraviolet cleavage, aspirated tags were hybridized to optical barcodes, and processed using the NanoString nCounter Analysis System. Barcodes were normalized with internal spike-in controls and then normalized against housekeeping genes. Principal components analysis was performed using the prcomp function in R (v3.6.1) using default settings.
Multiplexed sequential immunofluorescence (seqIF) and microscopy
Automated multiplexed seqIF staining and imaging was performed on FFPE sections at Northwestern University using the COMET platform (Lunaphore Technologies). The multiplexed panel was comprised of 29 antibodies (Supplementary Table 8). The 29-plex protocol was generated using the COMET Control Software (v1.0), and reagents were loaded onto the COME device to perform seqIF. All antibodies were validated using conventional IHC and/or IF staining in conjunction with corresponding fluorophores and 4’,6-diamidino-2-pheynlindole counterstain (DAPI, ThermoFisher Scientific, cat# 62248). For optimal concentration and best signal-to-noise ratio, all antibodies were tested at 3 different dilutions, starting with the manufacturer-recommended dilution (MRD), MRD/2, and MRD/4. Secondary Alexa fluorophore 555 (ThermoFisher Scientific, cat# A32727) and Alexa fluorophore 647 (ThermoFisher Scientific, cat# A32733) were used at 1/200 or 1/400 dilutions, respectively. The optimizations and full runs of the multiplexed panel were executed using the seqIF technology integrated in the Lunaphore COMET platform (characterization 2 and 3 protocols, and seqIF protocols, respectively). The seqIF workflow was parallelized on a maximum of 4 slides, with automated cycles of iterative staining of 2 antibodies at a time, followed by imaging, and elution of the primary and secondary antibodies, with no sample manipulation during the entire workflow. All reagents were diluted in Multistaining Buffer (Lunaphore Technologies, cat# BU06). The elution step lasted 2min for each cycle and was performed with Elution Buffer (Lunaphore Technologies, cat# BU07-L) at 37°C. Quenching lasted for 30sec and was performed with Quenching Buffer (Lunaphore Technologies, cat# BU08-L). Imaging was performed with Imaging Buffer (Lunaphore Technologies, cat# BU09) with exposure times set at 4min for all primary antibodies, except P16 antibody at 8min, and secondary antibodies at 2min. Imaging was performed with an integrated epifluorescent microscope at 20x magnification. Image registration was performed immediately after concluding the staining and imaging procedures by COMET Control Software. Each seqIF protocol resulted in a multi-stack OME-TIFF file where the imaging outputs from each cycle were stitched and aligned. COMET OME-TIFF files contain a DAPI image, intrinsic tissue autofluorescence in TRITC and Cy5 channels, and a single fluorescent layer per marker. Markers were subsequently pseudocolored for visualization of multiplexed antibodies.
Cell culture and molecular biology
M10G cells13 were cultured in a medium comprised of Advanced DMEM/F12 (Gibco, cat# 12634) supplemented with 5% FBS (Gibco, cat# 26140), B-27 supplement without vitamin A (Gibco, cat #12587010), N-2 supplement (Gibco, cat# 17502048), 1% Anti-Anti (Gibco, cat#15240), 1% GlutaMAX™-1 (Gibco, cat# A12860), 20ng/ml EGF (R&D Systems, cat# 236EG200), and 20ng/ml FGF basic/FGF2 (R&D Systems, cat# PRD23350). IOMM-Lee cells (ATCC, cat# CRL-3370) were cultured in DMEM/F12+GlutaMAX-1 (Gibco, cat#10565) supplemented with 10% FBS (Gibco, cat# 26140) and 1% Anti-Anti (Gibco, cat# 15240). SF12964 cells, which were directly transplanted from a resection specimen into a donor mouse before ultimately transitioning to in vitro growth conditions for terminal pharmacological experimentation, were cultured in DMEM/F12+GlutaMAX-1 (Gibco, cat#10565) supplemented with 10% FBS (Gibco, cat# 26140) and 1% Anti-Anti (Gibco, cat# 15240). HEK293T cells (ATCC, cat#, CRL-3216) were cultured in Advanced DMEM (Gibco, cat# 12491015) supplemented with 3% FBS (Gibco, cat#, 26140) and 1% GlutaMAX™-1. M10GdCas9-KRAB and IOMM-LeedCas9-Zim3-KRAB cells were generated by viral transduction after transfecting HEK293T cells with standard packaging vectors, TransIT-Lenti Transfection reagent (Mirus, cat# 6605), 8ug/mL polybrene (EMD Millipore, cat# TR-1003-G), and lentiviral particles containing either pMH0001 (UCOE-SFFV-dCas9-BFP-KRAB, Addgene, cat# 85969) or dCas9-Zim3-KRAB-BFP (pJB108). Successfully transduced cells were isolated through double selection of the top 10% of BFP positive cells using fluorescence activated cell sorting on a Sony SH800. CRISPRi activity was validated via a competitive growth assay measuring the depletion of transduced RFP+ common essential guides compared to non-targeting controls over time. Single-guide RNA (sgRNA) protospacer sequences suppressing CDKN2A, CDKN2B, or ARID1A were individually ligated into the pCRISPRia-v2 vector83 (Addgene, cat# 84832) between the BstXI and BlpI sites. Each vector was verified by Sanger sequencing of the protospacer. Lentivirus was generated as described above for each sgRNA expression vector. M10GdCas9-KRAB and IOMM-LeedCas9-Zim3-KRAB cells were transduced with lentivirus from each sgRNA expression vector and selected to purity using puromycin over 7 days at concentrations of 20ug/mL or 2ug/mL, respectively.
Cell culture quantitative reverse-transcriptase polymerase chain reaction
RNA was extracted from M10G cells using RNeasy Plus Mini Kit (Qiagen, cat# 74134) and cDNA was synthesized using the iScript cDNA Synthesis Kit (Bio-Rad, cat# 1708891). Target genes were amplified using PowerUp SYBR Green Master Mix and QuantStudio 6 thermocycler (Thermo Fisher Scientific). Gene expression was calculated using the DDCt method, with normalization to GAPDH (sense: 5’-ATGGGGAAGGTGAAGGTCG-3’, antisense: 5’-GGGGTCATTGATGGCAACAATA-3’). Target gene primers included CDKN2A (sense: 5’-ATGGAGCCTTCGGCTGACT-3’, antisense: 5’-GTAACTATTCGGTGCGTTGGG-3’), CDKN2B (sense: 5’-ACGGAGTCAACCGTTTCGGGAG-3’, antisense: 5’-GGTCGGGTGAGAGTGGCAGG-3’), and ARID1A (sense: 5’-CCTGAAGAACTCGAACGGGAA-3’, antisense: 5’-TCCGCCATGTTGTTGGTGG-3’).
Cell culture RNA sequencing and analysis
RNA was extracted from triplicate M10G cultures (sgNTC, sgCDKN2A, sgCDKN2B, sgARID1A) using the RNeasy Plus Mini Kit (Qiagen, cat#74134). 1ug of RNA from each condition was shipped to Medgenome (Foster City, CA) for bulk RNA sequencing (Supplementary Table 10). Quality control was performed using FASTQC (v0.11.9) and the results were aggregated using MultiQC (v1.12). Adapter sequences and bases with quality scores <30 at the 3’ and 5’ ends of the reads were trimmed using Cutadapt (v3.7). Trimmed treads that were less than 20 bases in length were discarded. Processed reads were mapped to the reference genome GRCh38 using HISAT2 (v2.2.0) with default parameters. FeatureCounts (v2.0.0) was used to extract gene expression counts. The resulting count matrix was used to perform differential gene expression analysis with DESeq2 (v1.36.0).
Gene Set Enrichment Analysis (GSEA, v4.3.2) was performed to determine whether differentially expressed in M10G cultures belonged to common biological pathways. Gene rank scores were calculated using the formula: sign(log2 fold-change) × −log10(p-value). Pathways were defined using the gene set file Human_GOBP_AllPathways_no_GO_iea_December_01_2022_symbol.gmt, which is maintained by the Bader laboratory. Gene set size was limited to range between 15 and 500, and positive and negative enrichment files were generated using 2000 permutations. The EnrichmentMap App (v3.3.4) in Cytoscape (v3.7.2) was used to visualize the results of pathway analysis. Nodes with FDR q value < 0.05 and p-value < 0.05, and nodes sharing gene overlaps with Jaccard + Overlap Combined (JOC) threshold of 0.375 were connected by blue lines (edges) to generate network maps. Clusters of related pathways were identified and annotated using the AutoAnnotate app (v1.3.5) in Cytoscape that uses a Markov Cluster algorithm to connect pathways by shared keywords in the description of each pathway. The resulting groups of pathways were designated as the consensus pathways in a circle.
Meningioma co-culture pharmacology and microscopy
CRISPRi-modified and fluorescently-labeled M10GdCas9-KRAB and IOMM-LeedCas9-Zim3-KRAB and BenMen-1dCas9-Zim3-KRAB meningioma cells for 3D co-culture experiments were generated by mixing sgNTC-mScarlet with sgCDKN2A-mGFP cells, sgNTC-mGFP with sgARID1A-mCherry cells, or sgCDKN2A-mGFP with sgARID1A-mCherry cells 1:1. For pharmacologic experiments, a minimum of 300 cells were seeded into each well of a PrimeSurface ultra-low attachment V-shaped 96 well plate (S-Bio, cat# MS-9096V). The following day, meningioma co-cultures were transferred to a spheroid microplate (Corning, cat# 4515) prior to beginning 12 days of continuous drug treatment. Co-cultures were maintained in a medium comprised of Advanced DMEM/F12 (Gibco, cat# 12634) supplemented with B-27 supplement without vitamin A (Gibco, cat# 12587010), N-2 supplement (Gibco, cat# 17502048), 100U/ml Anti-anti (Gibco, cat# 15240), 1% CTSTMGlutaMAXTM-1 (Gibco, cat# A1286001), 20ng/ml EGF (R&D Systems, cat# 236EG200), and 20ng/ml FGF basic/FGF2 (R&D Systems, cat# PRD23350). A Zeiss Cell Observer Spinning Disc Confocal microscope fitted with a temperature and carbon dioxide-controlled chamber was used to acquire fluorescence images of live meningioma co-cultures during drug treatments using Plan-Apochromat 10x/1.3 air objective.
To test the effect of small molecule inhibitors such as abemaciclib (MCE, cat# HY-16297A), selumetinib (Sellekchem, cat# S1008), and copansilib (MCE, cat# HY-15346), SF12964 cells at a concentration of 5×10³ cells/well were seeded on 96-well plate and maintained for 2 days in Advanced DMEM/F12 medium (Gibco, cat# 12634) supplemented with 5% FBS (Gibco, cat# 26140), B-27 supplement without vitamin A (Gibco, cat# 12587010), N-2 supplement (Gibco, cat# 17502048), 1% Anti-Anti (Gibco, cat# 15240), 1% GlutaMAX-1 (Gibco, cat# A12860), 20ng/ml EGF (R&D Systems, cat# 236EG200), and 20ng/ml FGF basic/FGF2 (R&D Systems, cat# PRD23350). After incubating for 48 hours, cells were treated for 5 days with medium containing various concentrations of inhibitors (0, 0.001, 0.01, 0.1 and 1ug/mL) as monotherapy or combination therapy. SF12964 cell proliferation was assessed by using CellTiter 96 Non-Radioactive Cell Proliferation Assay (Promega, cat# G4100) following the manufacture’s protocol.
Statistics
All experiments were performed with independent biological replicates and repeated, and statistics were derived from biological replicates. Biological replicates are indicated in each figure panel or figure legend. No statistical methods were used to predetermine sample sizes, but sample sizes in this study are similar or larger to those reported in previous publications. Data distribution was assumed to be normal, but this was not formally tested. Investigators were blinded to conditions during clinical data collection and analysis of mechanistic or functional studies. Bioinformatic analyses were performed blind to clinical features, outcomes or molecular characteristics. The clinical samples used in this study were retrospective and nonrandomized with no intervention, and all samples were interrogated equally. Thus, controlling for covariates among clinical samples is not relevant. Cells and animals were randomized to experimental conditions. No clinical, molecular, or cellular data points were excluded from the analyses. Unless specified otherwise, lines represent means, and error bars represent standard error of the means. Results were compared using Student’s t-tests, which are indicated in figure legends alongside approaches used to adjust for multiple comparisons. In general, statistical significance is shown by asterisks (*p≤0.05, **p≤0.01, ***p≤0.0001), but exact p-values are provided in the figure legends when possible.
Reporting summary
Further information on research design is available in the Nature Research Reporting Summary linked to this article.
Extended Data
Extended Data Fig. 1. Meningioma spatial transcriptome analysis.

a, Uniform manifold approximation and projection (UMAP) analysis of spatial transcriptomes from the 16 meningioma samples in this study shaded by unsupervised hierarchical clusters in each sample. b, Distribution of unsupervised hierarchical meningioma spatial transcriptome clusters overlayed onto H&E-stained sections of each sample. Scale bar, 1mm. c, UMAP analysis of meningioma spatial transcriptomes shaded by sample of origin without Harmony batch correction suggesting significant batch effects across meningioma spatial transcriptomes.
Extended Data Fig. 2. Meningioma spatial transcriptome clusters and spatial protein analysis.
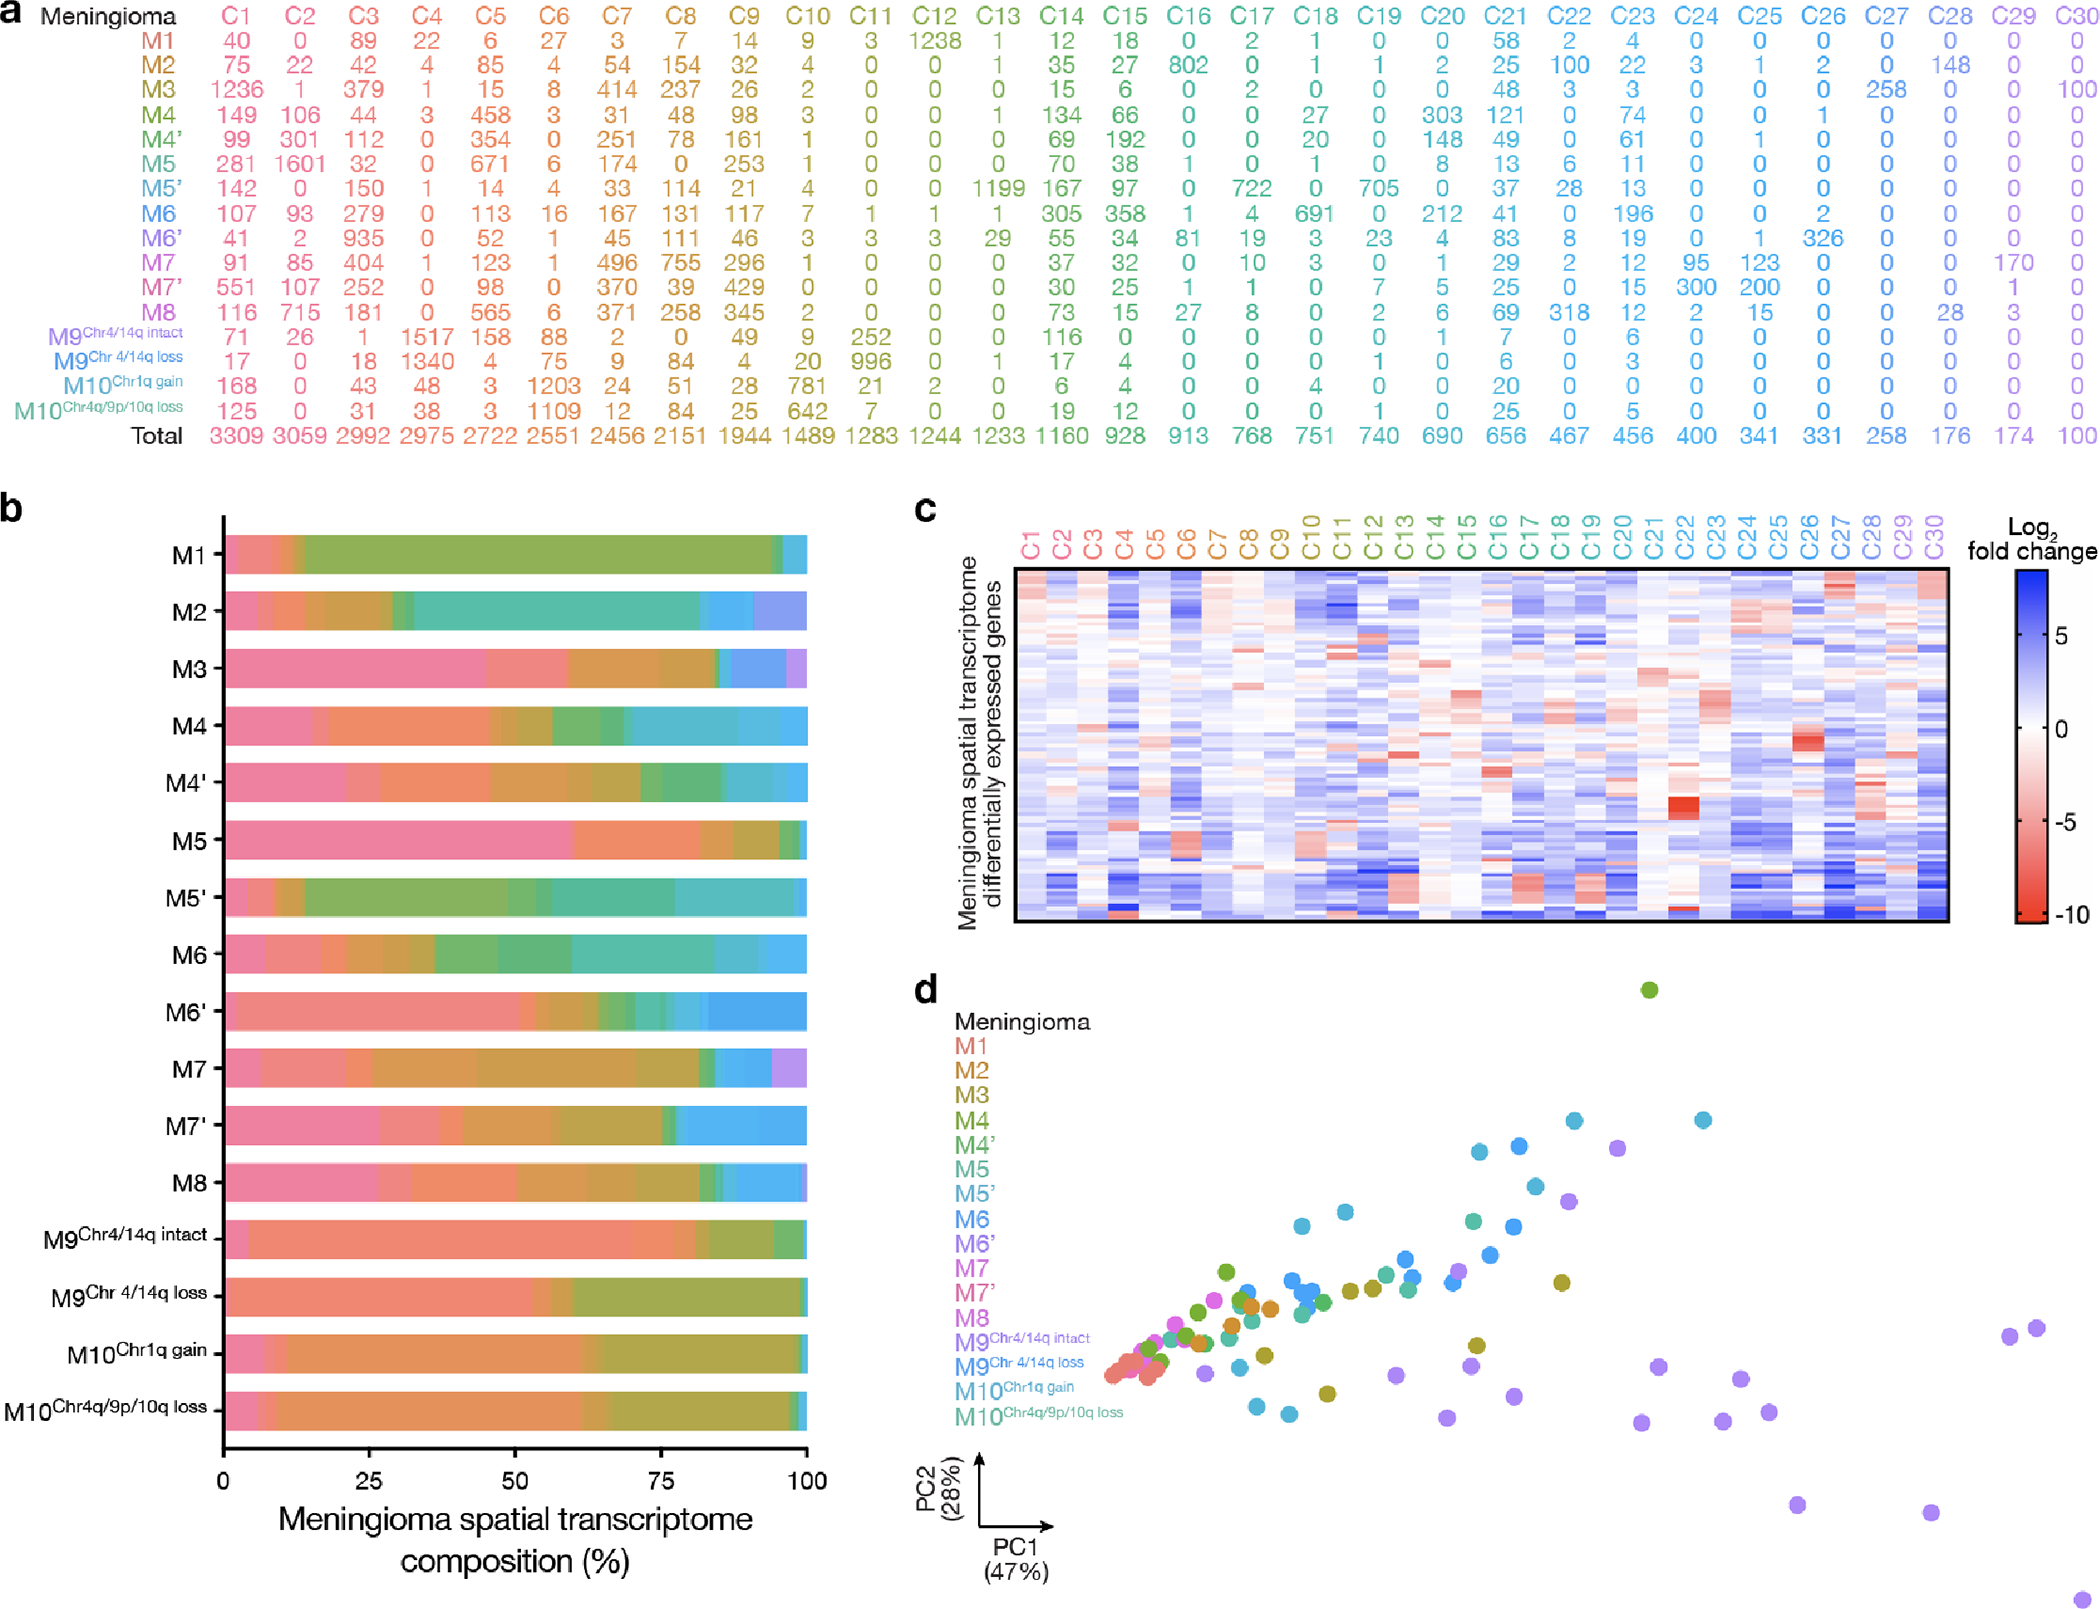
a, Spatial transcriptomes in reduced dimensionality clusters from each meningioma sample after Harmony batch correction. b, Stacked bar showing spatial transcriptomes from each meningioma sample after Harmony batch correction. Colors as in a. c, Top 92 differentially expressed genes (Supplementary Table 4) across 30 unsupervised hierarchical spatial transcriptome clusters from all meningiomas after Harmony batch correction. d, Principal component (PC) analysis of spatial protein profiling from all meningioma samples (72 proteins, 82 regions).
Extended Data Fig. 3. High-grade meningiomas are distinguished by divergent intratumor gene and protein expression programs.
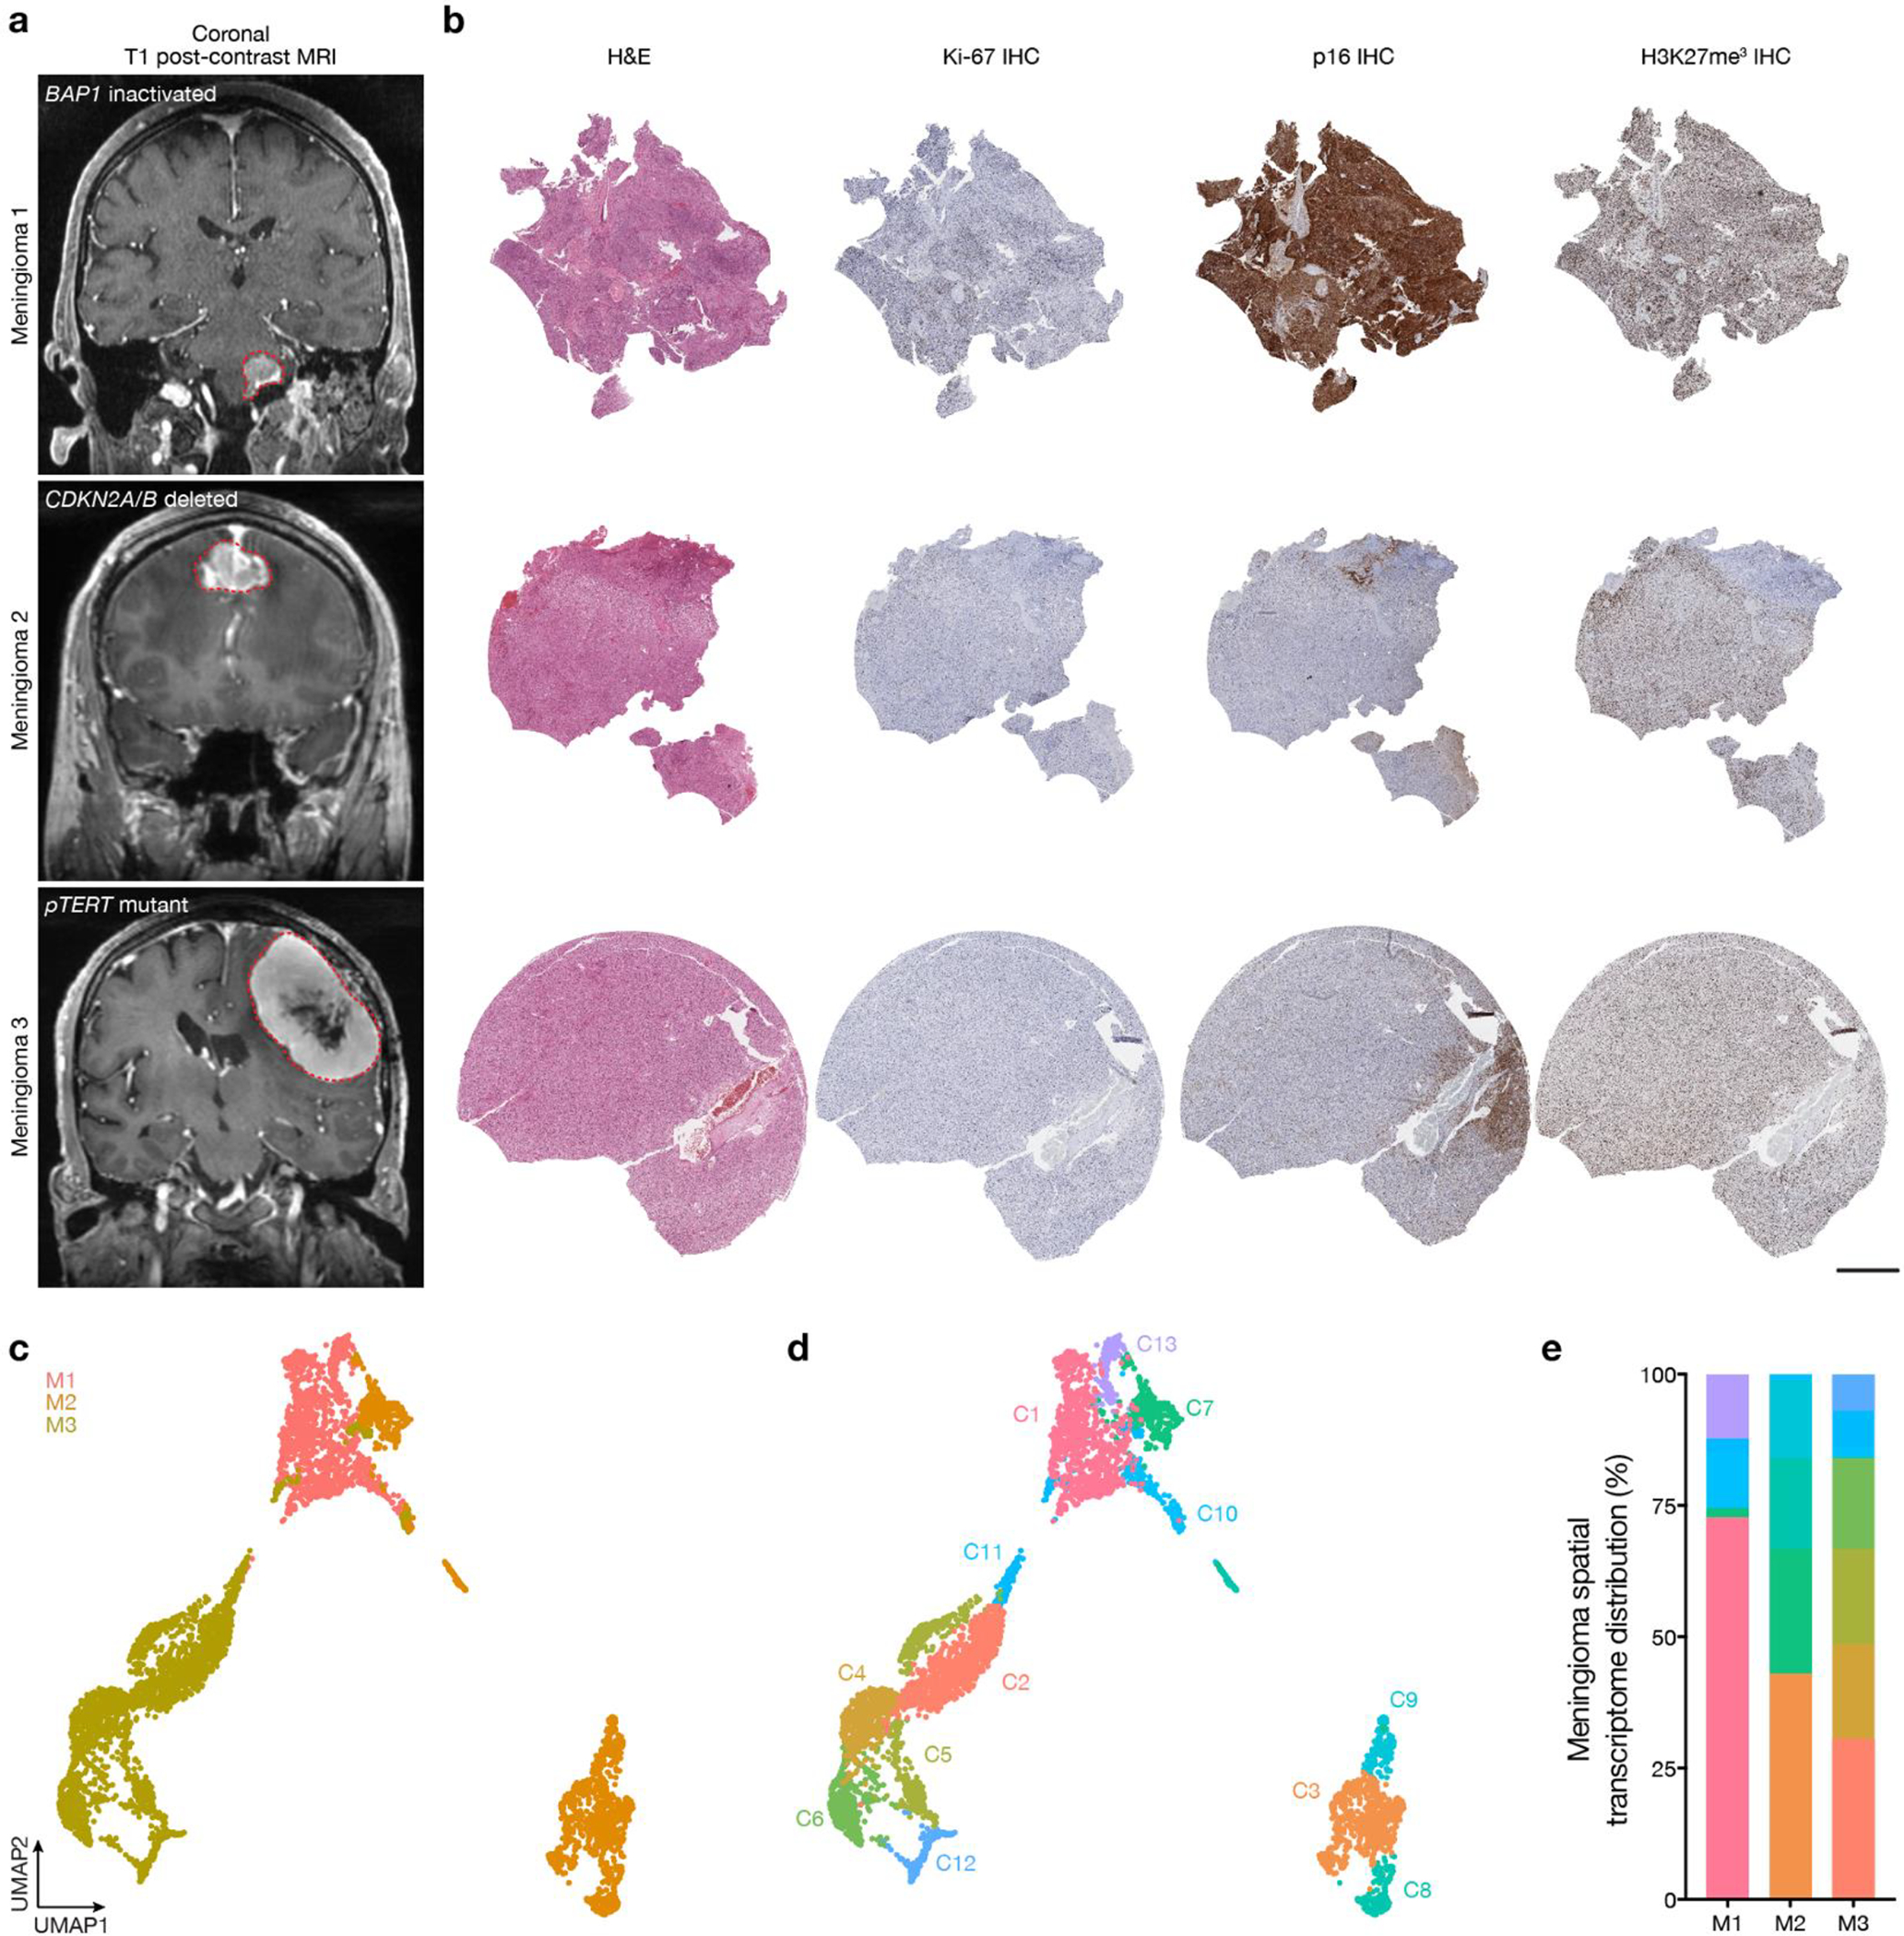
a, Preoperative T1 post-contrast magnetic resonance imaging (MRI) of meningiomas with driver mutations associated with adverse clinical outcomes, such as BAP1 loss (M1), CDKN2A/B loss (M2), or TERT promoter mutation (M3). b, Representative H&E-stained sections and immunohistochemistry (IHC) for Ki-67, p16, or H3K27me3 from M1–3. Scale bar, 1mm. c, Uniform manifold approximation and projection (UMAP) of M1–3 spatial transcriptomes after Harmony batch correction shaded by sample of origin. d, UMAP of M1–3 spatial transcriptomes after Harmony batch correction shaded by unsupervised hierarchical clusters. e, Distribution of unsupervised hierarchical spatial transcriptome clusters from M1–3 after Harmony batch correction.
Extended Data Fig. 4. WHO grade 1 meningiomas demonstrate reduced diversity and number of spatial transcriptomes compared to high-grade meningiomas.
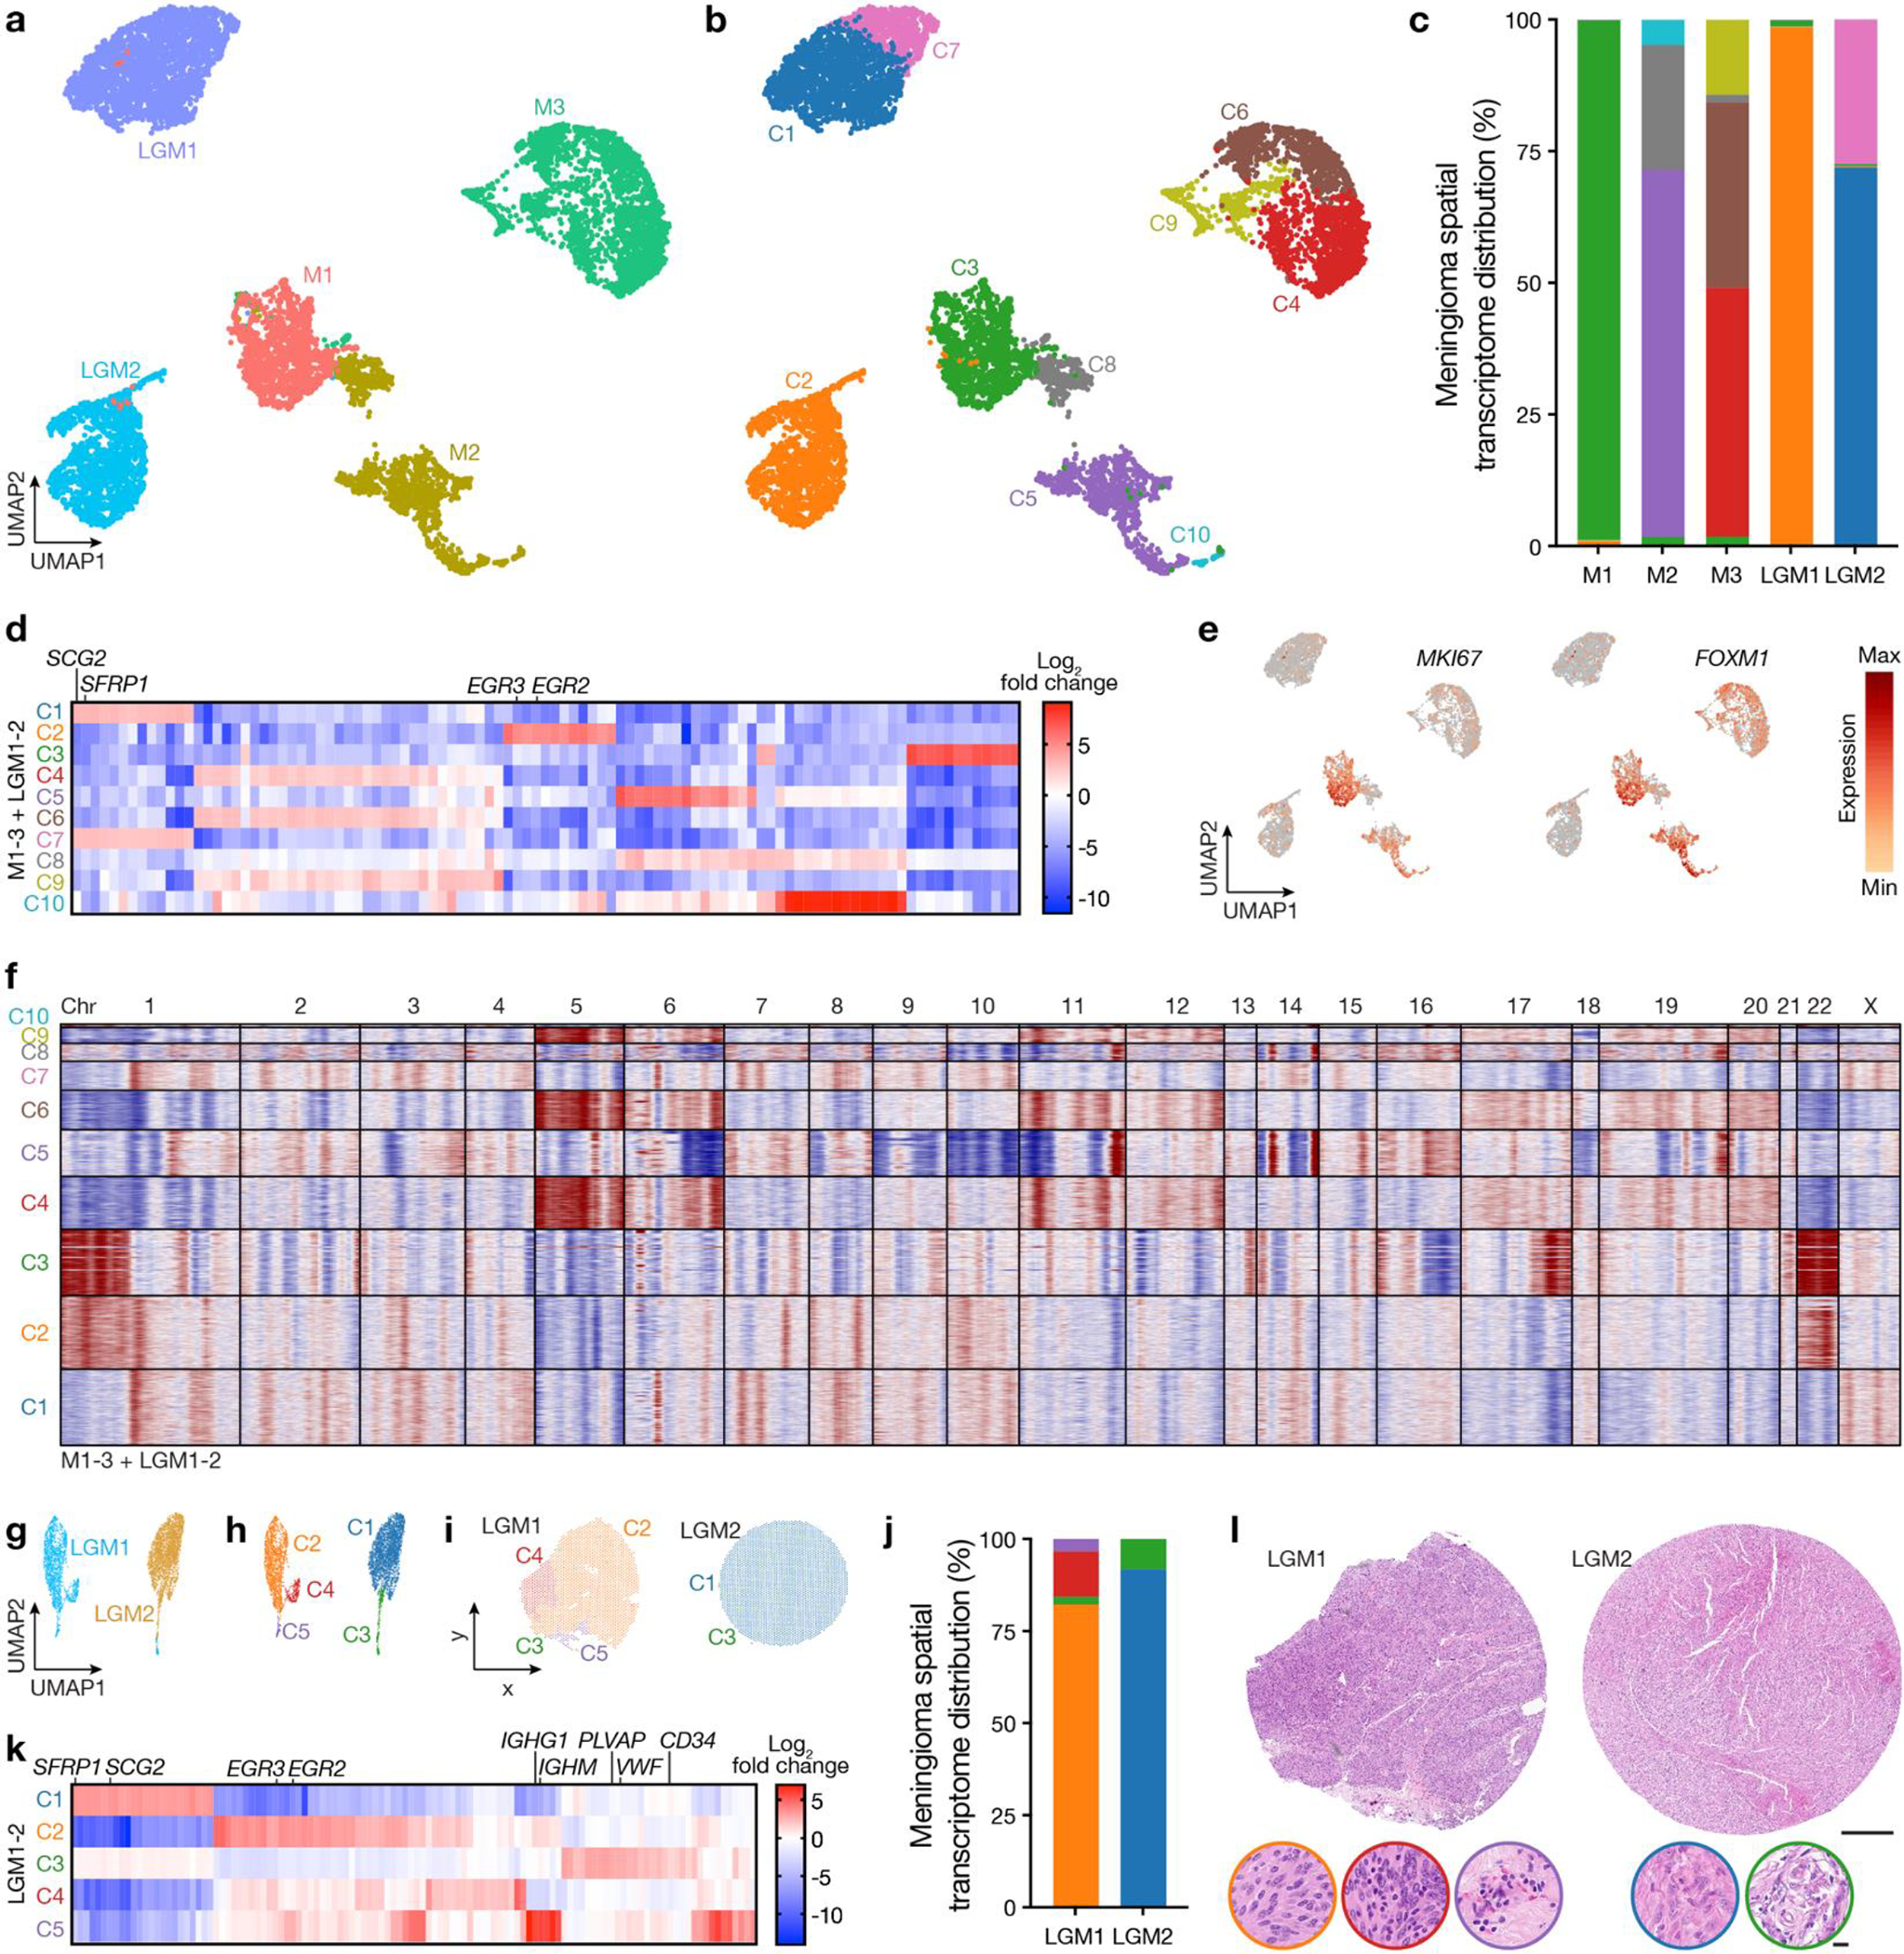
a, Uniform manifold approximation and projection (UMAP) of M1–3 and LGM1–2 spatial transcriptomes after Harmony batch correction shaded by sample of origin. b, UMAP of M1–3 and LGM1–2 spatial transcriptomes after Harmony batch correction shaded by unsupervised hierarchical clusters. c, Distribution of unsupervised hierarchical spatial transcriptome clusters from M1–3 and LGM1–2 after Harmony batch correction. d, Top 101 differentially expressed genes across unsupervised hierarchical spatial transcriptome clusters from M1–3 and LGM1–2 after Harmony batch correction. e, Spatial transcriptome expression of MKI67, FOXM1, or CCN3 across M1–3 and LGM1–2. f, InferCNV traces of copy number variants across unsupervised hierarchical transcriptome clusters from M1–3 and LGM1–2 after Harmony batch correction, revealing no significant CNVs in C2 comprising LGM1, and relative loss of chromosomes 1p and 22q in C1 and C7 comprising LGM2. g, UMAP of LGM1–2 spatial transcriptomes after Harmony batch correction shaded by sample of origin. h, UMAP of LGM1–2 spatial transcriptomes after Harmony batch correction shaded by unsupervised hierarchical clusters. i, Spatial distribution of unsupervised hierarchical spatial transcriptome clusters from LGM1–2. Scale bar, 1mm. j, Distribution of unsupervised hierarchical spatial transcriptome clusters from LGM1–2 after Harmony batch correction. k, Top 116 differentially expressed genes across unsupervised hierarchical spatial transcriptome clusters from LGM1–2 after Harmony batch correction. l, Representative H&E morphology of spatial transcriptome clusters from LGM1 and LGM2. Colors correspond to spatial transcriptomes from h-j. Scale bars, 1mm and 10μm.
Extended Data Fig. 5. Primary and recurrent meningiomas are distinguished by divergent intratumor gene expression programs.
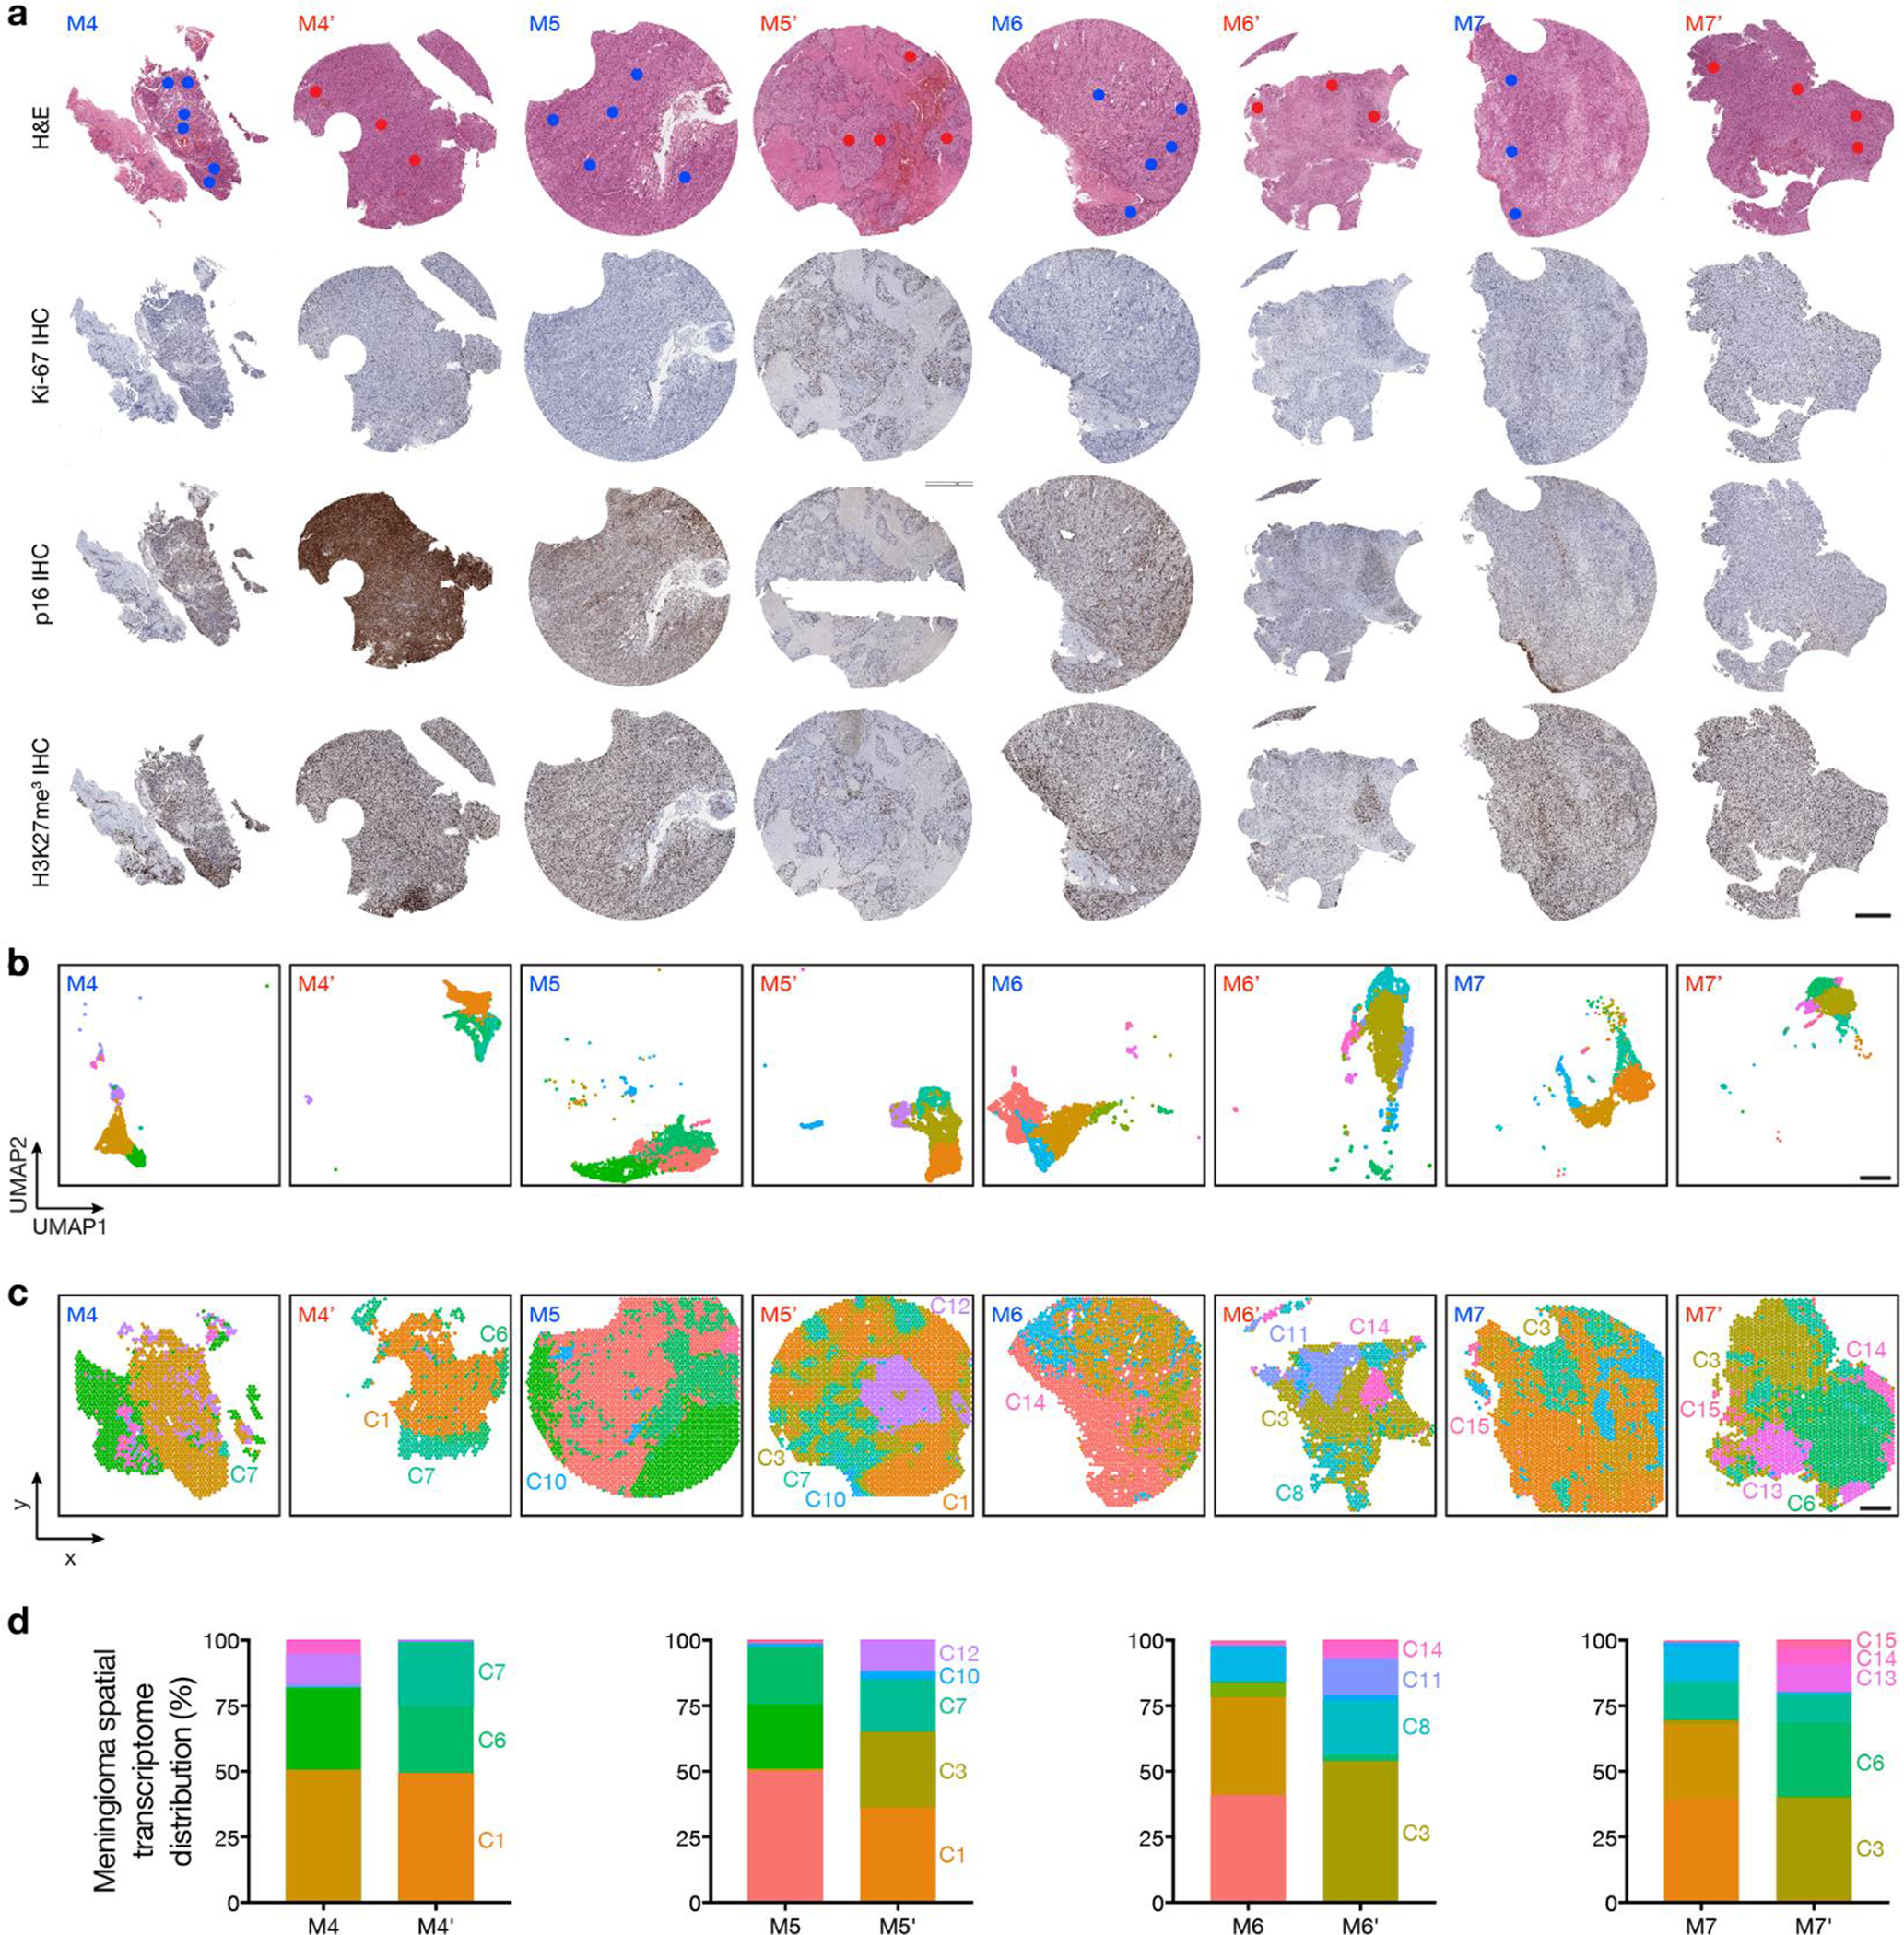
a, Representative H&E-stained sections and immunohistochemistry (IHC) for Ki-67, p16, or H3K27me3 from matched pairs of primary and recurrent meningiomas. Dots show regions of spatial protein profiling. Scale bar, 1mm. b, UMAP analysis of matched pairs of primary and recurrent meningioma spatial transcriptomes after Harmony batch correction shaded by unsupervised hierarchical clusters. Scale bar, 1mm. c, Spatial distribution of unsupervised hierarchical spatial transcriptome clusters from matched pairs of primary and recurrent meningiomas after Harmony batch correction. Scale bar, 1mm. d, Distribution of unsupervised hierarchical spatial transcriptome clusters from matched pairs of primary and recurrent meningiomas after Harmony batch correction.
Extended Data Fig. 6. Primary and recurrent meningiomas are distinguished by divergent copy number variants.
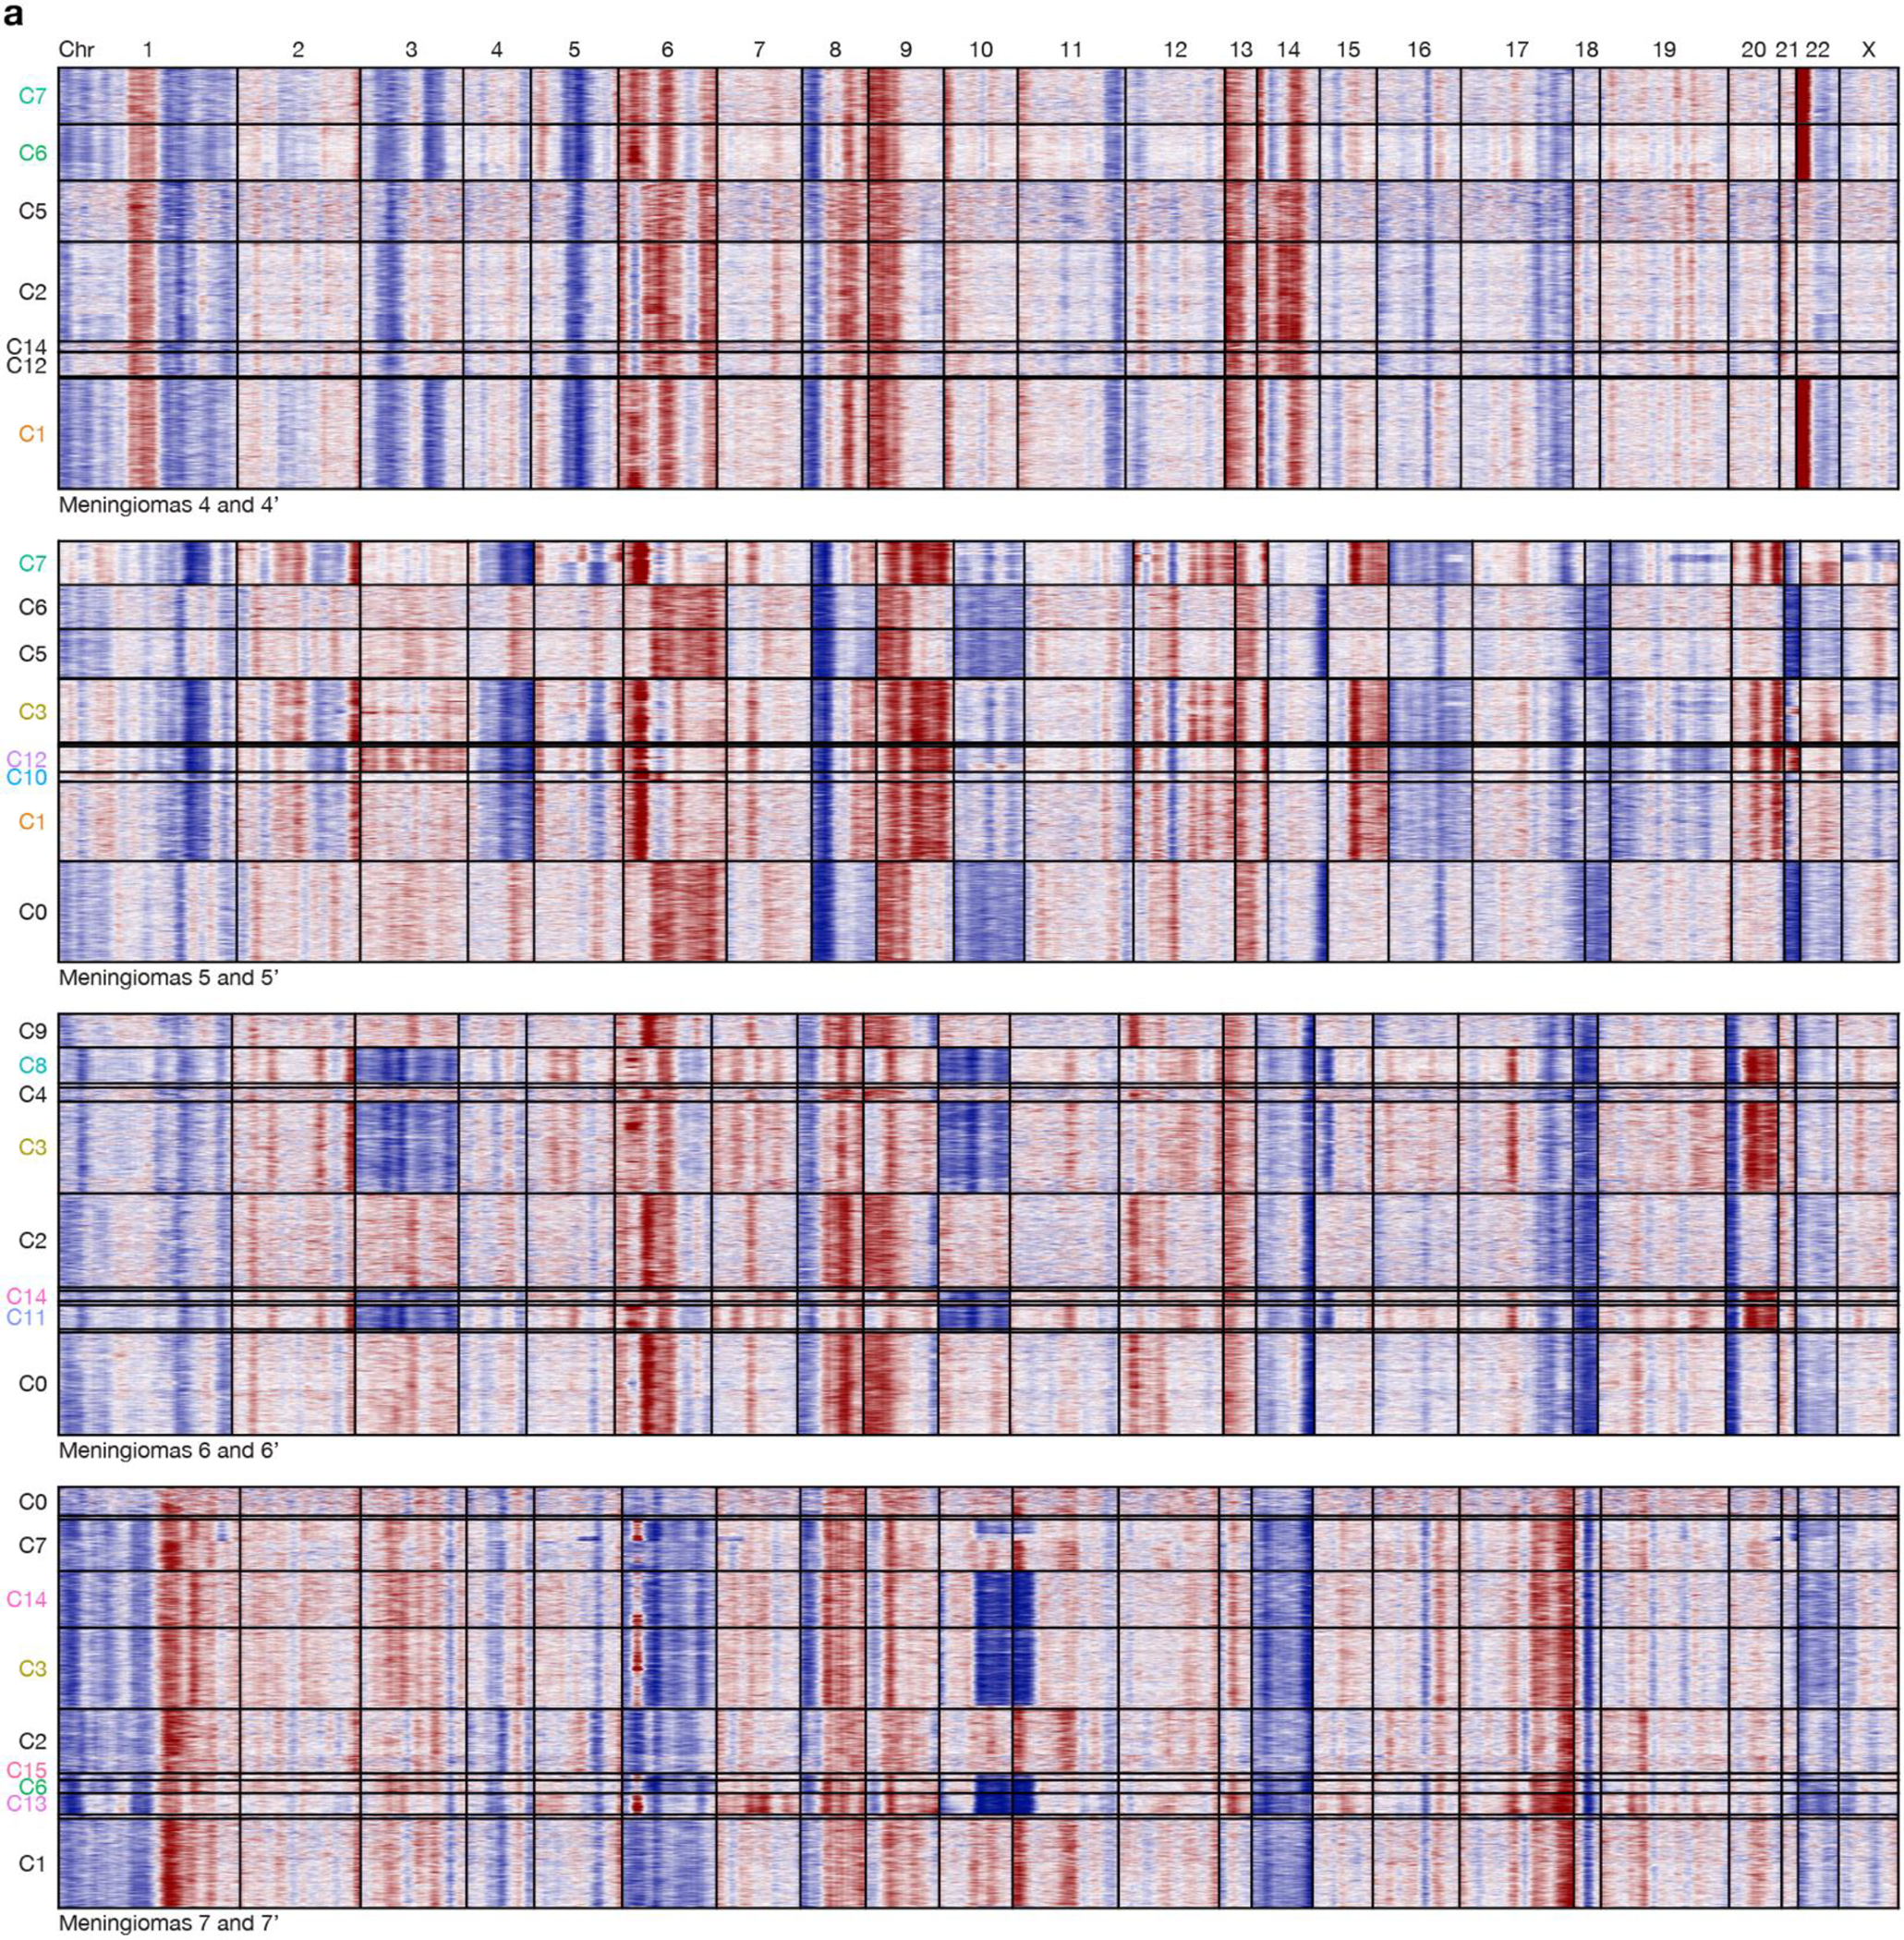
a, InferCNV traces of copy number variants across unsupervised hierarchical transcriptome clusters from matched pairs of primary and recurrent meningiomas after Harmony batch correction.
Extended Data Fig. 7. Regionally distinct meningiomas are distinguished by divergent intratumor gene and protein expression programs and copy number variants.
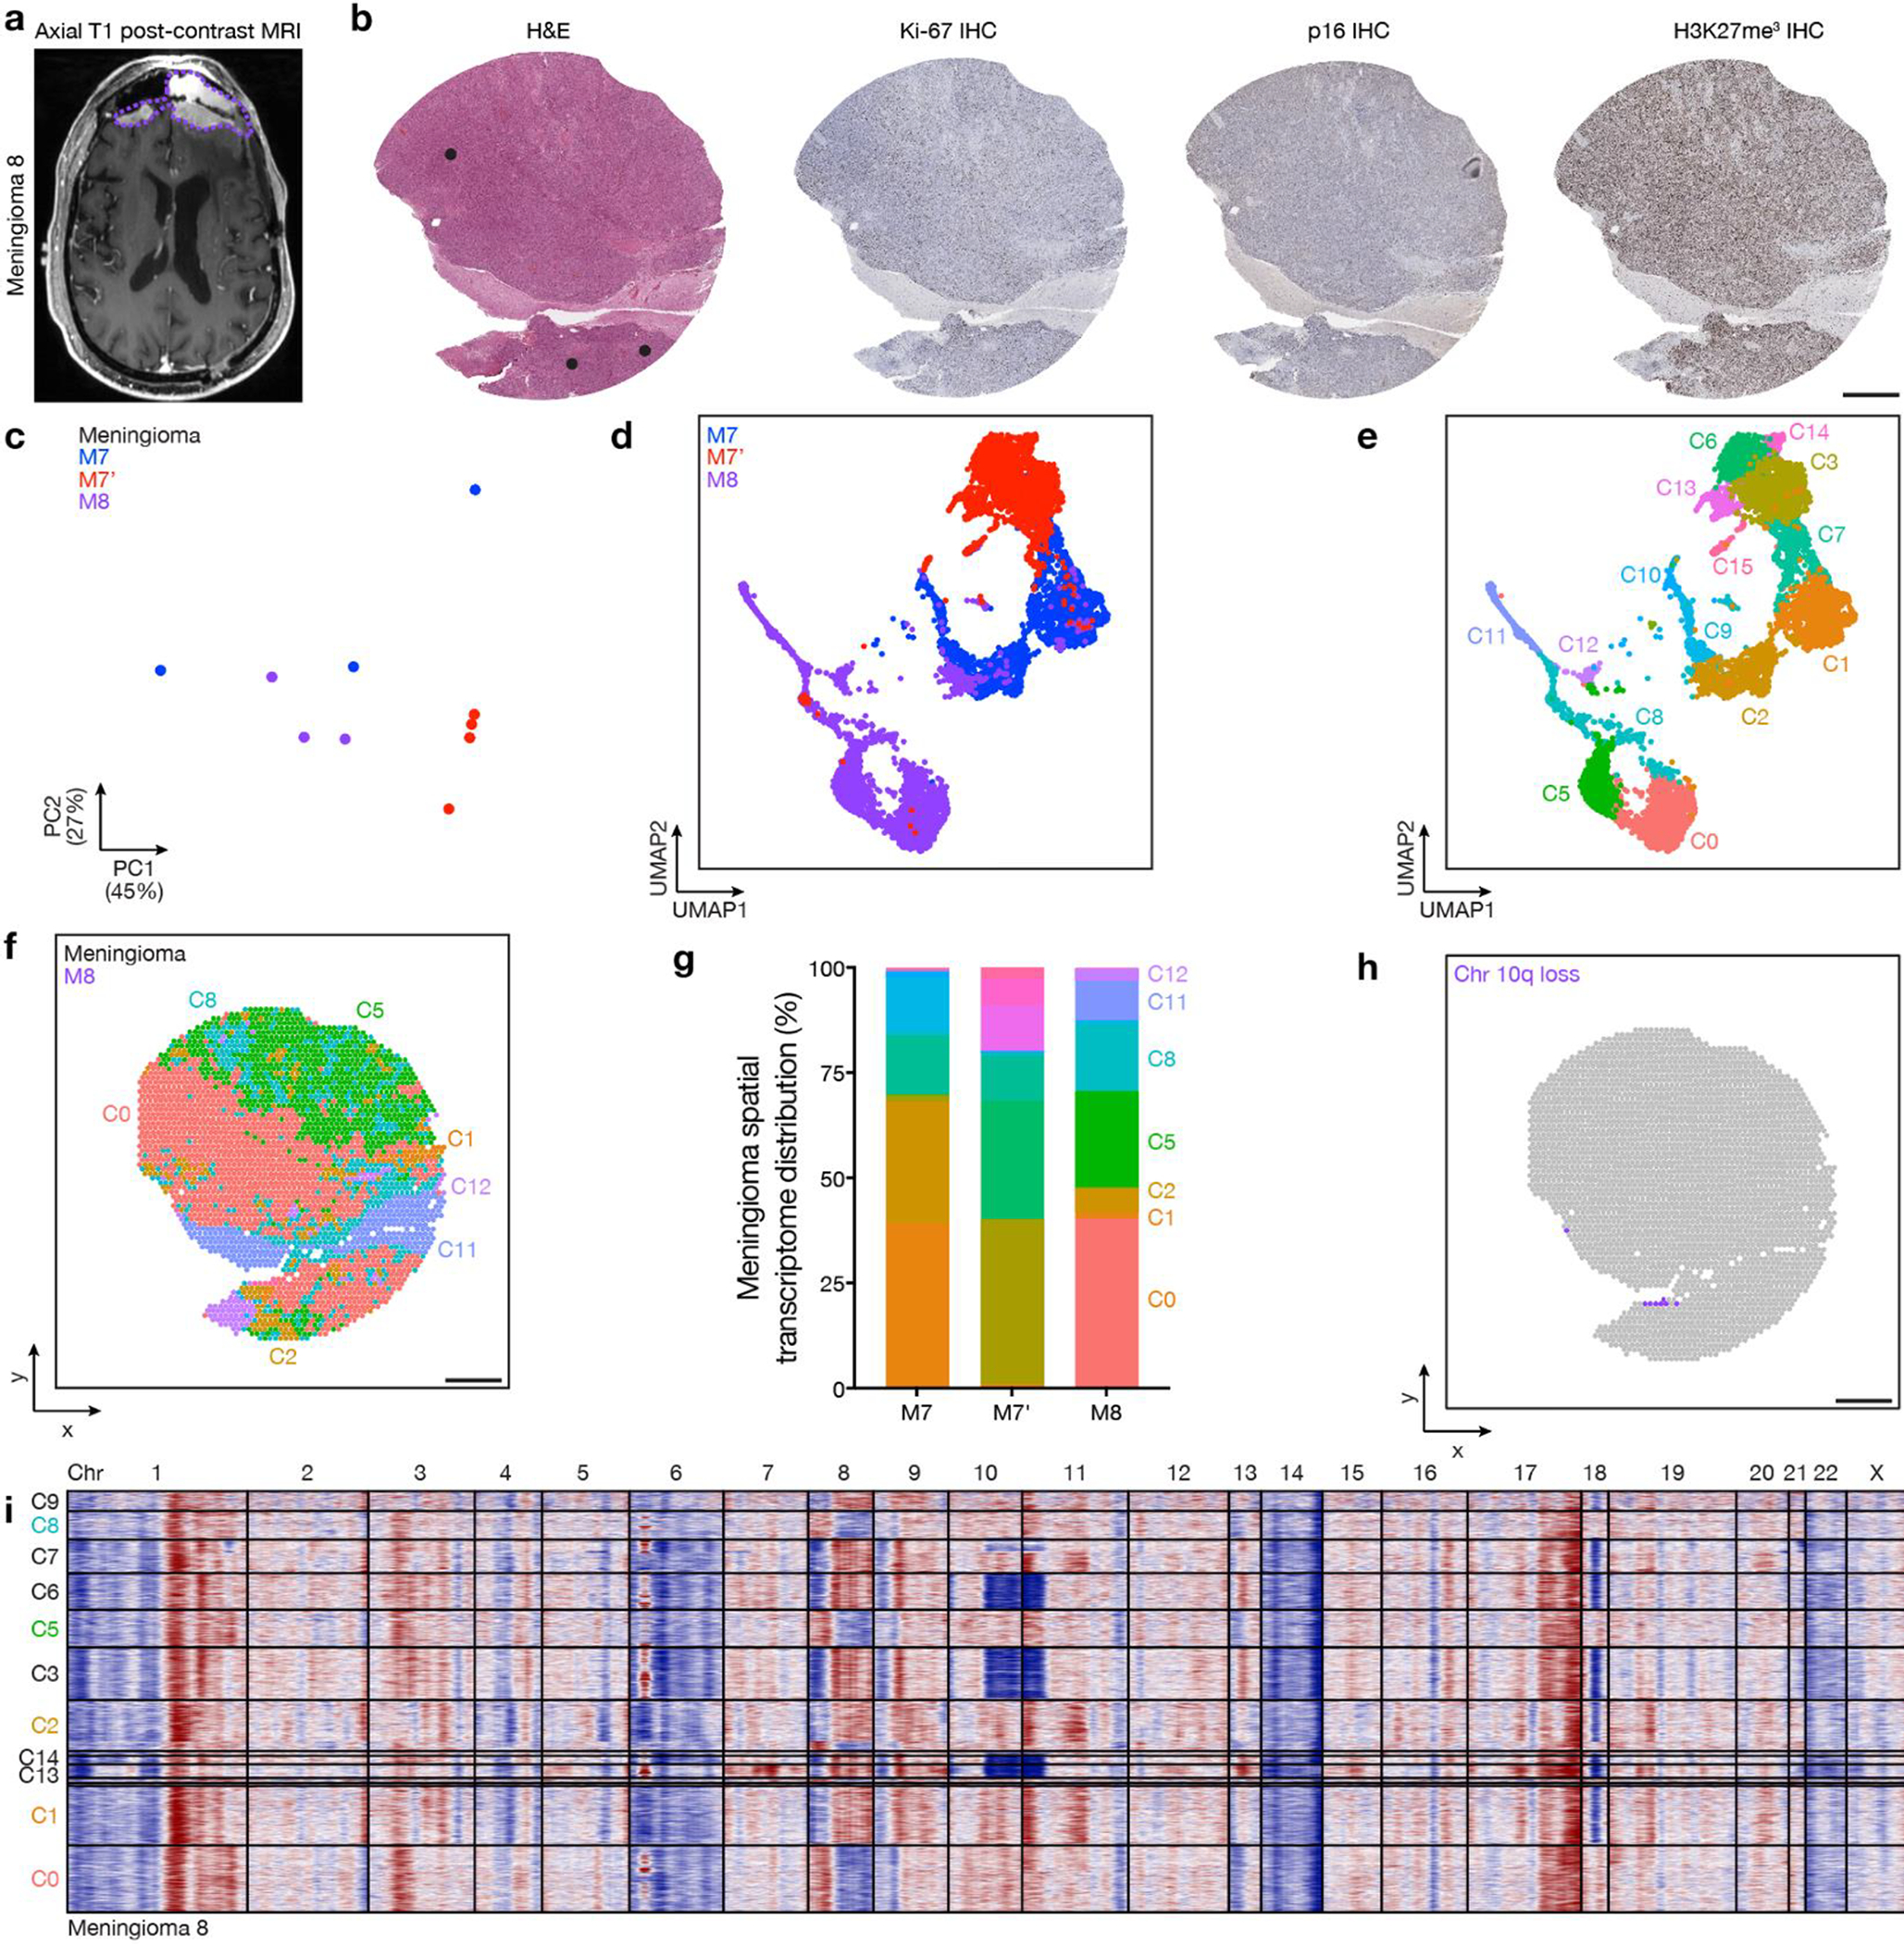
a, Preoperative T1 post-contrast magnetic resonance imaging (MRI) of meningioma M8 from patient 7, which was regionally distinct compared to M7 and M7’ (Fig. 3a). b, Representative H&E-stained sections and immunohistochemistry (IHC) for Ki-67, p16, or H3K27me3 from M8. Dots show regions of spatial protein profiling. Scale bar, 1mm. c, Principal component (PC) analysis of spatial protein profiling from M7, M7’, and M8. d, Uniform manifold approximation and projection (UMAP) of M7, M7’, and M8 spatial transcriptomes after Harmony batch correction shaded by sample of origin. e, UMAP of M7, M7’, and M8 spatial transcriptomes after Harmony batch correction shaded by unsupervised hierarchical clusters. f, Spatial distribution of unsupervised hierarchical spatial transcriptome clusters from M7, M7’, and M8 after Harmony batch correction. Scale bar, 1mm. g, Distribution of unsupervised hierarchical spatial transcriptome clusters from M7, M7’, and M8 after Harmony batch correction. h, Spatial distribution of unsupervised hierarchical transcriptome clusters harboring chromosome 10q loss in M8 from InferCNV (Fig. 3c). Scale bar, 1mm. i, InferCNV traces of copy number variants across unsupervised hierarchical transcriptome clusters from M8 after Harmony batch correction.
Extended Data Fig. 8. Primary and recurrent meningiomas are distinguished by divergent intratumor protein expression programs.
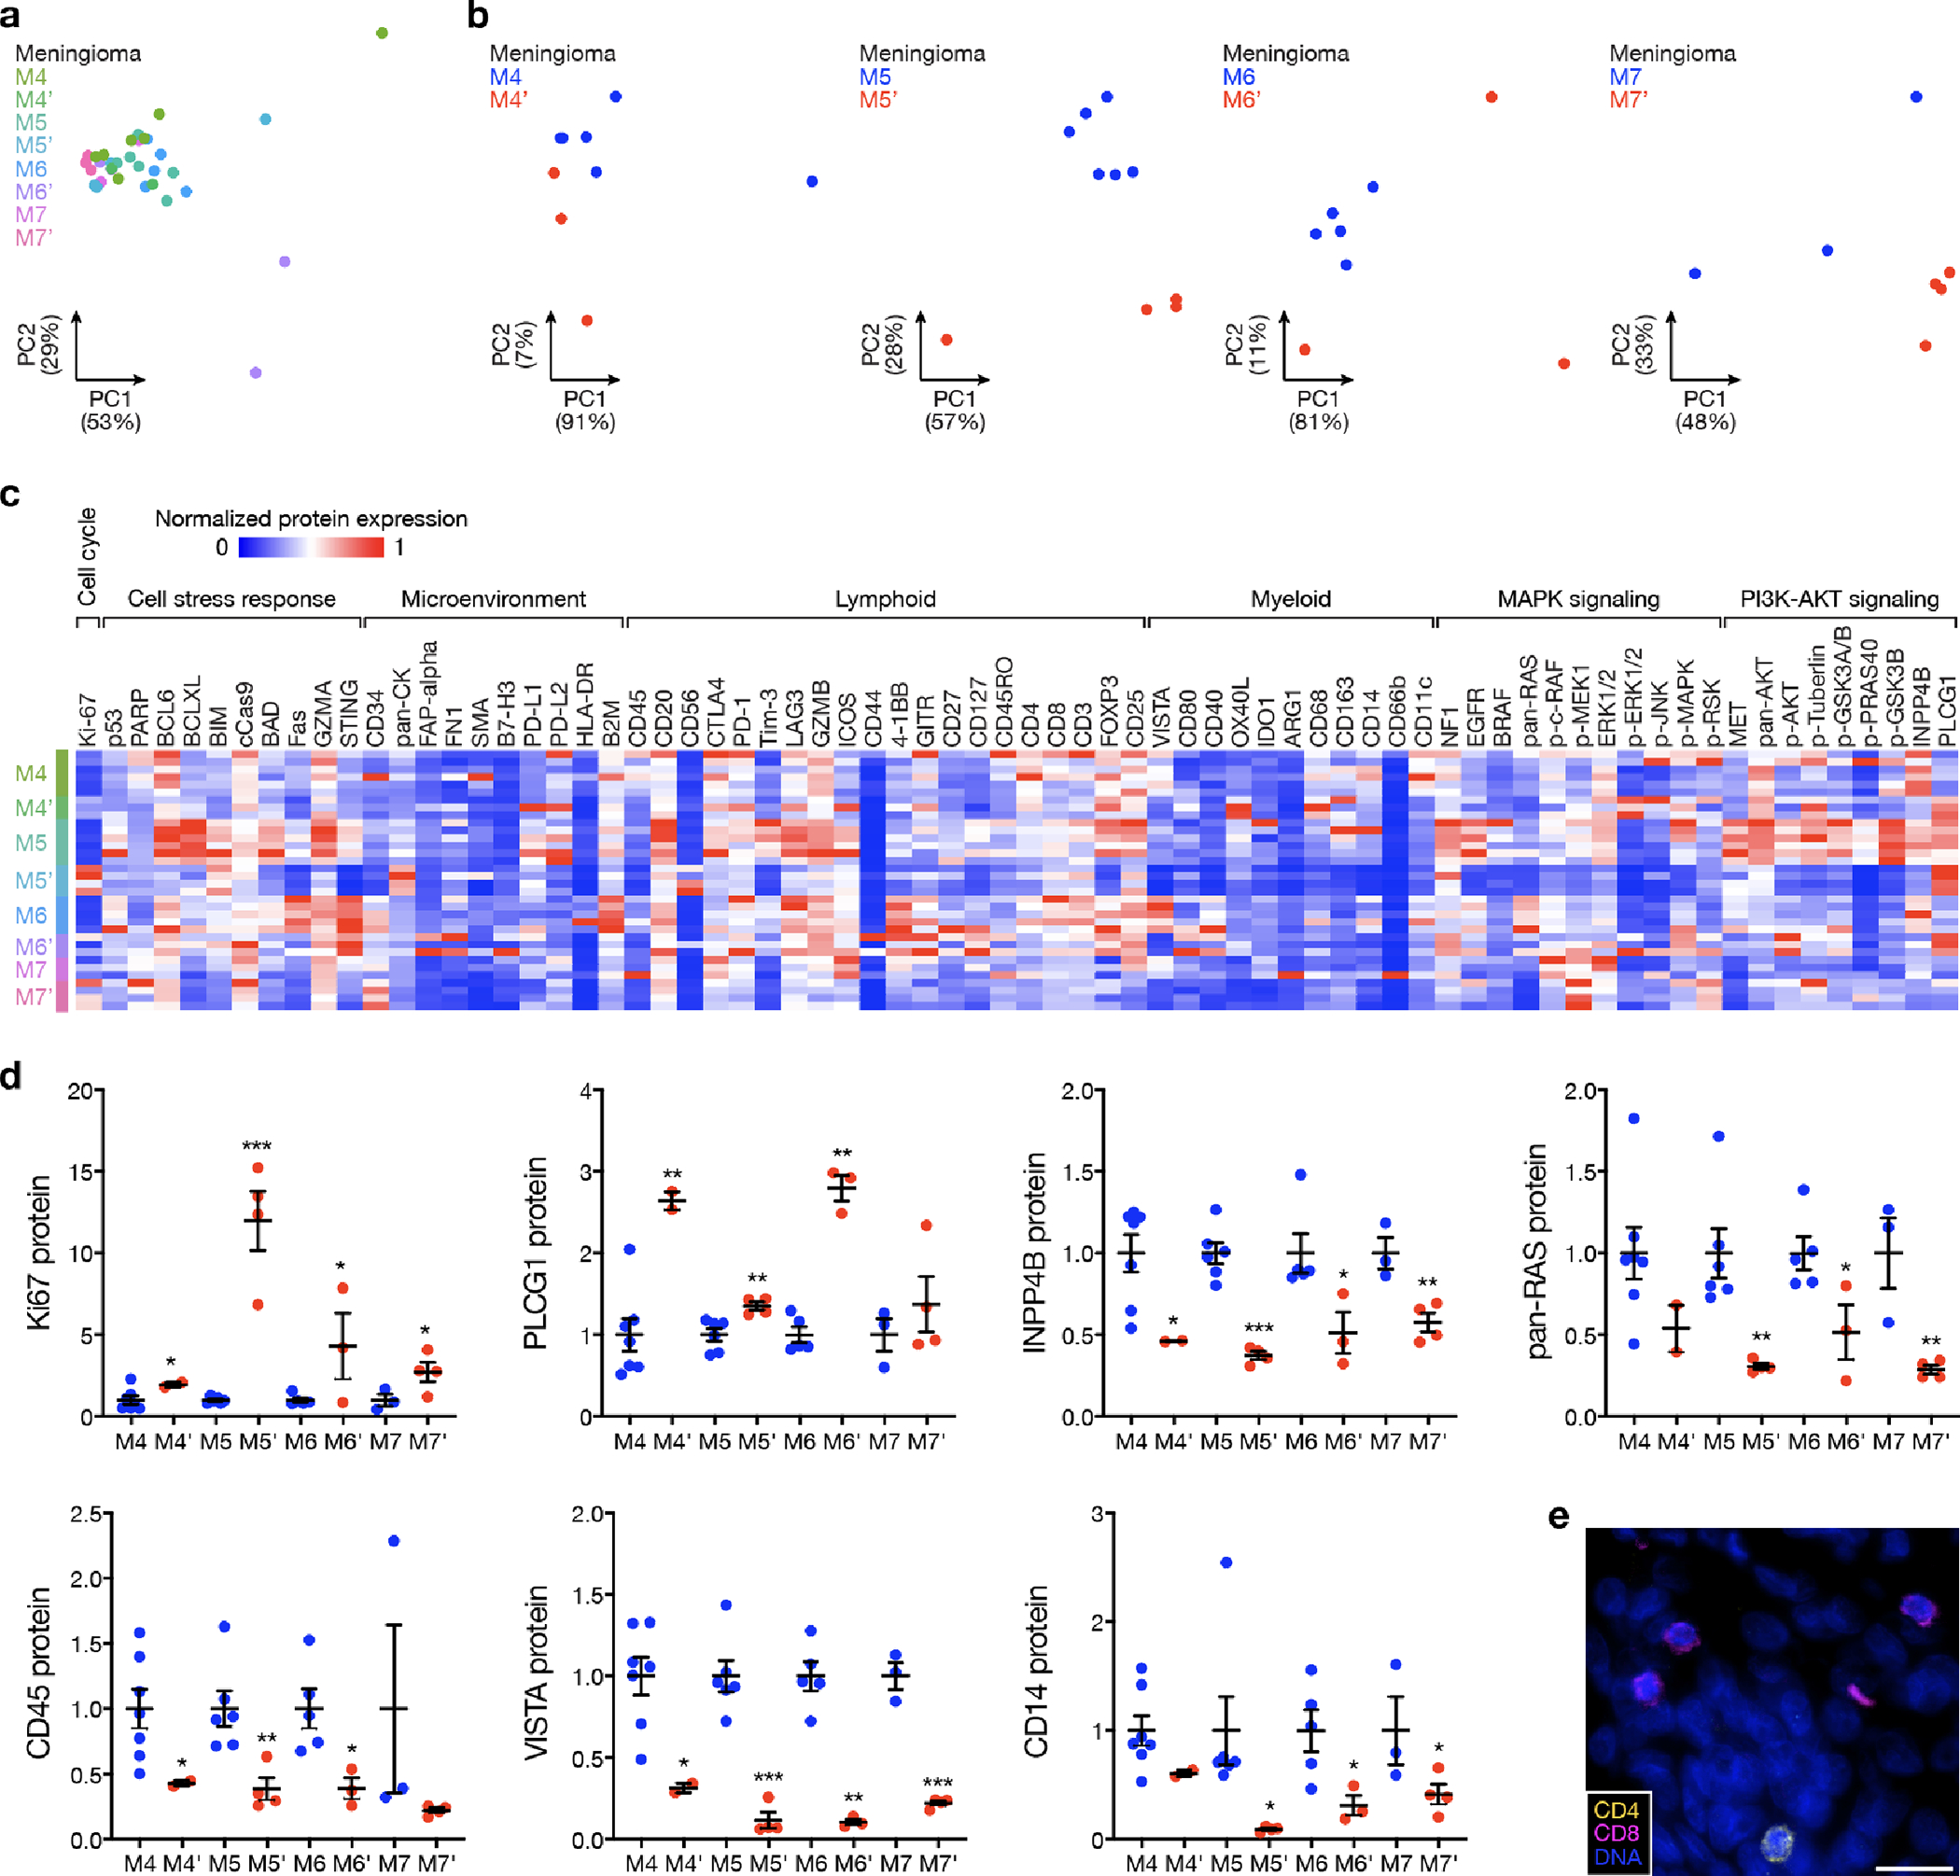
a and b, Principal component (PC) analysis of spatial protein profiling from matched pairs of primary and recurrent meningiomas. c, Spatial proteins from matched pairs of primary and recurrent meningiomas. d, Quantification of differentially expressed spatial proteins from at least 3 of 4 matched pairs of primary (M4 n=7, M5 n=6, M6 n=5, M7 n=3) and recurrent (M4’ n=2, M5’ n=4, M6’ n=3, M7’ n=4) meningiomas. Lines represent means and error bars represent standard error of the means. Student’s t tests, one-sided, *≤0.05, **p≤0.01, ***p≤0.0001. e, Multiplexed seqIF microscopy showing sparse lymphocytes in the meningioma microenvironment. Scale bar, 20μm, similar across 3 high-power field replicates per tumor.
Extended Data Fig. 9. High-grade meningiomas are distinguished by regionally distinct intratumor protein expression programs.
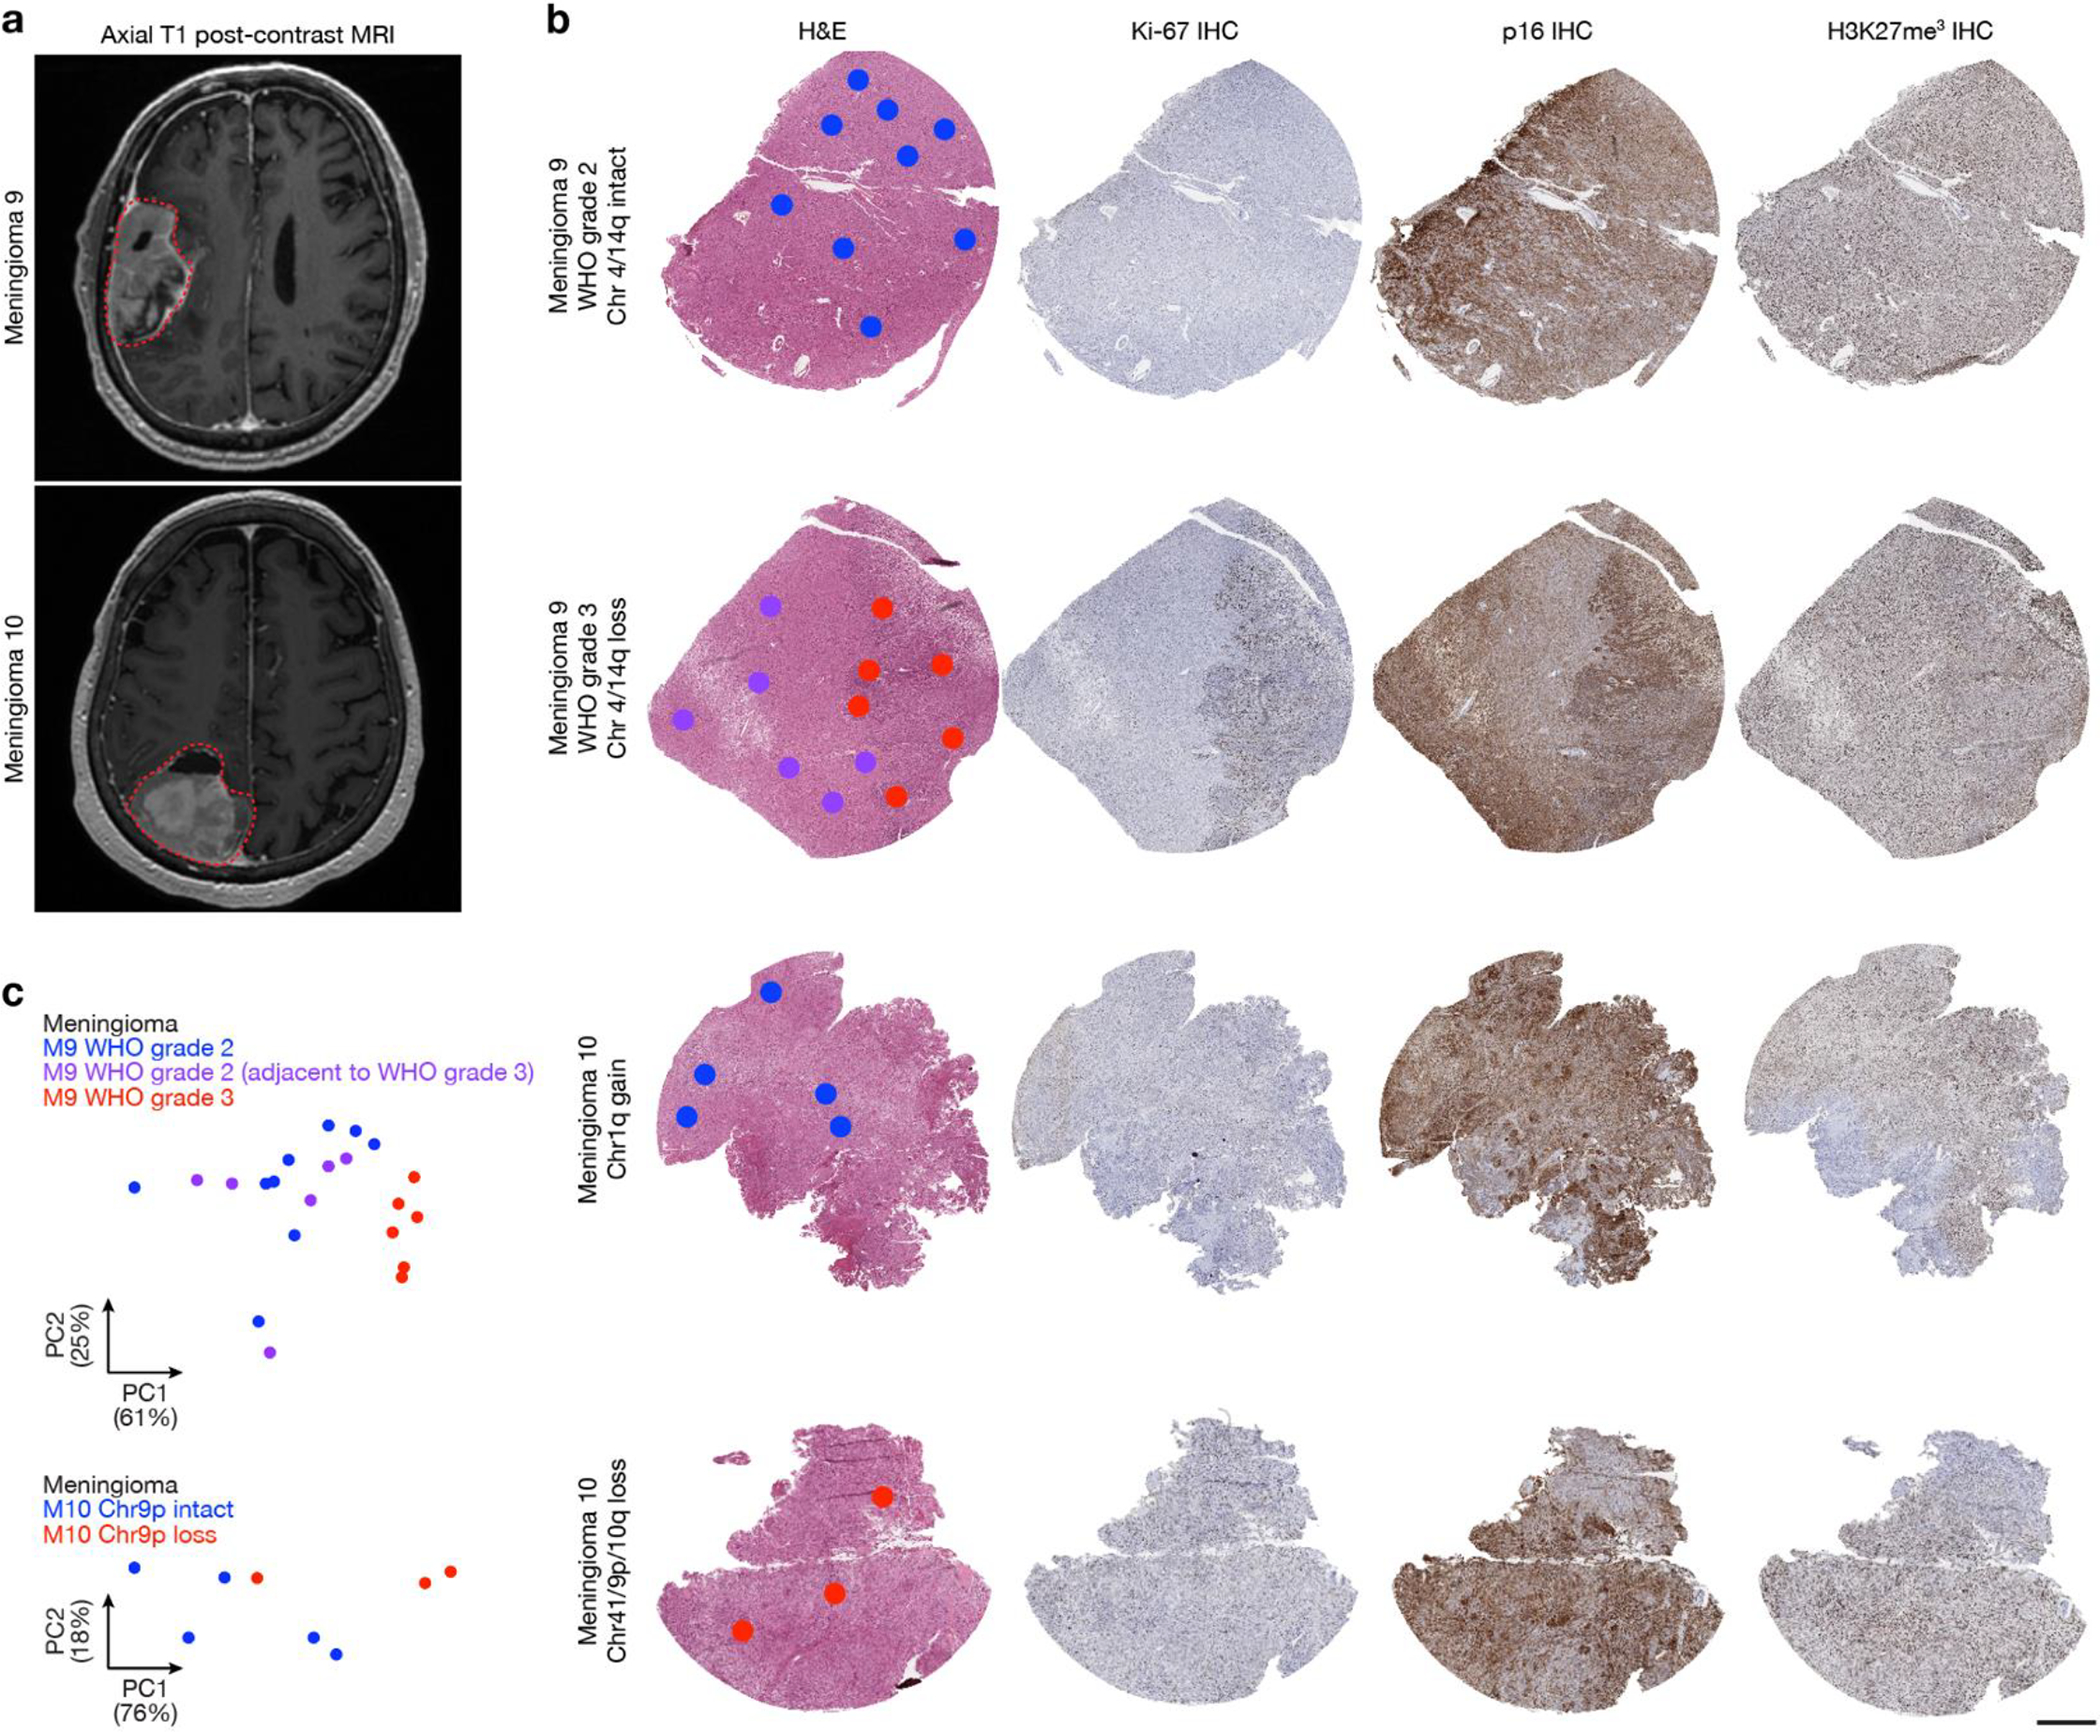
a, Preoperative T1 post-contrast magnetic resonance imaging (MRI) of meningiomas M9 and M10. b, Representative H&E-stained sections and immunohistochemistry (IHC) for Ki-67, p16, or H3K27me3 from regionally distinct meningioma samples. Dots show regions of spatial protein profiling. Scale bar, 1mm. c, Principal component (PC) analysis of spatial protein profiling from M9 and M10.
Extended Data Fig. 10. Validation of pharmacological strategies to overcome intratumor heterogeneity in high-grade meningiomas.
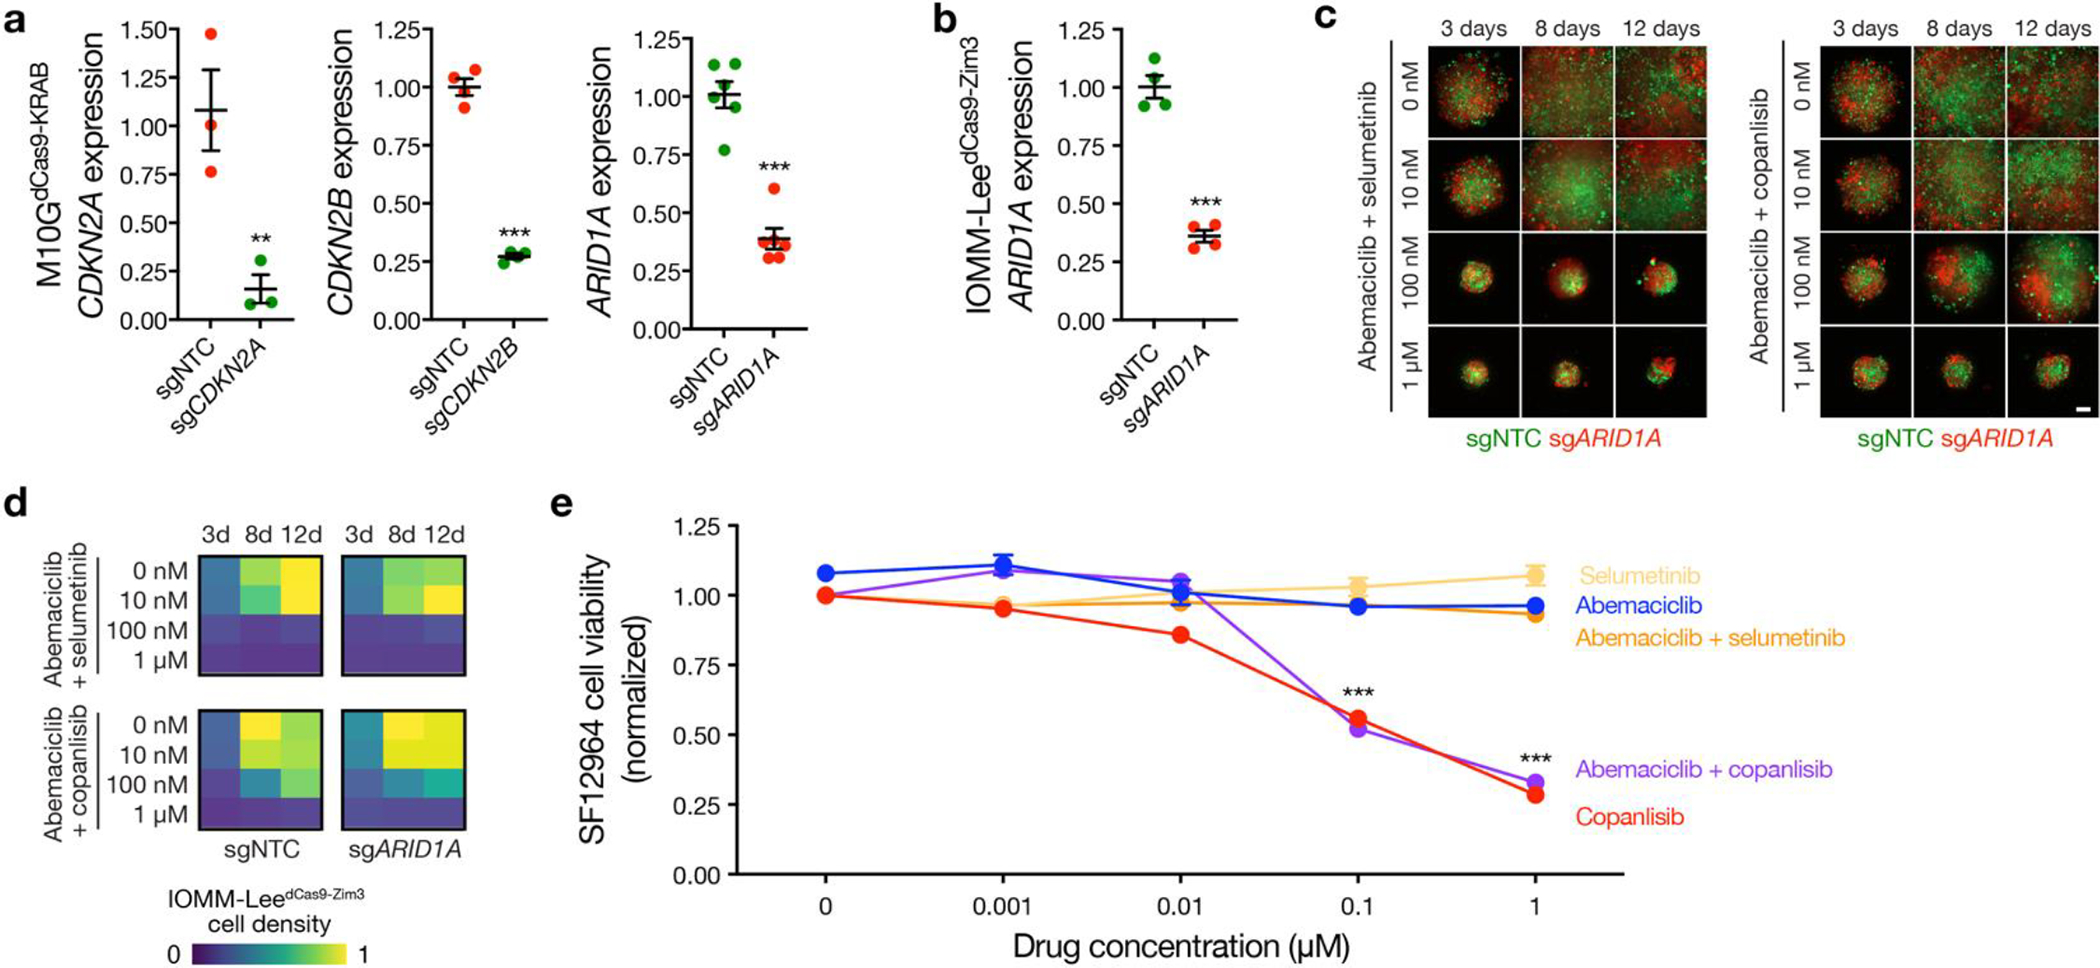
a, M10G patient-derived meningioma cells stably expressing CRISPRi machinery (dCas9-KRAB) and sgRNAs suppressing CDKN2A (sgCDKN2A, n=3), CDKN2B (sgCDKN2B, n=4), ARID1A (sgARID1A, n=6), or non-targeted control sgRNAs (sgNTC, n=3, 4, 6, respectively). Cells were labeled with red or green fluorescence proteins and integrated into 3D co-cultures for pharmacologic and live cell imaging experiments. b, IOMM-Lee meningioma cells that lack endogenous CDKN2A/B stably expressing CRISPRi machinery (dCas9-Zim3) and sgARID1A (n=4) or sgNTC (n=4). Cells were labeled with red or green fluorescence proteins and integrated into 3D co-cultures for pharmacologic and live cell imaging experiments. c, Combination molecular therapy treatments of 3D co-cultures of IOMM-LeedCas9-Zim3 meningioma cells expressing sgARID1A or sgNTC. Scale bar, 100μm. d, Quantification of combination molecular therapy treatments of 3D co-cultures of IOMM-LeedCas9-Zim3 meningioma cells expressing sgARID1A or sgNTC. Representative of 8 biological replicates per condition. e, MTT cell viability results normalized to vehicle control after 5 days of molecular therapy of SF12964, a patient-derived meningioma cell line from a WHO grade 3 meningioma (Hypermitotic DNA methylation group, NF2 p.Q165* mutation, chromosome 1p and 22q deletion, CDKN2A/B homozygous deletion, chromosome 1q amplification) that underwent reoperation after 5 months of abemaciclib treatment following prior surgeries and prior radiotherapy treatments. Representative of 8 biological replicates per condition. Lines represent means and error bars represent standard error of the means. Student’s t tests, one-sided, **p≤0.01, ***p≤0.0001.
Supplementary Material
Acknowledgements
We thank A. Shai and the staff of the UCSF Brain Tumor Center Biorepository and Pathology Core, B. Ndjamen and the staff of the Gladstone Institutes Histology Core, M. Bernardi and H-R. Lin and the staff of the Gladstone Institutes Genomics Core, E. Chow and the staff of the UCSF Center for Advanced Technology, and E. Zacco and the staff of the UCSF Laboratory for Cell Analysis Genome Core. Lunaphore COMET multiplexed seqIF was enabled by a gift from the Stephen M. Coffman trust to the Northwestern University Malnati Brain Tumor Institute of the Lurie Cancer Center. We appreciate the thoughtful comments and critiques from Joseph Costello and the members of the Raleigh lab during the inception, execution, and dissemination of this study. This study was supported by NIH grants T32 CA15102 and P50 CA097257 to C-H.G.L; NIH grant P50 CA097257 to W.C.C.; NIH grants F30 CA246808 and T32 GM007618 and the UCSF Wolfe Meningioma Program Project to A.C.; NIH grant P50 CA097257 to S. J. L and J.J.P.; NIH grant F32 CA213944, the UCSF Wolfe Meningioma Program Project, and the Northwestern University Malnati Brain Tumor Institute to S.T.M.; NIH grants R01 CA120813, R01 NS120547, and P50 CA221747 to A.B.H; NIH grants R01 NS117104, R01 NS118039, and P50 CA221747 to C.M.H.; and NIH grants R01 CA262311 and P50 CA097257 and the UCSF Wolfe Meningioma Program Project and the Trenchard Family Charitable Fund to D.R.R.
Footnotes
Competing interests statement
The authors declare no competing interests.
Code availability
No custom software, tools, or packages were used. The open-source software, tools, and packages used for data analysis in this study are referenced in the methods where applicable and include 10x Loupe Browser (v6.3.0), 10x SpaceRanger (v1.0), 2100 Bioanalyzer Expert Software (vB.02.10), Aggr (v2.0.0), AutoAnnotate (v1.3.5), Burrows-Wheeler aligner (v0.7.17), Clustree (v0.5.0), COMET Control Software (v1.0), Cutadapt (v3.7), Cytoscape (v3.7.2), DESeq2 (v1.36.0), EnrichmentMap (v3.3.4), FASTQC (v0.11.9), featureCounts (v2.0.0), Genome Analysis Toolkit (v4.3.0.0), GSEA (v4.3.2), Harmony (v0.1.1), HISAT2 (v2.2.0), Integrative Genome Viewer (v.2.16.0), inferCNV (1v.14.0), MultiQC (v1.12), NxClinical (v6.0), Olympus cellSens Standard Imaging (v1.16), Picard (v2.27.5), R (v3.6.1 and v4.2.1), RStudio (v2022.07.02), SeSAMe (v3.10), Seurat (v4.3.0), spatialInferCNV (v0.1.0), SCDC (v 0.0.0.9000), and SpatialFeatureplot (Seurat v3). Code written for this project is available on GitHub (https://zenodo.org/doi/10.5281/zenodo.10927737)66.
Data availability
DNA sequencing and spatial transcriptomic data that support the findings of this study have been deposited in the Sequence Read Archive (https://www.ncbi.nlm.nih.gov/sra) under BioProject ID PRJNA950017. DNA methylation, and RNA sequencing data that support the findings of this study have been deposited in the NCBI Gene Expression Omnibus (https://www.ncbi.nlm.nih.gov/geo/) under accession numbers GSE228316 (DNA methylation) and GSE228433 (RNA sequencing). The publicly available GRCh38 (hg38) and CRCh37.p13 (hg19) were used in this study. Spatial proteomic data processed counts are provided in Supplementary Table 5. Other source data are also provided with this paper.
References
- 1.Ostrom QT et al. CBTRUS Statistical Report: Primary Brain and Other Central Nervous System Tumors Diagnosed in the United States in 2015–2019. Neuro-oncology 24, v1–v95 (2022). [DOI] [PMC free article] [PubMed] [Google Scholar]
- 2.Goldbrunner R et al. EANO guideline on the diagnosis and management of meningiomas. Neuro-oncology 23, 1821–1834 (2021). [DOI] [PMC free article] [PubMed] [Google Scholar]
- 3.Lin D et al. Trends in intracranial meningioma incidence in the United States, 2004–2015. Cancer Med-us 8, 6458–6467 (2019). [DOI] [PMC free article] [PubMed] [Google Scholar]
- 4.Sahm F et al. DNA methylation-based classification and grading system for meningioma: a multicentre, retrospective analysis. Lancet Oncol. (2017) doi: 10.1016/s1470-2045(17)30155-9. [DOI] [PubMed] [Google Scholar]
- 5.Olar A et al. Global epigenetic profiling identifies methylation subgroups associated with recurrence-free survival in meningioma. Acta Neuropathol 133, 431–444 (2017). [DOI] [PMC free article] [PubMed] [Google Scholar]
- 6.Choudhury A et al. Meningioma DNA methylation groups identify biological drivers and therapeutic vulnerabilities. Nat. Genet. 54, 649–659 (2022). [DOI] [PMC free article] [PubMed] [Google Scholar]
- 7.Patel AJ et al. Molecular profiling predicts meningioma recurrence and reveals loss of DREAM complex repression in aggressive tumors. Proc. Natl. Acad. Sci. U.S.A. 116, 21715–21726 (2019). [DOI] [PMC free article] [PubMed] [Google Scholar]
- 8.Driver J et al. A Molecularly Integrated Grade for Meningioma. Neuro Oncol (2021) doi: 10.1093/neuonc/noab213. [DOI] [PMC free article] [PubMed] [Google Scholar]
- 9.Maas SLN et al. Integrated Molecular-Morphologic Meningioma Classification: A Multicenter Retrospective Analysis, Retrospectively and Prospectively Validated. J. Clin. Oncol. JCO2100784 (2021) doi: 10.1200/jco.21.00784. [DOI] [PMC free article] [PubMed] [Google Scholar]
- 10.Nassiri F et al. A clinically applicable integrative molecular classification of meningiomas. Nature 597, 119–125 (2021). [DOI] [PMC free article] [PubMed] [Google Scholar]
- 11.Choudhury A et al. Hypermitotic meningiomas harbor DNA methylation subgroups with distinct biological and clinical features. Neuro-oncology (2022) doi: 10.1093/neuonc/noac224. [DOI] [PMC free article] [PubMed] [Google Scholar]
- 12.Vasudevan HN et al. Intratumor and informatic heterogeneity influence meningioma molecular classification. Acta Neuropathol 1–5 (2022) doi: 10.1007/s00401-022-02455-y. [DOI] [PMC free article] [PubMed] [Google Scholar]
- 13.Magill ST et al. Multiplatform genomic profiling and magnetic resonance imaging identify mechanisms underlying intratumor heterogeneity in meningioma. Nat Comms 11, 1–15 (2020). [DOI] [PMC free article] [PubMed] [Google Scholar]
- 14.Louis DN et al. The 2021 WHO Classification of Tumors of the Central Nervous System: a summary. Neuro Oncol 23, 1231–1251 (2021). [DOI] [PMC free article] [PubMed] [Google Scholar]
- 15.Chen WC et al. Radiotherapy for meningiomas. J Neuro-oncol 160, 505–515 (2022). [DOI] [PMC free article] [PubMed] [Google Scholar]
- 16.Brastianos PK et al. Advances in multidisciplinary therapy for meningiomas. Neuro-oncology 21, i18–i31 (2019). [DOI] [PMC free article] [PubMed] [Google Scholar]
- 17.Wen PY, Quant E, Drappatz J, Beroukhim R & Norden AD Medical therapies for meningiomas. J. Neurooncol. 99, 365–378 (2010). [DOI] [PubMed] [Google Scholar]
- 18.Preusser M et al. Trabectedin for recurrent WHO grade 2 or 3 meningioma: A randomized phase II study of the EORTC Brain Tumor Group (EORTC-1320-BTG). Neuro-oncology 24, 755–767 (2021). [DOI] [PMC free article] [PubMed] [Google Scholar]
- 19.Bi WL et al. Activity of PD-1 blockade with Nivolumab among patients with recurrent atypical/anaplastic meningioma: Phase II trial results. Neuro Oncol (2021) doi: 10.1093/neuonc/noab118. [DOI] [PMC free article] [PubMed] [Google Scholar]
- 20.Brastianos PK et al. Phase 2 study of pembrolizumab in patients with recurrent and residual high-grade meningiomas. Nat Commun 13, 1325 (2022). [DOI] [PMC free article] [PubMed] [Google Scholar]
- 21.Chen WC et al. Targeted gene expression profiling predicts meningioma outcomes and radiotherapy responses. Nat. Med. 1–1 (2023) doi: 10.1038/s41591-023-02586-z. [DOI] [PMC free article] [PubMed] [Google Scholar]
- 22.Gilbert LA et al. Genome-Scale CRISPR-Mediated Control of Gene Repression and Activation. Cell 159, 647–661 (2014). [DOI] [PMC free article] [PubMed] [Google Scholar]
- 23.Kline CN et al. Targeted next-generation sequencing of pediatric neuro-oncology patients improves diagnosis, identifies pathogenic germline mutations, and directs targeted therapy. Neuro-oncology now254 (2016) doi: 10.1093/neuonc/now254. [DOI] [PMC free article] [PubMed] [Google Scholar]
- 24.Youngblood MW et al. Correlations between genomic subgroup and clinical features in a cohort of more than 3000 meningiomas. J. Neurosurg. 1, 1–10 (2019). [DOI] [PubMed] [Google Scholar]
- 25.Sahm F et al. TERT Promoter Mutations and Risk of Recurrence in Meningioma. J. Natl. Cancer Inst. 108, djv377 (2016). [DOI] [PMC free article] [PubMed] [Google Scholar]
- 26.Guyot A et al. Analysis of CDKN2A gene alterations in recurrent and non-recurrent meningioma. J. Neurooncol. 44, 163–11 (2019). [DOI] [PubMed] [Google Scholar]
- 27.Youngblood MW, Miyagishima DF, Neuro LJ & 2020. Associations of Meningioma Molecular Subgroup and Tumor Recurrence. Neuro Oncol (2020) doi: 10.1093/neuonc/noaa226. [DOI] [PMC free article] [PubMed] [Google Scholar]
- 28.Chen WC et al. Histopathological features predictive of local control of atypical meningioma after surgery and adjuvant radiotherapy. J. Neurosurg. 130, 443–450 (2018). [DOI] [PubMed] [Google Scholar]
- 29.Tang V et al. Loss of p16 expression is a sensitive marker of CDKN2A homozygous deletion in malignant meningiomas. Acta Neuropathol 1–4 (2023) doi: 10.1007/s00401-023-02544-6. [DOI] [PMC free article] [PubMed] [Google Scholar]
- 30.Katz LM et al. Loss of histone H3K27me3 identifies a subset of meningiomas with increased risk of recurrence. Acta Neuropathol 135, 955–963 (2018). [DOI] [PubMed] [Google Scholar]
- 31.Ravi VM et al. Spatially resolved multi-omics deciphers bidirectional tumor-host interdependence in glioblastoma. Cancer Cell 40, 639–655.e13 (2022). [DOI] [PubMed] [Google Scholar]
- 32.Korsunsky I et al. Fast, sensitive and accurate integration of single-cell data with Harmony. Nat Methods 16, 1289–1296 (2019). [DOI] [PMC free article] [PubMed] [Google Scholar]
- 33.Couly GF & Douarin NML Mapping of the early neural primordium in quail-chick chimeras: II. The prosencephalic neural plate and neural folds: Implications for the genesis of cephalic human congenital abnormalities. Dev. Biol. 120, 198–214 (1987). [DOI] [PubMed] [Google Scholar]
- 34.Simões-Costa M & Bronner ME Establishing neural crest identity: a gene regulatory recipe. Development 142, 242–257 (2015). [DOI] [PMC free article] [PubMed] [Google Scholar]
- 35.Merritt CR et al. Multiplex digital spatial profiling of proteins and RNA in fixed tissue. Nat Biotechnol 38, 586–599 (2020). [DOI] [PubMed] [Google Scholar]
- 36.Shankar GM et al. Germline and somatic BAP1 mutations in high-grade rhabdoid meningiomas. Neuro-oncology 19, 535–545 (2017). [DOI] [PMC free article] [PubMed] [Google Scholar]
- 37.Vasudevan HN et al. Comprehensive Molecular Profiling Identifies FOXM1 as a Key Transcription Factor for Meningioma Proliferation. Cell Rep 22, 3672–3683 (2018). [DOI] [PMC free article] [PubMed] [Google Scholar]
- 38.Mangelinck A et al. MT2A is an early predictive biomarker of response to chemotherapy and a potential therapeutic target in osteosarcoma. Sci Rep-uk 9, 12301 (2019). [DOI] [PMC free article] [PubMed] [Google Scholar]
- 39.Borchert S et al. Impact of metallothionein-knockdown on cisplatin resistance in malignant pleural mesothelioma. Sci Rep-uk 10, 18677 (2020). [DOI] [PMC free article] [PubMed] [Google Scholar]
- 40.Patel AP et al. Single-cell RNA-seq highlights intratumoral heterogeneity in primary glioblastoma. Science 344, 1396–1401 (2014). [DOI] [PMC free article] [PubMed] [Google Scholar]
- 41.Erickson A et al. Spatially resolved clonal copy number alterations in benign and malignant tissue. Nature 608, 360–367 (2022). [DOI] [PMC free article] [PubMed] [Google Scholar]
- 42.Nabors LB et al. Central Nervous System Cancers, Version 3.2020, NCCN Clinical Practice Guidelines in Oncology. J Natl Compr Canc Ne 18, 1537–1570 (2020). [DOI] [PubMed] [Google Scholar]
- 43.Almeida A. N. de et al. Clinical Outcome, Tumor Recurrence, and Causes of Death: A Long-Term Follow-Up of Surgically Treated Meningiomas. World Neurosurg 102, 139–143 (2017). [DOI] [PubMed] [Google Scholar]
- 44.Menke JR et al. Somatostatin receptor 2a is a more sensitive diagnostic marker of meningioma than epithelial membrane antigen. Acta Neuropathol 130, 441–443 (2015). [DOI] [PubMed] [Google Scholar]
- 45.Doki Y et al. Nivolumab Combination Therapy in Advanced Esophageal Squamous-Cell Carcinoma. N. Engl. J. Med. 386, 449–462 (2022). [DOI] [PubMed] [Google Scholar]
- 46.Forde PM et al. Neoadjuvant Nivolumab plus Chemotherapy in Resectable Lung Cancer. N. Engl. J. Med. 386, 1973–1985 (2022). [DOI] [PMC free article] [PubMed] [Google Scholar]
- 47.Hellmann MD et al. Nivolumab plus Ipilimumab in Lung Cancer with a High Tumor Mutational Burden. N. Engl. J. Med. 378, 2093–2104 (2018). [DOI] [PMC free article] [PubMed] [Google Scholar]
- 48.Motzer RJ et al. Nivolumab plus Ipilimumab versus Sunitinib in Advanced Renal-Cell Carcinoma. N. Engl. J. Med. 378, 1277–1290 (2018). [DOI] [PMC free article] [PubMed] [Google Scholar]
- 49.Hellmann MD et al. Nivolumab plus Ipilimumab in Advanced Non–Small-Cell Lung Cancer. N. Engl. J. Med. 381, 2020–2031 (2019). [DOI] [PubMed] [Google Scholar]
- 50.Motzer RJ et al. Nivolumab versus Everolimus in Advanced Renal-Cell Carcinoma. N. Engl. J. Med. 373, 1803–1813 (2015). [DOI] [PMC free article] [PubMed] [Google Scholar]
- 51.James L et al. Combined Nivolumab and Ipilimumab or Monotherapy in Untreated Melanoma. N. Engl. J. Med. 373, 23–34 (2015). [DOI] [PMC free article] [PubMed] [Google Scholar]
- 52.Caroline R et al. Nivolumab in Previously Untreated Melanoma without BRAF Mutation. N. Engl. J. Med. 372, 320–330 (2015). [DOI] [PubMed] [Google Scholar]
- 53.Webb AE, Kundaje A & Brunet A Characterization of the direct targets of FOXO transcription factors throughout evolution. Aging Cell 15, 673–685 (2016). [DOI] [PMC free article] [PubMed] [Google Scholar]
- 54.Corniola MV, Lemée J-M & Meling TR Histological transformation in recurrent WHO grade I meningiomas. Sci Rep-uk 10, 11220 (2020). [DOI] [PMC free article] [PubMed] [Google Scholar]
- 55.Nakasu S, Notsu A, Na K & Nakasu Y Malignant transformation of WHO grade I meningiomas after surgery or radiosurgery: systematic review and meta-analysis of observational studies. Neuro-oncology Adv 2, vdaa129 (2020). [DOI] [PMC free article] [PubMed] [Google Scholar]
- 56.Chen WC et al. Salvage therapy outcomes for atypical meningioma. J. Neurooncol. 138, 425–433 (2018). [DOI] [PubMed] [Google Scholar]
- 57.Gauchotte G et al. Prognostic Value of Histopathological Features and Loss of H3K27me3 Immunolabeling in Anaplastic Meningioma: A Multicenter Retrospective Study. J Neuropathology Exp Neurology 79, 754–762 (2020). [DOI] [PubMed] [Google Scholar]
- 58.Wang J et al. Clonal evolution of glioblastoma under therapy. Nat Genet 48, 768–776 (2016). [DOI] [PMC free article] [PubMed] [Google Scholar]
- 59.Andor N et al. Pan-cancer analysis of the extent and consequences of intratumor heterogeneity. Nat Med 22, 105–113 (2016). [DOI] [PMC free article] [PubMed] [Google Scholar]
- 60.Gerstung M et al. The evolutionary history of 2,658 cancers. Nature 578, 122–128 (2020). [DOI] [PMC free article] [PubMed] [Google Scholar]
- 61.Jamal-Hanjani M et al. Tracking the Evolution of Non–Small-Cell Lung Cancer. New Engl J Med 376, 2109–2121 (2017). [DOI] [PubMed] [Google Scholar]
- 62.Wang L et al. A single-cell atlas of glioblastoma evolution under therapy reveals cell-intrinsic and cell-extrinsic therapeutic targets. Nat Cancer 3, 1534–1552 (2022). [DOI] [PMC free article] [PubMed] [Google Scholar]
- 63.Lee WH Characterization of a newly established malignant meningioma cell line of the human brain: IOMM-Lee. Neurosurgery 27, 389–95-discussion 396 (1990). [PubMed] [Google Scholar]
- 64.Mei Y et al. Genomic profile of human meningioma cell lines. PLoS ONE 12, e0178322 (2017). [DOI] [PMC free article] [PubMed] [Google Scholar]
Methods-only references
- 65.Zhou W, Triche TJ, Laird PW & Shen H SeSAMe: reducing artifactual detection of DNA methylation by Infinium BeadChips in genomic deletions. Nucleic Acids Res. 46, e123 (2018). [DOI] [PMC free article] [PubMed] [Google Scholar]
- 66.DOI: 10.5281/zenodo.10927737 [DOI] [Google Scholar]
Associated Data
This section collects any data citations, data availability statements, or supplementary materials included in this article.
Supplementary Materials
Data Availability Statement
DNA sequencing and spatial transcriptomic data that support the findings of this study have been deposited in the Sequence Read Archive (https://www.ncbi.nlm.nih.gov/sra) under BioProject ID PRJNA950017. DNA methylation, and RNA sequencing data that support the findings of this study have been deposited in the NCBI Gene Expression Omnibus (https://www.ncbi.nlm.nih.gov/geo/) under accession numbers GSE228316 (DNA methylation) and GSE228433 (RNA sequencing). The publicly available GRCh38 (hg38) and CRCh37.p13 (hg19) were used in this study. Spatial proteomic data processed counts are provided in Supplementary Table 5. Other source data are also provided with this paper.


