

Abstract
Tumor-induced osteomalacia (TIO) poses a significant diagnostic challenge, leading to increased disease duration and patient burden also by missing clinical suspicion. Today, diagnosis of osteomalacia relies on invasive iliac crest biopsy, if needed. Therefore, a noninvasive method would be beneficial for patients with severe osteomalacia, such as TIO, to inform their clinical management and address specific needs, like estimating the regeneration capacity at high osteoid volumes (OVs) or the potential of a hungry bone syndrome after tumor removal. Furthermore, given the lack of comprehensive histological characterization of TIO, there is a need for additional tissue characterization. Therefore, our assessment encompassed iliac crest biopsies that were examined using quantitative electron backscattered microscopy, Raman spectroscopy, micro-computed tomography, and histology to analyze the biopsy tissue. Our clinical assessment encompassed DXA and high-resolution peripheral quantitative computed tomography (HR-pQCT) alongside with biochemical analyses and clinical evaluations. Combining imaging and clinical data, we established a model to predict the OV. We compared 9 TIO patients with 10 osteoporosis (OPO) patients and 10 healthy controls. Histological analyses confirmed a pronounced OV in TIO patients (OPO: 1.20% ± 1.23% vs TIO: 23.55% ± 12.23%, P < .0005), and spectroscopy revealed lower phosphate levels in TIO biopsies. By combining HR-pQCT and laboratory diagnostics, we developed a linear regression model to noninvasively predict the OV revealing significantly higher modeled OV/BVmodel values of 24.46% ± 14.22% for TIO compared to the control group (5.952% ± 3.44%, P ≤ .001). By combining laboratory diagnostics, namely, ALP and Tt.BMDRadius measured by HR-pQCT, we achieved the calculation of the virtual osteoid volume to bone volume ratio (OV/BVmodel) with a significant correlation to histology as well as reliable identification of TIO patients compared to OPO and control. This novel approach is potentially helpful for predicting OV by noninvasive techniques in diagnostic procedures and improving the clinical management of TIO.
Keywords: tumor induced osteomalacia, HR-pQCT, TIO, osteoid, FGF23
Lay Summary
Osteomalacia, a bone mineralization disease, results in soft bones due to a lack of calcium or phosphate. Tumor-induced osteomalacia (TIO) is an acquired and challenging form of osteomalacia due to low serum phosphate levels that often lead to prolonged patient suffering. Current diagnosis of osteomalacia involves surgical bone biopsies, but a noninvasive approach would be beneficial, improving clinical management and addressing specific needs like estimating the bone’s quality and ability to recover. We used advanced techniques like electron microscopy, spectroscopy, and high-resolution CT to study bone samples from 9 TIO patients. Additionally, we assessed their bone health through sophisticated imaging and blood analyses. Microscopy confirmed huge amounts of soft bone tissue due to a severe mineralization defect. By combining imaging and blood analysis, we developed a noninvasive method to predict the amount of soft tissue (osteoid) to understand soft bones without the need for surgical interventions. In conclusion, our innovative approach, combining blood diagnostics (alkaline phosphatase) with total BMD from high-resolution 3D clinical imaging of the lower arm, allows us to predict the osteoid amount virtually. This method can also compare TIO patients with controls or those with osteoporosis and might be helpful in the future.
Introduction
Tumor-induced osteomalacia (TIO) or oncogenic osteomalacia is a rare paraneoplastic syndrome caused by phosphaturic mesenchymal tumors (PMTs) mostly producing fibroblast growth factor 23 (FGF23) yet other phosphatonins can also be involved.1,2 FGF23, in addition to PTH and 1,25(OH)D2 (calcitriol), is a key regulator of phosphate homeostasis.2 Its primary physiological function is to safeguard against hyperphosphatemia; however, inadequately elevated FGF23 levels lead to renal phosphate loss. This loss is primarily attributed to the downregulation of the phosphate cotransporter NaPi2a in the proximal tubules of the kidney as well as the inhibition of 1α-hydroxylases and activation of 24-hydroxylases, resulting in reduced 1,25(OH)D2 levels.2
There is a well-documented delay in the diagnosis in these patients,3,4 which is at least in part explained by the rarity of the disease, the nonspecific symptoms, and the fact that serum phosphate is often not routinely assessed.4 Additionally, the difficulty in evaluating the osteoid volume (OV) by standard methods, which would raise the suspicion of an osteomalacia disease, and the fact that detection of the respective tumor is challenging, as it can be very small and located on any anatomical side,4 contribute to delayed diagnosis.
Chronic hypophosphatemia can lead to osteomalacia as adequate mineralization necessitates the presence of physiological serum phosphate.2 TIO patients with chronic hypophosphatemia experience a range of unspecific symptoms primarily affecting the musculoskeletal system, including bone pain, (insufficiency) fractures, muscle pain, weakness, fatigue, and more.5 As a result, they often seek consultations with specialists such as primary care and orthopedic specialists, rheumatologists, and endocrinologists resulting in a wide array of suspected diagnoses, including osteoporosis (OPO),6 which is, in some studies, the most prominent misdiagnosis.7
68Ga-DOTATATE-PET-CT offers high sensitivity and specificity compared to the previously utilized octreotide scans8 for the detection of somatostatin receptor-positive tumors causing TIO. Nevertheless, the initial diagnostic step involves assessing serum phosphate levels, a globally available parameter.6,9 In cases of hypophosphatemia, renal phosphate loss should be evaluated by measuring the levels of TmP/GFR10 and FGF23.6 In addition, in malacic conditions other than hypophosphatasia (HPP), alkaline phosphatase (ALP) and bone-specific alkaline phosphatase (BALP) are often elevated4,6and therefore important to measure.
Osteomalacia, as in case of TIO, is a mineralization disorder defined by histological criteria, including the OV and thickness (O.Th.) among others.11,12 However, bone biopsy is an invasive procedure and is rarely performed in daily routine practice. Although both TIO and OPO differ significantly regarding pathophysiology and histological presentation, mineralized bone mass and structure are affected in both,13,14 which can be assessed by noninvasive imaging techniques, namely, DXA and high-resolution peripheral quantitative computed tomography (HR-pQCT).
Therefore, we aimed to determine whether there is a TIO-specific pattern on DXA and HR-pQCT that can be used to distinguish TIO patients from OPO patients.
We decided to focus on TIO for different reasons: (1) we wanted to include acquired conditions only, as hereditary malacic bone conditions do influence the growing skeleton, leading to other distinct features such as rather high BMD and short stature that influence skeletal assessments, (2) we wanted to focus on conditions with known massively increased OV/BV as case numbers are limited and effects might be missed in diseases with less pronounced osteomalacia, and (3) in our daily routine, TIO is most often confused with OPO, unlike other, especially inherited malacic conditions.
In particular, we aimed to evaluate whether there is a correlation between advanced HR-pQCT imaging and laboratory assessment data and the severity of TIO when compared to the osteoid amount in patient-matched bone biopsies from TIO and OPO patients. We included healthy controls to evaluate specific bone alterations caused by OPO and osteomalacia (TIO) in comparison to unaffected individuals. To achieve these aims, we employed a comprehensive range of sophisticated methods to analyze the samples in depth. This multifaceted approach enabled a deeper understanding of the bone quality axis and the clinical axis, fostering novel connections through the integration of preclinical and clinical methodologies within the same cohort of patients.
Materials and methods
Patients
Bone biopsies from individuals diagnosed with TIO (n = 9) and OPO (n = 10) were selected from patients presenting at our specialized outpatient clinic, the National Bone Board in Hamburg, Germany. Control cases for clinical comparison (n = 10) were recruited from bone-healthy individuals who underwent osteological screening due to external referral because of suspected but not confirmed bone disease. Control cases were selected by DXA results within the reference range and no abnormalities in the biochemical assessment. Patients gave written informed consent for scientific evaluation of the harvested bone biopsies and for retrospective collection of the clinical data. This study was conducted in accordance with the respective ethical guidelines and was approved by the local ethics committee (PV7046). The inclusion time interval was from Oct. 2019 to Oct. 2022. The inclusion criteria were a diagnosis of TIO or OPO and available bone biopsies as well as patient age above 18 yr and ability to give consent. After suspicion of TIO, subsequent 68Ga-DOTATATE-PET-CT localization, and surgical excision, TIO was histologically confirmed by the proof of somatostatin-receptor (SSTR)- and FGF23-in situ hybridization positive PMTs in all cases.
Patients’ muscle performance was assessed using the chair rising test (CRT) and grip force (GF) evaluation. Maximum grip strength was determined using a hand-held dynamometer (Leonardo Mechanograph® GF, Novotec Medical), with the highest of 3 measurements recorded for each arm (left/right) for further analysis. CRT was conducted clinically using Leonardo Mechanograph® (Leonardo Mechanograph® GRFP STD, Novotec Medical). During the test, patients were instructed to perform 5 repetitions of standing up and sitting down as quickly as possible from a seated position on a bench. Maximum force and time per repetition were subsequently calculated.
Biochemical assessment
Biochemical analysis of calcium homeostasis and bone turnover was performed at our local laboratory. Serum levels of calcium, phosphate, vitamin D, PTH, and ALP were measured routinely, along with markers of bone formation such as BALP and osteocalcin as well as the urinary bone resorption marker deoxypyridinoline (DPD)/creatinine. In suspected TIO cases, intact FGF23 (iFGF23) and active (1,25) vitamin D levels were measured.
Areal bone mineral density
Areal bone mineral density (aBMD) was measured during routine clinical assessment. Z-scores were extracted according to the manufacturer’s software. Z-scores were used to account for the age of the patients below 50 yr. For clinical measurement, DXA was carried out on a Lunar iDXA (GE Healthcare). Scans were performed on both the proximal femora (femoral neck and total hip) and the lumbar spine (L1–L4). The lowest Z-score of the spine (of 2 neighboring vertebral bodies) and the lowest Z-score of the total femur or femoral neck were chosen.
Osteomalacia impacts cortical and trabecular bone compartments to varying extents.15 Moreover, specific skeletal regions are known to be predominantly cortical or trabecular,16 a distinction also evident in various DXA measurement areas.17 To account for these site-specific characteristics, we have established their relationship by contextualizing them with each other through division.
High-resolution peripheral quantitative computed tomography measurements
For noninvasive, high-resolution bone structure and mineralization evaluation, HR-pQCT was facilitated. Scans were performed either on first-generation HR-pQCT equipment at 82 μm isometric voxel size (XtremeCT I, Scanco Medical AG) or second-generation HR-pQCT equipment at 60.7 μm isometric voxel size (XtremeCT II, Scanco Medical AG). Scans were performed in accordance with established guidelines18 at the distal nondominant radius and contralateral tibia. In the case of data acquisition on second-generation HR-pQCT equipment, images were downscaled according to the manufacturer’s protocols and subsequently analyzed according to the first-generation settings and algorithms.18 The analyzed volume was represented by a stack of 110 slices of isotropic voxel size of 82 μm. HR-pQCT datasets were checked for movement artifacts,19 and datasets with a motion grading above 3 were excluded from structural analysis and FEA. This resulted in the exclusion of 2 patients from each group, TIO and OPO, respectively.
The following parameters were analyzed and presented: compartment-specific volumetric bone mineral densities (vBMDs), including total vBMD (Tt.BMD), trabecular vBMD (Tb.BMD), trabecular vBMD in the outer 40% of the trabecular compartment (metaBMD), and cortical vBMD (Ct.BMD). In addition, structural parameters were calculated and presented, including trabecular parameters such as the trabecular area (Tb.Ar), bone volume to tissue volume ratio (BV/TV), trabecular thickness (Tb.Th), trabecular number (Tb.N), and trabecular separation (Tb.Sp) as well as cortical parameters such as the cortical thickness (Ct.Th), cortical perimeter (Ct.Pm), and cortical area (Ct.Ar). FEA analysis was carried out on the 3D models of the scanned limb sections, as described in the Supplementary Material.
Histology
For TIO patients, iliac crest bone biopsies were acquired in the operating theater during the tumor removal surgery from the iliac crest. For OPO patients, iliac crest bone biopsies were taken for diagnostic reasons, primarily to exclude secondary causes of OPO. Biopsies were transferred to 4% formaldehyde directly after biopsy for subsequent processing. Biopsies were embedded in methyl methacrylate (MMA) and prepared for histological evaluation.12,20 Briefly, the tissue was dehydrated and subsequently infiltrated by MMA under controlled conditions and for polymerization. Subsequently, samples were microtomed at 4 μm thickness, and consecutive sections were stained with von Kossa, toluidine blue, and Masson-Goldner staining. Evaluation of the histological parameters presented in this manuscript was performed in accordance with established standards21 using the OsteoMeasure histomorphometry system (Osteometrics Inc.) exporting the following values: BV/TV, Tb.Th, O.Th, the osteoid surface per bone surface (OS/BS), the osteoid volume per tissue volume (OV/TV), and the osteoid volume per bone volume (OV/BV). To include a histological control group for advanced bone biopsy analysis, a group of age-matched iliac crest biopsies from the Hamburg Bone Registry12 was created and included (n = 10).
Quantitative backscattered electron imaging
For quantitative backscattered electron imaging (qBEI), the MMA-embedded biopsies were polished plane-parallel and subsequently coated with a carbon layer. Quantitative backscattered scanning electron imaging was carried out according to Roschger et al.22–24 as previously reported by our lab.25–27 The scanning electron microscope (Crossbeam 340, Zeiss AG) was operated at 20.00 kV at a constant working distance of 20 mm and a magnification of 100×. The brightness and contrast of the images were calibrated by imaging a carbon and aluminum standard. The corresponding gray values of carbon and aluminum were 4.8 and 222, respectively. Images were then transferred to a custom-made MATLAB routine to further calculate the mean and peak calcium content (Camean, CaPeak) as well as the percentage area of low and high mineral content area above and below the 95th percentile of gray value distribution (CaLow, CaHigh) and the bone mineral density distribution (BMDD) by means of full width at half maximum and the standard deviation of the gray value distribution (full width at half maximum and CaSD) as described elsewhere.28
Micro-CT analysis
Bone biopsies were scanned using a tabletop μCT 40 scanner (Scanco Medical AG) at an isometric voxel size of 15 μm with a tube voltage of 55 kVp. After reconstruction, trabecular bone was evaluated by drawing a manual contour to the respective compartment. Manufacturer scripts were used to evaluate the trabecular morphometry and density at a threshold of 290 mg HA/cm3 after Gaussian filtering with a kernel size of 0.8 and support of 1.
Raman spectroscopy
A Raman spectroscope was used with a 785 nm near-infrared laser to analyze the macromolecular components of the bone samples (inVia). The exposure time was set to 2 s and the number of accumulations to 10. The spectral range was between 400 and 1800 cm−1, and the spectral resolution was 0.968 cm−1. Rectangular maps (250 μm × 250 μm, step size 5 μm) with 121 spectra per map were measured. The interfering MMA signal was subsequently subtracted during postprocessing when spectra were baseline subtracted. The mineral-to-matrix ratio (MMR) (ν1PO4 [930–980 cm−1]/amide III [1215–1300 cm−1]) and carbonate-to-phosphate ratio (CPR) (CO3 [1050–1100 cm−1]/ν1PO4) were calculated and averaged per specimen after deleting invalid pixels from the map containing MMA or cracks or other disturbing structures not consisting of bone.
Statistical analysis
Groups were tested for normal distribution. In the case of group comparisons, if the data were distributed normally, ANOVA was performed followed by a post hoc test (Tukey). In the case of nonnormally distributed data, a Kruskal–Wallis test was performed. Box plots present the median with the vertical line, the mean by “+,” the upper and lower quartile by the box, and the maximum and minimum by whiskers. Correlation analyses were performed on the pooled group of TIO and OPO patients. Both the HR-pQCT parameters (including the ratios of specific HR-pQCT parameters) and the FEA results were tested. Simple linear regression was performed when the Pearson correlation showed r > 0.6 with P < .05. The significance level was set at 0.05 for all tests. Receiver operating characteristic (ROC) curve analysis was performed using GraphPad Prism v9.0.2 for selected parameters. Care was taken to select the intercept of sensitivity and specificity to report the highest possible values. We conducted linear regression analysis to explore the potential for predicting OV/BV by combining multiple laboratory and clinical imaging parameters as well as the strength and posture analysis parameters. Therefore, we used the forward inclusion linear regression model using JASP v0.16.3. We approached all laboratory and DXA as well as HR-pQCT parameters to the limitation of covariance. Despite offering all parameters (DXA, Laboratory, and HR-pQCT) to the linear regression model, the model exclusively selected HR-pQCT and laboratory parameters. Due to the limited number of patients, we have limited the number of variables to 2. To accommodate clinics without HR-pQCT access, we subsequently excluded HR-pQCT and focused the analysis solely on laboratory and DXA parameters. The model was generated using all TIO and OPO cases without motion artifacts. Subsequently, based on the HR-pQCT model values (ALP and Tt.BMDRadius), we calculated the same model for the clinical control group. The means were compared using ANOVA with post hoc Tukey’s test. Additionally, a ROC analysis was conducted on this dataset to check for the ability to separate TIO from others. Graphs were created with GraphPad Prism v9.0.2, and statistical analysis except ROC was performed on JASP v0.16.3.
Results
Clinical, biochemical, and BMD data
TIO was suspected in patients with hypophosphatemia, renal phosphate loss (determined by reduced TmP/GFR), and elevated (bone specific) ALP. In these patients, iFGF23 was evaluated, and 68Ga-DOTATATE-PET-CT was performed, identifying the causative tumor in all cases consistently with a high sensitivity, as previously described.8
The mean age of the included TIO patients was 55 yr (±9.7 yr; 44–70 yr), with a sex ratio of 4:5 (m:f). The clinical control subjects were aged 55 yr on average (±6.5 yr) with a sex ratio of 5:5 (m:f), whereas the OPO patients had a mean age of 48 yr (±13 yr) and a sex ratio of 7:3 (m:f). Suspicion of TIO was confirmed histologically after tumor removal by histopathological examination of the excised tissue and positive SSTR staining and FGF23-in situ hybridization. All measurements were done within a time period of 2 mo prior to surgery. The diagnostic findings were recorded before treatment initiation in all patients and preoperative treatment for TIO consisted of native and active vitamin D, whereas postoperatively, calcium and native vitamin D were administered to treat or prevent hungry bone disease.
Biochemical analyses only showed significant differences between groups for phosphate, ALP, BALP, and PTH levels. The phosphate level was significantly reduced in the TIO group compared to the OPO group (P = .0016). The levels of ALP and BALP were significantly higher in the TIO group compared to the OPO group (ALP: P = .0138, BALP: P = .0432). The PTH level was also higher in the TIO group compared to the OPO group (P = .0280). The laboratory assessment parameters are presented in Table 1. For TIO patients, iFGF23 levels were elevated, with an iFGF23mean of 442.78 ± 365.58 kRU/L (reference: 23.3–95.4 pg/mL), and the mean level of active vitamin D (1,25-dihydroxycholecalciferol) was 43.89 ± 18.89 ng/L (reference: 20–79 ng/L).
Table 1.
Clinical data for the 3 groups.
| Control | TIO | OPO | Post-hoc: Tukey | ||||||||
|---|---|---|---|---|---|---|---|---|---|---|---|
| Mean | ±SD | Mean | ±SD | Mean | ±SD | Control vs | Control vs | TIO vs | |||
| n | 10 | 9 | 10 | TIO | OPO | OPO | |||||
| Parameter | Unit | Range | P value | P value | P value | ||||||
| Calcium | mmol/L | 2.08–2.65 | 2.38 | 0.07 | 2.33 | 0.17 | 2.46 | 0.75 | .6511 | .2526 | .0512 |
| Phosphate | mmol/L | 0.78–1.65 | 1.01 | 0.17 | 0.46 | 0.25 | 0.84 | 0.32 | <.0001 | .1873 | .0016 |
| ALP | U/L | 46–116 | 62.40 | 18.49 | 166.44 | 104.59 | 81.80 | 31.74 | .0025 | .7544 | .0138 |
| BALP | μg/L | 5.2–24.4 | 9.53 | 4.08 | 51.89 | 56.68 | 14.70 | 5.75 | .0195 | .9296 | .0432 |
| BGLAP | μg/L | 5.4–59.1 | 17.82 | 6.66 | 18.59 | 5.05 | 18.70 | 8.62 | .9617 | .9475 | .9992 |
| 25-OH-D3 | μg/L | >30 | 34.08 | 10.17 | 42.42 | 14.92 | 36.68 | 14.95 | .2996 | .8786 | .5564 |
| PTH | μg/L | 18.4–80.1 | 46.17 | 20.89 | 93.26 | 61.56 | 45.08 | 19.28 | .0280 | .9977 | .0242 |
| DPD | nmol/mmol | f:3–7/m:2–5 | 6.30 | 2.75 | 8.44 | 4.67 | 6.20 | 2.54 | .3342 | .9974 | .3016 |
| spinal DXA | Z-score | – | 0.02 | 0.99 | −0.82 | 1.52 | −2.78 | 1.34 | .3456 | .0001 | .0076 |
| Femoral DXA | Z-score | – | 0.02 | 0.66 | −1.73 | 0.93 | −2.01 | 1.28 | .0012 | .0002 | .8620 |
| CRT: TPR | s | – | 1.57 | 0.60 | 2.89 | 1.67 | 1.78 | 0.48 | .0369 | .8946 | .0872 |
| CRT: Pmax | W/kg | – | 11.92 | 4.29 | 6.45 | 2.50 | 9.64 | 4.06 | .0200 | .6714 | .1057 |
| GF | kg | – | 35.05 | 9.78 | 27.58 | 16.02 | 34.46 | 9.18 | .4010 | .9939 | .4591 |
| VAS | # | – | 3.40 | 2.76 | 6.11 | 2.03 | 4.00 | 1.58 | .0332 | .8252 | .1251 |
Abbreviations: aBMD, areal bone mineral density; ALP, alkaline phosphatase; BALP, bone-specific alkaline phosphatase; BGLAP, osteocalcin; CRT, chair-rising test; DPD, deoxypyridinoline; fem, femoral; GF, grip force; OPO, osteoporosis; Pmax, maximum power in CRT; TIO, tumor-induced osteomalacia; TPR, time per repetition; VAS, visual analog scale; 25-OH-D3, 25-hydroxyvitamin D3
Laboratory values, DXA Z-scores, chair-rising-test results, and pain scale results are presented. iFGF23 levels and active vitamin D (1,25-dihydroxycholecalciferol) levels were accessed in TIO patients only and are stated in the respective paragraph. Significant P values are printed in bold in the right columns, and values out of the normative range are bold and underscored.
Areal BMD assessed by DXA was significantly reduced at the lumbar spine in the OPO group compared to the TIO group (P = .0076); femoral values did not differ significantly (Table 1). Furthermore, pain assessed by the visual analog scale (VAS) was significantly increased, and muscular power in the CRT was significantly lower in the TIO group compared to the healthy individuals. The level of significance was not reached for the comparison of TIO and OPO (Table 1).
HR-pQCT measurements and FEA
The Tt.BMD and Ct.Th of the distal radius were significantly lower in OPO patients than in TIO patients (P = .015 and P = .049, respectively) (Table 2).
Table 2.
HR-pQCT values of the 3 groups.
| Control | TIO | OPO | Post-hoc: Tukey | Reference | ||||||||
|---|---|---|---|---|---|---|---|---|---|---|---|---|
| Mean | ±SD | Mean | ±SD | Mean | ±SD | Control vs TIO | Control vs OPO | TIO vs OPO | Median | Interquartile range | ||
| n | 10 | 7 | 8 | |||||||||
| Radius: | P value | P value | P value | Hansen et al. 2014 | ||||||||
| Tt.BMD | 312.89 | 48.44 | 332.19 | 93.62 | 233.70 | 31.850 | .937 | .015 | .013 | 333 | 312–372 | |
| Tb.BMD | 149.70 | 26.24 | 156.56 | 57.48 | 116.53 | 29.774 | .930 | .184 | .131 | 181 | 157–202 | |
| Ct.BMD | 894.66 | 88.33 | 852.90 | 85.50 | 810.55 | 86.456 | .600 | .126 | .621 | 885 | 860–900 | |
| metaBMD | 206.45 | 27.78 | 218.21 | 63.58 | 178.10 | 36.347 | .855 | .361 | .190 | – | – | |
| Tb.Ar | 224.09 | 67.37 | 262.01 | 97.89 | 353.24 | 120.783 | .703 | .024 | .178 | 286 | 258–327 | |
| BV/TV | 0.125 | 0.022 | 0.130 | 0.048 | 0.107 | 0.022 | .932 | .183 | .131 | 0.15 | 0.131–0.168 | |
| Tb.Th | 0.068 | 0.012 | 0.069 | 0.025 | 0.053 | 0.013 | .991 | .172 | .183 | 0.074 | 0.066–0.082 | |
| Tb.N | 1.75 | 0.28 | 2.04 | 0.74 | 1.99 | 0.831 | .620 | .705 | .986 | 1.98 | 1.90–2.20 | |
| Tb.Sp | 0.51 | 0.09 | 0.48 | 0.20 | 0.55 | 0.233 | .915 | .887 | .700 | 0.417 | 0.378–0.454 | |
| Ct.Th | 0.77 | 0.14 | 0.88 | 0.20 | 0.57 | 0.15 | .431 | .049 | .004 | 0.99 | 0.92–1.10 | |
| Ct.Pm | 71.11 | 8.96 | 78.74 | 14.48 | 81.46 | 8.93 | .337 | .128 | .877 | – | – | |
| Ct.Ar | 53.73 | 6.72 | 68.09 | 16.86 | 58.50 | 24.63 | .213 | .821 | .520 | 76 | 70–88 | |
| Tibia: | ||||||||||||
| Tt.BMD | 311.05 | 34.70 | 250.09 | 96.35 | 214.58 | 30.92 | .104 | .005 | .472 | 312 | 281–346 | |
| Tb.BMD | 168.00 | 28.60 | 129.83 | 50.53 | 127.85 | 26.52 | .096 | .064 | .994 | 187 | 167–208 | |
| Ct.BMD | 896.70 | 56.80 | 818.70 | 103.96 | 809.69 | 63.12 | .107 | .055 | .970 | 865 | 849–883 | |
| metaBMD | 229.12 | 23.39 | 192.06 | 49.32 | 190.60 | 31.18 | .098 | .070 | .996 | – | – | |
| Tb.Ar | 591.98 | 106.21 | 718.11 | 243.78 | 777.90 | 163.50 | .313 | .079 | .781 | 699 | 622–811 | |
| BV/TV | 0.140 | 0.024 | 0.108 | 0.042 | 0.107 | 0.022 | .097 | .067 | .995 | 0.156 | 0.140–0.174 | |
| Tb.Th | 0.091 | 0.019 | 0.068 | 0.028 | 0.066 | 0.018 | .097 | .057 | .984 | 0.078 | 0.069–0.085 | |
| Tb.N | 1.58 | 0.38 | 1.86 | 0.95 | 1.75 | 0.77 | .708 | .869 | .952 | 2.04 | 1.92–2.25 | |
| Tb.Sp | 0.573 | 0.135 | 0.687 | 0.614 | 0.564 | 0.145 | .781 | .998 | .770 | 0.413 | 0.373–0.445 | |
| Ct.Th | 1.26 | 0.20 | 1.03 | 0.37 | 0.82 | 0.15 | .190 | .004 | .258 | 1.36 | 1.18–1.50 | |
| Ct.Pm | 105.07 | 9.69 | 114.76 | 16.76 | 116.60 | 12.37 | .294 | .162 | .958 | – | – | |
| Ct.Ar | 132.14 | 21.79 | 114.71 | 34.55 | 98.55 | 22.47 | .381 | .033 | .467 | 157 | 144–172 | |
Abbreviations: BV/TV, bone volume to tissue volume; Ct.Ar, cortical area; Ct.BMD, cortical volumetric bone mineral density; Ct.Pm, cortical perimeter; Ct.Th, cortical thickness; TIO, tumor induced osteomalacia; metaBMD, meta trabecular vBMD; OPO, osteoporosis; Tb.Ar, trabecular area; Tb.BMD, trabecular volumentric bone mineral density; Tb.N, trabecular number; Tb.Sp, trabecular separation; Tb.Th, trabecular thickness; Tt.BMD, Total volumentric bone mineral density
Two TIO and OPO cases were removed due to motion artifacts.
Three-dimensional bone mineral density and bone structure parameters are presented for distal radius and tibia. Values of the TIO group were close to Control at the radius but close to OPO at the tibia. Respective P values for multiple group comparison are presented at the right side with significant differences indicated with bold P values, bold mean values indicate out of interquartile range.
For structural parameters of the distal tibiae assessed by HR-pQCT, no significant differences were found between the TIO and OPO groups (Table 2). Overall, the values of the TIO group were close to those of the control group at the radius but closer to those of the OPO group at the tibia. FEA results of the HR-pQCT scans are presented in Supplementary Table S2.
Additional ratios of HR-pQCT mineralization parameters were calculated to express the obvious side-specific differences between the 2 locations—radius and tibia, which indicated the following: (1) significantly higher values at the distal radius in the TIO group than in the OPO group as well as (2) no differences (ie, equally reduced values) in the TIO and OPO groups at the distal (Supplementary Table S1). Tt.BMDRadius/metaBMDTibia and Tt.BMDRadius/Tb.BMDTibia did show significant differences between the TIO and OPO group but not between the control and OPO groups, indicating TIO-specific ratios.
Histology
The bone volume to tissue volume value was significantly reduced in the OPO group compared to the TIO group (P = .0001, Figure 1D) with a significant reduction in Tb.Th (P = .0003, Figure 1E). O.Th and OS/BS were significantly increased in the TIO group compared to the OPO group (P < .0001 for all significant comparisons indicated in Figure 1F and G). The OV to TV value was also significantly elevated in the TIO group (TIO vs OPO P < .0001, Figure 1F). Regarding the OV/BV, the mean for the TIO group was significantly increased in comparison to those for the OPO group (P < .0001), with a 22.95-fold higher OV/BV compared to the OPO group.
Figure 1.
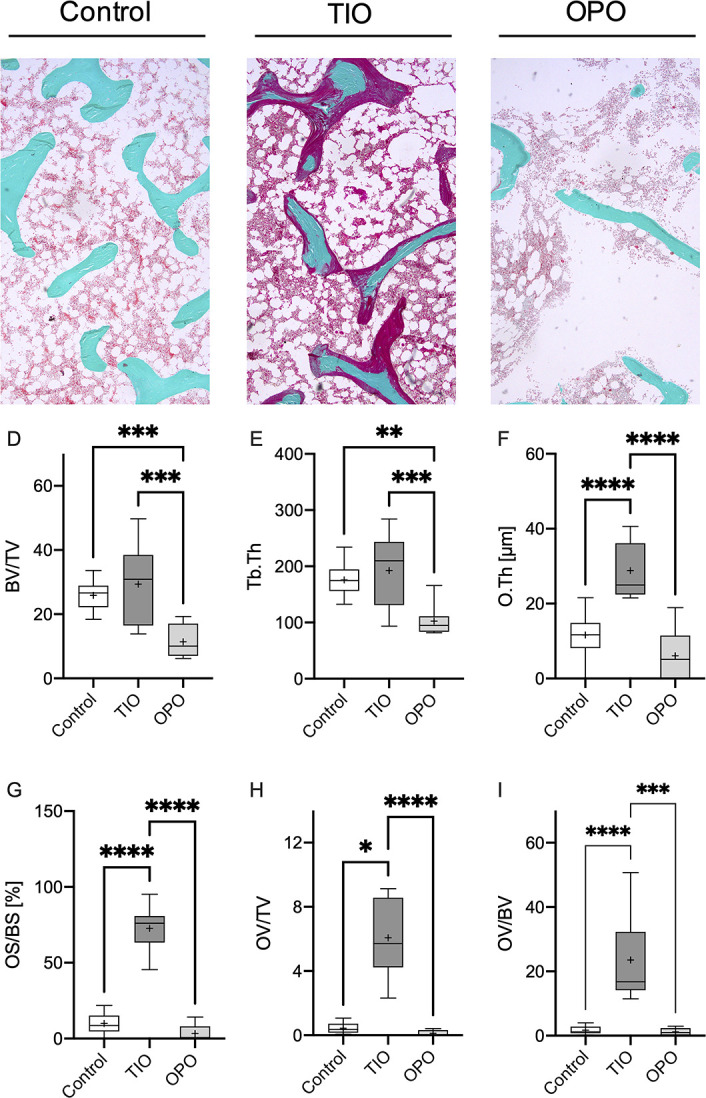
Histological evaluation of iliac crest bone biopsies. The first row depicts representative histological sections in Masson-Goldner-trichrome staining for the control, tumor-induced osteomalacia (TIO), and osteoporosis (OPO) groups (A–C). An increased osteoid content (surface of the trabeculae, stained in red) is obvious in the TIO section compared to both the control and OPO sections. A reduction in BV/TV due to reduced Tb.Th was present in the OPO group compared to the TIO and OPO groups. Structural parameters are listed below (D–I) with decreased BV/TV and Tb.Th in the OPO group (D, E) and increased O.Th, OS/BS, OV/TV, and OV/BV in comparison to the control and OPO groups. *P < .05, **P < .005, ***P < .0005, ****P < .0001.
Quantitative backscattered electron imaging
No differences were observed for mean calcium content (Camean, Figure 2D) and CaPeak (Figure 2E) between TIO and OPO. Interestingly, a significantly higher BMDD was found in the TIO group in comparison to the OPO group by means of CaSD (TIO: 3.117 ± 0.4100 wt% vs OPO: 2.713 ± 0.1586 wt%, P < .01 Figure 2F). This finding points toward increased heterogeneity of bone tissue mineralization in TIO patients. Furthermore, significantly larger areas of low mineral density containing bone in TIO biopsies were reflected by an increased Calow compared to the control group (P < .005, Figure 2G).
Figure 2.

Quantitative backscattered electron imaging. The first row depicts representative qBEI images for the control, tumor-induced osteomalacia (TIO), and osteoporosis (OPO) groups (first row). A lower mineral content in OPO is represented by significantly lower Camean (D) and CaPeak (E) values. A wider BMDD distribution is present in TIO, as indicated by a significant increase in CaSD (F) in TIO samples in comparison to control and OPO samples. Additionally, areas with low mineral content are significantly increased in the TIO group compared to the control group, as represented by an increased Calow (G) but no change in Cahigh (H). BMDD is indicated in the histogram (I), where a broader distribution is present in the case of TIO (black line) compared to control cases (dashed line) *P < .05, **P < .005, ****P < .0001. Camean, calcium mean; CaPeak, calcium peak; CaSD, calcium distribution standard deviation; Calow, calcium low; Cahigh, calcium high.
Micro-CT imaging
TIO mean values presented as an intermediate status between the control and OPO groups in the case of BV/TV (control: 0.257 ± 0.095, TIO: 0.21 ± 0.13, OPO: 0.123 ± 0.072), bone density (control: 859.9 ± 32.7, TIO: 877.3 ± 41.6, OPO: 898.9 ± 40.1), and Tb.Th (control: 0.192 ± 0.049, TIO: 0.166 ± 0.063, OPO: 0.151 ± 0.064). The structure model index (SMI) was significantly lower in the TIO group compared to the OPO (TIO: 0.22 ± 2.22, OPO: 2.10 ± 0.40) (Figure 3C).
Figure 3.

μCT analysis and Raman spectroscopy results. μCT analysis indicated structural changes only detectable in the osteoporosis (OPO) samples by means of a significantly decreased BV/TV (A) and an increased SMI (C) but no significant differences between the control and tumor-induced osteomalacia (TIO) groups (A-F). Raman spectroscopy revealed an increased MMR for the OPO group but no significant differences between the TIO and control groups (G). However, a significantly increased CPR of the TIO group indicated a change in the mineral composition toward a lower phosphate content in the case of phosphate wasting diseases in the TIO group compared to the control and OPO groups (H). Increased CPR in the OPO group can be explained by aged bone material in the sense of increased carbonate content. *P < .05, **P < .005, ***P < .001.
Raman spectroscopy
The MMR of Raman spectroscopy did show an increased MMR of the OPO group compared to both the control and TIO groups (P < .005 for both) indicating lower collagen content or higher mineral content in the OPO group (Figure 3G). The mean CPR of TIO biopsies was significantly elevated compared to the control biopsies (P < .001), while the OPO biopsies also exhibited an increased CPR compared to the control biopsies (Figure 3H). This indicates a decreased phosphate content of the mineral phase in the case of phosphate-wasting TIO bone biopsies and an increased carbonate content in OPO biopsies. No significant differences were detected between the TIO and OPO biopsies.
ROC analysis
ROC analysis compared different parameters regarding their ability to distinguish between the combined control and OPO group and the TIO group. The area under the ROC curve (AUC) was 0.9556 at a P value = .0001 for BALP (Supplementary Figure S1). A sensitivity of 88.89% was reached at 95.0% specificity for BALP levels >22.0 μg/L. AUCAPL was equal to 0.9444 at P = .0002 (sensitivity = 88.89 at 85% specificity for P > 103.0). Phosphate was tested with an AUCPhosphate = 0.9167, P = .0004, indicating good sensitivity and specificity levels (sensitivity = 88.89%, specificity = 85.00% for phosphate levels <0.7050 mmol/L). The Z-scores of both the spine and femur did not reach significance in the ROC analysis. The ratio of the 2 lowest DXA Z-scores of the lumbar spine and proximal femur (aBMDspine/aBMDfemur) reached significance (P = .0067, AUCDXA = 0.8194, sensitivity = 77.78%, specificity = 85.00%, for a ratio < 0.9773). Tt.BMDRadius/ metaBMDTibia had the largest HR-pQCT AUC with AUCHR-pQCT = 0.8413 (P = .0093, sensitivity = 71.43%, specificity = 66.67% for values >1.458). Other HR-pQCT ratios did not reach this level in the ROC analysis. The qBEI results were significant in the ROC analysis (P = .0011) at an AUCCaSD = 0.8889 (for CaSD > 2.759 wt%, sensitivity = 88.89%, specificity = 73.68%). OV/BV did show an AUCOV/BV = 1, P < .0001, with a calculated 100% sensitivity and 100% specificity at values of OV/BV > 7.707%.
Correlations of OV/BV to clinical parameters
None of the HR-pQCT parameters exhibited a correlation with OV/BV greater than r = 0.6. When correlating TIO and OPO biopsy OV/BV to the ratios of specific HR-pQCT parameters (Supplementary Figure S2), significant correlations in Pearson’s test were found for Tt.BMDRadius/metaBMDTibia, Tt.BMDRadius/Tb.BMDTibia, Tb.BMDRadius/Tt.BMDTibia, and Tt.BMDRadius/Tt.BMDTibia. Equations are indicated in Supplementary Figure S2.
Correlating bone-specific ALP to OV/BV revealed a positive correlation with r2 = 0.5940 (P < .0001). Correlating the ALP revealed a positive correlation with an r2 = 0.6374 (P < .0001 (Supplementary Figure S2)). Other laboratory parameters reaching P < .05 were DPD (r2 = 0.3982, P = .0038) and Ca:P (r2 = 0.3234, P = .0111), which exhibited positive correlations. Correlating posture parameters such as path length of the Romberg test, r2 equaled 0.4516, P = .0044, with a positive correlation. Time per repetition in the chair-rising test was positively correlated with OV/BV (r2 = 0.3758, P = .0116, TPR = 0.04879x[OV/BV] + 1.691). Pain levels according to the VAS were positively correlated with OV/BV (P = .0331, r2 = 0.2536).
The multiple linear regression of a combination of laboratory and imaging parameters as well as muscle performance and posture analysis revealed only ALP and Tt.BMDRadius to be significant in the forward linear regression model to represent OV/BV. This model was significant at P < .00001, r = 0.939, and r2 = 0.882. Model coefficient P values were at Pintercept = .00020, PALP = .0000061, and PTt.BMD_Radius = .00043. After rounding, the intercept was −31, the ALP coefficient was 0.13, and the ALP coefficient equaled 0.09. The derived model equation is as follows:
 |
Excluding HR-pQCT parameters led to the inclusion of the Z-scoreL1–L4 as the best DXA parameter and revealed an r2 = 0.762 (OV/BV = 1 + 0.14 · ALP + 3.34 · Z-score spinal). Calculating the modeled OV/BV based on the equation above for all groups (TIO, OPO, control), the post hoc analysis did indicate significantly higher values of the OV/BVmodel in the TIO group (24.46% ± 14.22%) vs the control (5.952% ± 3.44%) and OPO groups (0.904% ± 4.328%), with no differences between the control and OPO groups.
Calculating the ROC for linear regression model (Figure 4A) demonstrated a significant (P < .0001) ability to separate the TIO patients from others using the model of APL and HR-pQCT (AUC = 1). Sensitivity and specificity reached 100% at values >11.28% OV/BVmodel.
Figure 4.

Linear regression model of clinical parameters for OV/BV. The dotted (blue) model relies on the use of Tt.BMDRadius and ALP with an r2 = 0.882, while the squared (yellow) model relies on the use of a Z-scoreL1-L4 and ALP with an r2 = 0.762 to predict OV/BV. (A) All laboratory, DXA, and HR-pQCT parameters were considered for the model if not colinear. (B) Significant differences were found using the OV/BVmodel to predict the OV/BV based on ALP and Tt.BMDRadius comparing the TIO group to the OPO group, which was part of the model generation, and to the control group, which was part of the model generation. (C) ROC analysis shows a very high ability of the model to discriminate between the TIO and control or OPO groups, comparable to the histological evaluation. OV/BVmodel values above 11.28 separate all TIO patients from control subjects or OPO patients. **P < .005, ****P < .0001, ns = not significant.
In summary
Advanced, clinical characterization of the patients
Collectively, patients with TIO exhibited elevated levels of ALP and PTH, along with decreased phosphate levels compared to those with OPO, and reported higher levels of pain. HR-pQCT measurements in TIO patients demonstrated near-normal values at the distal radius but reduced structural parameters at the distal tibia comparable to OPO.
In-depth tissue analysis
Histological confirmation of osteomalacia in TIO revealed a notable 23-fold increase in osteoid volume to bone volume (OV/BV) ratio compared to the OPO group. Although alterations in micro-computed tomography (μCT) were not observed between TIO and OPO samples, qBEI indicated higher mineralization heterogeneity in TIO compared to OPO. Raman spectroscopy analysis suggested decreased phosphate incorporation into the TIO bone’s mineral in case of TIO. Furthermore, the AUC for bone-specific ALP (BALP) was calculated at 0.9556 with a P-value of .0001, illustrating its sensitivity and specificity in distinguishing TIO from OPO. The development of a predictive model for histologically measured OV/BV revealed a combination of ALP and total bone mineral density in the radius (Tt.BMDRadius) as the most accurate predictors, represented by the equation OV/BV = 31 + 0.13 ⋅ ALP + 0.09 ⋅ Tt.BMDRadius. Sensitivity and specificity reached 100% at values >11.28% OV/BVmodel for distinguishing between clinical control cases and OPO from TIO patients. Additionally, a model for OV/BV, composed of DXA results and ALP, was derived from multiple linear regression.
Discussion
In this study, we conducted a comprehensive analysis of clinical data and high-resolution clinical imaging data from 9 TIO patients, including in-depth tissue characterization of bone biopsies obtained from the same individuals. Our study is the first to demonstrate patient-matched characterization through histological and scanning electron microscopic examination, along with clinical in vivo imaging using HR-pQCT and DXA. We observed distinct patterns for TIO, indicating a shift in bone tissue composition due to phosphate loss. Most importantly, we were able to virtually predict the histologically measured OV/BV using a specific combination of Tt.vBMDRadius assessed by HR-pQCT and the blood serum levels of ALP with very high levels of sensitivity and specificity in ROC analysis.
Our laboratory evaluation6,9,10 aligns with previously described TIO patterns13,29 and confirms increased pain levels in TIO patients compared to healthy controls (Table 1).
However, TIO remains significantly underdiagnosed7,10 when relying solely on standard clinical imaging, namely, DXA. Our results do indicate significantly higher spinal Z-scores of the TIO group compared to OPO; however, such differences are not specific for TIO. Therefore, our results pinpoint the particular challenge of diagnosing or suspecting TIO by DXA, which is most effectively done by laboratory sampling of phosphate.
This radiographic plight becomes intelligible when realizing that bone involvement in TIO is best described by osteomalacia, which is difficult to visualize radiologically due to the missing mineralization. However, HR-pQCT in our cohorts did show differences between TIO and OPO (Table 2). Previous studies have already reported significant differences in HR-pQCT findings between TIO and controls.30,31 Furthermore, a consistent pattern emerged in both our study and others,30,31 highlighting the predominance of bone alterations in the tibia compared to the radius. Notably, Zanchetta et al. also showed a more pronounced structural deterioration at the tibia by an almost 2-fold more profound manifestation of structural differences at the tibia30 than at the radius; a pattern also described by Ni et al. in 113 TIO patients.32 Our results align with this pattern; however, the effect is less prominent, which may be attributed to the small group size with relevant interindividual differences, as well as a control group with mean values at the lower end of the HR-pQCT reference values of Hansen et al.,33 diminishing the differences between groups. Additionally, disease duration and severity are 2 important factors that may influence the microarchitectural deterioration and may be different in our cohort than others highlighting the need of a noninvasive method to access the OV/BV.
Taken together, HR-pQCT parameters (cf. Table 2, Supplementary Table S1) and FEA results derived from HR-pQCT scans (Supplementary Table S2) have a consistent pattern of a more pronounced tibial manifestation with inferior mineralization and mechanical capacity. These findings are consistent with existing literature,13,30,31 indicating a more pronounced manifestation of the TIO at the mechanically stressed tibia than at the radius.30 This may be attributed to a higher turnover at the tibia, resulting from increased loading that induces elevated tibial remodeling rates.34 This, in turn, might lead to a more distinct manifestation at the tibia, characterized by a mineralization deficit of the osteoid caused by TIO.
The particular challenge of detecting a TIO-specific and reliable clinical imaging parameter draws attention to the more invasive bone biopsy method for histological assessment and diagnosis. The insufficient osteoid mineralization is clearly represented by significantly increased OV/BV and O.Th compared to the OPO group in our histological analysis. Furthermore, histological analysis confirmed an unchanged BV/TV and Tb.Th in the TIO group compared to the control group, consistent with matching HR-pQCT results. However, when focusing on the mineralized bone volumes in μCT analysis (Figure 3), a tendency toward thinned trabeculae and lower BV/TV becomes evident, contrasting histology (Figure 1), which, in turn, takes the osteoid into account.
Given the disturbed mineralization process caused by FGF23 overexpression, it is expected that the BMDD would undergo notable changes when comparing the TIO group with the OPO or control group. Significantly increased heterogeneity of the BMDD (indicated by increased CaSD) was observed in the TIO group compared to the OPO group, characteristic for impaired mineralization. Consistent with these findings, the qBEI analysis revealed larger areas of low mineral content (Calow) in TIO, supporting previous observations in TIO35 and other phosphate wasting disorders such as X-linked hypophosphatemia.36 However, mean mineralization was not changed significantly between TIO and OPO, yet TIO samples exhibited an intermediate state of mineralization when considering control and OPO, pinpointing the HR-pQCT results with only light differences in mineralization. When analyzing Calow in OPO patients, elevated values became evident in comparison to control subjects. This finding may be unexpected; however, it aligns well with former findings in high-turnover OPO patients37 as well as specific early-onset OPO patients.38,39 Taken together, all mineral reliant methods, clinical imaging and the highest resolution techniques, are limited in quantifying TIO in patients specifically when compared to OPO patients.
Remarkably, Raman spectroscopy revealed an elevated CPR in TIO patients, indicating a shift in the composition of bone mineral toward relative increased carbonate (decreased phosphate) content. This finding aligns with renal phosphate loss40 favoring carbonate incorporation into the bone matrix. A slight increase in the CPR in the OPO group compared to the control group can be attributed to the presence of aged bone material characterized by a higher carbonate content.41 This effect may also be relevant in TIO patients, where bone tissue subsequently ages due to the osteoid sealing.27
Given the clear difficulty of visualizing the mineralization deficit clinically, we aimed to predict the osteoid content per bone volume by a noninvasive method. However, the correlation between individual DXA/ HR-pQCT parameters only and OV/BV was weak with limited significance, but significant correlations were observed between laboratory parameters (best with ALP) and the histological assessment of OV/BV (Supplementary Figure S2). These findings align with other results, which indicate a stronger disease manifestation in patients with elevated ALP levels.30 Interestingly, no significant correlation was observed for FGF23, suggesting that FGF23 levels do not reflect the disease severity in particular. But, quantified OV/BV correlates with both muscular performance and postural stability, indicating an interaction between bone histological manifestations and clinical presentations. Pain levels also show a positive correlation with OV/BV.
Strikingly, our analysis using multiple linear regression with ALP and Tt.BMDRadius revealed a high-quality model capable of predicting the in vivo OV/BV in our dataset. This approach combines gold standard laboratory assessments with HR-pQCT, promoting the development of new strategies for estimating osteoid amounts in vivo. By utilizing this combined methodology, clinicians may have an additional scope to estimate OV noninvasively, providing insights into bone health and facilitating clinical decision-making.
The ROC analyses (Supplementary Figure S1) indicate that using laboratory parameters for diagnosing TIO is superior to clinical imaging, and only histology has a 100% assignment of the patients by means of OV/BV. Comparable, the OV/BVmodel is capable of assigning patients like histology. Briefly, the model filters patients with high ALP levels and high Tt.vBMD at the radius, making them suspicious of TIO and facilitating noninvasive OV/BV quantification to estimate OV as a measure of the extent of the osteomalacia.
This study has several limitations that should be considered. First, clinical imaging was performed at the lumbar spine, proximal femur, distal radius, and distal tibia, while biopsy samples were obtained from the iliac crest as usual in routine clinical practice. Consequently, importantly, the pelvic bone may undergo distinct remodeling processes compared to the radius or tibia. Second, although the control patients and histology samples were age-matched, they were not obtained from the same individuals, as there is no justifiable indication for taking bone biopsies from healthy individuals. Furthermore, the study was conducted with a restricted number of specimens due to the rarity of the disease, emphasizing the need for future validation on a larger sample cohort. Additionally, individual differences among patients, such as variations in disease severity, general, medical treatment history, and coexisting conditions, may introduce additional sources of variability in the study findings. On the other hand, our study was not designed to test if the proposed modeled OV/BV enables a differentiation between TIO and other malacic conditions. Yet, by pathological mechanism, it can be concluded that this method obviously does not apply to patients suffering from HPP due to low ALP. Therefore, future studies have to clarify if the modeled OV/BV can be attributed to other malacic conditions.
In conclusion, TIO poses challenges in radiological visualization and differentiation from OPO. DXA and HR-pQCT are unable to specifically detect TIO or mineralization defects, respectively, but characteristic microstructural patterns can be found that differ from OPO and control groups. In a clinical setting, biochemical analyses, including basic parameters, such as serum phosphate and ALP, are crucial for diagnosing TIO. Combining ALP with the HR-pQCT parameter Tt.BMDRadius does exhibit an ability to discriminate between TIO patients and others, comparable to the gold standard for diagnosing osteomalacia, namely, the histological examination of a bone biopsy. Specifically, TIO should be suspected in patients with high ALP levels and an increased OV/BVmodel as described, using Tt.BMDRadius and APL levels.
Supplementary Material
Acknowledgments
The authors thank Andrea Thieke for the great support in creating the histological sections and stains.
Contributor Information
Felix N Schmidt, Department of Osteology and Biomechanics, University Medical Center Hamburg-Eppendorf, 22529 Hamburg, Germany.
Julian Delsmann, Department of Osteology and Biomechanics, University Medical Center Hamburg-Eppendorf, 22529 Hamburg, Germany; Department of Trauma and Orthopaedic Surgery, University Medical Center Hamburg-Eppendorf, 20246 Hamburg, Germany.
Bashar Yazigi, Department of Osteology and Biomechanics, University Medical Center Hamburg-Eppendorf, 22529 Hamburg, Germany.
Frank Timo Beil, Department of Trauma and Orthopaedic Surgery, University Medical Center Hamburg-Eppendorf, 20246 Hamburg, Germany.
Michael Amling, Department of Osteology and Biomechanics, University Medical Center Hamburg-Eppendorf, 22529 Hamburg, Germany.
Ralf Oheim, Department of Osteology and Biomechanics, University Medical Center Hamburg-Eppendorf, 22529 Hamburg, Germany.
Author contributions
Ralf Oheim, Michael Amling (Conceptualization), Felix N. Schmidt, Julian Delsmann, Bashar Yazigi (Data curation), Felix N. Schmidt, Julian Delsmann, Bashar Yazigi, Ralf Oheim (Formal Analysis), Felix N. Schmidt, Bashar Yazigi, Julian Delsman (Investigation), Felix N. Schmidt, Bashar Yazigi (Methodology), Ralf Oheim (Project administration), Michael Amling (Resources), Michael Amling, Ralf Oheim (Supervision), Ralf Oheim (Validation), Felix N. Schmidt (Visualization), Felix N. Schmidt (Writing – original draft), Felix N. Schmidt, Julian Delsmann, Bashar Yazigi, Frank T. Beil, Michael Amling, Ralf Oheim (Writing – review & editing the manuscript)
Funding
Parts of the study were funded by an institutional research grant from Kyowa Kirin Int. (BLIX-Study). FNS was supported by the German Research Foundation (DFG) under Grant No. 499533307.
Conflicts of interest
R.O. has served as a speaker and advisory board member for Kyowa Kirin, Inozyme, Ipsen, Pharmacosmos and UCB and has received an institutional research grant from Kyowa Kirin and UCB. F.N.S., J.D., B.Y., F.T.B., and M.A. state that they have no conflicts of interest.
Data availability
The data underlying this article will be shared on reasonable request to the corresponding author.
References
- 1.Kritmetapak K, Kumar R. Phosphatonins: from discovery to therapeutics. Endocr Pract. 2023;29(1):69–79. 10.1016/j.eprac.2022.09.007. [DOI] [PubMed] [Google Scholar]
- 2.Minisola S, Peacock M, Fukumoto S, et al. Tumour-induced osteomalacia. Nat Rev Dis Primers. 2017;3(1):1–15. 10.1038/nrdp.2017.44. [DOI] [PubMed] [Google Scholar]
- 3.Cianferotti L, Delli Poggi C, Bertoldo F, et al. Persistence and recurrence in tumor-induced osteomalacia: a systematic review of the literature and results from a national survey/case series. Endocrine. 2022;76(3):709–721. 10.1007/s12020-022-03039-2. [DOI] [PMC free article] [PubMed] [Google Scholar]
- 4.Bosman A, Palermo A, Vanderhulst J, et al. Tumor-induced osteomalacia: a systematic clinical review of 895 cases. Calcif Tissue Int. 2022;111(4):367–379. 10.1007/s00223-022-01005-8. [DOI] [PMC free article] [PubMed] [Google Scholar]
- 5.Minisola S, Barlassina A, Vincent S-A, Wood S, Williams A. A literature review to understand the burden of disease in people living with tumour-induced osteomalacia. Osteoporos Int. 2022;33(9):1845–1857. 10.1007/s00198-022-06432-9. [DOI] [PMC free article] [PubMed] [Google Scholar]
- 6.Jan de Beur SM, Minisola S, Xia W-B, et al. Global guidance for the recognition, diagnosis, and management of tumor-induced osteomalacia. J Intern Med. 2023;293(3):309–328. 10.1111/joim.13593. [DOI] [PMC free article] [PubMed] [Google Scholar]
- 7.Hidaka N, Koga M, Kimura S, et al. Clinical challenges in diagnosis, tumor localization and treatment of tumor-induced osteomalacia: outcome of a retrospective surveillance. J Bone Miner Res. 2022;37(8):1479–1488. 10.1002/jbmr.4620. [DOI] [PubMed] [Google Scholar]
- 8.Breer S, Brunkhorst T, Beil FT, et al. 68Ga DOTA-TATE PET/CT allows tumor localization in patients with tumor-induced osteomalacia but negative 111In-octreotide SPECT/CT. Bone. 2014;64:222–227. 10.1016/j.bone.2014.04.016. [DOI] [PubMed] [Google Scholar]
- 9.Brandi ML, Clunie GPR, Houillier P, et al. Challenges in the management of tumor-induced osteomalacia (TIO). Bone. 2021;152:116064. 10.1016/j.bone.2021.116064. [DOI] [PubMed] [Google Scholar]
- 10.Florenzano P, Hartley IR, Jimenez M, Roszko K, Gafni RI, Collins MT. Tumor-induced osteomalacia. Calcif Tissue Int. 2021;108(1):128–142. 10.1007/s00223-020-00691-6. [DOI] [PubMed] [Google Scholar]
- 11.Bhan A, Qiu S, Rao SD. Bone histomorphometry in the evaluation of osteomalacia. Bone Rep. 2018;8:125–134. 10.1016/j.bonr.2018.03.005. [DOI] [PMC free article] [PubMed] [Google Scholar]
- 12.Priemel M, von Domarus C, Klatte TO, et al. Bone mineralization defects and vitamin D deficiency: histomorphometric analysis of iliac crest bone biopsies and circulating 25-hydroxyvitamin D in 675 patients. J Bone Miner Res. 2010;25(2):305–312. 10.1359/jbmr.090728. [DOI] [PubMed] [Google Scholar]
- 13.Ni X, Guan W, Jiang Y, et al. High prevalence of vertebral deformity in tumor-induced osteomalacia associated with impaired bone microstructure. J Endocrinol Investig. 2023;46(3):487–500. 10.1007/s40618-022-01918-z. [DOI] [PubMed] [Google Scholar]
- 14.Stürznickel J, Rolvien T, Delsmann A, et al. Clinical phenotype and relevance of LRP5 and LRP6 variants in patients with early-onset osteoporosis (EOOP). J Bone Miner Res. 2021;36(2):271–282. 10.1002/jbmr.4197. [DOI] [PubMed] [Google Scholar]
- 15.Parfitt AM, Rao DS, Stanciu J, Villanueva AR, Kleerekoper M, Frame B. Irreversible bone loss in osteomalacia. Comparison of radial photon absorptiometry with iliac bone histomorphometry during treatment. J Clin Invest. 1985;76(6):2403–2412. 10.1172/JCI112253. [DOI] [PMC free article] [PubMed] [Google Scholar]
- 16.Goswami R. Primer on the metabolic bone diseases and disorders of mineral metabolism. Indian J Med Res. 2016;144(3):489. [Google Scholar]
- 17.Greenspan SL, Maitland-Ramsey L, Myers E. Classification of osteoporosis in the elderly is dependent on site-specific analysis. Calcif Tissue Int. 1996;58(6):409–414. 10.1007/BF02509439. [DOI] [PubMed] [Google Scholar]
- 18.Whittier DE, Boyd SK, Burghardt AJ, et al. Guidelines for the assessment of bone density and microarchitecture in vivo using high-resolution peripheral quantitative computed tomography. Osteoporos Int. 2020;31(9):1607–1627. 10.1007/s00198-020-05438-5. [DOI] [PMC free article] [PubMed] [Google Scholar]
- 19.Bartosik M, Simon A, Strahl A, Oheim R, Amling M, Schmidt FN. Comparison of motion grading in 1,000 patients by first- and second-generation HR-pQCT: a propensity score matched cohort study. Calcif Tissue Int. 2023;113(6):597–608. 10.1007/s00223-023-01143-7. [DOI] [PMC free article] [PubMed] [Google Scholar]
- 20.Hahn M, Vogel M, Delling G. Undecalcified preparation of bone tissue: report of technical experience and development of new methods. Vichows Archiv A Pathol Anat. 1991;418(1):1–7. 10.1007/BF01600238. [DOI] [PubMed] [Google Scholar]
- 21.Dempster DW, Compston JE, Drezner MK, et al. Standardized nomenclature, symbols, and units for bone Histomorphometry: a 2012 update of the report of the ASBMR Histomorphometry Nomenclature Committee. J Bone Miner Res. 2013;28(1):2–17. 10.1002/jbmr.1805. [DOI] [PMC free article] [PubMed] [Google Scholar]
- 22.Roschger P, Plenk H, Klaushofer K, Eschberger J. A new scanning electron microscopy approach to the quantification of bone mineral distribution: backscattered electron image grey-levels correlated to calcium K alpha-line intensities. Scanning Microsc. 1995;9(1):75–86 discussion 86-88. [PubMed] [Google Scholar]
- 23.Roschger P, Fratzl P, Eschberger J, Klaushofer K. Validation of quantitative backscattered electron imaging for the measurement of mineral density distribution in human bone biopsies. Bone. 1998;23(4):319–326. 10.1016/S8756-3282(98)00112-4. [DOI] [PubMed] [Google Scholar]
- 24.Roschger P, Paschalis EP, Fratzl P, Klaushofer K. Bone mineralization density distribution in health and disease. Bone. 2008;42(3):456–466. 10.1016/j.bone.2007.10.021. [DOI] [PubMed] [Google Scholar]
- 25.Busse B, Hahn M, Soltau M, et al. Increased calcium content and inhomogeneity of mineralization render bone toughness in osteoporosis: mineralization, morphology and biomechanics of human single trabeculae. Bone. 2009;45(6):1034–1043. 10.1016/j.bone.2009.08.002. [DOI] [PubMed] [Google Scholar]
- 26.Busse B, Jobke B, Hahn M, et al. Effects of strontium ranelate administration on bisphosphonate-altered hydroxyapatite: matrix incorporation of strontium is accompanied by changes in mineralization and microstructure. Acta Biomater. 2010;6(12):4513–4521. 10.1016/j.actbio.2010.07.019. [DOI] [PubMed] [Google Scholar]
- 27.Busse B, Bale HA, Zimmermann EA, et al. Vitamin D deficiency induces early signs of aging in human bone, increasing the risk of fracture. Sci Transl Med. 2013;5(193):193ra88. 10.1126/scitranslmed.3006286. [DOI] [PubMed] [Google Scholar]
- 28.Stockhausen KE, Qwamizadeh M, Wölfel EM, et al. Collagen fiber orientation is coupled with specific Nano-compositional patterns in dark and bright osteons modulating their biomechanical properties. ACS Nano. 2021;15(1):455–467. 10.1021/acsnano.0c04786. [DOI] [PubMed] [Google Scholar]
- 29.Chong WH, Molinolo AA, Chen CC, Collins MT. Tumor-induced osteomalacia. Endocr Relat Cancer. 2011;18(3):R53–R77. [DOI] [PMC free article] [PubMed] [Google Scholar]
- 30.Zanchetta MB, Jerkovich F, Nuñez S, et al. Impaired bone microarchitecture and strength in patients with tumor-induced osteomalacia. J Bone Miner Res. 2021;36(8):1502–1509. 10.1002/jbmr.4325. [DOI] [PubMed] [Google Scholar]
- 31.Mendes DAB, Coelho MCA, Gehrke B, et al. Microarchitectural parameters and bone mineral density in patients with tumour-induced osteomalacia by HR-pQCT and DXA. Clin Endocrinol. 2021;95(4):587–594. 10.1111/cen.14533. [DOI] [PubMed] [Google Scholar]
- 32.Ni X, Feng Y, Guan W, et al. Bone impairment in a large cohort of Chinese patients with tumor-induced Osteomalacia assessed by HR-pQCT and TBS. J Bone Miner Res. 2022;37(3):454–464. 10.1002/jbmr.4476. [DOI] [PubMed] [Google Scholar]
- 33.Hansen S, Shanbhogue V, Folkestad L, Nielsen MMF, Brixen K. Bone microarchitecture and estimated strength in 499 adult Danish women and men: a cross-sectional, population-based high-resolution peripheral quantitative computed tomographic study on peak bone structure. Calcif Tissue Int. 2014;94(3):269–281. 10.1007/s00223-013-9808-5. [DOI] [PubMed] [Google Scholar]
- 34.Seref-Ferlengez Z, Kennedy OD, Schaffler MB. Bone microdamage, remodeling and bone fragility: how much damage is too much damage? Bonekey Rep. 2015;4(4):644. 10.1038/bonekey.2015.11. [DOI] [PMC free article] [PubMed] [Google Scholar]
- 35.Nawrot-Wawrzyniak K, Varga F, Nader A, et al. Effects of tumor-induced osteomalacia on the bone mineralization process. Calcif Tissue Int. 2009;84(4):313–323. 10.1007/s00223-009-9216-z. [DOI] [PubMed] [Google Scholar]
- 36.Fratzl-Zelman N, Hartmann MA, Gamsjaeger S, et al. Bone matrix mineralization and response to Burosumab in adult patients with X-linked hypophosphatemia: results from the phase 3, single-arm international trial. J Bone Miner Res. 2022;37(9):1665–1678. 10.1002/jbmr.4641. [DOI] [PubMed] [Google Scholar]
- 37.Misof BM, Blouin S, Lueger S, et al. Baseline mineralizing surface determines the magnitude of the bisphosphonate effect on cortical bone mineralization in postmenopausal osteoporotic patients. J Musculoskelet Neuronal Interact. 2017;17(3):183–191. [PMC free article] [PubMed] [Google Scholar]
- 38.Kämpe AJ, Costantini A, Levy-shraga Y, et al. PLS3 deletions lead to severe spinal osteoporosis and disturbed bone matrix mineralization. J Bone Miner Res. 2017;32(12):2394–2404. 10.1002/jbmr.3233. [DOI] [PubMed] [Google Scholar]
- 39.Mäkitie RE, Blouin S, Välimäki V-V, et al. Abnormal bone tissue organization and osteocyte lacunocanalicular network in early-onset osteoporosis due to SGMS2 mutations. JBMR Plus. 2021;5(11):e10537. 10.1002/jbm4.10537. [DOI] [PMC free article] [PubMed] [Google Scholar]
- 40.Rendina D, Abate V, Cacace G, et al. Tumor-induced osteomalacia: a systematic review and individual patient’s data analysis. J Clin Endocrinol Metab. 2022;107(8):e3428–e3436. 10.1210/clinem/dgac253. [DOI] [PubMed] [Google Scholar]
- 41.Schmidt FN, Delsmann MM, Mletzko K, et al. Ultra-high matrix mineralization of sperm whale auditory ossicles facilitates high sound pressure and high-frequency underwater hearing. Proc Biol Sci. 2018;285(1893):20181820. 10.1098/rspb.2018.1820. [DOI] [PMC free article] [PubMed] [Google Scholar]
Associated Data
This section collects any data citations, data availability statements, or supplementary materials included in this article.
Supplementary Materials
Data Availability Statement
The data underlying this article will be shared on reasonable request to the corresponding author.