

Abstract
We investigated whether post-meal walking (PMW) improved post-prandial glucose and 24h glucose control under free-living conditions among physically inactive young women.
METHODS:
Young women (Age: 20±1 years; percent body fat: 28.2±12%; BMI: 23.8±4.2 kg·m−1) completed a randomized crossover study to assess if PMW confers benefit. On the PMW day, women completed three bouts of brisk walks, and on the Control day they were instructed to follow normal habitual activities. Continuous glucose monitors captured post-prandial and 24h glucose, and physical activity monitors tracked physical activity throughout the study.
RESULTS:
PMW walking increased total daily step count (Control=9,159±2,962 steps vs. PMW=14,611±3,891 steps, p<0.001) and activity scores (Control=33.87±1.16 METs·h vs. PMW=36.11±1.58 METs·h, p<0.001). PMW led to lower 3h average post-prandial glucose (main effect of condition, p=0.011) and 3h post-prandial area under curve glucose responses (main effect of condition, p=0.027) compared to the control condition. Post hoc analysis revealed the largest decline occurred after dinner (3h average glucose Control=7.55±1.21 mmol/L vs. PMW=6.71±0.80 mmol/L, p=0.039), when insulin sensitivity is typically diminished. Despite improvements in post-prandial glucose control, this did not translate to improvements in 24h glucose control (p>0.05).
CONCLUSION:
Physically inactive and metabolically healthy young women, PMW improves post-prandial glucose but not 24h glucose control.
Keywords: Glucose Control, Post Meal Walking, Continuous Glucose Monitoring
INTRODUCTION
Over the past two decades, exercise has been demonstrated to reduce post-prandial glucose responses independent of exercise timing1–3. Recent studies have added to the benefits of exercise timing by assessing the effects of pre-prandial and post-prandial exercise, with the latter demonstrating better glucose control in individuals living with Type 2 Diabetes, insulin-resistance, and obesity4–7. Post-meal walking (PMW) has recently gained attention due to its potential health benefits by targeting this post-prandial window while requiring minimal equipment or exercise supervision6–9. In short, targeting the post-prandial (~30 minutes after meal consumption) window in pre-diabetic and Type 2 Diabetic adults augments the body’s ability to increase glucose transport into skeletal muscle through insulin-dependent and independent mechanisms during the fed state when insulin levels are high10,11.
Tightly controlled laboratory studies present terrific models for creating standardized exercise protocols to implement in the general population to help improve glucose regulation. These studies have demonstrated the benefit of exercise in reducing post-prandial glucose excursions in obese adults, physically inactive males, and adults at risk for impaired glucose control1,7,8,12,13. Continuous glucose monitors (CGMs) have allowed for studies to better understand improvements in glucose control, which might not be seen with oral glucose tolerance tests or hyperinsulinemic-euglycemic clamps. Further, CGMs can measure glucose control under free-living conditions with mixed meal consumption, better representing glucose responses observed in the general population14. Several measures have been developed in conjunction with CGM technology to better assess the glucose excursions that occur post-prandially and over a 24-hour (24h) period. As CGM technology becomes more widely available, it has allowed clinicians to move away from static measures of glucose regulation (e.g., fasting blood glucose, HbA1c) to optimize treatment for day-to-day oscillations in glucose control. The daily oscillations and variability in glucose (peaks to nadirs) is believed to contribute to the deleterious consequences of diminished glucose control on both the macro- and microvasculature15. To assess 24h glucose control, clinicians and researchers have assessed fluctuations in glucose levels using the mean amplitude of glycemic excursions (MAGE), continuous overall net glycemic action (CONGA), the standard deviation of 24h glucose, and coefficient of variation in 24h glucose16. While commonly deployed in studies assessing glucose control in adults with diabetes and metabolic syndrome, limited research exists purporting the benefits of exercise on glucose control in healthy but physically inactive young adults.
Under controlled laboratory conditions with controlled feeding and exercise, we expect improvements post-prandial glucose control17–19. In these studies, participants were provided standardized meals to consume (e.g., 2 slices of white bread; controlled macronutrient content, 30% carbohydrate, 40% fat and 30% protein) and completed supervised exercise (e.g., 30 minutes of treadmill walking; low resistance cycling). However, whether these improvements occur in free-living conditions where young adults consume their normal diet remains to be determined. Manohar et al. (2012) observed improved glucose control in a mixed sample of healthy men and women when performing post-prandial walking bouts for ~90 minutes after two meals17. A similar effect was found in a study of overweight and obese young men (~23 years old) that observed reduced glucose area under the curve (AUC) and insulin responses when 30 minutes of walking was performed 20 minutes before post-prandial peak glucose18. Young adults with limited time for additional physical activity might benefit from breaking up bouts of moderate-intensity exercise throughout the day compared to longer duration continuous moderate-intensity exercise. Further, it is unknown if PMW would improve glucose regulation in healthy, physically inactive young women, as women have largely been excluded in clinical research. It is known that women may have a reduced risk of cardiometabolic disease during young adulthood20,21, but whether seemingly healthy young women would also benefit from post-prandial walking remains unknown. Therefore, this study aimed to study glucose control in a free-living environment with participants attempting to consume their normal diet. We hypothesized that physically inactive young women would improve post-prandial glucose control and 24h glucose control following three bouts of PMW compared to a control day where women completed their normal activities of daily living.
METHODS
All experimental procedures were approved by the University of New Hampshire Institutional Review Board and complied with the guidelines set forth by the Declaration of Helsinki. Physically inactive young women (age 18–25) were recruited into the study. Physically inactive was defined as not completing structured physical activity 3 days per week that accumulated 75–150 minutes at a moderate-to-vigorous intensity22,23, for a period of 3 months, and this was determined in the health history. All women provided verbal and written consent and completed a health history form to screen for diagnosed cardiometabolic diseases, chronic kidney disease, and cancer before entering the study. Additionally, all women confirmed that they were free of injuries that prevented them from completing the PMW regimen described below.
Basic Health Assessment & Familiarization
All women completed a basic health assessment and familiarization session. We asked participants to fast for at least 10 hours, and abstain from caffeine, physical exercise, and alcohol for 24 hours before the basic health assessment. Height, body mass, waist circumference, and body composition were measured. Body mass and composition were measured using bioelectrical impedance analysis (InBody770; Cerritos, California, USA). Resting blood pressure and heart rate (Spot Vital Signs LXi, WelchAllyn; Skaneateles Falls, New York, USA) were measured in duplicate following 5 minutes of quiet rest in a seated position and separated by 1 minute between measurements. Fasting blood glucose and lipid levels were measured from a capillary blood sample per manufacturer guidelines (Cholestech LDX Analyzer, Abbott; Chicago, Illinois, USA). Women were excluded from the study if they had resting hypertension (systolic BP >129 mmHg; diastolic BP > 79 mmHg) or if their fasting blood glucose was ≥ 7 mmol·L−1. After completing the basic health assessment, we reviewed and familiarized the women with the PMW regimen, where women completed a brisk walking bout on a basketball court adjacent to the research laboratory with a rating of perceived exertion at 13–14 (Borg 6–20 Scale). The familiarization aimed to acquaint the women with what they felt to be a “brisk pace.” They were asked to replicate the same exercise intensity during their PMW day.
Control & Post-Meal Walking Day
All women completed both interventions in a randomized, counter-balanced order over a 5-day period with each trial day separated by ~48 hours. Randomization was done using a pseudo-random number generator (Randomizer.org). To control for hormonal effects on glucose regulation, the 5-day period was completed during the early follicular phase of their menstrual cycle or the placebo phase of their oral contraceptive cycle24,25. The early follicular phase is considered to have increased insulin sensitivity and improved glucose control. On the control day, women were asked to follow a normal routine and avoid strenuous physical activity. On the PMW day, women were asked to follow a normal routine again but to add three 15-minute bouts of PMW, 30 minutes after each meal (breakfast, lunch, and dinner) at a pace equal to 13–14 on the Borg scale.
Physical Activity Monitoring & Continuous Glucose Monitoring
To track their daily ambulatory activity, an ActivPal Physical Monitor (PAL Technologies Ltd; Glasgow, Scotland) was placed on the thigh of each woman, 1/3 of the way down from the inguinal crease at their hip. For active glucose monitoring, a Dexcom G6 Pro (Dexcom Inc, San Diego, CA, USA) CGM was placed on each woman’s abdomen which measured interstitial glucose levels every 5 minutes. The physical activity monitor and CGM were both worn for the entire 5-day study period. Women were instructed to consume similar meals at about the same time each day to control dietary and circadian fluctuations in glucose regulation. Diet was tracked by a self-report log and analyzed using Automated Self-Administered 24-Hour (ASA24®, https://epi.grants.cancer.gov/asa24) dietary assessment tool26. For diet log entries, the women were provided with a paper-based log to record their intake of food and beverages. Each log contained an instruction page for reporting meals and estimation of portion sizes (e.g., 3 ounces of meat = a deck of cards). These instructions were both verbalized and written in the log to guide the women. The following quote is found in the food log: “Your goal is to consume the same foods and portion sizes on the control and post-meal walking days.” All women were provided with a copy of their first food log to repeat on the second trial day. Additionally, the diet logs tracked start and stop times for PMW, which were confirmed via inspection of physical activity monitoring data.
24h Glycemic Variability, Post-Prandial Glucose, & Post-Prandial Physical Activity Analysis
Before CGM application, women were instructed on the proper care of the CGM. The women did not have access to the CGM receiver, rendering them blind to the information to prevent alterations in dietary intake. A total of 24 consecutive hours were considered for the evaluation of glucose variations and responses to meals. The 24-hour period used for analysis was established from 0600 of the experimental day to 0600 of the following morning. For post-prandial glucose analysis, we used self-reported meal times to extract 3h post-prandial glucose levels after breakfast, lunch, and dinner. Additionally, we analyzed the total steps taken 1h immediately following meal completion and the total steps taken over the 3h post-prandial period for each meal.
Data & Statistical Analysis
CGM and physical activity monitoring data were downloaded and visually inspected for dropped data points before data analysis. Raw CGM data were extracted and analyzed using Microsoft Excel (Version 2212; Redmond, WA, USA). For the assessment of 24h glucose control (24h mean glucose, 24h SD, 24h CV, MAGE, CONGA), raw data was analyzed using EasyGV (Version 9.0.R2; Oxford University, Oxford, England). If there were dropped glucose data points, the software performed a straight-line estimation to interpolate dropped glucose data points. A separate custom Excel analysis program analyzed post-prandial mean glucose and AUC. Total AUC was calculated using the trapezoidal rule. Statistical analysis was then performed in SPSS version 27 for Windows (SPSS Inc., Chicago, IL). Normality testing was performed using Shapiro-Wilk tests, and QQ plots were used to inspect the normal distribution of data visually. Shapiro-Wilks tests assessing normality found that 24h SD, 24h CV, and MAGE violated the normality assumption. All other 24h glucose measures (24h average glucose & CONGA) and post-prandial glucose measures met the assumption of normality. Log transformations were used to transform data to meet the normality assumption for 24h SD, 24h CV, and 24h MAGE.
Paired two-tailed t-tests compared physical activity and 24h glycemic variability data between the control and PMW day. A two-way repeated measure ANOVAs compared post-prandial 3h average glucose and 3h AUC responses following breakfast, lunch, and dinner between the two testing days. Post hoc analyses using one-way ANOVAs were performed for the main effect of condition, and post-hoc analysis for multiple comparison (e.g., breakfast carbohydrate consumption vs. dinner) were compared using Sidak post-hoc test for multiple comparisons. Data are presented as mean ± standard deviation. Effect sizes for main outcome variables are reported as Cohen’s d for paired t-tests and partial eta-squared (ƞ2p) for two-way ANOVAs. Alpha was set to p<0.05.
RESULTS
Participants
A total of 17 participants completed the study. Two women were excluded from the analysis due to the use of birth control implants, in which women reported no regular menstrual cycle pattern. One of the women was excluded due to not consuming breakfast on the PMW or control day. Therefore, the remaining 14 women are reported herein. All women were healthy, young women with no history of cardiometabolic disease, chronic kidney disease, or musculoskeletal injuries that prevented them from completing the PMW protocol. Participant screening characteristics are provided in Table 1. Women were mostly non-obese (13/14 women; 93%) (BMI<30.0 kg·m−2) with normal fasting blood glucose (<5.56 mmol·L−1; 13/14 women; 93%), total cholesterol (<5.17 mmol·L−1; 11/14 women; 79%), triglycerides (<5.17 mmol·L−1; 14/14 women; 100%). Additionally, none of the women were considered to have resting hypertension during their screening visit (<130/80 mmHg; 14/14 women, 100%) or reported a history of hypertension.
Table 1.
Baseline Participant Characteristics.
| Participant Characteristics | |
|---|---|
| Number of Participants, n | 14 |
| Age, years | 20 ± 1 |
| Height, cm | 164.5 ± 4.7 |
| Weight, kg | 64.3 ± 10.8 |
| Body Mass Index, kgm−2 | 23.8 ± 4.2 |
| Body Fat, % | 30.4 ± 12.2 |
| Waist Circumference, cm | 77.3 ± 9.7 |
| Fasting Blood Glucose, mmolL−1 | 4.9 ± 0.4 |
| Total Cholesterol, mmol·L−1 | 4.8 ± 1.1 |
| HDL, mmol·L−1 | 1.7 ± 0.3 |
| LDL, mmol·L−1 | 2.6 ± 0.9 |
| Triglycerides, mmol·L−1 | 1.1 ± 0.5 |
| Resting Systolic Blood Pressure, mmHg | 111 ± 6 |
| Resting Diastolic Blood Pressure, mmHg | 74 ± 4 |
| Resting Heart Rate, bpm | 86 ± 12 |
Data expressed as Mean±SD. Bpm, beats per minut; cm, centimeter; HDL, high density lipoprotein; kg, kilograms; LDL, low density lipoprotein; mmHg, millimeters mercury; mmol·L−1, millimoles per liter.
24h Diet Log Data
Dietary data is provided in Table 2. There were no differences between 24h diet logs between control and PMW days (Total calories, p=0.545; total carbohydrates, p=0.447; total fat, p=0.164; total protein, p=0.319; added sugar consumption, p=0.451). Across the three meals, there we no effect of condition (control day vs. PMW day) for total kcals (p=0.432; effect size=0.048), total carbohydrates (p=0.522; effect size=0.032), total fat (p=0.100; effect size=0.194), total protein consumed (p=0.202; effect size=0.122), added sugar consumption (p=0.609; effect size=0.021). Thus, diets were similar between the control day and PMW day. However, we did observe a significant effect of meal for total kcals (p=0.002; effect size=0.383), total carbohydrate (p=0.004; effect size=0.350), total fat (p=0.039; effect size=0.221), and total protein (p=0.001; effect size=0.429) consumed, but not added sugar consumption (p=0.911; effect size=0.065). We performed post hoc testing to test the main effect of meal. We report that our participants consumed more kcals (p<0.001), carbohydrates (p=0.001), fat (p=0.018), and protein (p<0.001) during their dinner compared to breakfast. Post hoc analysis found that more protein was consumed during lunch compared to dinner (p=0.006).
Table 2.
Dietary Recall Data.
| 24h Dietary Recall | Control | PMW |
|---|---|---|
| Total Calories, kcals | 2207 ± 636 | 2310 ± 575 |
| Total Carbohydrate, grams | 276 ± 89 | 257 ± 71 |
| Total Fat, grams | 91 ± 35 | 106 ± 37 |
| Total Protein, grams | 80 ± 24 | 88 ± 27 |
| Added Sugars, grams | 105 ± 49 | 92 ± 42 |
| Breakfast | ||
| Calories, kcal | 446 ± 243† | 442 ± 221† |
| Total Carbohydrate, grams | 53 ± 32† | 50 ± 27† |
| Total Fat, grams | 20 ± 13† | 19 ± 12† |
| Total Protein, grams | 16 ± 11† | 18 ± 11† |
| Added Sugars, grams | 21 ± 18 | 16 ± 13 |
| Lunch | ||
| Calories, kcal | 523 ± 252 | 718 ± 334 |
| Total Carbohydrate, grams | 63 ± 32 | 75 ± 39 |
| Total Fat, grams | 24 ± 16 | 35 ± 21 |
| Total Protein, grams | 18 ± 8† | 28 ± 14† |
| Added Sugars, grams | 24 ± 21 | 28 ± 25 |
| Dinner | ||
| Calories, kcal | 834 ± 414 | 752 ± 293 |
| Total Carbohydrate, grams | 105 ± 57 | 81 ± 44 |
| Total Fat, grams | 31 ± 22 | 34 ± 16 |
| Total Protein, grams | 35 ± 17 | 32 ± 16 |
| Added Sugars, grams | 30 ± 29 | 24 ± 27 |
Data expressed as Mean±SD. Kcal, kilocalories. Sidak Post-Hoc Test:
p <0.05 vs. Dinner.
Post-Prandial Step Accumulation & Blood Glucose Control
As designed, women performed fewer steps during the 1h post-prandial period (effect of condition: p<0.001, effect size=0.776; effect of meal: p=0.684, effect size=0.034; effect of condition*meal: p=0.951, effect size=0.005) and over the 3h post-prandial period (effect of condition: p<0.001, effect size=0.766; effect of meal: p=0.053, effect size=0.235; effect of condition*meal: p=0.697, effect size=0.032) following meal consumption during the control condition compared to the PMW condition. Further, post hoc testing confirmed 1h step total & 3h step total were higher when PMW was performed compared to the control day after each meal (Table 3).
Table 3.
Physical Activity Data.
| 1h Step Total (n =12) | Control | PMW |
|---|---|---|
| Breakfast, steps | 807 ± 871 | 2071 ± 869* |
| Lunch, steps | 710 ± 661 | 1872 ± 1106* |
| Dinner, steps | 631 ± 571 | 1906 ± 816* |
| 3h Step Total (n =12) | ||
| Breakfast, steps | 1979 ± 1249 | 3383 ± 1134* |
| Lunch, steps | 1498 ± 1090 | 3349 ± 1753* |
| Dinner, steps | 943 ± 644 | 2714 ± 985* |
Data expressed as Mean±SD.
p <0.05 vs. Control meal
The 3h post-prandial glucose (3h average glucose & 3h AUC) response data are presented in Figure 1. PMW led to improved 3h mean glucose following meals with a main effect of meal (p=0.006, effect size=0.570) and condition (p=0.011, effect size=0.406). Post hoc analysis to assess the main effect of condition revealed that PMW led to reduced 3h mean glucose following dinner (p=0.039 vs. control dinner) only. We also found that 3h AUC glucose was improved with PMW compared to the control day (main effect of condition, p=0.027, effect size=0.322; main effect of meal, p=0.001, effect size=0.593). Post hoc analysis also revealed that PMW only trended toward a reduction of 3h AUC glucose following dinner (p=0.061 vs. control dinner). Additionally, we performed post hoc analysis to assess the main effect of meal for 3h average glucose and 3h AUC glucose responses and found that the highest glucose responses occurred following dinner compared to breakfast (p<0.05) but not lunch (p>0.05).
Figure 1-.
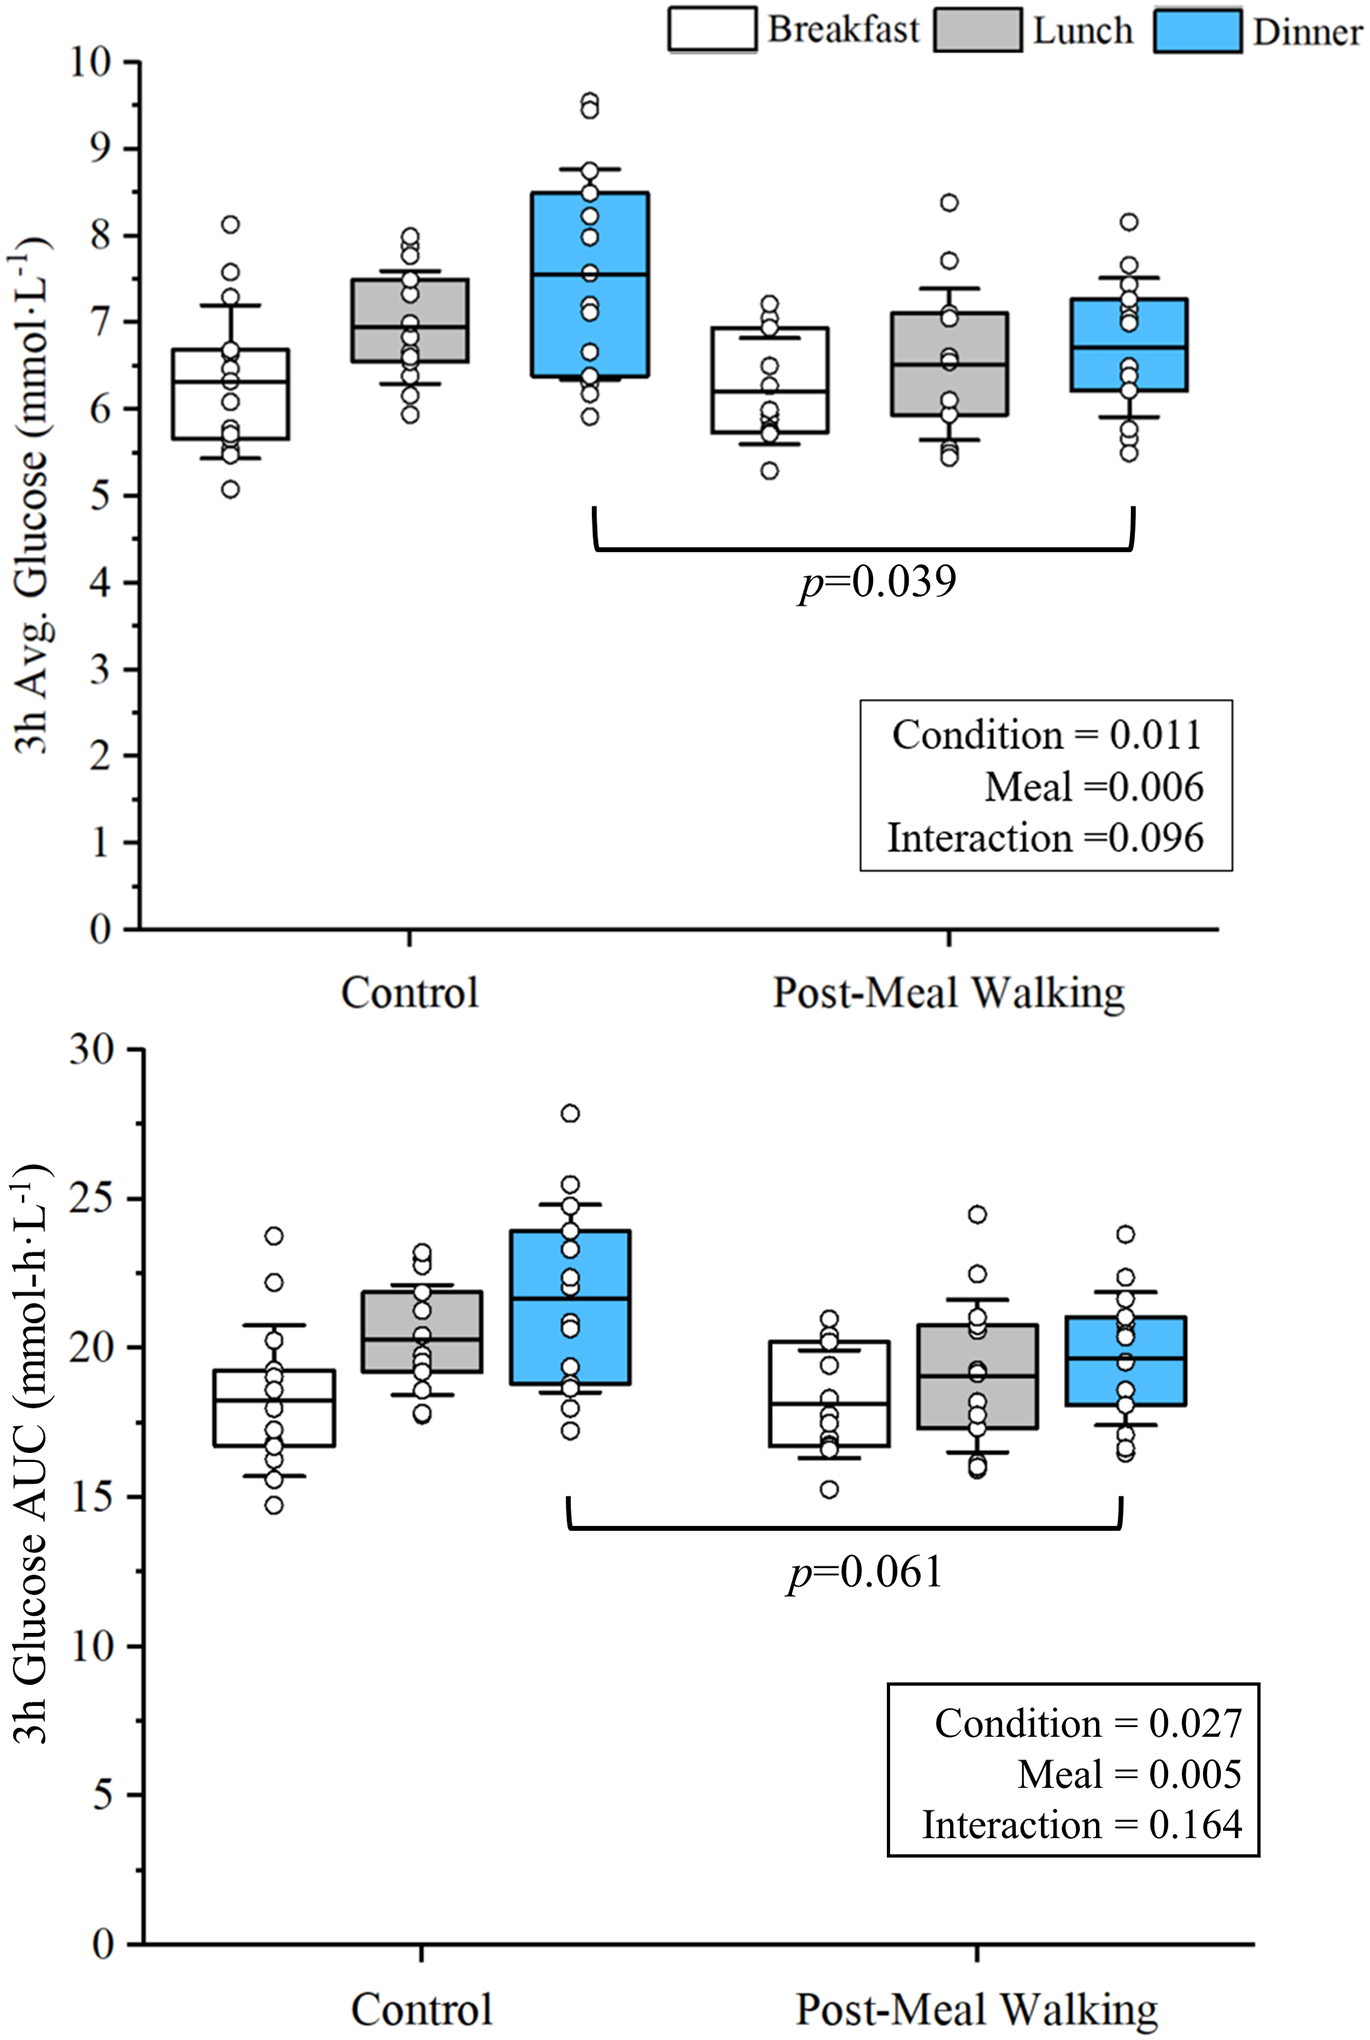
Post-meal walking (PMW) led to a main effect of condition in post-prandial 3h average glucose and 3h area under the curve (AUC) following breakfast, lunch, and dinner (for both main effect of condition, p<0.05). Post hoc analysis found that post-prandial 3h average glucose was significantly lower after dinner following PMW compared to dinner on the control day. p=0.039 vs. Control Dinner.
To ensure the post-prandial improvements in glucose regulation following dinner were not due to increased CHO consumption at dinner, we performed paired t-tests between Control and PMW meals. We found no significant difference between the PMW and Control dinners CHO consumption (p=0.08) or added sugar consumption (p=0.47). Due to the near significant value, we removed participants (n=6) with differences in CHO consumption > 30 grams between the Control and PMW dinners. This left us with 8 participants (Control Dinner = 89±32g of CHO vs. Post-Meal Walking Dinner = 94±27g of CHO; p=0.26). In addition to no difference in CHO consumption, there was no difference in added sugar consumption (Control Dinner = 22±12 g of added sugar vs. Post-Meal Walking Dinner = 23±15g of added sugar; p=0.88). We then performed a paired t-test to compare 3h post-prandial glucose responses in these 8 participants. We still observed a significantly lower 3h post-prandial glucose response after dinner (n=8; Control = 7.15 ± 0.8 mmol/L vs. Post-Meal Walking = 6.68±0.6 mmol/L; p=0.039).
24h Physical Activity & 24h Glucose Control
Physical activity metrics and 24h glucose control data are provided in Table 4. Two participants had their daily ambulatory activity monitors malfunction during wear. Therefore, we report data from the 12 participants with normal monitor function. As anticipated, PMW increased 24h total step count and activity scores compared to the control condition (p<0.001; for both), but not more occurrences of sit-to-stand measures (p=0.12). Despite increased physical activity, there were no improvements or reductions (p>0.05, for all) in measures of 24h glucose control (24h mean glucose, 24h AUC, 24h SD, 24h CV, MAGE) found. Although not statistically significant, CONGA, a measure of hourly glucose variability, trended toward significance (p=0.10).
Table 4.
24-Hour Continuous Glucose Monitoring Data.
| 24h Glucose Control Metrics (n=14) | Control | PMW | Effect Size (d) |
|---|---|---|---|
| Mean Glucose, mmol·L−1 | 6.7 ± 0.5 | 6.5 ± 0.6 | 0.414 |
| 24h Area Under Curve, mmol-h·L−1 | 156.6 ± 14.5 | 155.2 ± 13.1 | 0.112 |
| Mean Standard Deviation, mmol·L−1 | 1.01 ± 0.35 | 0.89 ± 0.16 | 0.288 |
| Coefficient of Variation, % | 15.1 ± 5.0 | 13.9 ± 3.1 | 0.191 |
| CONGA, mmol·L−1 | 6.04 ± 0.49 | 5.84 ± 0.59 | 0.473 |
| MAGE, mmol·L−1 | 2.39 ± 0.71 | 2.42 ± 0.37 | −0.114 |
| 24h Physical Activity Metrics (n =12) | |||
| Total Step Count, Steps | 9159 ± 2962 | 14611 ± 3891* | −2.417 |
| Activity Score, METs.h | 34 ± 1 | 36 ± 2* | −2.278 |
| Sit-to-Stand, Count | 45 ± 11 | 49 ± 11 | −0.484 |
Data expressed as Mean±SD. mmol·L−1, millimoles per liter; mmol-h·L−1, millimoles hour per liter; MAGE, mean amplitude of glucose excursion; CONGA, continuous overall net glycemic action; METs, Metabolic Equivalents. p <0.05 vs. Control
DISCUSSION
The purpose of our study was to determine whether PMW improves post-prandial and 24h glucose control in physically inactive young women under free-living conditions and attempting to consume their normal diet. Post-prandial exercise has improved post-prandial glucose responses in tightly controlled laboratory settings in healthy, young adults17,19, and overweight/obese young men18. When providing young women who self-report as physically inactive with an exercise prescription to perform 15 minutes of PMW after breakfast, lunch, and dinner, we extend laboratory findings by reporting that PMW can improve post-prandial glucose control in a free-living setting. We also found that PMW led to the greatest improvements in 3h post-prandial glucose responses following dinner. These findings are strengthened by the dietary data that support participants who had similar meals between the control and PMW days. Yet, although we found improved post-prandial glucose responses, there seems to be no difference in 24h glucose regulation measures between the control and PMW days. Nonetheless, our data support that increasing physical activity with post-prandial exercise can lead to better post-prandial glucose control in physically inactive young women without complex exercise intervention strategies.
Our study aimed to determine if PMW exercise improves 24h glucose control and post-prandial glucose control without standardized meals. Women were familiarized with the PMW condition and asked to perform “brisk walking” after breakfast, lunch, and dinner, and analysis showed that the largest reduction in post-prandial glucose occurred after dinner. All PMW step counts 1h & 3h post-prandial were higher compared to control. As depicted in Figure 2, the initiation of PMW leads to rapid reductions in blood glucose levels. The figure provides the mean post-prandial glucose responses from the CGM every five minutes on the control and PMW days. In this figure, we highlight that the initiation of PMW leads to a largely sustained reduction in post-prandial glucose following dinner. Similar to our findings, a randomized crossover study design by Morgan et al. (2012) reported that high glycemic index meals consumed in the evening time had the highest glucose and insulin responses compared to the same high glycemic meal provided during breakfast27. This diminished post-prandial insulin sensitivity at dinner appears to follow a diurnal pattern28. Our data shows that under free-living conditions, our young adult women largely consume the greatest amount of carbohydrates in the evening compared to breakfast. Therefore, implementing exercise after dinner likely yields the most beneficial effects on glucose regulation, especially if carbohydrate consumption is highest during evening meals. We hypothesize this is due to the combined potential for enhanced insulin stimulated glucose29 uptake following PMW exercise earlier in the day (breakfast & lunch) and increased insulin-independent GLUT4 translocation promoted by contracting skeletal muscle30–32, which has been demonstrated to occur with low (40% VO2max) and high (80% VO2max) intensity exercise. A separate study in older adults with impaired fasting blood glucose also found PMW led to larger improvements in glucose control following the dinner meal7. Our study is the first to report such findings in seemingly healthy, physically inactive young women in free-living conditions.
Figure 2-.
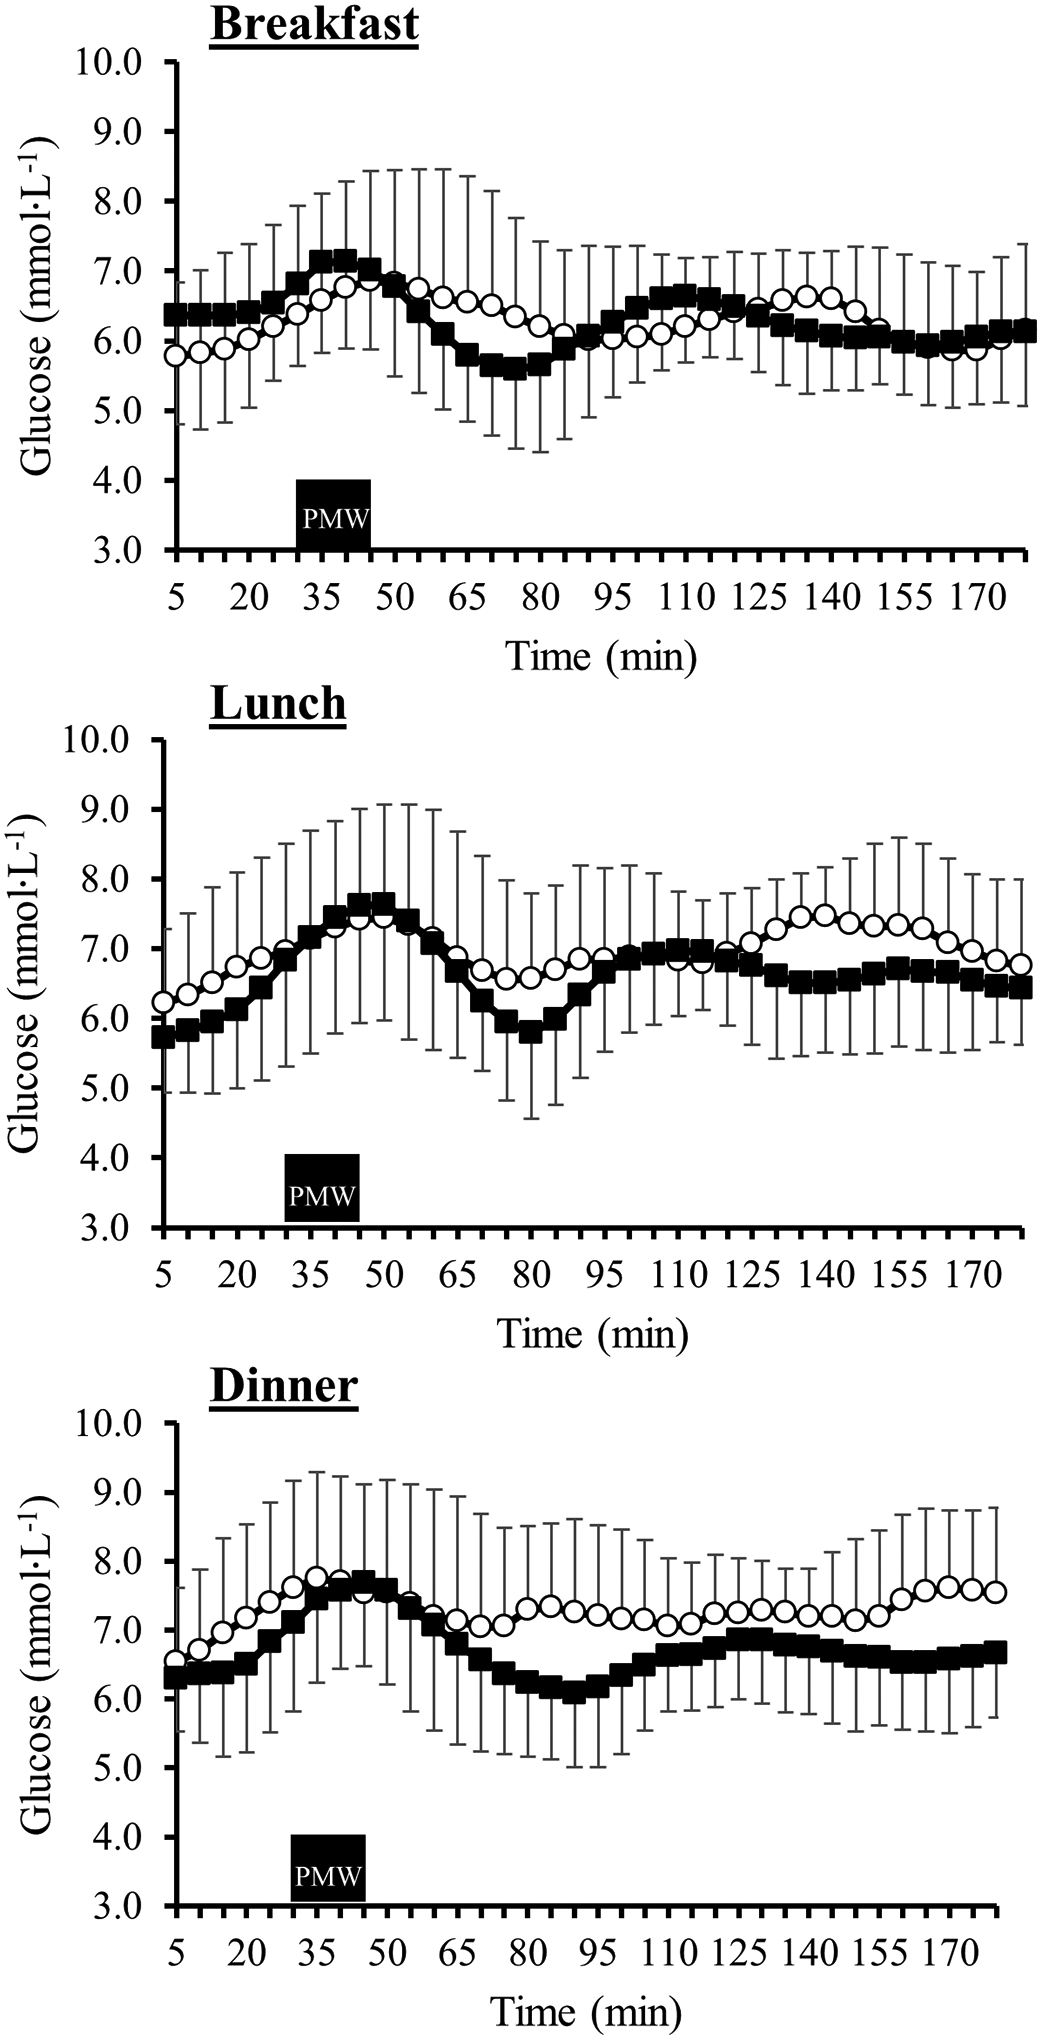
3h post-prandial glucose response following breakfast (top), lunch (middle), and dinner (bottom) during the control day (open circles) and post-meal walking (PMW) day (closed squares). The black rectangle represents the 15-minute PMW period completed by participants during the PMW day only.
We report no improvement in 24h glucose regulation following post-prandial bouts of brisk walking. Previous studies in pre-diabetic older adults and adults with Type 2 Diabetes found that PMW improved 24h average glucose and reduced hyperglycemia7,33. Thus, it appears that the greatest benefit of post-prandial exercise on 24h glucose control is among clinical populations, whereas healthy adults exhibit post-prandial improvements in glucose regulation only17. There are several plausible explanations for the discrepancy of these findings in our study and we discuss these below.
Studies support that young premenopausal women are at a lower risk of developing insulin resistance compared to age-matched men20,21. The underlying mechanism for preventing insulin resistance remains unknown and requires further exploration. However, studies have speculated that multiple underlying sex characteristics may favor improved glucose regulation in premenopausal women compared to age-matched men. Estrogen is considered to be a key metabolic hormone in both men and women. Estrogen improves insulin sensitivity and decreases liver gluconeogenesis, which has been well supported in recent animal models34. Second, studies support that women have a greater proportion of Type I muscle fibers than age-matched young adult men35,36, which has been thought to increase insulin sensitivity37. Adiposity levels have also been identified as a contributor to insulin resistance. Our sample of metabolically healthy young women may not have had a significant amount of adiposity to induce insulin resistance to gain a 24h therapeutic benefit. Lastly, we can’t rule out that our cohort’s higher-than-expected physical activity (e.g., daily step count) potentially contributed to the non-significant improvements in 24h glucose measures.
Our physical activity data revealed that the women in our study were still fairly active during their control day based on their step counts. Despite the higher-than-expected daily steps and activity score, the addition of PMW still improved post-prandial glucose. These women were encouraged to maintain their normal daily living activities to maintain the study’s ecological validity. The women averaged 9,159 steps during the control day and 14,611 during the PMW day. In recent years, multiple studies and reviews38 have provided evidence that the threshold for the associated health benefits of increased step accumulation is between 7,500–10,000 steps/day. These studies report a reduced risk of developing cardiovascular disease39, cardiometabolic conditions40, dementia41, cancer39, all-cause mortality40,42, and the prevalence of obesity43. Others have supported that achieving approximately 7,000–8,000 steps/day may allow individuals to meet moderate-to-vigorous physical activity guidelines under free-living conditions without structured exercise programming44. The American Heart Association reported that meeting the physical activity guidelines leads to roughly a 75% reduction in all-cause mortality and approximately a 40% reduction in cardiovascular disease mortality45. Others report a significant association between meeting the guidelines with reduced values for BMI, adiposity, triglycerides, glucose, and improved overall cardiometabolic risk scores46. Thus, it is reasonable to speculate that even though our women do not engage in structured physical activity, their habitual accumulation of steps throughout the daytime on the control day may have normalized their 24h glucose control measures to the PMW day, despite PMW improving 3h post-prandial glucose. It is also worth mentioning that these women were considered metabolically healthy (free of hypertension, obesity, and hyperlipidemia). Further, this also suggests the importance of exercise timing for optimal glucose control. A recent systematic review examined the benefits of pre-prandial exercise compared to post-meal exercise on glycemic excursions in healthy adults and adults with Type 2 Diabetes. The authors reported that performing post-prandial exercise within 30 minutes of meal completion yielded the greatest improvement in post-prandial glycemic excursions compared to pre-prandial exercise47. Taken together, young women accumulating greater than 8,000 steps/day may still obtain greater post-prandial glucose control by performing brief bouts (~15 minutes) of walking following a meal despite achieving >8,000 steps.
An ecological study approach offers strengths and weaknesses to consider regarding our study. A major strength of the study design is that it tests the hypothesis under free-living conditions, which allows for greater practical application for clinicians and exercise professionals. The ecological approach also captures the likely day-to-day variations in diet and physical activity that are related to behavioral decisions made by the participant. In the case of our study, the PMW intervention was able to overcome these day-to-day variations in diet and physical activity. Although our findings support the improved post-prandial glucose control, a weakness of the ecological design is adding variables that can’t be accounted for compared to structured laboratory settings. For instance, participants were asked to consume the same meals. Participants attempted to substitute food items when the food item was unavailable. Researchers need to examine data further to rule out alternative explanations (e.g., added CHO or added sugar consumption). Another potential drawback to the ecological approach with acute exercise interventions is the long-term feasibility and the overall exercise affect (e.g., joy of performing PMW, digestion of food) of PMW on the participants. More studies are needed to examine the long-term benefits of PMW compared to other methods of structured exercise.
Although our study supports the idea that glucose responses are improved with post-prandial walking, there are limitations to consider for future studies. First, the smaller sample size may have limited our ability to detect a reduction in 3h post-prandial glucose response following lunch. Based on our observed data, we estimate a sample size of 33 participants can adequately power (effect size = 0.511; β = 0.80) a study to capture improvements in post-prandial glucose responses following lunch and dinner in healthy, physically inactive young women. Second, the prolonged feasibility of PMW as a true exercise intervention for improved health outcomes related to cardiometabolic health warrants further studies. As our 24h glucose data suggests, these meaningful reductions in post-prandial glucose warrant further examination as to a long-term benefit or whether these improvements are more meaningful in a clinical population (e.g., Type 2 Diabetes). Nonetheless, our population was more physically active than more sedentary young adults, which might suggest the potential that 24h glucose can be improved in a sedentary population with PMW. Third, it remains unknown how the cumulative contribution of PMW bouts or increased daily step count contributed to reduced post-prandial glucose reductions following dinner. Lastly, 24h dietary food logs were entered directly into ASA24 to report dietary intake, which may lead to under-reporting. ASA24 was designed for self-reporting instead of the traditional food log entry. A previous study supports that food log entry can provide reasonable estimates for assessing dietary intake, as ASA24 uses the same United States Department of Agriculture food and nutrient database for dietary studies48.
In conclusion, PMW improves 3h post-prandial glucose in physically inactive young women, and the largest improvement in glucose regulation was seem when PMW occurred after dinner. PMW did not improve 24h glucose control despite improvements in post-prandial control. These findings occurred despite our sample accumulating 9,159 steps during the control day, suggesting the added benefits of exercise timing over total daily step accumulation matters for post-prandial glucose control.
ACKNOWLEDGEMENTS
The IDeA Program provided support for the research project, NIH Grant No. P20GM103506 (National Institute of General Medical Sciences). We want to thank and acknowledge our participants for their efforts to participate in the study. We would also like to thank Dain LaRoche (Department of Kinesiology, College of Health and Human Services, University of New Hampshire) for his assistance with study development and Jack Souza’s assistance with data processing.
Footnotes
CONFLICTS OF INTEREST
The authors report no conflict of interest. The study results are presented clearly and honestly without fabrication, falsification, or inappropriate data manipulation.
REFERENCES
- 1.Little JP, Jung ME, Wright AE, Wright W, Manders RJF. Effects of high-intensity interval exercise versus continuous moderate-intensity exercise on postprandial glycemic control assessed by continuous glucose monitoring in obese adults. Appl Physiol Nutr Metab. 2014;39(7):835–841. doi: 10.1139/apnm-2013-0512 [DOI] [PubMed] [Google Scholar]
- 2.Hatamoto Y, Goya R, Yamada Y, et al. Effect of exercise timing on elevated postprandial glucose levels. J Appl Physiol. 2017;123(2):278–284. doi: 10.1152/japplphysiol.00608.2016 [DOI] [PubMed] [Google Scholar]
- 3.Haxhi J, Scotto Di Palumbo A, Sacchetti M. Exercising for metabolic control: Is timing important? Ann Nutr Metab. 2013;62(1):14–25. doi: 10.1159/000343788 [DOI] [PubMed] [Google Scholar]
- 4.Francois ME, Baldi JC, Manning PJ, et al. “Exercise snacks” before meals: A novel strategy to improve glycaemic control in individuals with insulin resistance. Diabetologia. 2014;57(7):1437–1445. doi: 10.1007/s00125-014-3244-6 [DOI] [PubMed] [Google Scholar]
- 5.Nygaard H, Rønnestad BR, Hammarström D, Holmboe-Ottesen G, Høstmark AT. Effects of exercise in the fasted and postprandial state on interstitial glucose in hyperglycemic individuals. J Sport Sci Med. 2017;16(2):254–263. [PMC free article] [PubMed] [Google Scholar]
- 6.Holmstrup M, Fairchild T, Keslacy S, Weinstock R, Kanaley J. Multiple short bouts of exercise over 12-h period reduce glucose excursions more than an energy-matched single bout of exercise. Metabolism. 2014;63(4):510–519. doi: 10.1016/j.metabol.2013.12.006 [DOI] [PMC free article] [PubMed] [Google Scholar]
- 7.DiPietro L, Gribok A, Stevens MS, Hamm LF, Rumpler W. Three 15-min bouts of moderate postmeal walking significantly improves 24-h glycemic control in older people at risk for impaired glucose tolerance. Diabetes Care. 2013;36(10):3262–3268. doi: 10.2337/dc13-0084 [DOI] [PMC free article] [PubMed] [Google Scholar]
- 8.Dunstan DW, Kingwell BA, Larsen R, et al. Breaking up prolonged sitting reduces postprandial glucose and insulin responses. Diabetes Care. 2012;35(5):976–983. doi: 10.2337/dc11-1931 [DOI] [PMC free article] [PubMed] [Google Scholar]
- 9.Solomon TPJ, Tarry E, Hudson CO, Fitt AI, Laye MJ. Immediate post-breakfast physical activity improves interstitial postprandial glycemia: a comparison of different activity-meal timings. Pflugers Arch Eur J Physiol. 2020;472(2):271–280. doi: 10.1007/s00424-019-02300-4 [DOI] [PMC free article] [PubMed] [Google Scholar]
- 10.Richter EA. Is GLUT4 translocation the answer to exercise-stimulated muscle glucose uptake? Am J Physiol - Endocrinol Metab. 2021;320(2):E240–E243. doi: 10.1152/AJPENDO.00503.2020 [DOI] [PMC free article] [PubMed] [Google Scholar]
- 11.Klip A, McGraw TE, James DE. Thirty sweet years of GLUT4. J Biol Chem. 2019;294(30):11369–11381. doi: 10.1074/jbc.REV119.008351 [DOI] [PMC free article] [PubMed] [Google Scholar]
- 12.Shambrook P, Kingsley MI, Wundersitz DW, Xanthos PD, Wyckelsma VL, Gordon BA. Glucose response to exercise in the post-prandial period is independent of exercise intensity. Scand J Med Sci Sport. 2018;28(3):939–946. doi: 10.1111/sms.12999 [DOI] [PubMed] [Google Scholar]
- 13.Shambrook P, Kingsley MI, Taylor NF, et al. A comparison of acute glycaemic responses to accumulated or single bout walking exercise in apparently healthy, insufficiently active adults. J Sci Med Sport. 2020;23(10):902–907. doi: 10.1016/j.jsams.2020.02.015 [DOI] [PubMed] [Google Scholar]
- 14.Mikus CR, Oberlin DJ, Libla JL, Taylor AM, Booth FW, Thyfault JP. Lowering Physical Activity Impairs Glycemic Control in Healthy Volunteers. Med Sci Sport Exerc. 2012;44(2):225–231. doi: 10.1249/MSS.0b013e31822ac0c0 [DOI] [PMC free article] [PubMed] [Google Scholar]
- 15.Monnier L, Colette C, Owens DR. Glycemic Variability: The Third Component of the Dysglycemia in Diabetes. Is it Important? How to Measure it? J Diabetes Sci Technol. 2008;2(6):1094–1100. doi: 10.1177/193229680800200618 [DOI] [PMC free article] [PubMed] [Google Scholar]
- 16.Kovatchev BP. Metrics for glycaemic control-from HbA1c to continuous glucose monitoring. Nat Rev Endocrinol. 2017;13(7):425–436. doi: 10.1038/nrendo.2017.3 [DOI] [PubMed] [Google Scholar]
- 17.Manohar C, Levine JA, Nandy DK, et al. The effect of walking on postprandial glycemic excursion in patients with type 1 diabetes and healthy people. Diabetes Care. 2012;35(12):2493–2499. doi: 10.2337/dc11-2381 [DOI] [PMC free article] [PubMed] [Google Scholar]
- 18.Zhang X, Wongpipit W, Sun F, et al. Walking Initiated 20 Minutes before the Time of Individual Postprandial Glucose Peak Reduces the Glucose Response in Young Men with Overweight or Obesity: A Randomized Crossover Study. J Nutr. 2021;151(4):866–875. doi: 10.1093/jn/nxaa420 [DOI] [PubMed] [Google Scholar]
- 19.Reynolds AN, Venn BJ. The timing of activity after eating affects the glycaemic response of healthy adults: A randomised controlled trial. Nutrients. 2018;10(11). doi: 10.3390/nu10111743 [DOI] [PMC free article] [PubMed] [Google Scholar]
- 20.Carr MC. The emergence of the metabolic syndrome with menopause. J Clin Endocrinol Metab. 2003;88(6):2404–2411. doi: 10.1210/jc.2003-030242 [DOI] [PubMed] [Google Scholar]
- 21.Sugiyama MG, Agellon LB. Sex differences in lipid metabolism and metabolic disease risk. Biochem Cell Biol. 2012;90(2):124–141. doi: 10.1139/o11-067 [DOI] [PubMed] [Google Scholar]
- 22.World Health Organization. Report of the Formal Meeting of Member States to conclude the work on the comprehensive global monitoring framework, including indicators, and a set of voluntary global targets for the prevention and control of noncommunicable diseases. 2013;(March):1–9. [Google Scholar]
- 23.Thivel D, Tremblay A, Genin PM, Panahi S, Rivière D, Duclos M. Physical Activity, Inactivity, and Sedentary Behaviors: Definitions and Implications in Occupational Health. Front Public Heal. 2018;6(October):1–5. doi: 10.3389/fpubh.2018.00288 [DOI] [PMC free article] [PubMed] [Google Scholar]
- 24.Oosthuyse T, Bosch AN. The effect of the menstrual cycle on exercise metabolism: Implications for exercise performance in eumenorrhoeic women. Sport Med. 2010;40(3):207–227. doi: 10.2165/11317090-000000000-00000 [DOI] [PubMed] [Google Scholar]
- 25.Pulido JME, Salazar MA. Changes in insulin sensitivity, secretion and glucose effectiveness during menstrual cycle. Arch Med Res. 1999;30(1):19–22. doi: 10.1016/S0188-0128(98)00008-6 [DOI] [PubMed] [Google Scholar]
- 26.Pannucci TE, Thompson FE, Bailey RL, et al. Comparing Reported Dietary Supplement Intakes between Two 24-Hour Recall Methods: The Automated Self-Administered 24-Hour Dietary Assessment Tool and the Interview-Administered Automated Multiple Pass Method. J Acad Nutr Diet. 2018;118(6):1080–1086. doi: 10.1016/j.jand.2018.02.013 [DOI] [PMC free article] [PubMed] [Google Scholar]
- 27.Morgan LM, Shi JW, Hampton SM, Frost G. Effect of meal timing and glycaemic index on glucose control and insulin secretion in healthy volunteers. Br J Nutr. 2012;108(7):1286–1291. doi: 10.1017/S0007114511006507 [DOI] [PubMed] [Google Scholar]
- 28.Peng F, Li X, Xiao F, Zhao R, Sun Z. Circadian clock, diurnal glucose metabolic rhythm, and dawn phenomenon. Trends Neurosci. 2022;45(6):471–482. doi: 10.1016/j.tins.2022.03.010 [DOI] [PMC free article] [PubMed] [Google Scholar]
- 29.Heath GW, Gavin JR, Hinderliter JM, Hagberg JM, Bloomfield SA, Holloszy JO. Effects of exercise and lack of exercise on glucose tolerance and insulin sensitivity. J Appl Physiol. 1983;55(2):512–517. doi: 10.1152/jappl.1983.55.2.512 [DOI] [PubMed] [Google Scholar]
- 30.Katz A, Sahlin K, Broberg S. Regulation of glucose utilization in human skeletal muscle during moderate dynamic exercise. Am J Physiol - Endocrinol Metab. 1991;260(3 23–3). doi: 10.1152/ajpendo.1991.260.3.e411 [DOI] [PubMed] [Google Scholar]
- 31.Derave W, Lund S, Holman GD, Wojtaszewski J, Pedersen O, Richter EA. Contraction-stimulated muscle glucose transport and GLUT-4 surface content are dependent on glycogen content. Am J Physiol - Endocrinol Metab. 1999;277(6 40–6):1103–1110. doi: 10.1152/ajpendo.1999.277.6.e1103 [DOI] [PubMed] [Google Scholar]
- 32.Kraniou GN, Cameron-Smith D, Hargreaves M. Acute exercise and GLUT4 expression in human skeletal muscle: Influence of exercise intensity. J Appl Physiol. 2006;101(3):934–937. doi: 10.1152/japplphysiol.01489.2005 [DOI] [PubMed] [Google Scholar]
- 33.Reynolds AN, Mann JI, Williams S, Venn BJ. Advice to walk after meals is more effective for lowering postprandial glycaemia in type 2 diabetes mellitus than advice that does not specify timing: a randomised crossover study. Diabetologia. 2016;59(12):2572–2578. doi: 10.1007/s00125-016-4085-2 [DOI] [PubMed] [Google Scholar]
- 34.Yan H, Yang W, Zhou F, et al. Estrogen improves insulin sensitivity and suppresses gluconeogenesis via the transcription factor Foxo1. Diabetes. 2019;68(2):291–304. doi: 10.2337/db18-0638 [DOI] [PMC free article] [PubMed] [Google Scholar]
- 35.Haizlip KM, Harrison BC, Leinwand LA. Sex-based differences in skeletal muscle kinetics and fiber-type composition. Physiology. 2015;30(1):30–39. doi: 10.1152/physiol.00024.2014 [DOI] [PMC free article] [PubMed] [Google Scholar]
- 36.Staron RS, Hagerman FC, Hikida RS, et al. Fiber type composition of the vastus lateralis muscle of young men and women. J Histochem Cytochem. 2000;48(5):623–629. doi: 10.1177/002215540004800506 [DOI] [PubMed] [Google Scholar]
- 37.Fisher G, Windham ST, Griffin P, Warren JL, Gower BA, Hunter GR. Associations of human skeletal muscle fiber type and insulin sensitivity, blood lipids, and vascular hemodynamics in a cohort of premenopausal women. Eur J Appl Physiol. 2017;117(7):1413–1422. doi: 10.1007/s00421-017-3634-9 [DOI] [PMC free article] [PubMed] [Google Scholar]
- 38.Washburn BD, Ihm JM. Using Step Counts to Prescribe Physical Activity: What Is the Optimal Dose? Curr Sports Med Rep. 2021;20(8):402–409. doi: 10.1249/JSR.0000000000000868 [DOI] [PubMed] [Google Scholar]
- 39.Del Pozo Cruz B, Ahmadi MN, Lee IM, Stamatakis E. Prospective Associations of Daily Step Counts and Intensity with Cancer and Cardiovascular Disease Incidence and Mortality and All-Cause Mortality. JAMA Intern Med. 2022;182(11):1139–1148. doi: 10.1001/jamainternmed.2022.4000 [DOI] [PMC free article] [PubMed] [Google Scholar]
- 40.Paluch AE, Gabriel KP, Fulton JE, et al. Steps per Day and All-Cause Mortality in Middle-aged Adults in the Coronary Artery Risk Development in Young Adults Study. JAMA Netw Open. 2021;4(9):1–12. doi: 10.1001/jamanetworkopen.2021.24516 [DOI] [PMC free article] [PubMed] [Google Scholar]
- 41.Del Pozo Cruz B, Ahmadi M, Naismith SL, Stamatakis E. Association of Daily Step Count and Intensity with Incident Dementia in 78430 Adults Living in the UK. JAMA Neurol. 2022;79(10):1059–1063. doi: 10.1001/jamaneurol.2022.2672 [DOI] [PMC free article] [PubMed] [Google Scholar]
- 42.Lee IM, Shiroma EJ, Kamada M, Bassett DR, Matthews CE, Buring JE. Association of Step Volume and Intensity with All-Cause Mortality in Older Women. JAMA Intern Med. 2019;179(8):1105–1112. doi: 10.1001/jamainternmed.2019.0899 [DOI] [PMC free article] [PubMed] [Google Scholar]
- 43.Dwyer T, Hosmer D, Hosmer T, et al. The inverse relationship between number of steps per day and obesity in a population-based sample - The AusDiab study. Int J Obes. 2007;31(5):797–804. doi: 10.1038/sj.ijo.0803472 [DOI] [PubMed] [Google Scholar]
- 44.Tudor-Locke C, Leonardi C, Johnson WD, Katzmarzyk PT, Church TS. Accelerometer steps/day translation of moderate-to-vigorous activity. Prev Med (Baltim). 2011;53(1–2):31–33. doi: 10.1016/j.ypmed.2011.01.014 [DOI] [PubMed] [Google Scholar]
- 45.Piercy KL, Troiano RP. Physical Activity Guidelines for Americans From the US Department of Health and Human Services. Circ Cardiovasc Qual Outcomes. 2018;11(11):e005263. doi: 10.1161/CIRCOUTCOMES.118.005263 [DOI] [PubMed] [Google Scholar]
- 46.Katzmarzyk PT, Staiano AE. Relationship Between Meeting 24-Hour Movement Guidelines and Cardiometabolic Risk Factors in Children. J Phys Act Heal. 2017;14(10):779–784. doi: 10.1123/jpah.2017-0090 [DOI] [PMC free article] [PubMed] [Google Scholar]
- 47.Engeroff T, Groneberg DA, Wilke J. After Dinner Rest a While, After Supper Walk a Mile? A Systematic Review with Meta-analysis on the Acute Postprandial Glycemic Response to Exercise Before and After Meal Ingestion in Healthy Subjects and Patients with Impaired Glucose Tolerance. Sport Med. 2023;53(4):849–869. doi: 10.1007/s40279-022-01808-7 [DOI] [PMC free article] [PubMed] [Google Scholar]
- 48.Park Y, Dodd KW, Kipnis V, et al. Comparison of self-reported dietary intakes from the Automated Self-Administered 24-h recall, 4-d food records, and food-frequency questionnaires against recovery biomarkers. Am J Clin Nutr. 2018;107(1):80–93. doi: 10.1093/ajcn/nqx002 [DOI] [PMC free article] [PubMed] [Google Scholar]