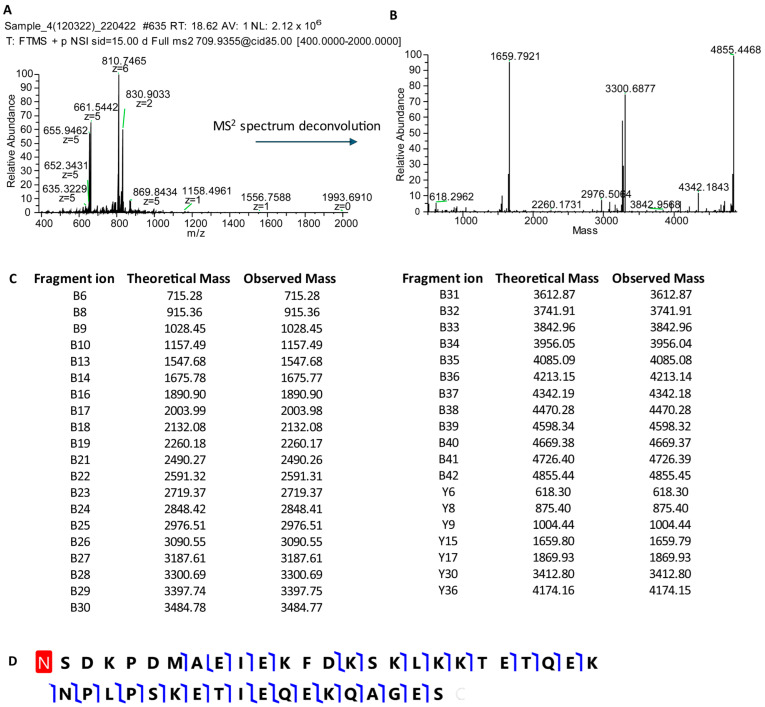
Figure 4.
MS/MS characterization of the sequence of Tβ4. High-resolution MS/MS of the [M + 7H+]7+ ion at 709.94 m/z of Tβ4 (Panel (A)) and the corresponding deconvoluted spectrum (Panel (B)). Matching fragments’ grid (Panel (C)), showing theoretical and experimental B and Y fragment ions (blu lines) obtained by ProSight Lite (version 1.4), assuming the N-term acetylation of Tβ4 (red box) as reported in the graphical fragment map (Panel (D)).

