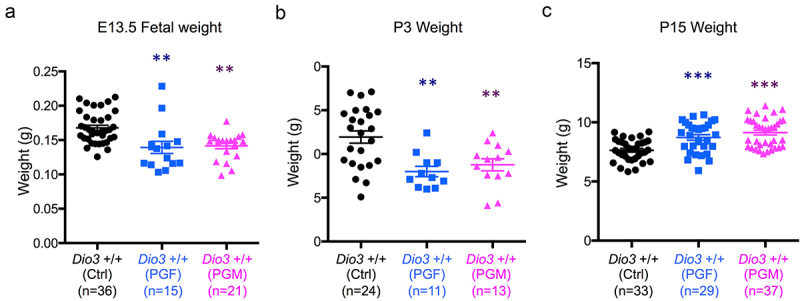
Figure 7.

Fetal and neonatal growth of PGF and PGM mice.
(a, b and c), Body weight of PGF and PGM mice at E13.5 foetal age (A), P3 (B) and P15 (C). Each point represents one mice. Data represent the mean ± SEM of the indicated number of animals representing at 3 to 6 different litters. ** and *** indicate p < 0.01 and p < 0.001, respectively, when compared to controls.
