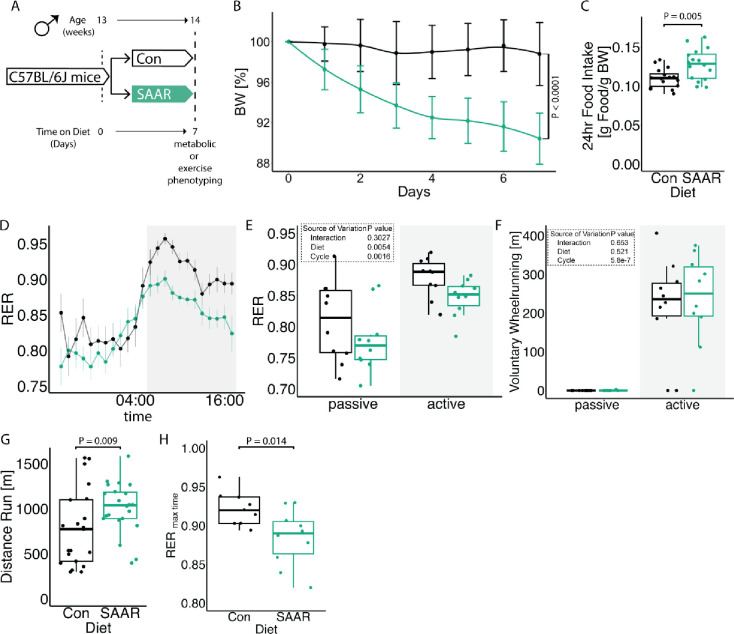
Figure 1. Short-term SAAR induces shifts in metabolism and increases endurance exercise capacity in young, sedentary, male mice.
A. Experimental set up and color scheme used throughout figure 1 and figure S1.
B. Body weight trajectory over time, shown as percent of starting body weight (n = 10) of male mice given ad libitum access to sulfur amino acid restricted (SAAR) versus control (Con) diet for seven days.
C. Food intake expressed as grams of food per gram of body weight per mouse within a 24 h period (n = 10) of male mice given ad libitum access to SAAR versus Con diet on day seven.
D. Sable systems indirect calorimetry measurements of respiratory exchange ratios (CO2 emission/O2 consumption, VCO2/VO2, RER) over a 24 h period (n = 10) and
E. the average RER during a 12 h – 12 h light–dark cycle (n = 10/group) of male mice given ad libitum access to SAAR versus Con diet on day seven.
F. The average wheel running in meter during a 12 h – 12 h light–dark cycle (n = 10) of male mice given ad libitum access to SAAR versus Con diet on day seven.
G. Distance ran in meter during a one-time maximal endurance test (n = 20) of male mice given ad libitum access to SAAR versus Con diet on day seven.
H. Quantification of RER at maximal exercise time, during a one-time maximal endurance test, performed on a metabolic treadmill (Harvard Apparatus) (n = 10) of male mice given ad libitum access to SAAR versus Con diet on day seven.
All data is shown as mean and error bars indicate SD unless otherwise noted; p values indicate the significance of the difference by Student’s t test or two-way ANOVA with Sidak’s multiple comparisons test between diets or diet and cycle (indirect calorimetry); significance is determined by a p value of p < 0.05. Each dot represents an individual mouse. See also Figure S1 and Table S1.

