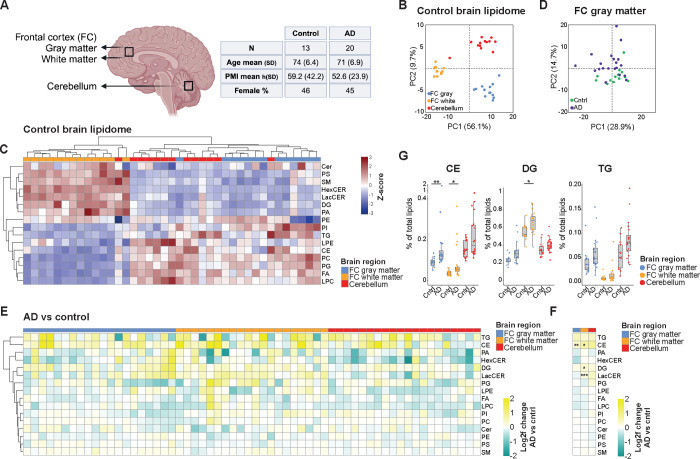
Figure 2. Human (AD) brain lipidomics.
A) Schematic overview of human postmortem brain tissue sampled and summary of subject characteristics. Metadata for individual patients can be found in the methods section. B) PCA plot of unbiased lipidomic analysis from indicated brain areas (control group subjects only). C) Heatmap shows Z scored relative lipid class abundance (control group) per brain regions. D) PCA plot of unbiased lipidomic analysis of AD (purple) and control (green) brain tissue samples from frontal cortex (FC) gray matter. E) Heatmap depicting changes (log2fold AD subject vs average control group) at the lipid class level for each individual AD subject and each brain area. AD patient samples are ordered 1–20 from left to right in each brain area (see methods for metadata) F) Average log2fold change of lipid classes in all AD brain samples compared to control samples per brain area. G) Changes in levels of CE, DG and TG (neutral) lipid species in control versus AD group. Mann-Whitney U test with Benjamini-Hochberg correction *=P<0.05. All lipid values in this figure are plotted as % of total lipids, raw concentration can be found in Supplementary figure 2.

