



Abstract
CRISPR gene editing strategies are shaping cell therapies through precise and tunable control over gene expression. However, achieving reliable therapeutic effects with improved safety and efficacy requires informed target gene selection. This depends on a thorough understanding of the involvement of target genes in gene regulatory networks (GRNs) that regulate cell phenotype and function. Machine learning models have been previously used for GRN reconstruction using RNA-seq data, but current techniques are limited to single cell types and focus mainly on transcription factors. This restriction overlooks many potential CRISPR target genes, such as those encoding extracellular matrix components, growth factors, and signaling molecules, thus limiting the applicability of these models for CRISPR strategies. To address these limitations, we have developed CRISPR-GEM, a multi-layer perceptron (MLP)-based synthetic GRN constructed to accurately predict the downstream effects of CRISPR gene editing. First, input and output nodes are identified as differentially expressed genes between defined experimental and target cell/tissue types respectively. Then, MLP training learns regulatory relationships in a black-box approach allowing accurate prediction of output gene expression using only input gene expression. Finally, CRISPR-mimetic perturbations are made to each input gene individually and the resulting model predictions are compared to those for the target group to score and assess each input gene as a CRISPR candidate. The top scoring genes provided by CRISPR-GEM therefore best modulate experimental group GRNs to motivate transcriptomic shifts towards a target group phenotype. This machine learning model is the first of its kind for predicting optimal CRISPR target genes and serves as a powerful tool for enhanced CRISPR strategies across a range of cell therapies.
1. Introduction:
Clustered regularly interspaced short palindromic repeats (CRISPR) is a bioinspired gene editing tool for regulating gene expression at specific genomic locations1. Distinct CRISPR-associated (Cas) proteins are available for precise knock-in, knock-out, activation or inhibition of target genes, which must be carefully selected based on the CRISPR strategy and therapeutic application2. Target genes are often well-established genes or biomarkers in tissues or disease states due to their known effects on cell behavior. However, CRISPR-mediated alteration of single-gene expression can influence the expression of thousands of genes as governed by complex gene regulatory networks (GRNs). For example, activating COL2A1, a major component of cartilage extracellular matrix (ECM), using CRISPR activation (CRISPRa) in adipose-derived stem cells resulted in 2,532 differentially expressed genes (DEGs)3. Similarly, knocking-out PRDM1 in CAR-T cells resulted in 2,192 DEGs which drove an early memory phenotype and dynamic cytokine secretion for enhanced anti-tumor activity4. These broad transcriptomic changes demonstrate that CRISPR interventions have cascading effects on larger GRNs, resulting in unexpected transcriptomic outcomes. Therefore, CRISPR-based cell therapies require informed target gene selection methods to best modulate GRNs for precise phenotypic regulation and enhanced therapeutic effects.
Mapping and reconstructing GRNs represents a promising strategy for identifying optimal CRISPR target genes. Initially, knock-out experiments were used to characterize the downstream transcriptomic effects of specific genes and generate large gene regulation databases. However, the complexity of the genome coupled with variation in experimental procedures made these methods challenging to interpret. More recently, machine learning (ML) have been successful in decoding gene regulatory relationships and elucidating important transcription factors and regulatory mechanisms. Early ML methods employed linear, tree-based, weighted correlation, RNA velocity, or enrichment analysis strategies to learn regulatory relationships from RNA-seq data5–14. Okawa et al. applied such principles to the prediction of candidate genes for stem cell differentiation using a Boolean model15. Still, these frameworks fall short in capturing the non-linear nature of gene regulation caused by feedback loops, competing interactions, and post-translational modifications. González-Blas et al. sought to partially address this by combining gene expression and transcription factor binding data to construct an enhancer-driven GRN, enabling the identification of RUNX3 as an important catalyst of melanoma formation16. This strategy greatly improved the interpretability of GRNs but could not distinguish the effects of multiple transcription factors acting on one binding region. More complex models are therefore required to decode all non-linear relationships involved in gene expression for accurate and interpretable GRN construction. To address this, a surge of deep learning (DL) models have employed multilayer perceptrons (MLPs), graph neural networks (GNNs), recurrent neural networks (RNNs), or transformers to capture non-linear relationships in GRNs17–21. While DL has shown remarkable improvements in GRN accuracy, more strategic model design is required to best tune these models for evaluating CRISPR target genes.
DL models are highly influenced by the data source used for training. Many DL-based GRN models are trained using single cell RNA-seq data, which provides clear insights into genomic regulation without the conflicting signals from cellular subpopulations. However, bulk RNA-seq might better represent CRISPR-mediated transcriptomic shifts as they affect entire biological systems, comprised of diverse cell types and subpopulations. Magnusson et al. established effective GRN reconstruction using bulk RNA-seq data by training an MLP to predict expression throughout the entire genome18. Their model achieved over 95% accuracy using only the expression of 1600 known transcription factors as inputs18. This approach better forecasts how transcription factor expression drives cellular processes in a biologically relevant manner compared to single cell RNA-seq models. Additionally, the MLP structure accurately predicts complex and irregular gene regulatory relationships without the hyperparameter sensitivity or speculative assumptions required by simpler support vector regression (SVR) models or more complex GNNs. Further, the black-box framework allows for accurate prediction of gene expression while indirectly accounting for variables such as external signaling, ECM interactions, or post-translational protein modification. However, by limiting inputs to transcription factors, many potential CRISPR target genes can be discarded such as those encoding for ECM components, growth factors, and signaling molecules. Although these genes are regulated by transcription factors, they play important roles in cellular processes and can provide feedback that alters transcription factor expression. Well-informed CRISPR strategies must consider all genes to achieve the maximal therapeutic effect.
To address these limitations, we have developed CRISPR-GEM (Gene Evaluation through Machine Learning). This system involves a synthetic MLP-based GRN with input/output genes filtered to accommodate specific CRISPR applications. We then utilize this GRN to score the therapeutic impact of individual CRISPR target gene candidates to aid in the design of well-informed CRISPR strategies. CRISPR-GEM defines two groups: (1) the experimental group, consisting of the cell or tissue to be CRISPR edited, and (2) the target group, representing the desired therapeutic phenotype. These groups are compared to identify DEGs, which are filtered based on the CRISPR strategy (knock-in, knock-out, activation, or inhibition) to define input and output genes for the neural network. This tissue-specific MLP is trained on bulk RNA-seq data to learn the regulatory relationships between the identified genes, the broader genome and all regulatory mechanisms controlling the transcriptome. Finally, each gene in the experimental group RNA-seq datasets is perturbed in a CRISPR-mimetic manner and input into the trained MLP. The CRISPR-GEM scoring system compares the magnitude and direction of changes in gene expression between model predictions for the perturbed dataset and target group datasets to assess the overall therapeutic effect for each perturbed gene. As a proof of concept, we identify promising CRISPR target genes for 1) the differentiation of induced pluripotent stem cells (iPSCs) to regulatory T-cells (Tregs), 2) the chondrogenic differentiation of mesenchymal stem cells (MSCs), and 3) the reversal of osteoarthritis (OA) in cartilage tissues. Our results identify well-established genes SRGN, PRG4, and FAP among top scoring genes for the respective applications which validates model performance. Furthermore, CRISPR-GEM identifies novel gene targets and highlights the essential genes and cellular pathways necessary for specifically modulating cell phenotype to inspire advanced CRISPR strategies.
2. Methods & Procedures:
2.1. Data Preparation:
RNA-seq data for primary human cells and tissues collected using Illumina HiSeq 2000 or HiSeq 2500 platforms was identified using the gene expression omnibus (GEO) and can be found in Supp. Table 1. Data was downloaded from the sequencing read archive (SRA) using the SRA toolkit “prefetch” and “fasterq-dump” executables22. The raw fastq files were then aligned to the GRCh38.p14 genome assembly using the kallisto algorithm which yields sequencing data in transcript per million (tpm) or estimated counts23,24. The data for tpm or estimated counts was then sorted into separate data frames with samples in the rows and each ensemble ID in the columns. The column names were then mapped to their gene symbol and grouped per gene by taking the maximum value.
2.2. Description of CRISPR-GEM Graphical User Interface and Differential Expression Analysis:
CRISPR-GEM requires the input of the CRISPR strategy to be performed and the desired phenotypic changes sought following gene editing. A graphical user interface (GUI) is designed to facilitate this input and was made available through GitHub (https://github.com/jog822/CRISPR-GEM.git) (Supp. Fig. 1). The interface first requires the selection of the CRISPR strategy to be employed (CRISPR activation: “CRISPRa”, CRISPR inhibition: “CRISPRi”, CRISPR knock-out: “CRISPRko”, and CRISPR knock-in: “CRISPRki”). Next, the cell/tissue types for the gene editing strategy must be specified. The ‘end-to-end’ strategy requires the selection of the cell/tissue groups to be treated using CRISPR (experimental) and desired following this treatment (target). Additionally, the ‘intermediate cell type’ strategy allows for the additional input of a third intermediate group that lies on the progression from experimental to target groups such as a milder disease state or developing tissue. These groups may be selected using the dropdown menus and are all labelled in Supp. Table 1.
The interface then allows for feature selection using differential expression analysis to identify critical genes for distinguishing each group. To reduce bias in differential expression analysis, the GUI identifies the selected group with the lowest number of samples and randomly filters the remaining groups to have the same quantity. By clicking the “Get Inputs” button (Supp. Fig. 1F), the experimental, target, and possibly intermediate groups are used to create metadata. The pyDEseq2 algorithm then identifies DEGs between each group25. Significant DEGs are filtered according to the selected CRISPR strategy to determine the input and output genes for neural network analysis (Supp. Tables 5–10). Input genes are identified as the DEGs in the target group compared to the experimental group with the highest magnitude log2 fold change (log2FC) in the appropriate direction for the selected CRISPR strategy as described in Table 1. Output genes are identified as the genes with the lowest p value or most significant differential expression regardless of direction for a broad summary of the phenotypic differences.
Table 1.
Input & Output gene selection parameters.
| CRISPR Strategy | Input Gene Selection Method | Output Gene Selection Method | |
|---|---|---|---|
| CRISPRko | log2FC < 1 | p<0.01 | p<0.01 |
| CRISPRki | log2FC > 0.7 | p<0.01 | p<0.01 |
| CRISPRa | log2FC > 0.7 | p<0.01 | p<0.01 |
| CRISPRi | log2FC < 1 | p<0.01 | p<0.01 |
When an intermediate cell/tissue type is identified, input genes are sorted by comparing the intermediate group instead of the target group while output gene selection is unchanged. The selected genes, statistical results, and the specific datasets used for the analysis may be saved to the location of the GUI executables by typing in a short description and clicking the “save” button. The selected genes and statistical analysis can be viewed in interactive datasets using the “Display Input Genes” or “Display Output Genes” buttons (Supp. Fig. 1F). For more detailed analysis of specific genes, the “Graph Gene” button can be used to plot the DeSeq2 normalized relative gene expression between each group. Further, the “Plot UMAP” button (Sup. Fig. 1H) can be applied to provide a two-dimensional projection describing the broad differences in the data selected for differential expression analysis26.
2.3. Deep Neural Network:
Differential expression analysis was used to identify two distinct input and output gene sets of variable lengths based on the tissue or cell types compared. Each input and output node of the tissue specific MLP represents one of these genes, so the model architecture is defined by the number of input and output genes, respectively. The model connects the expression of input and output genes through three fully connected hidden layers constructed to represent CRISPR candidates’ interactions with the broader genome. This architecture allows learned relationships between input and output genes with the broader genome while preventing overfitting. Prior to model training, the tpm dataset prepared using kallisto is filtered for the input and output genes and any repeated genes are removed from the outputs yielding two unique datasets. Both datasets are then log normalized, split into 85% training and 15% testing subsets27. Finally, the model is trained using Keras built on top of TensorFlow with an rectified linear unit (ReLU) activation function, learning rate = 0.0001, ε = 1e-8, batch size = 50, validation split = 0.15, mean squared error (MSE) loss function, 200 training epochs and early stopping with a patience of 1018,28,29. The entire process from splitting into training and testing subsets to model training is repeated five times to cross-validate model performance.
2.4. Data Perturbation:
The trained MLP predicts the gene expression of all output genes based on the expression of the input or CRISPR candidate genes; but further assessment is required to determine which genes have the most profound effect on directing cell phenotype. To assess these candidates, tpm data for the experimental group is filtered for CRISPR candidate genes before individually perturbing each gene to mimic the specified CRISPR strategy according to Table 2.
Table 2.
Fold change perturbation for each CRISPR method.
| CRISPR Strategy | Perturbation | Equation # |
|---|---|---|
| CRISPRko | p = x · 0 | eq. 1 |
| CRISPRki | p = x + ki | eq. 2 |
| CRISPRa | eq. 3 | |
| CRISPRi | eq. 4 |
where: p=perturbed gene expression; x = unperturbed relative gene expression; ki is a constant defined based on knock-in promoter, set to 5 as default; and ka = constant that can be changed based on cell type, set to 15 as default.
CRISPRko is simulated by setting gene expression to zero to mimic the complete loss of gene expression in cultured knock-out cells (Table 2 eq. 1). Since gene expression is a function of enhancer regions surrounding a gene and promoter strength, the transcriptomic changes resulting from CRISPRki are highly variable based on the knock-in coordinates and promoter used30. Therefore, we simulate knock-in by adding a constant expression value (ki) that simulates the addition of a second, independent copy of the gene and can be manually modified based on the gRNA and donor template sequences (Table 2 eq. 2). The default ki value is set to 5 since it is slightly above the average log normalized tpm value across all datasets of 35. The strong relationship between basal gene expression and activation or inhibition fold-changes is represented in eqs. 3 and 4 (Table 2) for CRISPRa and CRISPRi, respectively31,32. CRISPR activation levels are inversely correlated to basal expression which is modeled by multiplying the initial expression by a function of itself to dampen the activation in highly expressed genes (Table 2 eq. 3). Alternatively, to simulate the positive correlation between CRISPRi and initial expression, the unperturbed expression is divided by a function of the natural logarithm of itself so that highly expressed genes are more greatly inhibited (Table 2 eq. 4).
2.4. Gene Evaluation:
After perturbation, modified experimental group datasets for each gene are input into the DNN to predict the expression output genes following CRISPR editing. The predicted expression levels are compared to the model predictions for unperturbed target group datasets to assess how the perturbations shift the transcriptomic profile towards that of the target group. A scoring system was developed to incorporate the direction and magnitude of changes in gene expression and their benefit to the induction of the target phenotype. Briefly, for each perturbation input into the model, the predicted change in gene expression is calculated for every output gene as described in eq. 5:
| (eq. 5) |
where: denotes the predicted change in gene expression, represents the predicted gene expression from perturbed experimental data, and represents the predicted expression from original experimental group data.
The predicted transcriptomic shifts following CRISPR editing are compared to model predictions for the experimental group to eliminate any significant bias from model training. Similarly, the desired change in gene expression (eq. 6) relates the predicted expression of the target group to the experimental group and represents the change in gene expression necessary for a fully effective therapy.
| (eq. 6) |
where: denotes the desired change in gene expression and represents the predicted gene expression from non-perturbed target group data.
The final score is obtained by calculating the difference between the predicted and desired changes and normalizing to the initial gene expression value to account for the magnitude of that gene’s expression. Finally, the sum of the values for each gene is calculated and divided by the total number of output genes to yield the score for each CRISPR target gene (eq. 7).
| (eq. 7) |
where: S represents the evaluation score for perturbed gene, and n represents the total number of output genes.
Eq. 7 is used to assess the expression changes resultant of editing each CRISPR candidate and the lowest scoring genes are returned as the most promising candidates for the specified CRISPR strategy. The 50 highest scoring genes for each CRISPR-GEM application are input into STRING: Functional Protein Association Networks to visualize the protein-protein interactions that may occur downstream of the target genes33.
3. Results & Discussion:
3.1. CRISPR-GEM Workflow:
CRISPR-GEM represents a novel ML approach for the identification of promising target genes for specific therapeutic outputs. CRISPR-GEM constructs a synthetic GRN that captures the regulatory relationships within specific tissues then uses this to draw conclusions on the impact of CRISPR therapies (Fig. 1). To validate CRISPR-GEM, we applied the algorithm to three regenerative medicine applications: (1) Regulatory T-cell differentiation from induced pluripotent stem cells (iPSCs), (2) Enhanced chondrogenesis of MSCs through CRISPRa, (3) the reversal of osteoarthritis progression using CRISPRi. Input/output gene selection and DNN training is performed consistently across each application with model predictions explaining over 95% of variance in testing data. For each prospective therapy we outline the motivation, group selection, and highlight promising candidate genes.
Fig. 1.

Schematic of CRISPR-GEM. A) Constructing tissue specific GRNs to predict gene expression relevant to the selected CRISPR therapy. DeSeq2 is utilized to select plausible CRISPR candidates and identify important genes for distinguishing experimental and target cell/tissue types. The resulting genes are used as input and output nodes respectively to train a MLP to predict the expression of output genes using only the expression of input genes. B) Assessing CRISPR strategies using the constructed GRN. RNA-seq data for the experimental group is perturbed by amplifying or suppressing the relative expression value of each gene individually. The perturbed experimental group dataset and an un-modified target group dataset are input into the trained MLP and model predictions for each are compared to assess the efficacy of the editing strategy for driving the target group transcriptomic profile.
3.2. Model Validation: Differentiation of iPSCs to Treg Cells:
Tregs are a subset of CD4+CD25+ T-cells, that constitute 5–15% of peripheral T cells and help to control the adaptive immune response and mitigate inflammatory signals34. These immunosuppressive cells have shown great efficacy in inducing and maintaining immune homeostasis for the prevention of a range of autoimmune disorders such as diabetes, arthritis, and irritable bowel syndrome35–39. The main challenge in Treg and general T-cell therapies is the difficulty of cell generation, isolation, and expansion from patients. This issue could be solved through the differentiation and reprogramming of rapidly dividing iPSCs into Tregs40. Strategies to accomplish this employ viral vectors encoding Treg specific transgenes, namely FOXP3, and have successfully alleviated diabetes symptoms as well as inflammation and joint destruction in arthritic environments38,40. Despite the promise of these strategies, iPSCs hold the capacity to dedifferentiate or differentiate to various cell types including leukemia or lymphoma cells emphasizing the importance of reliable lineage commitment. To address this, we employed CRISPR-GEM to identify safe and reliable CRISPRa target genes to facilitate the differentiation of iPSCs to Treg cells.
iPSCs are defined as the experimental group with Treg cells as the target group. A large number of DEGs distinguished the iPSCs from Tregs as visualized in a low dimension UMAP projection (Fig. 2A). The separate iPSC clusters likely represent global differences stemming from variability in cell sourcing. Input and output gene selections were made by filtering DEGs between iPSCs and Tregs. Model training accurately captured the transcriptomic relationships between iPSC and Treg cell genes as demonstrated by a loss of 0.051 ± 0.002 (Fig. 2B) and r2 of 0.952 ± 0.002 (Fig. 2C). The accuracy of model predictions can further be visualized by linear trend between predicted and actual expression (Fig. 2D).
Fig. 2.

Model Training results given by CRISPR-GEM predictions for CRISPRa candidates to drive Treg differentiation. A) Treg cells display distinct phenotypes from iPSCs as visualized in reduced dimension via UMAP projection, B) Model training predicted output gene expression with an MSE of 0.051 ± 0.002, C) an r2 of 0.952 ± 0.002 (p = 1.11 ∙ 10−16). These results suggest that the CRISPR-GEM neural network can predict over 94% of the transcriptomic variance throughout the iPSC-Treg transition, and D) The strong linear trend between actual and predicted output gene expression values verifies model accuracy.
Assessment of CRISPRa candidate genes reveals a highly connected regulatory network comprised mainly of immunomodulatory genes (Fig. 3A). These genes are also connected to transcription factors such as JUNB and KLF2 which are known to be critical regulators in the differentiation and function of Tregs41,42. These immunomodulatory genes may therefore act upstream or downstream of the transcription factors to drive phenotypic changes necessary for Treg differentiation. Tregs are also classified by their strong expression of forkhead box P3 (FOXP3), a transcription factor specific to regulatory T cells. Closer analysis of the top ten gene candidates reveals many known regulatory interactions or positive correlations to FOXP3 expression (Table 3, Fig. 3B). Top scoring SRGN and high ranking CD48 accomplish this through interactions with BATF, a transcription factor that is required for Treg differentiation, homeostasis and function43–46. FOX3P upregulation also occurs through downstream of LTB, TSC22D3 genes. LTB contributes to the LTα1β2 heterotrimer that is highly expressed in Treg cells compared to other CD4+ subsets and directly correlates to FOXP3 and CD25 expression47. TSC22D3 encodes glucocorticoid-induced leucine zipper (GLIZ) which upregulates FOXP3 and hence Treg production via the TGF-β and SMAD signaling pathways48. CASP4 and SELL (CD26L) expression is not directly associated with FOXP3 but has a strong positive correlation. CASP4 encodes caspase 4, an endoprotease that regulates inflammation and has been notably upregulated during T cell activation49. SELL or L-selectin (CD-62) expression in Treg cells improves immunosuppressive activity in a range of autoimmune diseases49,50.
Figure 3.
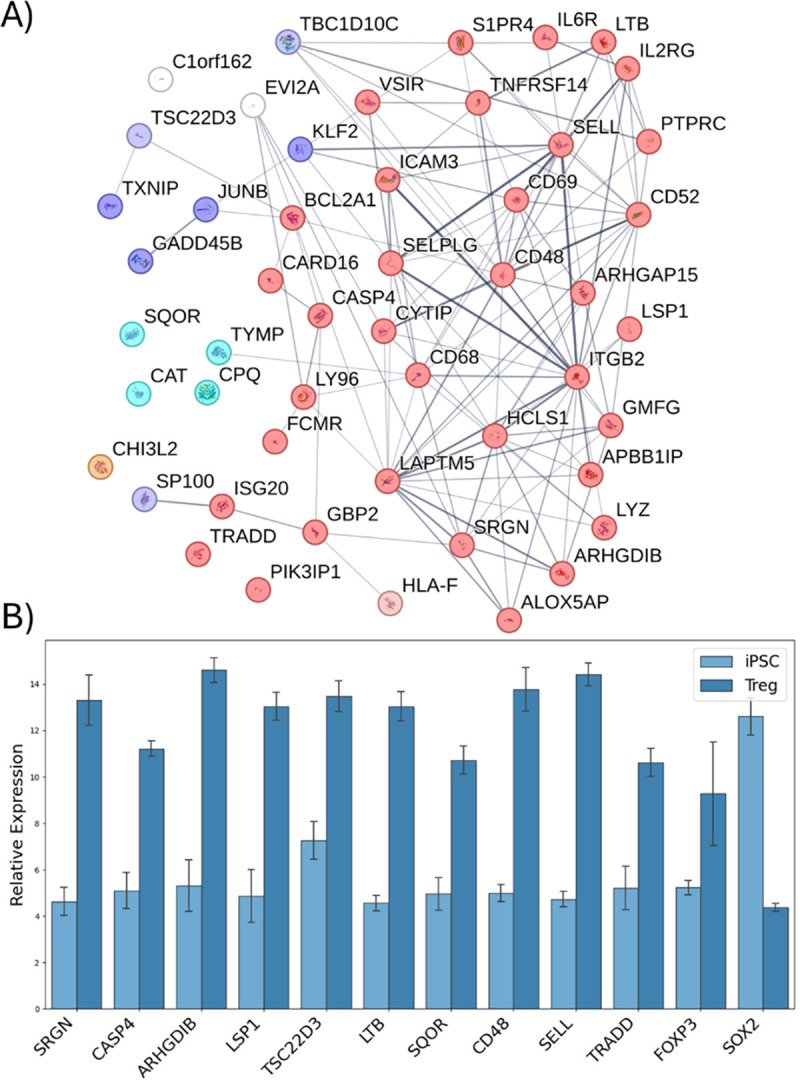
Assessment of model predictions for the optimal CRISPRa targets to drive Treg differentiation from iPSCs. A) STRING analysis of the top 50 ranked genes reveals a highly connected network of surface receptors and immunomodulatory genes predicted to strongly encourage iPSCs to commit to the Treg differentiation. The encoded proteins are associated with many pathways including immunomodulation (red), growth and differentiation (green), ECM composition (orange), cell structure (yellow), signal transduction (dark blue), transcription factors (light blue), and metabolism (teal). B) All gene targets identified by CRISPR-GEM are highly upregulated in Treg cells, most were more confidently upregulated than FOXP3, the genetic signature specific to Treg cells. Expression of SOX2, a pluripotency factor, is also given as a reference for iPSC function.
Table 3.
Top scoring CRISPR candidates for CRISPRa induced Treg differentiation of iPSCs.
| Rank | CRISPR Candidate | Description | Reference(s) |
|---|---|---|---|
| 1 | SRGN | Encodes for serglycin, a proteoglycan and core marker for Tregs. It is universally upregulated in Tregs with strong positive correlation to basic leucine zipper ATF-like transcription factor (BATF), a recognized Treg transcription factor. | 43,44 |
| 2 | CASP4 | Encodes for caspase 4. Upregulated during T-cell activation during a treatment for graft-versus-host disease. | 49 |
| 3 | ARHGDIB | Encodes for rho GDP dissociation inhibitor beta. Identified as an important regulator of T-cell activation. Inhibits Rho kinase resulting in greater Treg/Th17 ratio. | 51,52 |
| 4 | LSP1 | Encodes for lymphocyte specific protein. Prompts the infiltration of regulatory T cells. Overexpression enhances expression of immunosuppressive genes. Deficiency is associated with rheumatoid arthritis. | 53,54 |
| 5 | TSC22D3 | Encodes for glucocorticoid-induced leucine zipper (GLIZ). Enhances Treg production by upregulating FOXP3 via TGF-β and SMAD signaling pathways. | 48 |
| 6 | LTB | Encodes for lymphotoxin beta (LT-β). It guides Treg migration and stability when bound to LT-α. | 55,56 |
| 7 | SQOR | Encodes for sulfide quinone oxidoreductase (SQOR). Uncharacterized in regulatory T-cells. | |
| 8 | CD48 | Encodes for CD48 which protects early effector T cells both by promoting autophagy and upregulation of pro-survival genes such as BATF. | 45 |
| 9 | SELL | Encodes for L-selectin (CD62). Tregs expressing L-selectin have superior immunosuppressive capacity roles in different diseases. | 49,50 |
| 10 | TRADD | Encodes for tumor necrosis factor receptor type 1-associated death domain protein. This protein is responsible for recruiting TRAF2, a gene that is upregulated during Treg infiltration. | 57,58 |
Besides these FOXP3 modulators, ARHGDIB, LY96, and LSP1 serve as immunomodulatory genes that regulate inflammatory environments. ARHGDIB is an important regulator of T-cell activation that inhibits Rho kinase causing higher proportions of Treg compared to Th17 T-cells51,52. TRADD participates in TNF signaling pathways and binds TRAF2 which aids in T-cell differentiation and signaling57,58. Finally, LSP1 is a lymphocyte specific protein that prompts T-cell infiltration to suppress local inflammation53,54. The close association with the function of these genes and Tregs suggests that they could also impact T-cell differentiation and Treg activity.
3.3. Model Validation: Identifying CRISPRa Target Genes for Enhanced MSC Chondrogenesis:
Degenerative and traumatic injuries to cartilage tissues have limited healing capacity due to a lack of vasculature and innervation which drives long-term pain and debilitation in many patients59. MSCs have emerged as a promising cell source to facilitate cartilage regeneration due to their accessibility, in vitro proliferative capacity, multipotency, and immunomodulatory properties60. The chondrogenic differentiation of MSCs is achieved by administering supraphysiological levels of growth factors such as transforming growth factor beta 3 (TGF-β3) or overexpressing transgenes60–62. However, these methods often result in phenotype instability and limited chondrogenic capacity in vivo. To address this, CRISPRa has been explored to upregulate specific genes that are associated with MSC chondrogenesis or chondrogenic ECM deposition to enhance this lineage commitment3,63,64. These strategies increased collagen type II deposition but led to incomplete chondrogenesis or had non-specific effects. For example, COL2A1 upregulation induced DEGs associated with ECM remodeling but also endoplasmic reticulum stress and IREF1-mediated unfolded protein response3,63. Therefore, we implemented CRISPR-GEM to identify genetic targets for CRISPRa therapies and achieve mature chondrocyte gene expression patterns in MSCs.
We selected MSCs as the experimental group to be edited using CRISPRa and juvenile cartilage as the target group, representing healthy cartilage tissues. To further enhance model predictions, fetal chondrocytes were identified as an intermediate cell type representing developing cartilage. To illustrate the differences between each group, RNA-seq profiles are projected into a reduced dimension using UMAP revealing clear MSCs and cartilage clusters and distinct fetal and juvenile cartilage subpopulations (Fig. 4A). Input and output genes were selected by filtering DEGs between MSCs to fetal cartilage and MSCs to mature cartilage respectively. Highly upregulated DEGs included CNMD, UCMA, COL2A1, TGFB3, and SOX9 which are all strongly associated with cartilage tissues65,66. Neural network training across five replicates resulted in an average loss of 0.098 ± 0.018 and r2 of 0.952 ± 0.009 (p = 1.11 ∙ 10−16). (Fig. 4B and 4C). These results indicate that the DNN can predict over 96% of the variance amongst key MSC chondrogenic genes which can be visualized by the linear trend between actual and predicted gene expression in Fig. 4D. Following training, each CRISPR candidate gene in MSC RNA-seq datasets was perturbed using eq. 3 to mimic CRISPRa gene upregulation. The resulting model predictions were input into our scoring system to rank CRISPR candidate genes for their capacity to induce chondrogenesis.
Fig. 4.

Group selection and model training for MSC chondrogenic characterization. MSCs, fetal cartilage, and mature cartilage were selected for experimental, intermediate, and target groups respectively. A) UMAP analysis confirms the clustering of cartilage cells and MSCs with fetal and mature cartilage subpopulations, B) The neural network was then trained with mean squared error (MSE) as the loss function, C) the resulting model was able to predict over 95% of the variance in the expression of chondrogenic genes as demonstrated by r2, and D) The model resulted in a clear linear trend between actual and predicted expression values for each gene.
The top scoring gene candidates yield a semi-connected STRING protein association network across a wide range of functionalities pathways, most notably ECM regulation and immunomodulation. This diversity suggests the complicated combination of signals required for driving signals and the importance of selecting CRISPR target genes that can modulate each of these pathways through GRNs (Fig. 5A). BMP2, ranked sixth among all gene candidates, is highly connected within this network and is a potent inducer of MSC condensation, chondrogenic differentiation, chondrocyte proliferation and hypertrophic differentiation67,68. This result confirms the capacity of top scoring genes to influence GRNs and sustain a chondrogenic phenotype after activation. Further it demonstrates the importance of transient activation as modeled by CRISPR-GEM since sustained BMP2 upregulation will cause cartilage hypertrophy and osteogenesis.
Fig. 5.
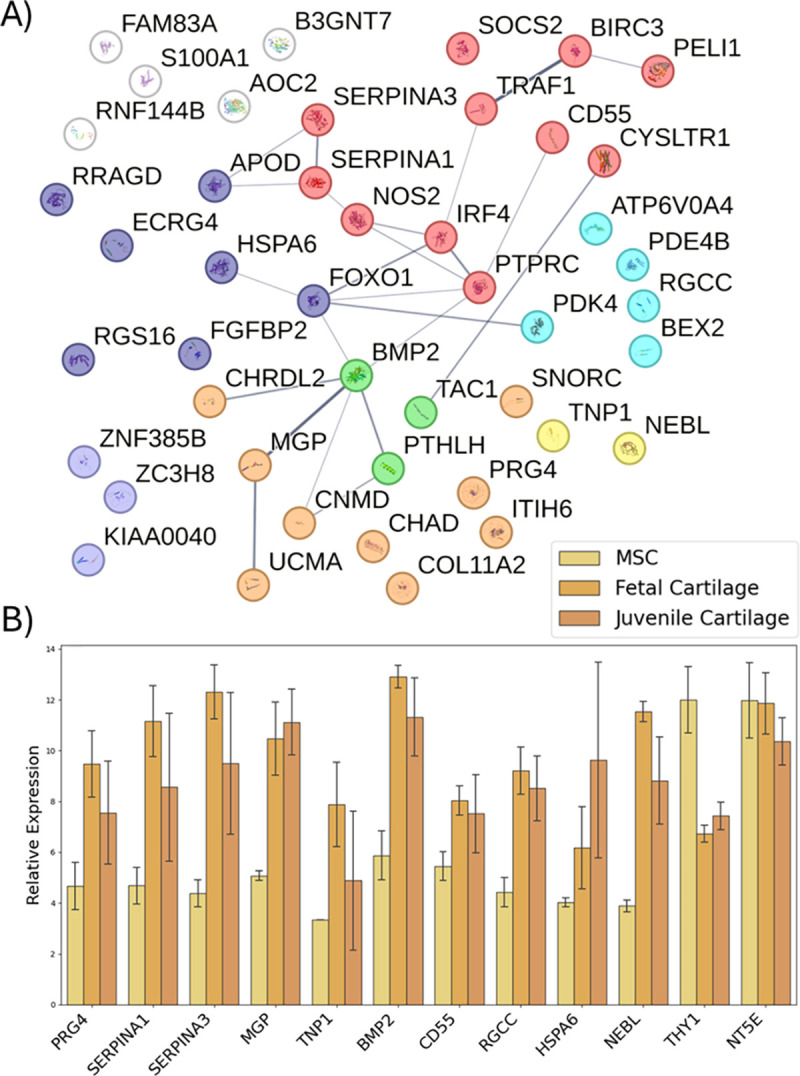
CRISPR-GEM results for CRISPRa induced chondrogenesis. A) STRING co-expression matrix for top scoring genes demonstrating the importance of ECM catabolism and immune regulation in the chondrogenic process. The encoded proteins are associated with many pathways including immunomodulation (red), growth and differentiation (green), ECM composition (orange), cell structure (yellow), signal transduction (dark blue), transcription factors (light blue), and metabolism (teal). B) All top scoring genes are significantly upregulated during the chondrogenic process. THY1 and NT5E, two MSC surface receptors, demonstrate the shift from progenitor cells to chondrocytes.
The remaining top ten genes also hold great potential for MSC chondrogenesis (Table 4, Fig. 5B). The top scoring PRG4 encodes lubricin, a cartilage-specific glycoprotein that is necessary for regulating the surface active mucosal layer and chondroprotection69–72. Lubricin blocks cell adhesion and therefore could alter MSC microenvironments and stimulate cellular pathways to motivate chondrogenic differentiation. Interestingly, SERPINA1 and SERPINA3 inhibit the serine proteases elastase and cathepsin G respectively which both cleave lubricin and other important ECM components while mediating pro-inflammatory signaling73. SERPINA1 and SERPINA3 are also known chondrogenic markers suggesting that our top 3 gene candidates collaborate to establish a lubricin-based pro-chondrogenic matrix within MSC cultures77–79.
Table 4.
Top scoring CRISPR candidates for chondrogenic differentiation of MSCs.
| Rank | CRISPR Candidate | Description | Reference(s) |
|---|---|---|---|
| 1 | PRG4 | Encodes for lubricin, a superficial cartilage ECM proteoglycan responsible for maintaining and protecting cartilage and joint lubrication. | 70–72 |
| 2 | SERPINA1 | Encodes for α-1-antitrypsin (AAT), a proteinase inhibitor that blocks matrix degradation by reducing inflammation and promoting cartilage anabolism. SERPINA1 expression is directly correlated to MSC chondrogenesis and intraperitoneal injection of SERPINA1 attenuated cartilage destruction in a mouse model. Alpha-1 antitrypsin; | 74–76 |
| 3 | SERPINA3 | Encodes for alpha-1 antichymotrypsin and has similar functions to SERPINA1. Specifically targets cathepsin G, a cartilage degradation protein associated with osteoarthritis. SERPINA3 is considered a chondrogenic differentiation marker and downregulates inflammatory responses. | 74,77,78 |
| 4 | MGP | Encodes for matrix gla protein. MGP is a chondrogenic marker in developing organisms. MGP also inhibits osteoblast mineralization and therefore endochondral ossification. | 79,80 |
| 5 | TNP1 | Encodes transmembrane nuclear protein. Plays a role in histone replacement during spermatid elongation. While uncharacterized for chondrogenesis its role in chromatin packing could activate transcriptomic pathways for chondrogenesis. | 81 |
| 6 | BMP2 | Encodes for bone morphogenic protein 2. Belongs to the TGF-β and promotes MSC condensation, chondrogenic differentiation, chondrocyte proliferation and differentiation. It is considered to have a greater chondrogenic potential than TGF-β genes. | 67,68 |
| 7 | CD55 | Encodes for complement decay-accelerating factor, a cell surface glycoprotein with chondroprotective properties. Has been highly upregulated during chondrogenesis. | 82,83 |
| 8 | RGCC | Encodes for regulator of cell cycle protein. Has been seen to be highly upregulated (over 40-fold) early on in differentiating cartilage. | 84–86 |
| 9 | HSPA6 | Encodes for heat shock protein family A (HSP70) member 6 which plays significant roles in chondrogenesis. HSPA6 specifically contributes to stress-protection and matrix production. | 87–90 |
| 10 | NEBL | Encodes for the nebulette protein. Primarily known for binding actin in muscle tissues; however, actin organization is an important step in chondrogenesis suggesting a potential role in driving a cartilage phenotype. | 91,92 |
In addition to the SERPINs, MGP and CD55 also protect cartilage matrix during chondrogenesis. MGP is a chondrogenic marker in developing organisms that also inhibits osteoblast mineralization and therapy protecting cartilage tissues from endochondral ossification79,80. CD55 is a cell surface glycoprotein that protects chondrocytes from immune degradation. The upregulation of these chondroprotective and immunomodulatory proteins could dysregulate cellular pathways that repress MSC chondrogenesis and represent a promising therapeutic strategy.
Beyond ECM and immune regulation, top scoring genes are also responsible for a range of other cell properties. HSPA6 encodes HSP70, a stress-response protein that is known known to play essential roles in chondrogenesis and chondroprotection and is an established marker for cartilage homeostasis90 93. RGCC is an important regulator of cell cycle that is highly upregulated during chondrogenesis and could encourage the metabolic changes that initiate the early stages of MSC differentiation 84–86. Finally, NEBL encodes the nebulette protein that is responsible for actin-binding in muscle cells but may contribute to the actin re-organization necessary for chondrogenic differentiation91,92.
Other notable high-scoring genes include UCMA, CNMD, and SNORC (ranked 13 and 14 and 22 respectively) encode cartilage specific proteins that comprise or regulate matrix production and control chondrocyte differentiation. UCMA interacts with collagens, inhibits aggrecanases, and protects cartilage to promote chondrogenesis69,94. CNMD stimulates chondrocyte growth while inhibiting angiogenesis to promote a sustained chondrocyte phenotype95,96. Finally, SNORC encodes for small novel rich in cartilage and is tightly controlled by SOX9 and is upregulated during chondrogenesis97.
In summary, CRISPR-GEM identified critical genes as the most promising CRISPR candidates to induce chondrogenesis of MSCs. Most of the top candidates have been reported to directly induce chondrogenic differentiation; however, the chondrogenic roles of other genes such as RGCC and NEBL remain to be fully characterized.
3.4. Model Validation: CRISPRi Target Selection for the Treatment of Osteoarthritis.
Osteoarthritis (OA) is the most prevalent musculoskeletal disorder and leading cause of disability globally98. It is characterized by the presence of inflammatory signals that trigger cartilage degradation leading to joint pain and weakness99. CRISPR strategies for inhibiting OA-specific inflammation and matrix degradation pathways hold great potential for reversing the effects of osteoarthritis and restoring healthy cartilage. For example, CRISPRko of matrix metalloproteinase 13 (MMP13) and interleukin-1β (IL1B) genes has been reported to attenuate cartilage degradation. Alternatively, CRISPR has been used to alleviate OA induced pain through the knock-out nerve growth factor (NGF)100. Despite this promise, gene knock-out causes irreversible changes to the transcriptome and may have negative long-term impacts. Instead, CRISPRi based inhibition is more favorable for guiding cartilage tissues back to a healthy phenotype in a safe yet effective manner. Farhang et al. successfully suppressed immune response using CRISPRi to down-regulate tumor necrosis factor receptor 1 (TNFR1) and interleukin 1 receptor like 1 (IL1R1) expression; however, downregulating these genes failed to eliminate OA induced inflammation as seen by insufficient reduction in IL1B inflammatory pathways101. Therefore, we sought address the need for more well-informed target gene selection by identifying novel CRISPRi gene targets for reversing OA disease progression.
To accomplish this, osteoarthritic cartilage was compared to healthy cartilage as the experimental and target groups respectively. UMAP clustering reveals distinct clusters for each group revealing evident phenotypic differences in OA cartilage (Fig. 6A). The neural network for OA genes was able to attain an MSE of 0.088 ± 0.0021 (Fig. 6B) and an r2 of 0.943 ± 0.001 (p = 1.11 ∙ 10−16). (Fig. 6C) on testing data as visualized by the linear trend between predicted and actual expression values (Fig 6D).
Fig. 6.

Group selection and model training for the reversal of OA using CRISPRi. Osteoarthritic and healthy cartilage tissues were selected as the experimental and target groups respectively. A) UMAP clustering confirms the substantial variance between diseased and healthy cartilage, B) Neural network training resulted in a mean squared error (MSE) of 0.088 ± 0.0021 while predicting output gene expression, C) prompting an r2 of 0.943 ± 0.001, and D) The model resulted in a clear linear trend between actual and predicted expression values for each gene.
The top scoring genes reveal a tightly connected ECM and immunomodulatory STRING network with interactions from a range of other cell processes (Fig. 7A). This network highlights the importance of matrix dysregulation in OA progression suggesting that inhibiting pro-fibrotic genes is an important therapeutic approach for attenuating OA. This observation correlates to FAP ranking as the top scoring CRISPRi candidate (Table 5, Supp. Table 13, Fig. 7B). FAP is an established biomarker and in vitro model for OA due to its role in ECM dysregulation through degrading denatured and MMP-13 cleaved type II collagen102–104. MMP13, an OA associated matrix metalloprotease, also ranks highly (33) amongst candidate genes due to its role in degrading types II, IV, and IX collagen, proteoglycans, osteonectin and perlecan105. In addition to ECM decomposition, both COL1A1 and COL1A2 rank in the top 5 CRISPRi target genes. This suggests that the overproduction of type I collagen might cause fibrocartilage formation and therefore the loss of cartilage mechanical properties, contributing to pain and inflammation106. Another ECM-related gene ranked by CRISPR-GEM is SPP1 (encoding for osteopontin), which is linked to matrix mineralization and therefore stiffening of cartilage tissues107,108. CRISPR-GEM clearly identified matrix dysregulation through the breakdown of healthy ECM and remodeling with inferior components as a crucial CRISPRi target.
Fig. 7.
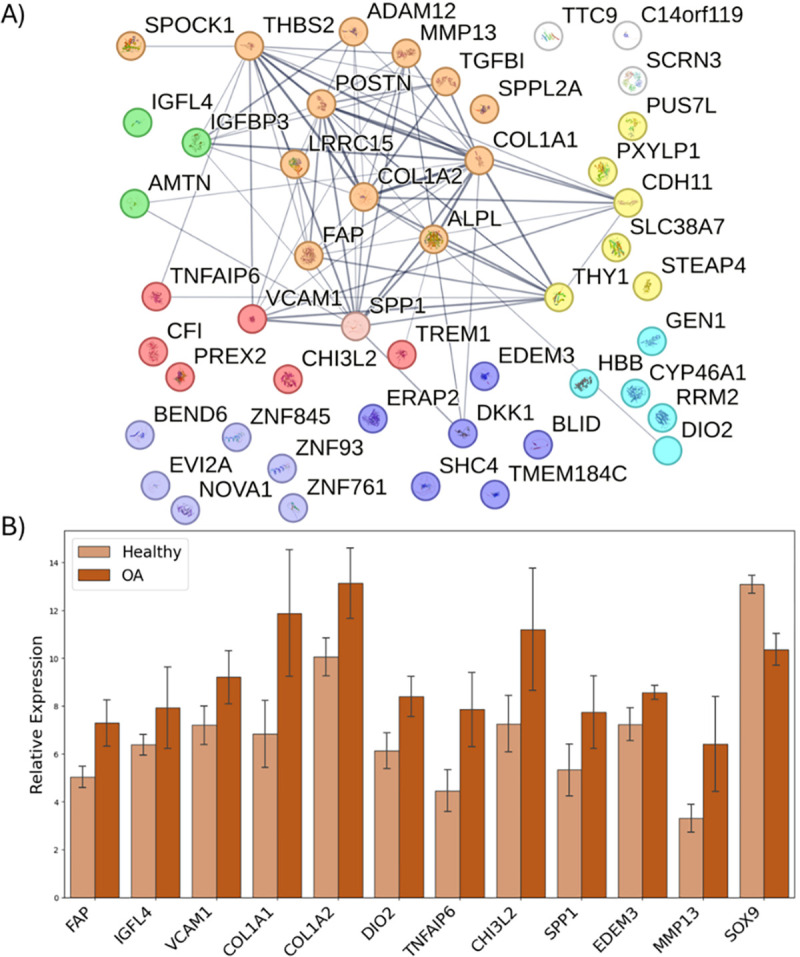
Visualizing the results for the top ranking CRISPRi targets to prevent OA. A) STRING co-expression matrix for top scoring genes shows a large network containing proteins involved in fibrosis, ECM catabolism, and immune regulation implicating these processes in OA. The encoded proteins are associated with many pathways including immunomodulation (red), growth and differentiation (green), ECM composition (orange), cell structure (yellow), signal transduction (dark blue), transcription factors (light blue), and metabolism (teal). B) The top ten scoring genes given by CRISPR-GEM are all upregulated during OA progression. These results positively correlated with MMP13 expression, a key OA marker; but they negatively correlated to the pro-regenerative, anti-inflammatory SOX9.
Table 5.
Top scoring CRISPR candidates for reversing OA.
| Rank | CRISPR Candidate | Description | Reference |
|---|---|---|---|
| 1 | FAP | Encodes for fibroblast activation protein (FAP) which collagen type II. A key genetic factor in OA that had been used to experimentally model OA. Inhibition of FAP ameliorates OA. | 102–104 |
| 2 | IGFL4 | Encodes for insulin-like growth factor 4 (IGFL-4). Its role in OA and cartilage is uncharacterized. | 109 |
| 3 | VCAM1 | Encodes for vascular cell adhesion molecule 1 (VCAM1) is upregulated during OA progression and provides adhesion sites for monocytes causing an influx of inflammatory signals further progressing OA. | 110–112 |
| 4 | COL1A1 | Encodes for collagen type I which is a marker for fibrocartilage formation and its presence has been implicated as an early marker for osteoarthritis. | 106 |
| 5 | COL1A2 | See COL1A1 | |
| 6 | DIO2 | Encodes iodothyronine deiodinase 2 (DIO2), an enzyme that intracellularly activates thyroid hormone causing pro-inflammatory responses. Inhibition of DIO2 alleviates inflammatory systems in mice while overexpression causes immediate osteoarthritic symptoms. | 113,114 |
| 7 | TNFAIP6 | Encodes for tumor necrosis factor alpha-induced protein 6 (TNFAIP6) which is highly regulated during osteoarthritis. It modulates macrophage phenotype and plays important roles in ECM remodeling, leukocyte migration and cell proliferation. | 115–117 |
| 8 | CHI3L2 | Encodes for chitinase-3 like-protein-1, a growth and differentiation factor involved in cartilage homeostasis and a recognized biomarker for osteoarthritis. Highly expressed in earlier phases of degeneration. Chemotactic factor for monocytes and stimulates angiogenesis. | 118,119 |
| 9 | SPP1 | Encodes for osteopontin, a phosphoprotein found in mineralized tissues and around inflammation sites involved in the cartilage to bone transition. Expression significantly correlates with disease severity. | 107,108 |
| 10 | EDEM3 | Encodes for ER Degradation Enhancing Alpha-Mannosidase Like Protein 3. It is involved in endoplasmic reticulum stress and the degradation of misfolded glycoproteins. | 120,121 |
Immune-induced vascularization is another key driver of OA pathogenesis that CRISPR-GEM has identified. The chitinase-3 like-protein-1 protein encoded by CHI3L2 is an established chemotactic factor for the recruitment of monocytes and a driver of angiogenesis. CHI3L2 could therefore help to initiate the progressive inflammatory immune response responsible for OA118,119. Vascular cell adhesion molecule 1 (VCAM1) is another pro-angiogenic gene that provides adhesion sites for infiltrating monocytes therefore providing the means for the progressive worsening of inflammatory immune responses in cartilage tissues110–112. Macrophage infiltration and phenotype is also modulated by TNFAIP6, a member of the tumor necrosis factor family that is induced by IL-1β and TNF-α to facilitate ECM degradation and remodeling115–117. The inflammatory signals of VCAM1 and TNFAIP6 may also be amplified by DIO2 which intracellularly activates thyroid hormone causing inflammation in osteoarthritic patients113,114.
In addition to ECM dysregulation and immune response EDEM3, and IGFL4 were identified as gene targets to prevent OA. EDEM3 is responsible for degrading misfolded glycoproteins in the endoplasmic reticulum and is upregulated during OA120,121. Further study should be conducted to determine if this EDEM3 upregulation causes abnormal degradation of functional glycoproteins. IGFL4 is member of the insulin growth factor-like family that is yet to be characterized for its role in OA109. EDEM3 and IGFL4 serve as novel gene targets for OA prevention that must be evaluated.
Conclusion:
We have developed CRISPR-GEM, a tunable ML algorithm for the evaluation and discovery of CRISPR gene targets in a wide range of biomedical applications, from cell-specific differentiation to whole tissue disorders. This model uses differential expression to filter potential gene candidates for a desired application, then uses the selected genes to train an MLP that serves as a surrogate GRN for the specified tissue type. This neural network is subsequently utilized to assess the effects of CRISPR-mimetic perturbations to RNA-seq data and their capacity for inducing the desired cell phenotype.
To validate this machine learning model, we have applied it to identify CRISPRa gene targets for iPSC differentiation to Treg cells and the chondrogenic differentiation of MSCs, as well as the use of CRISPRi as a treatment for OA. In each application, CRISPR-GEM successfully identified both established and novel genes. All identified genes hold the potential to have a profound therapeutic impact for the given application and must be validated experimentally. Interrogation of these targets through in vitro CRISPR screens should be conducted to confirm the changes in gene expression predicted by CRISPR-GEM and evaluate therapeutic potential.
Modeling CRISPR target genes with CRISPR-GEM requires multiple assumptions: (1) Input and output gene feature selection is performed by filtering DEGs to eliminate unplausible gene candidates. This approach improves DNN accuracy by reducing noise, but it requires the assumption that genes following atypical expression patterns will not outperform the genes that positively correlate with the selected CRISPR editing strategy. Since CRISPR-GEM seeks to best recapitulate natural transcriptomic mechanisms this assumption helps reduce the risk of unintended downstream consequences by eliminating these unplausible gene candidates. (2) The selected genes are then utilized for MLP training to predict gene expression relationships and serve as a synthetic GRN. This MLP accurately predicts gene expression relationships without the need for detailed user input and therefore reduces bias and improves model accuracy compared to alternative techniques such as SVR or GNN. However, gene expression does not necessarily correlate to protein translation or post-translational modification122. The development of a model that explicitly accounts for all regulatory effects would require the input of multiple high-dimensional data types which complicates ML approaches and adds noise. Instead, CRISPR-GEM is built as a black box model to indirectly account for the effects of these regulatory mechanisms on the transcriptome. Therefore, this model assumes that the neural network is learning these relationships. (3) An additional limitation is that our MLP learns the regulatory relationships in gene expression without a temporal component. Thus, it is assumed that sustained gene activation can be achieved in the laboratory to accomplish the same transcriptomic impacts represented in CRISPR-GEM. Future work should consider collecting large datasets on the temporal development of primary tissues. This could be applied to training RNNs to explain the temporal aspects of tissue development or disease progression more definitively123.
In conclusion, CRISPR-GEM stands as the first ML based model for predicting optimal CRISPR target genes. We have tested this model in cell-specific differentiation and whole tissue disorders, demonstrating its potential for its application to a wide range of biomedical applications. Ultimately, this model will improve the efficacy and precision of CRISPR gene editing strategies.
Supplementary Material
Acknowledgements:
Tomas Gonzalez-Fernandez would like to acknowledge the start-up funds provided by the Department of Bioengineering and the P.C. Rossin College of Engineering & Applied Science at Lehigh University, the Orthoregeneration Network (ON) Kick Starter grant, and the Career Development Award from the American Society of Gene & Cell Therapy. The content is solely the responsibility of the authors and does not necessarily represent the official views of the American Society of Gene & Cell Therapy. Joshua P. Graham would like to acknowledge the support provided through the National Science Foundation Graduate Research Fellowship under Grant No #2234658. Lifang He’s research was partially supported by the NIH under grant R21EY034179, and the NSF through grants IIS-2319451 and MRI-2215789. Lifang He and Yu Zhang would like to acknowledge the support from the Lehigh University’s Accelerator and CORE grants.
REFERENCES
- 1.Jinek M. et al. A Programmable Dual-RNA–Guided DNA Endonuclease in Adaptive Bacterial Immunity. Science 337, 816–821 (2012). [DOI] [PMC free article] [PubMed] [Google Scholar]
- 2.Graham J., Werba L., Federico I. & Gonzalez-Fernandez T. CRISPR Strategies for Stem Cell Engineering: A New Frontier in Musculoskeletal Regeneration. Eur. Cell. Mater. 46, 91–118 (2023). [Google Scholar]
- 3.Farhang N. et al. Synergistic CRISPRa-Regulated Chondrogenic Extracellular Matrix Deposition Without Exogenous Growth Factors. Tissue Eng. Part A 26, 1169–1179 (2020). [DOI] [PMC free article] [PubMed] [Google Scholar]
- 4.Yoshikawa T. et al. Genetic Ablation of PRDM1 in Antitumor T Cells Enhances Therapeutic Efficacy of Adoptive Immunotherapy. Blood 139, 2156–2172 (2022). [DOI] [PubMed] [Google Scholar]
- 5.Langfelder P. & Horvath S. WGCNA: An R Package for Weighted Correlation Network Analysis. BMC Bioinformatics 9, 559 (2008). [DOI] [PMC free article] [PubMed] [Google Scholar]
- 6.van der Wijst M. G. P., de Vries D. H., Brugge H., Westra H.-J. & Franke L. An Integrative Approach for Building Personalized Gene Regulatory Networks for Precision Medicine. Genome Med. 10, 96 (2018). [DOI] [PMC free article] [PubMed] [Google Scholar]
- 7.Papili Gao N., Ud-Dean S. M. M., Gandrillon O. & Gunawan R. SINCERITIES: Inferring Gene Regulatory Networks from Time-Stamped Single Cell Transcriptional Expression Profiles. Bioinformatics 34, 258–266 (2018). [DOI] [PMC free article] [PubMed] [Google Scholar]
- 8.Moerman T. et al. GRNBoost2 and Arboreto: Efficient and Scalable Inference of Gene Regulatory Networks. Bioinformatics 35, 2159–2161 (2019). [DOI] [PubMed] [Google Scholar]
- 9.Huynh-Thu V. A., Irrthum A., Wehenkel L. & Geurts P. Inferring Regulatory Networks from Expression Data Using Tree-Based Methods. PLOS ONE 5, e12776 (2010). [DOI] [PMC free article] [PubMed] [Google Scholar]
- 10.Chan T. E., Stumpf M. P. H. & Babtie A. C. Gene Regulatory Network Inference from Single-Cell Data Using Multivariate Information Measures. Cell Syst. 5, 251–267.e3 (2017). [DOI] [PMC free article] [PubMed] [Google Scholar]
- 11.Margolin A. A. et al. ARACNE: An Algorithm for the Reconstruction of Gene Regulatory Networks in a Mammalian Cellular Context. BMC Bioinformatics 7, S7 (2006). [DOI] [PMC free article] [PubMed] [Google Scholar]
- 12.Keenan A. B. et al. ChEA3: Transcription Factor Enrichment Analysis by Orthogonal Omics Integration. Nucleic Acids Res. 47, W212–W224 (2019). [DOI] [PMC free article] [PubMed] [Google Scholar]
- 13.Matsumoto H. et al. SCODE: An Efficient Regulatory Network Inference Algorithm from Single-Cell RNA-Seq During Differentiation. Bioinformatics 33, 2314–2321 (2017). [DOI] [PMC free article] [PubMed] [Google Scholar]
- 14.Kamimoto K. et al. Dissecting cell identity via network inference and in silico gene perturbation. Nature 614, 742–751 (2023). [DOI] [PMC free article] [PubMed] [Google Scholar]
- 15.Okawa S., Nicklas S., Zickenrott S., Schwamborn J. C. & del Sol A. A Generalized Gene-Regulatory Network Model of Stem Cell Differentiation for Predicting Lineage Specifiers. Stem Cell Rep. 7, 307–315 (2016). [DOI] [PMC free article] [PubMed] [Google Scholar]
- 16.Bravo González-Blas C. et al. SCENIC+: Single-Cell Multiomic Inference of Enhancers and Gene Regulatory Networks. Nat. Methods 20, 1355–1367 (2023). [DOI] [PMC free article] [PubMed] [Google Scholar]
- 17.Shu H. et al. Modeling Gene Regulatory Networks using Neural Network Architectures. Nat. Comput. Sci. 1, 491–501 (2021). [DOI] [PubMed] [Google Scholar]
- 18.Magnusson R., Tegnér J. N. & Gustafsson M. Deep Neural Network Prediction of Genome-Wide Transcriptome Signatures – Beyond the Black-Box. NPJ Syst. Biol. Appl. 8, 9 (2022). [DOI] [PMC free article] [PubMed] [Google Scholar]
- 19.Li S. et al. GMFGRN: A Matrix Factorization and Graph Neural Network Approach for Gene Regulatory Network Inference. Brief. Bioinform. 25, bbad529 (2024). [DOI] [PMC free article] [PubMed] [Google Scholar]
- 20.Wu Z. & Sinha S. SPREd: A Simulation-Supervised Neural Network Tool for Gene Regulatory Network Reconstruction. Bioinforma. Adv. 4, vbae011 (2024). [DOI] [PMC free article] [PubMed] [Google Scholar]
- 21.Wang Y. et al. scGREAT: Transformer-Based Deep-Language Model for Gene Regulatory Network Inference from Single-Cell Transcriptomics. iScience 27, 109352 (2024). [DOI] [PMC free article] [PubMed] [Google Scholar]
- 22.Leinonen R., Sugawara H. & Shumway M. The Sequence Read Archive. Nucleic Acids Res. 39, D19–D21 (2011). [DOI] [PMC free article] [PubMed] [Google Scholar]
- 23.Bray N. L., Pimentel H., Melsted P. & Pachter L. Near-Optimal Probabilistic RNA-Seq Quantification. Nat. Biotechnol. 34, 525–527 (2016). [DOI] [PubMed] [Google Scholar]
- 24.Martin F. J. et al. Ensembl 2023. Nucleic Acids Res. 51, D933–D941 (2023). [DOI] [PMC free article] [PubMed] [Google Scholar]
- 25.Muzellec B., Telenczuk M., Cabeli V. & Andreux M. PyDESeq2: A Python Package for Bulk RNA-Seq Dierential Expression Analysis. [DOI] [PMC free article] [PubMed]
- 26.McInnes L., Healy J., Saul N. & Großberger L. UMAP: Uniform Manifold Approximation and Projection. J. Open Source Softw. 3, 861 (2018). [Google Scholar]
- 27.Pedregosa F. et al. Scikit-learn: Machine Learning in Python. J. Mach. Learn. Res. 12, 2825–2830 (2011). [Google Scholar]
- 28.Chollet F. et al. Keras. GitHub (2015). Available at: https://github.com/fchollet/keras. [Google Scholar]
- 29.Abadi M. et al. TensorFlow: A System for Large-Scale Machine Learning.
- 30.Villar D. et al. Enhancer Evolution across 20 Mammalian Species. Cell 160, 554–566 (2015). [DOI] [PMC free article] [PubMed] [Google Scholar]
- 31.Fontana J. et al. Effective CRISPRa-Mediated Control of Gene Expression in Bacteria must Overcome Strict Target Site Requirements. Nat. Commun. 11, 1618 (2020). [DOI] [PMC free article] [PubMed] [Google Scholar]
- 32.Chavez A. et al. Highly Efficient Cas9-Mediated Transcriptional Programming. Nat. Methods 12, 326–328 (2015). [DOI] [PMC free article] [PubMed] [Google Scholar]
- 33.Szklarczyk D. et al. Foxp3. Nucleic Acids Res. 47, D607–D613 (2019). [DOI] [PMC free article] [PubMed] [Google Scholar]
- 34.Fontenot J. D., Gavin M. A. & Rudensky A. Y. Foxp3 Programs the Development and Function of CD4+CD25+ Regulatory T Cells. Nat. Immunol. 4, 330–336 (2003). [DOI] [PubMed] [Google Scholar]
- 35.Li M. et al. The Immune Microenvironment in Cartilage Injury and Repair. Acta Biomater. 140, 23–42 (2022). [DOI] [PubMed] [Google Scholar]
- 36.Wang L. et al. Treg-Targeted Efficient-Inducible Platform for Collagen-Induced Arthritis Treatment. Mater. Today Bio 19, 100557 (2023). [DOI] [PMC free article] [PubMed] [Google Scholar]
- 37.Chemin K., Gerstner C. & Malmström V. Effector Functions of CD4+ T Cells at the Site of Local Autoimmune Inflammation—Lessons From Rheumatoid Arthritis. Front. Immunol. 10, (2019). [DOI] [PMC free article] [PubMed] [Google Scholar]
- 38.Haque M. et al. Stem Cell-Derived Tissue-Associated Regulatory T Cells Ameliorate the Development of Autoimmunity. Sci. Rep. 6, 20588 (2016). [DOI] [PMC free article] [PubMed] [Google Scholar]
- 39.Boardman D. A. et al. Flagellin-Specific Human CAR Tregs for Immune Regulation in IBD. J. Autoimmun. 134, 102961 (2023). [DOI] [PMC free article] [PubMed] [Google Scholar]
- 40.Haque M. et al. Stem Cell–Derived Tissue-Associated Regulatory T Cells Suppress the Activity of Pathogenic Cells in Autoimmune Diabetes. JCI Insight 4, (2019). [DOI] [PMC free article] [PubMed] [Google Scholar]
- 41.Koizumi S. et al. JunB regulates homeostasis and suppressive functions of effector regulatory T cells. Nat. Commun. 9, 5344 (2018). [DOI] [PMC free article] [PubMed] [Google Scholar]
- 42.Pabbisetty S. K. et al. KLF2 is a Rate-Limiting Transcription Factor that can be Targeted to Enhance Regulatory T-cell Production. Proc. Natl. Acad. Sci. U. S. A. 111, 9579–9584 (2014). [DOI] [PMC free article] [PubMed] [Google Scholar]
- 43.Delacher M. et al. Precursors for Nonlymphoid-Tissue Treg Cells Reside in Secondary Lymphoid Organs and Are Programmed by the Transcription Factor BATF. Immunity 52, 295–312.e11 (2020). [DOI] [PMC free article] [PubMed] [Google Scholar]
- 44.Mijnheer G. et al. Conserved Human Effector Treg Cell Transcriptomic and Epigenetic Signature in Arthritic Joint Inflammation. Nat. Commun. 12, 2710 (2021). [DOI] [PMC free article] [PubMed] [Google Scholar]
- 45.Voss K. et al. FOXP3, CD48 and Autophagy Confer the Protection of CD4 and CD8 Human T Cells from T Cell Receptor Restimulation-Induced Cell Death. J. Immunol. 202, 184.5 (2019). [Google Scholar]
- 46.Khatun A. et al. BATF is Required for Treg Homeostasis and Stability to Prevent Autoimmune Pathology. Adv. Sci. Weinh. Baden-Wurtt. Ger. 10, e2206692 (2023). [DOI] [PMC free article] [PubMed] [Google Scholar]
- 47.Piao W. et al. Regulatory T Cells Condition Lymphatic Endothelia for Enhanced Transendothelial Migration. Cell Rep. 30, 1052–1062.e5 (2020). [DOI] [PMC free article] [PubMed] [Google Scholar]
- 48.Bereshchenko O. et al. GILZ Promotes Production of Peripherally Induced Treg Cells and Mediates the Crosstalk between Glucocorticoids and TGF-β Signaling. Cell Rep. 7, 464–475 (2014). [DOI] [PubMed] [Google Scholar]
- 49.Ermann J. et al. Only the CD62L+ Subpopulation of CD4+CD25+ Regulatory T Cells Protects from Lethal Acute GVHD. Blood 105, 2220–2226 (2005). [DOI] [PubMed] [Google Scholar]
- 50.Fu S. et al. CD4+ CD25+ CD62+ T-Regulatory Cell Subset Has Optimal Suppressive and Proliferative Potential. Am. J. Transplant. 4, 65–78 (2004). [DOI] [PubMed] [Google Scholar]
- 51.Chen Y.-G. et al. Molecular Signatures Differentiate Immune States in Type 1 Diabetic Families. Diabetes 63, 3960–3973 (2014). [DOI] [PMC free article] [PubMed] [Google Scholar]
- 52.Zanin-Zhorov A. et al. Selective Oral ROCK2 Inhibitor Down-Regulates IL-21 and IL-17 Secretion in Human T Cells via STAT3-Dependent Mechanism. Proc. Natl. Acad. Sci. 111, 16814–16819 (2014). [DOI] [PMC free article] [PubMed] [Google Scholar]
- 53.Cao J.-Y. et al. Elevated Lymphocyte Specific Protein 1 Expression is Involved in the Regulation of Leukocyte Migration and Immunosuppressive Microenvironment in Glioblastoma. Aging 12, 1656–1684 (2020). [DOI] [PMC free article] [PubMed] [Google Scholar]
- 54.Hwang S.-H. et al. Leukocyte-Specific Protein 1 Regulates T-Cell Migration in Rheumatoid Arthritis. Proc. Natl. Acad. Sci. 112, E6535–E6543 (2015). [DOI] [PMC free article] [PubMed] [Google Scholar]
- 55.Saxena V. et al. Treg Tissue Stability Depends on Lymphotoxin Beta-Receptor- and Adenosine-Receptor-Driven Lymphatic Endothelial Cell Responses. Cell Rep. 39, (2022). [DOI] [PMC free article] [PubMed] [Google Scholar]
- 56.Brinkman C. C. et al. Treg Engage Lymphotoxin Beta Receptor for Afferent Lymphatic Transendothelial Migration. Nat. Commun. 7, 12021 (2016). [DOI] [PMC free article] [PubMed] [Google Scholar]
- 57.Okubo Y., Mera T., Wang L. & Faustman D. L. Homogeneous Expansion of Human T-Regulatory Cells Via Tumor Necrosis Factor Receptor 2. Sci. Rep. 3, 3153 (2013). [DOI] [PMC free article] [PubMed] [Google Scholar]
- 58.Chen Y. et al. Roles of the adaptor protein tumor necrosis factor receptor type 1-associated death domain protein (TRADD) in human diseases. Biomed. Pharmacother. 153, 113467 (2022). [DOI] [PubMed] [Google Scholar]
- 59.Pufe T. et al. Endostatin/Collagen XVIII—An Inhibitor of Angiogenesis—is Expressed in Cartilage and Fibrocartilage. Matrix Biol. 23, 267–276 (2004). [DOI] [PubMed] [Google Scholar]
- 60.Gonzalez-Fernandez T., Tierney E. G., Cunniffe G. M., O’Brien F. J. & Kelly D. J. Gene Delivery of TGF-β3 and BMP2 in an MSC-Laden Alginate Hydrogel for Articular Cartilage and Endochondral Bone Tissue Engineering. Tissue Eng. Part A 22, 776–787 (2016). [DOI] [PubMed] [Google Scholar]
- 61.Gonzalez-Fernandez T. et al. Mesenchymal Stem Cell Fate Following Non-Viral Gene Transfection Strongly Depends on the Choice of Delivery Vector. Acta Biomater. 55, 226–238 (2017). [DOI] [PubMed] [Google Scholar]
- 62.Johnstone B., Hering T. M., Caplan A. I., Goldberg V. M. & Yoo J. U. In Vitro Chondrogenesis of Bone Marrow-Derived Mesenchymal Progenitor Cells. Exp. Cell Res. 238, 265–272 (1998). [DOI] [PubMed] [Google Scholar]
- 63.Huynh N. P. et al. Long Non-Coding RNA GRASLND Enhances Chondrogenesis via Suppression of the Interferon Type II Signaling Pathway. eLife 9, e49558. [DOI] [PMC free article] [PubMed] [Google Scholar]
- 64.Truong V. A. et al. CRISPRai for Simultaneous Gene Activation and Inhibition to Promote Stem Cell Chondrogenesis and Calvarial Bone Regeneration. Nucleic Acids Res. 47, e74 (2019). [DOI] [PMC free article] [PubMed] [Google Scholar]
- 65.Wu M., Wu S., Chen W. & Li Y.-P. The Roles and Regulatory Mechanisms of TGF-β and BMP Signaling in Bone and Cartilage Development, Homeostasis and Disease. Cell Res. 34, 101–123 (2024). [DOI] [PMC free article] [PubMed] [Google Scholar]
- 66.Klinger P. et al. Chondromodulin 1 Stabilizes the Chondrocyte Phenotype and Inhibits Endochondral Ossification of Porcine Cartilage Repair Tissue. Arthritis Rheum. 63, 2721–2731 (2011). [DOI] [PubMed] [Google Scholar]
- 67.Kurth T. et al. Chondrogenic Potential of Human Synovial Mesenchymal Stem Cells in Alginate. Osteoarthritis Cartilage 15, 1178–1189 (2007). [DOI] [PubMed] [Google Scholar]
- 68.Yoon B. S. & Lyons K. M. Multiple Functions of BMPs in Chondrogenesis. J. Cell. Biochem. 93, 93–103 (2004). [DOI] [PubMed] [Google Scholar]
- 69.Stock M. et al. A Dual Role of Upper Zone of Growth Plate and Cartilage Matrix–Associated Protein in Human and Mouse Osteoarthritic Cartilage: Inhibition of Aggrecanases and Promotion of Bone Turnover. Arthritis Rheumatol. 69, 1233–1245 (2017). [DOI] [PubMed] [Google Scholar]
- 70.Zappone B., Ruths M., Greene G. W., Jay G. D. & Israelachvili J. N. Adsorption, Lubrication, and Wear of Lubricin on Model Surfaces: Polymer Brush-Like Behavior of a Glycoprotein. Biophys. J. 92, 1693–1708 (2007). [DOI] [PMC free article] [PubMed] [Google Scholar]
- 71.Flowers S. A. et al. Lubricin Binds Cartilage Proteins, Cartilage Oligomeric Matrix Protein, Fibronectin and Collagen II at the Cartilage Surface. Sci. Rep. 7, 13149 (2017). [DOI] [PMC free article] [PubMed] [Google Scholar]
- 72.Ruan M. Z. C. et al. Proteoglycan 4 Expression Protects Against the Development of Osteoarthritis. Sci. Transl. Med. 5, 176ra34–176ra34 (2013). [DOI] [PMC free article] [PubMed] [Google Scholar]
- 73.Huang S. et al. Cathepsin g Degrades Both Glycosylated and Unglycosylated Regions of Lubricin, a Synovial Mucin. Sci. Rep. 10, 4215 (2020). [DOI] [PMC free article] [PubMed] [Google Scholar]
- 74.Boeuf S. et al. Subtractive Gene Expression Profiling of Articular Cartilage and Mesenchymal Stem Cells: Serpins as Cartilage-Relevant Differentiation Markers. Osteoarthritis Cartilage 16, 48–60 (2008). [DOI] [PubMed] [Google Scholar]
- 75.Grimstein C. et al. Alpha-1 Antitrypsin Protein and Gene Therapies Decrease Autoimmunity and Delay Arthritis Development in Mouse Model. J. Transl. Med. 9, 21 (2011). [DOI] [PMC free article] [PubMed] [Google Scholar]
- 76.Kaneva M. K. et al. Alpha-1-Antitrypsin Reduces Inflammation and Exerts Chondroprotection in Arthritis. FASEB J. 35, e21472 (2021). [DOI] [PubMed] [Google Scholar]
- 77.Korkmaz B., Horwitz M. S., Jenne D. E. & Gauthier F. Neutrophil Elastase, Proteinase 3, and Cathepsin G as Therapeutic Targets in Human Diseases. Pharmacol. Rev. 62, 726–759 (2010). [DOI] [PMC free article] [PubMed] [Google Scholar]
- 78.Morko J., Soderstrom M., Saamanen A., Salminen H. & Vuorio E. Up Regulation of Cathepsin K Expression in Articular Chondrocytes in a Transgenic Mouse Model for Osteoarthritis. Ann. Rheum. Dis. 63, 649–655 (2004). [DOI] [PMC free article] [PubMed] [Google Scholar]
- 79.Luo G., D’Souza R., Hogue D. & Karsenty G. The matrix Gla Protein Gene is a Marker of the Chondrogenesis Cell Lineage during Mouse Development. J. Bone Miner. Res. Off. J. Am. Soc. Bone Miner. Res. 10, 325–334 (1995). [DOI] [PubMed] [Google Scholar]
- 80.Zhang Y. et al. Unexpected Role of Matrix Gla Protein in Osteoclasts: Inhibiting Osteoclast Differentiation and Bone Resorption. Mol. Cell. Biol. 39, e00012–19 (2019). [DOI] [PMC free article] [PubMed] [Google Scholar]
- 81.Okada Y., Scott G., Ray M. K., Mishina Y. & Zhang Y. Histone Demethylase JHDM2A is Critical for Tnp1 and Prm1 Transcription and Spermatogenesis. Nature 450, 119–123 (2007). [DOI] [PubMed] [Google Scholar]
- 82.Unguryte A. et al. Human Articular Chondrocytes with Higher Aldehyde Dehydrogenase Activity have Stronger Expression of COL2A1 and SOX9. Osteoarthritis Cartilage 24, 873–882 (2016). [DOI] [PubMed] [Google Scholar]
- 83.Schulze-Tanzil G. et al. Anaphylatoxin Receptors and Complement Regulatory Proteins in Human Articular and Non-Articular Chondrocytes: Interrelation with Cytokines. Cell Tissue Res. 350, 465–475 (2012). [DOI] [PubMed] [Google Scholar]
- 84.Granados-Montiel J. et al. SERPINA9 and SERPINB2: Novel Cartilage Lineage Differentiation Markers of Human Mesenchymal Stem Cells with Kartogenin. CARTILAGE 12, 102–111 (2021). [DOI] [PMC free article] [PubMed] [Google Scholar]
- 85.Maumus M. et al. Neuromedin B Promotes Chondrocyte Differentiation of Mesenchymal Stromal Cells via Calcineurin and Calcium Signaling. Cell Biosci. 11, 183 (2021). [DOI] [PMC free article] [PubMed] [Google Scholar]
- 86.Wang X. et al. Comparison of the Major Cell Populations among Osteoarthritis, Kashin–Beck Disease and Healthy Chondrocytes by Single-cell RNA-seq Analysis. Cell Death Dis. 12, 1–15 (2021). [DOI] [PMC free article] [PubMed] [Google Scholar]
- 87.Somoza R. A. et al. Transcriptome-Wide Analyses of Human Neonatal Articular Cartilage and Human Mesenchymal Stem Cell-Derived Cartilage Provide a New Molecular Target for Evaluating Engineered Cartilage. Tissue Eng. Part A 24, 335–350 (2018). [DOI] [PMC free article] [PubMed] [Google Scholar]
- 88.Aissiou A. K. et al. Transcriptomic Response of Bioengineered Human Cartilage to Parabolic Flight Microgravity is Sex-Dependent. NPJ Microgravity 9, 5 (2023). [DOI] [PMC free article] [PubMed] [Google Scholar]
- 89.Szklarczyk D. et al. The STRING Database in 2023: Protein–Protein Association Networks and Functional Enrichment Analyses for any Sequenced Genome of Interest. Nucleic Acids Res. 51, D638–D646 (2023). [DOI] [PMC free article] [PubMed] [Google Scholar]
- 90.Li C., Sunderic K., Nicoll S. B. & Wang S. Downregulation of Heat Shock Protein 70 Impairs Osteogenic and Chondrogenic Differentiation in Human Mesenchymal Stem Cells. Sci. Rep. 8, 553 (2018). [DOI] [PMC free article] [PubMed] [Google Scholar]
- 91.Woods A., Wang G. & Beier F. RhoA/ROCK Signaling Regulates Sox9 Expression and Actin Organization during Chondrogenesis*. J. Biol. Chem. 280, 11626–11634 (2005). [DOI] [PubMed] [Google Scholar]
- 92.Liang T. et al. Identifying the Key Genes Regulating Mesenchymal Stem Cells Chondrogenic Differentiation: An In Vitro Study. BMC Musculoskelet. Disord. 23, 985 (2022). [DOI] [PMC free article] [PubMed] [Google Scholar]
- 93.Fan Y. et al. Unveiling Inflammatory and Prehypertrophic Cell Populations as Key Contributors to Knee Cartilage Degeneration in Osteoarthritis using Multi-Omics Data Integration. Ann. Rheum. Dis. ard-2023–224420 (2024) doi: 10.1136/ard-2023-224420. [DOI] [PMC free article] [PubMed] [Google Scholar]
- 94.Tagariello A. et al. Ucma--A Novel Secreted Factor Represents a Highly Specific Marker for Distal Chondrocytes. Matrix Biol. J. Int. Soc. Matrix Biol. 27, 3–11 (2008). [DOI] [PubMed] [Google Scholar]
- 95.Xing S. et al. Proteomic Analysis of Chondromodulin-I-Induced Differentiation of Mesenchymal Stem Cells into Chondrocytes. J. Proteomics 159, 1–18 (2017). [DOI] [PubMed] [Google Scholar]
- 96.Xing S.-C. et al. Chondrogenic Differentiation of ChM-I Gene Transfected Rat Bone Marrow-Derived Mesenchymal Stem Cells on 3-Dimensional Poly (L-lactic acid) Scaffold for Cartilage Engineering. Cell Biol. Int. 39, 300–309 (2015). [DOI] [PubMed] [Google Scholar]
- 97.Jaiswal P. K. et al. Biochemical Characteristics of the Chondrocyte-Enriched SNORC Protein and its Transcriptional Regulation by SOX9. Sci. Rep. 10, 7790 (2020). [DOI] [PMC free article] [PubMed] [Google Scholar]
- 98.Kennedy O., Kitson A., Okpara C., Chow L. W. & Gonzalez-Fernandez T. Immunomodulatory Strategies for Cartilage Regeneration in Osteoarthritis. Tissue Eng. Part A 30, 259–271 (2024). [DOI] [PubMed] [Google Scholar]
- 99.Roach H. I. et al. Association Between the Abnormal Expression of Matrix-Degrading Enzymes by Human Osteoarthritic Chondrocytes and Demethylation of Specific CpG Sites in the Promoter Regions. Arthritis Rheum. 52, 3110–3124 (2005). [DOI] [PubMed] [Google Scholar]
- 100.Zhao L. et al. Exploration of CRISPR/Cas9-Based Gene Editing as Therapy for Osteoarthritis. Ann. Rheum. Dis. 78, 676–682 (2019). [DOI] [PMC free article] [PubMed] [Google Scholar]
- 101.Farhang N. et al. CRISPR-Based Epigenome Editing of Cytokine Receptors for the Promotion of Cell Survival and Tissue Deposition in Inflammatory Environments. Tissue Eng. Part A 23, 738–749 (2017). [DOI] [PMC free article] [PubMed] [Google Scholar]
- 102.Wäldele S. et al. Deficiency of Fibroblast Activation Protein Alpha Ameliorates Cartilage Destruction in Inflammatory Destructive Arthritis. Arthritis Res. Ther. 17, 12 (2015). [DOI] [PMC free article] [PubMed] [Google Scholar]
- 103.Geest T. van der et al. Liposomal Treatment of Experimental Arthritis Can Be Monitored Noninvasively with a Radiolabeled Anti–Fibroblast Activation Protein Antibody. J. Nucl. Med. 58, 151–155 (2017). [DOI] [PubMed] [Google Scholar]
- 104.Fan A. et al. Inhibition of Fibroblast Activation Protein Ameliorates Cartilage Matrix Degradation and Osteoarthritis Progression. Bone Res. 11, 1–12 (2023). [DOI] [PMC free article] [PubMed] [Google Scholar]
- 105.Wang M. et al. MMP13 is a Critical Target Gene During the Progression of Osteoarthritis. Arthritis Res. Ther. 15, R5 (2013). [DOI] [PMC free article] [PubMed] [Google Scholar]
- 106.Tschaikowsky M. et al. The Articular Cartilage Surface is Impaired by a Loss of Thick Collagen Fibers and Formation of Type I Collagen in Early Osteoarthritis. Acta Biomater. 146, 274–283 (2022). [DOI] [PubMed] [Google Scholar]
- 107.Qu Y. et al. A Comprehensive Analysis of Single-Cell RNA Transcriptome Reveals Unique SPP1+ Chondrocytes in Human Osteoarthritis. Comput. Biol. Med. 160, 106926 (2023). [DOI] [PubMed] [Google Scholar]
- 108.Gao S. G. et al. Elevated Osteopontin Level of Synovial Fluid and Articular Cartilage is Associated with Disease Severity in Knee Osteoarthritis Patients. Osteoarthritis Cartilage 18, 82–87 (2010). [DOI] [PubMed] [Google Scholar]
- 109.Emtage P. et al. IGFL: A Secreted Family with Conserved Cysteine Residues and Similarities to the IGF Superfamily. Genomics 88, 513–520 (2006). [DOI] [PubMed] [Google Scholar]
- 110.Chen H.-T. et al. Adiponectin Enhances Intercellular Adhesion Molecule-1 Expression and Promotes Monocyte Adhesion in Human Synovial Fibroblasts. PLOS ONE 9, e92741 (2014). [DOI] [PMC free article] [PubMed] [Google Scholar]
- 111.Schett G. et al. Vascular Cell Adhesion Molecule 1 as a Predictor of Severe Osteoarthritis of the Hip and Knee Joints. Arthritis Rheum. 60, 2381–2389 (2009). [DOI] [PubMed] [Google Scholar]
- 112.Liu J.-F. et al. CCN4 Induces Vascular Cell Adhesion Molecule-1 Expression in Human Synovial Fibroblasts and Promotes Monocyte Adhesion. Biochim. Biophys. Acta BBA - Mol. Cell Res. 1833, 966–975 (2013). [DOI] [PubMed] [Google Scholar]
- 113.Cornelis F. M. et al. Dio2 Overexpression in Cartilage Dysregulates Lipid Metabolism and Leads to Accelerated Osteoarthritis. Osteoarthritis Cartilage 30, S327 (2022). [Google Scholar]
- 114.Cheng A. W. M., Bolognesi M. & Kraus V. B. DIO2 Modifies Inflammatory Responses in Chondrocytes. Osteoarthritis Cartilage 20, 440–445 (2012). [DOI] [PMC free article] [PubMed] [Google Scholar]
- 115.Mittal M. et al. TNFα-Stimulated Gene-6 (TSG6) Activates Macrophage Phenotype Transition to Prevent Inflammatory Lung Injury. Proc. Natl. Acad. Sci. 113, E8151–E8158 (2016). [DOI] [PMC free article] [PubMed] [Google Scholar]
- 116.Bayliss M. T. et al. Up-Regulation and Differential Expression of the Hyaluronan-Binding Protein TSG-6 in Cartilage and Synovium in Rheumatoid Arthritis and Osteoarthritis. Osteoarthritis Cartilage 9, 42–48 (2001). [DOI] [PubMed] [Google Scholar]
- 117.Ramos Y. F. M. et al. Genes Involved in the Osteoarthritis Process Identified through Genome Wide Expression Analysis in Articular Cartilage; the RAAK Study. PLOS ONE 9, e103056 (2014). [DOI] [PMC free article] [PubMed] [Google Scholar]
- 118.Kzhyshkowska J., Larionova I. & Liu T. YKL-39 as a Potential New Target for Anti-Angiogenic Therapy in Cancer. Front. Immunol. 10, 2930 (2020). [DOI] [PMC free article] [PubMed] [Google Scholar]
- 119.Rai M. F. et al. Distinct degenerative phenotype of articular cartilage from knees with meniscus tear compared to knees with osteoarthritis. Osteoarthritis Cartilage 27, 945–955 (2019). [DOI] [PMC free article] [PubMed] [Google Scholar]
- 120.Olivari S. & Molinari M. Glycoprotein folding and the role of EDEM1, EDEM2 and EDEM3 in degradation of folding-defective glycoproteins. FEBS Lett. 581, 3658–3664 (2007). [DOI] [PubMed] [Google Scholar]
- 121.Li Y.-H. et al. The unfolded protein response genes in human osteoarthritic chondrocytes: PERK emerges as a potential therapeutic target. Arthritis Res. Ther. 18, 172 (2016). [DOI] [PMC free article] [PubMed] [Google Scholar]
- 122.Buccitelli C. & Selbach M. mRNAs, Proteins and the Emerging Principles of Gene Expression Control. Nat. Rev. Genet. 21, 630–644 (2020). [DOI] [PubMed] [Google Scholar]
- 123.Shen Z., Bao W. & Huang D.-S. Recurrent Neural Network for Predicting Transcription Factor Binding Sites. Sci. Rep. 8, 15270 (2018). [DOI] [PMC free article] [PubMed] [Google Scholar]
Associated Data
This section collects any data citations, data availability statements, or supplementary materials included in this article.