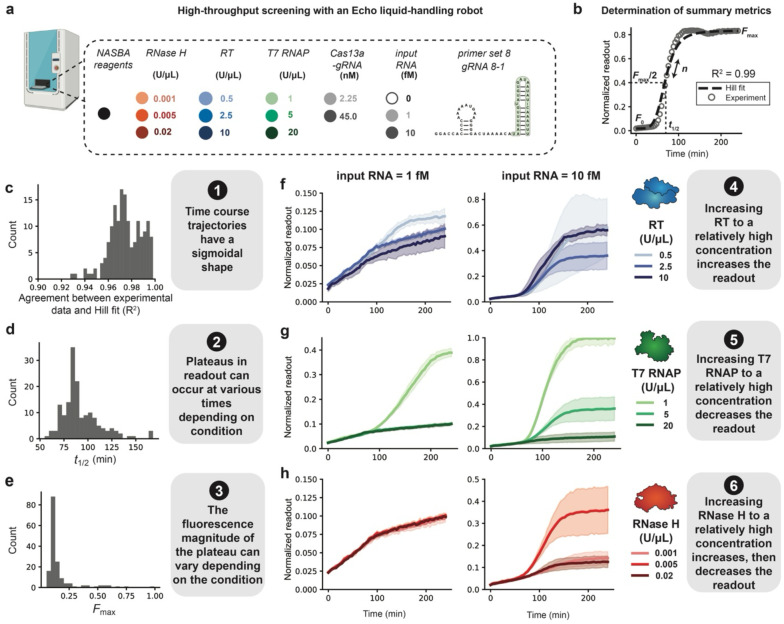
Fig. 3 ∣. High-throughput screening of the enzyme concentration landscape suggests model assumptions and reveals reaction design principles, shown for Data Set 2.
a, Different amounts of input RNA, RT, T7 RNAP, RNase H, and Cas13a-gRNA were dispensed in triplicate (independent replicates) using an Echo liquid handling platform. Assembled NASBA-Cas13a reactions were run and fluorescence data collected and averaged across triplicate measurements to arrive at a mean dynamic trajectory. The dynamic trajectory was then normalized by the maximum readout value, such that the maximum readout value across the entire experiment (all conditions) was set to 1. b, Hill functions were fit to each normalized time course trajectory, and summary metrics (n, t1/2, F0, and Fmax) were parameterized. A representative time course trajectory and Hill plot is shown as an example. c, For each time course, R2 values for the normalized experimental data (points) and Hill fit (dotted line) were calculated and plotted as a histogram. Histograms of values across all conditions were computed for: d, t1/2 , and e, Fmax. f–h, Time course trajectories for data subsets varying: f, RT, g, T7 RNAP, and h, RNase H, each using two different input RNA concentrations. Shading indicates the average of the triplicates ± standard deviation. This process was repeated for each experimental data set, but Data Set 2 is highlighted here because it was in closest alignment with all modeling objectives.

