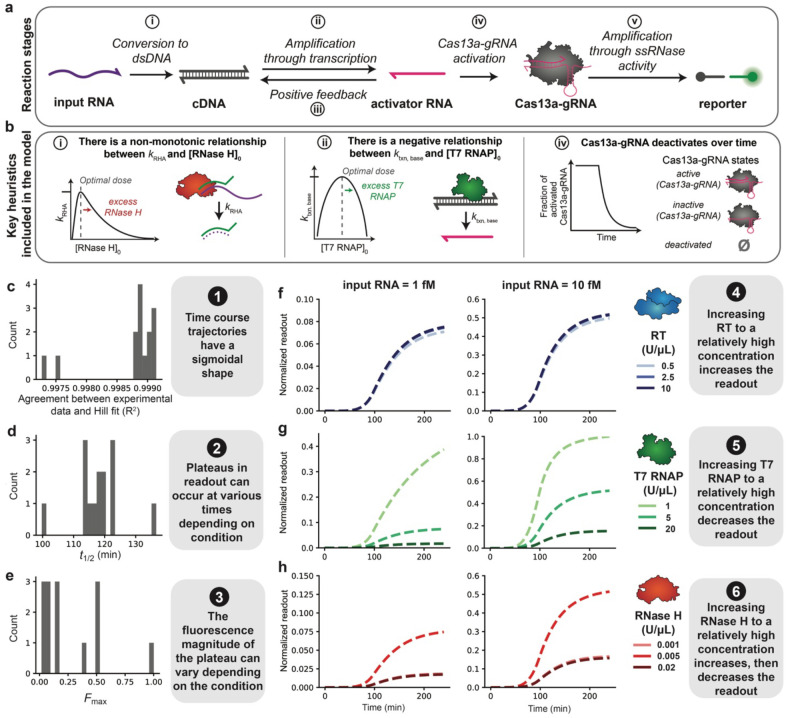
Fig. 4 ∣. Mathematical modeling recapitulates key experimental observations.
a, Schematic of key reaction stages (top) and mechanisms (bottom) in the model. A more detailed depiction of the model is in Supplementary Fig. 21. b, Key mechanisms included in the model. Each mechanism is involved in the reaction stage indicated to the left of each mechanism description. c-e, Hill-like functions were fit to each simulated time course trajectory, and summary metrics (n, t1/2, F0, and Fmax) were parameterized (Fig. 3b is a visual representation of these metrics). c, For each time course, R2 for the normalized simulated data and Hill fit was calculated; values are plotted as a histogram. Histograms of values across all conditions in the simulated training data set were calculated for: d, t1/2, and e, Fmax, f–h, Time course trajectories for simulated data subsets: f, mid-range RNase H and T7 RNAP and high Cas13a-gRNA, g, mid-range RNase H and RT and high Cas13a-gRNA, and h, mid-range T7 RNAP and RT and high Cas13a-gRNA.

