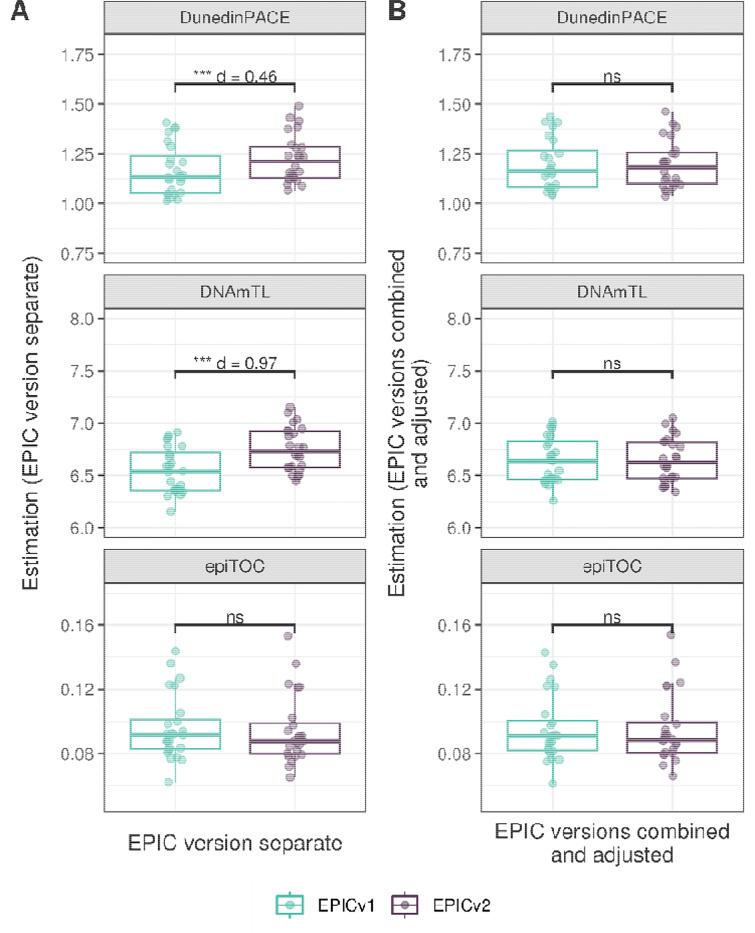
Figure 5.
Rate-based and other clock estimates on matched samples assessed on EPICv1 and EPICv2 in VHAS. Boxplots comparing DunedinPACE, DNAmTL and epiTOC estimates calculated by considering EPIC versions separately (A) and combined and EPIC version adjusted (B), between EPICv1 and EPICv2. Statistical significance was defined as Bonferroni adjusted p-value <0.05. ** denotes Bonferroni p <0.05, *** denotes Bonferroni p <0.001, “ns” denotes “not significant”, and “d” denotes effect size measured using Cohen’s d. A positive Cohen’s d indicates estimates in EPICv2 compared to EPICv1.

