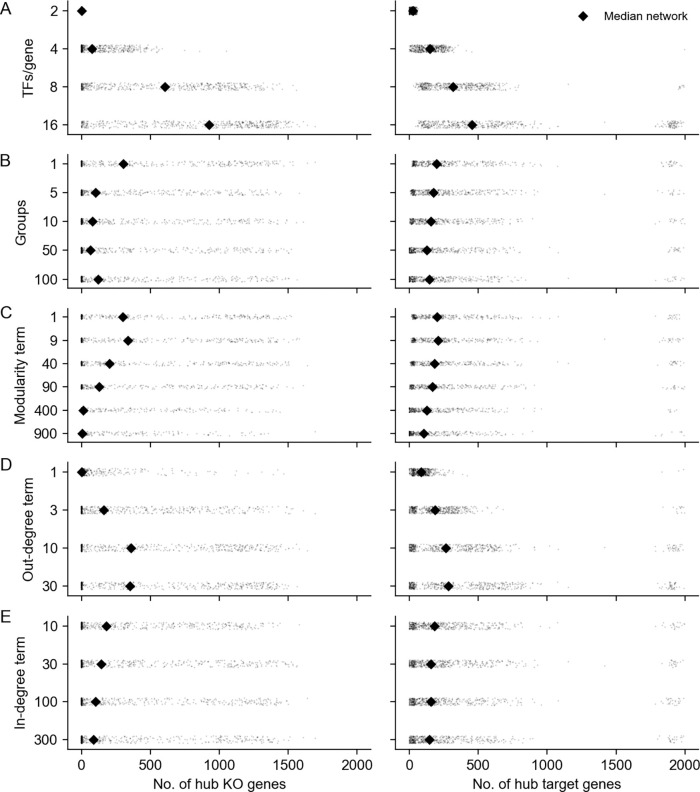
Figure 4: Network properties influence their susceptibility to gene perturbations.
Counts of genes that are hub knockouts (left) and hub target genes (right) in each synthetic GRN, as a function of network generating parameters. Each panel shows all 1,920 GRNs as individual points, stratified by parameter values. Each distribution is annotated with its mean over GRNs (diamond points).

