

Abstract
Bone fragility is increasingly recognized as an important complication of diabetes mellitus (DM), and both type 1 (T1DM) and type 2 (T2DM) diabetes are associated with a higher risk of fracture. The causes of bone fragility in diabetic patients are not yet fully understood; probably they are linked to low bone mineral density (BMD), poor bone quality due to the alterations in bone remodelling, microarchitecture and composition of the bone matrix. Quantitative ultrasound (QUS) is a validated, low-cost and free ionizing radiation alternative to DXA measurement of BMD for the assessment of fracture risk. The results obtained by using QUS in T1DM and T2DM have been summarized and reported in this review. QUS technique presents some benefits but also some limits. These limits could be overcome by radiofrequency echographic multispectrometry (REMS) that is a non-ionizing technology recently introduced for the assessment of bone status that can also calculate parameters related to bone quality and strength. Therefore, REMS may represent a promising approach to evaluate bone status and fragility fracture risk in DM subjects.
Keywords: Osteoporosis, quantitative bone ultrasound, radiofrequency echographic multi spectrometry, Type 1 diabetes mellitus, Type 2 diabetes mellitus
INTRODUCTION
Bone fragility is increasingly recognized as an important complication diabetes mellitus (DM). Indeed, numerous studies have clearly demonstrated that both type 1 DM (T1DM) and type 2 DM (T2DM) patients have a risk of vertebral and non-vertebral fragility fractures markedly higher with respect to individuals without diabetes.[1-3] A meta-analysis of 16 studies reported a relative risk of 6.94 in T1DM and 1.38 T2DM with respect to non-diabetic subjects.[4]
The causes of bone fragility in diabetic patients are not yet fully understood, but they are almost certainly linked to both low bone mineral density (BMD) and poor bone quality due to the alterations in bone remodelling, microarchitecture and composition of the bone matrix.[1-3] Most studies have reported that T1DM patients presented significant decreases in BMD at all skeletal sites.[1,3,4]
Instead, it has now been established that patients with T2DM have a higher BMD than non-diabetic subjects, so suggesting that in T2DM patients qualitative bone alterations might play a crucial role in determining bone fragility and an increased fracture risk.[5]
Unfortunately, bone quality can currently only be assessed with complex or invasive techniques that are not easily available in clinical practice; therefore, there is a growing interest in new non-invasive techniques capable of improving the assessment of bone status in diabetic patients.[6,7] Among these, the techniques that evaluate the bone properties using the attenuation and the reflection of the pulse ultrasound waves (QUS) have been considered very interesting. In fact, QUS devices in addition to being portable, low cost and free of ionizing radiation would seem able to provide additional information on the structure and elastic properties of bone.[8,9] Moreover, a position statement from the International Society for Clinical Densitometry (ISCD) concluded that heel QUS devices were able to predict fragility fractures independently and as well as DXA.[10] Nevertheless, up to now QUS devices have been used little and with discordant results in diabetic patients. Furthermore, QUS technology has some relevant limitations, in particular, QUS cannot be used for diagnostic classification, since the WHO criteria were established based upon BMD measurement by DXA and cannot be used with FRAX; in addition, there are no studies showing reduction in fracture risk for patients selected for therapy based on QUS measurements. Recently, a new technology called radiofrequency echographic multispectrometry (REMS) and based on the analysis of raw unfiltered ultrasound signals could represent an innovative method for the evaluation of the bone status in diabetic patients.
TYPE 1 DIABETES MELLITUS
Only a few studies have evaluated the usefulness of QUS parameters in adults with T1DM [Table 1]. A recent Japanese study by Yoshioka F et al.[11] carried out in 62 T1DM women, and 62 age-, menopausal status- and body mass index-matched controls reported that the heel BMD Z-score at calcaneus was significantly lower in premenopausal women with T1DM than in the premenopausal control group. Similarly, a previous study carried out in USA reported that T1DM in premenopausal women was associated with 3–8% lower BMD at total hip and femoral neck and a 15% lower calcaneal BUA with respect to non-diabetic controls.[12] These differences corresponded to approximately half of 1-SD-lower BMD and 1-SD-lower BUA. The large decrease in calcaneal BUA in T1DM women compared with controls suggests that peripheral bone sites may be even more compromised than other sites. Moreover, T1DM women reported a higher number of previous fragility fractures with respect to controls (33.3% vs. 22.2%, P = 0.04).[12] Other studies have evaluated QUS parameters at hand phalanges in T1DM patients. Diaphysis of the proximal phalanges contains both cortical and trabecular bone, and the amount of cortical bone makes this site very similar to femoral neck. In particular, the study by Catalano A. et al. reported that in premenopausal women, phalangeal QUS parameters (Amplitude Dependent Speed of Sound [AD-SoS] and Ultrasound Bone Profile Index [UBPI] were all significantly lower in T1DM women than in the control group (p = 0.04).[13] Moreover, T1DM women with poor metabolic control showed lower phalangeal QUS values compared to healthy controls (p < 0.01) and T1DM women with good metabolic control (p < 0.05), whereas no significant differences in QUS measurements were detected between T1DM women with good metabolic control and healthy controls.[13] The latter authors in a subsequent study found that young males with T1DM also had reduced phalangeal Ad-SoS and UBPI values with respect to the reference population, but similar to those of age-matched women with T1DM.[14]
Table 1.
Assessment of bone status in diabetes mellitus by quantitative bone ultrasound
| T2DM Study/Year | Study Population | Bone Assessment | Primary Measures | Results |
|---|---|---|---|---|
| Guo Y (2020)[15] | 1073 (69.09±6.53yrs) T2DM 2357 (68.26±6.21yrs) Non-T2DM | Hologic Sahara | eBMD (g/cm2) | Fragility Fractures: 7.3%; BMD=0.344±0.08 Fragility Fractures: 5.2%; BMD=0.320±0.08 |
| Lasschuit JWJ (2020)[16] | 96 (IQR 70 (68-76) yrs) T2DM 809 (IQR 71 (68-76) yrs) Non-T2DM | CUBA sonometer GE Lunar DPX-L | VOS (m/s) BUA (dB/MHz) LS BMD (g/cm2) FN BMD (g/cm2) | T2DM: HR for↓1 SD VOS=1.59; BUA=1.81; LSBMD=1.86; FNBMD=2.55 Non-T2DM: HR for↓1 SD VOS=1.19; BUA=1.47; LSBMD=1.43; FNBMD=1.39 |
| Conti F (2017)[17] | 320 T2DM | Hologic Sahara | SOS (m/s) BUA (dB/MHz) QUI eBMD | T2DM: SOS=1539.3±87.4; BUA=71.6±21.4, QUI=91.6±22.2; eBMD=0.50±0.14 |
| Gushiken M (2015)[18] | 108 (59.7±10.0 yrs) T2DM 168 (60.5±11.7 yrs) Non-T2DM | GE AchillesA-1000 PLUS | S (%) | T2DM: All S=87.8±14.8; S (BMI <25 kg/m2) = 83.7±16.3; S (BMI ≥25 kg/m2) = 90.2±13.8 Non-T2DM: All S=87.9±14.7; S (BMI <25 kg/m2)= 88.6±14.9; S (BMI ≥25 kg/m2)= 87.2±14.4; |
| Neglia C (2014)[19] | 18 (62.2±4.5 yrs) T2DM 18 (60.2±4.7 yrs) Non-T2DM | DBM Sonic 1200 device (IGEA, Carpi, Italy) | AD-SoS (m/s) BTT (µs) Sdy (mV/µs) FWA (mV) | T2DM: baseline: AD-SoS=1937.7±65.4; BTT=1.36±2.1; Sdy = -341.5±250.6; FWA=38.1±5.6; After 3 yrs: AD-SoS=1916.6±12.2; BTT=1.22±0.28; SDy = -398.7±153.5; FWA=31.8±6.8; Non-T2DM: baseline: AD-SoS=2010.3±52.3; BTT=1.42±0.2; SDy =-300.9±143.4; FWA=41.9±9.5; After 3 yrs: AD-SoS=1971.1±15.5; BTT=1.40±0.23; SDy = -398.7±200.0; FWA=30.3±8.3; |
| Bulló M (2011)[20] | 110 (67.82±0.51 yrs) T2DM 141 (67.70±0.57 yrs) Non-T2DM | Hologic Sahara | BUA (dB/MHz) SOS (m/s) QUI | T2DM: BUA=79.4±1.43; SOS=1551.93±2.52; QUI=97.70±1.59 Non-T2DM: BUA=74.73±1.62; SOS=1545.38±2.86; QUI=93.16±1.80 |
| Yamaguchi T (2011)[21] | 96 ♂ (64.7±8.2 yrs) T2DM 99 ♀ (66.6±8.6 yrs) T2DM | CM-200 Elk corp. Hologic; QDR-4500 | SOS (m/s) LS BMD (g/cm2) FN BMD (g/cm2) | ♂T2DM: SOS=1506±28; LSBMD=1.041±0.195; FNBMD=0.764±0.111 ♀T2DM: SOS=1494±27; LSBMD=0.858±0.178; FNBMD=0.636±0.114 |
| Patel S (2008)[22] | 150 ♀ (74±6 yrs) T2DM | Hologic Sahara GE Lunar Prodigy | S (%) eBMD (g/cm2) LS BMD (g/cm2) TH BMD (g/cm2) | T2DM: S=90.4±26.0; eBMD=0.50±1.65 LSBMD=0.978±0.174; THBMD=0.870±0.176 |
| Sosa M (2008)[23] | 110 ♀ (71.7±5.0 yrs) T2DM 91 ♀ (69.9±4.2 yrs) Non-T2DM | Hologic Sahara Hologic QDR-1000 | BUA (dB/MHz) SOS (m/s) QUI LS BMD (g/cm2) FN BMD (g/cm2) | T2DM: BUA=69.38; SOS=1537; QUI=87.52; LSBMD=0.979; FNBMD=0.757 Non-T2DM: BUA=66.71; SOS=1532; QUI=83.77; LSBMD=0.927; FNBMD=0.733 |
| Tao B (2008)[24] | 76 ♀ (64.1±9.3 yrs) T2DM 86 ♀ (65.5±6.5 yrs) Non-T2DM | Sunlight Omnisense 7000P GE Lunar Prodigy | SOS radio (m/s) SOS phalanx (m/s) SOS tibia (m/s) LS BMD (g/cm2) FN BMD (g/cm2) TH BMD (g/cm2) | T2DM: SOS radio=4044±178; SOS phalanx=3902±207; SOS tibia=3815±148; LSBMD=1.06±0.12; FNBMD=0.80±0.13; THBMD=0.87±0.14 Non-T2DM: SOSradio=4129±182; SOSphalanx=3999±214; SOStibia=3845±139; LSBMD=0.90±0.23; FNBMD=0.74±0.12; THBMD=0.80±0.13 |
| Dobnig H (2006)[25] | 583 ♀ (84.2±6.3 yrs) T2DM 1081 ♀ (82.8±5.9 yrs) Non-T2DM | GE Achilles Express Sunlight Omnisense | SOS Z-score radio SOS Z-score phalanx SOS Z-score calcaneus | T2DM: S calcaneus = -0.03±0.06; SOS phalanx = -0.65±0.05; SOS radio = -0.49±0.07; Non-T2DM: S calcaneus = -0.52±0.04; SOS phalanx = -0.79±0.03; SOS radio = -0.81±0.05; |
| Yoshioka F (2021)[11] | 62 (47.2±17.3 yrs) T1DM 62 (47.3±16.3 yrs) Non-T1DM | AOS-100NW; Hitachi-Aloka Medical | Heel BMD T-score | T1DM: Heel BMD-T-score = -0.03±0.88 Non-T1DM: Heel BMD-T-score=0.32±1.00 |
| ChobotA (2020)[26] | 20 ♂ (19.9±4.0 yrs) T1DM 12 ♀ (21.4±3.8 yrs) T1DM | DBM Sonic 1200 device (IGEA, Carpi, Italy) Hologic, Explorer | AD-SoS SDS TH-BMD SDS LS-BMD SDS | 20 ♂ T1DM: Ad-SoS SDS=0.07±1.42 12 ♀ T1DM: Ad-SoS SDS = -0.71±1.32 All T1DM: TH-BMD SDS = -1.53±0.75; LS-BMD SDS = -0.39±0.98 |
| Conti F (2017)[17] | 80 T1DM | Hologic Sahara | SOS (m/s) BUA (dB/MHz) QUI eBMD | T1DM: SOS=1548.6±38.9; BUA=71.5±24.9, QUI=93.3±25.8; eBMD=0.50±0.19 |
| Catalano A (2014)[14] | 34 ♂ (32.8±9.3 yrs) T1DM 35 ♀ (34.5±6.9 yrs) T1DM | DBM Sonic 1200 device (IGEA, Carpi, Italy) | AD-SoS (m/s) UBPI (u) | ♂T1DM: AD-SoS=2009.7±113.6; UBPI=0.56±0.22; ♀T1DM: AD-SoS=1994.6±89.5; UBPI=0.53±0.17; |
| Catalano A. (2013)[13] | 35 ♀ (35.5±6.8 yrs) T1DM 20 ♀ (33.9±5.0 yrs) Non-T1DM | DBM Sonic 1200 device (IGEA, Carpi, Italy) | AD-SoS (m/s) UBPI (u) | T1DM: AD-SoS=1994.57±89.48; UBPI=0.52±0.17; Non-T1DM: AD-SoS=2073.57±65.39; UBPI=0.66±0.18; |
| Strotmeyer ES (2006)[12] | 67 ♀ (43.1±4.3 yrs) T1DM 237 ♀ (45.2±4.2 yrs) Non-T1DM | Hologic Sahara Hologic; QDR-4500 | BUA (dB/MHz) LS BMD (g/cm2) FN BMD (g/cm2) TH BMD (g/cm2) WB BMD (g/cm2) | T1DM: BUA=71.6±18.4; LSBMD=1.045±0.1128; FNBMD=0.797±0.046; THBMD=0.890±0.102; WBMD=1.132±0.079 Non-T1DM: BUA=84.9±17.7; LSBMD=1.060±0.117; FNBMD=0.847±0.188; THBMD=0.961±0.105; WBMD=1.165±0.073 |
T2DM=subjects with type 2 diabetes mellitus, QUS=quantitative ultrasound, Non-T2DM=subjects withouttype 2 diabetes mellitus, eBMD=QUS estimated BMD, VOS=velocity of sound, BUA=broadband ultrasound attenuation, LS BMD=lumbar spine bone mineral density, FN BMD=femoral neck bone mineral density, S=bone stiffness, SOS=speed of sound, QUI=quantitative ultrasound index, Ad-SoS=amplitude-dependent speed of sound, BTT=bone transmission time, SDy=signal dynamic, FWA=fast wave amplitude, ♀ = female, ♂ = male, THBMD=total hip bone mineral density, T1DM=type 1 diabetes mellitus, Non-T1DM=subjects withouttype 1 diabetes mellitus, UBPI=ultrasound bone profile index, WB BMD=whole body bone mineral density
A more recent 10-year longitudinal Polish study reported that in adolescents and young adults with T1DM, QUS parameters at phalanxes were lower with respect to the reference population
both at baseline and at the end of the 10-year follow-up, so suggesting that QUS parameters at phalanxes did not change during a decade.[26]
TYPE 2 DIABETES MELLITUS
The most important studies evaluating the usefulness of QUS in T2DM patients are summarized in Table 1. In particular, a recent study carried out in a large Chinese population by Guo Y et al. reported that the QUS-derived BMD measurements at calcaneus were similar in T2DM patients and in age-matched non-T2DM subjects, although the T2DM patients had a higher risk for fracture (OR = 1.357).[15]
Interesting data were obtained from some studies that performed both BMD by DXA and QUS parameters at the heel on the same patients.[16,21-23] In particular, the study by Sosa M. et al.[23] reported that T2DM postmenopausal women presented BMD-LS values significantly higher with respect to non-T2DM women, whereas no significant differences in QUS parameters of the heel (BUA and SOS) were observed. Instead, a Japanese study carried out in elderly T2DM men and women reported that there were no differences in values of SOS at calcaneus or BMD by DXA at any sites.[21] Moreover, in these T2DM patients both BMD by DXA and QUS were not associated with the presence of vertebral fractures in either gender.[21] Another study by Patel S et al. found that in T2DM elderly women, both BMD at the lumbar spine or total hip and QUS parameters at the heel were higher with respect to the reference population; moreover, the percentage of patients classified as ‘osteoporotic’ (T-score lower than -2.5) was the same by using DXA or QUS (Stiffness).[22] A recent Australian study carried out in a subset of participants in the Dubbo Study reported that femoral neck BMD and BUA at calcaneus were higher in the T2DM group than in non-T2DM subjects and that in T2DM patients, BUA independently predicted any fragility fracture with comparable effect size to femoral neck BMD.[16] Also in the study by Bulló M et al., T2DM individuals presented higher values of BUA and QUI than non-T2DM subjects, despite they presented a higher prevalence of fragility fractures.[20] Phalangeal QUS measurements were only used in three studies conducted in T2DM postmenopausal women.[19,24,25] In these latter studies, QUS parameters at the phalanges were significantly lower in T2DM patients than in non-T2DM patients.[19,24] Moreover, in the study by Tao B et al. the values of the BMD by DXA and the QUS parameters have a divergent trend. In fact, while BMD values, at both lumbar spine and proximal femur, were significantly higher in women with T2DM than in those non-T2DM, the QUS parameter SOS was significantly reduced (at both radius and phalanges) in women with T2DM with respect to non-T2DM women.[24]
RADIOFREQUENCY ECHOGRAPHIC MULTISPECTROMETRY
REMS is a non-ionizing technology recently introduced for the assessment of bone status. The operating principle of REMS is based on the analysis of native raw unfiltered ultrasound signals, the so-called radiofrequency (RF) ultrasound signals, acquired during an echographic scan of lumbar vertebrae and proximal femur.[27] The analysis of native unfiltered ultrasound signals permits the retention information regarding the characteristics of the investigated tissues, which are normally filtered out during the conventional process of B-mode image reconstruction. The bone health status is assessed through the comparison of the analysed signal spectra with previously derived reference spectral models for the considered pathological and normal conditions.[27,28] Using this procedure of comparison of the spectral modifications, it is possible to obtain an estimate of the bone mineral density and to classify the subjects examined as normal, osteopenic or osteoporotic. REMS technology has been described in detail in previous papers.[8,27,28] A schematic representation of REMS acquisition on femoral-neck is illustrated in Figure 1a. The REMS intra-operator precision, expressed as root mean square-coefficient of variation (RMS-CV), was 0.38% (95% CI: 0.28–0.48) for lumbar spine and 0.32% (95% CI: 0.24–0.40%) for femoral neck. The inter-operator repeatability was 0.54% (95% CI: 0.40–0.68) for lumbar spine and 0.48% (95% CI: 0.36–0.60) for femoral neck.[8,28] Moreover, some recent studies have reported that REMS is able to predict the occurrence of incident fragility fractures in women, so representing a promising approach to enhance osteoporosis diagnosis in clinical routine.[29,30] Due to its precision, repeatability and diagnostic accuracy associated with the lack of ionizing radiation, REMS technology can be proposed to monitor the response to therapy.
Figure 1.
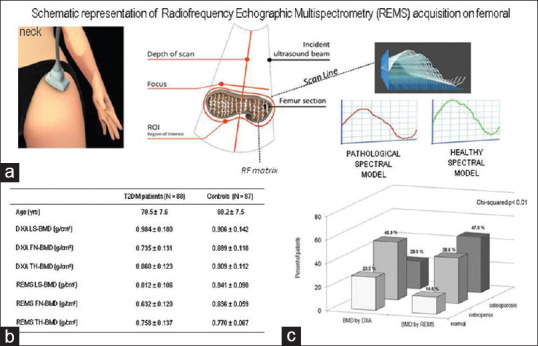
Ability of REMS to identify osteoporosis status in T2DM women[31]
Hitherto, only the study by Caffarelli C et al. has evaluated the usefulness of REMS technique in enhancing the diagnosis of osteoporosis in T2DM patients.[31] This latter study, carried out in 90 consecutive T2DM postmenopausal women, aged 50–80 years, and in 90 non-T2DM healthy age- and gender-matched controls, reported that all DXA measurements were higher in T2DM than in non-T2DM women. Instead, all REMS measurements were lower in T2DM than in non-T2DM women [Figure 1b]. Furthermore, expressing the BMD values in terms of T-score, the percentage of women classified as ‘osteoporotic’ on the basis of BMD by REMS was significantly higher than that obtained with BMD by DXA [Figure 1c]. Moreover, BMD-LS by REMS but not BMD by DXA was significantly lower in T2DM women with previous fragility fractures.[31]
DISCUSSION
There is currently a growing interest in new, reliable and easy-to-use technologies for assessing bone status and fracture risk in the increasing diabetic population.[3,6,7] QUS technologies appeared to have these characteristics.[8,10] Although the available data obtained from the use of QUS devices in the assessment of bone status in T1DM patients are scarce, it is possible to conclude that the QUS parameters of the calcaneus and phalanges, similarly to BMD by DXA, are reduced in T1DM individuals compared to the reference populations. Moreover, the fact that phalangeal QUS parameters do not present evident changes over time in T1DM patient should be an important limitation.[26]
Several studies have measured QUS parameters in T2DM subjects obtaining very heterogeneous results. Overall, the QUS parameters at the heel showed a similar trend to the BMD by DXA; instead SOS and AD-SoS measured at the radius and phalanges were found to be significantly lower than the BMD and QUS measurements at the calcaneus.[19,24,25] Also data concerning the predictive role of QUS in discriminating diabetic patients with fragility fractures are conflicting. The fact that QUS measurements can only be performed at non-axial skeletal sites and the availability of many devices that differ from each other in technology and measured parameters limits the clinical use of QUS.
These limits could be overcome by the REMS device which analyses axial skeletal sites, has good precision and repeatability and is able to predict the risk of fragility fractures in population-based samples of women. Moreover, REMS technology may be able to calculate other parameters related to bone quality and strength such as the fragility index.[3,8]
Therefore, if these features are confirmed in diabetic populations, REMS may represent a promising approach to evaluate bone status and fragility fracture risk in DM subjects.
Author contributions
GS and CC conceived the idea; AA and MDV drafted the manuscript; and GS supervised the process and contributed to editing. All authors contributed to the article and approved the submitted version.
Financial support and sponsorship
Nil.
Conflicts of interest
The authors declare that the research was conducted in the absence of any commercial or financial relationships that could be construed as a potential conflict of interest.
REFERENCES
- 1.Compston J. Type 2 diabetes mellitus and bone. J Intern Med. 2018;283:140–53. doi: 10.1111/joim.12725. [DOI] [PubMed] [Google Scholar]
- 2.Janghorbani M, Van Dam RM, Willett WC, Hu FB. Systematic review of type 1 and type 2 diabetes mellitus and risk of fracture. Am J Epidemiol. 2007;166:495–505. doi: 10.1093/aje/kwm106. [DOI] [PubMed] [Google Scholar]
- 3.Napoli N, Chandran M, Pierroz DD, Abrahamsen B, Schwartz AV, Ferrari SL, et al. Mechanisms of diabetes mellitus-induced bone fragility. Nat Rev Endocrinol. 2017;13:208–19. doi: 10.1038/nrendo.2016.153. [DOI] [PubMed] [Google Scholar]
- 4.Vestergaard P. Discrepancies in bone mineral density and fracture risk in patients with type 1 and type 2 diabetes-A meta-analysis. Osteoporos Int. 2007;18:427–44. doi: 10.1007/s00198-006-0253-4. [DOI] [PubMed] [Google Scholar]
- 5.Schwartz AV, Vittinghof E, Bauer DC, Hillier TA, Strotmeyer ES, Ensrud KE, et al. Association of BMD and FRAX score with risk of fracture in older adults with type 2 diabetes. JAMA. 2011;305:2184–92. doi: 10.1001/jama.2011.715. [DOI] [PMC free article] [PubMed] [Google Scholar]
- 6.Eller-Vainicher C, Cairoli E, Grassi G, Grassi F, Catalano A, Merlotti D, et al. Pathophysiology and management of type 2 diabetes mellitus bone fragility. J Diabetes Res. 2020;2020:7608964. doi: 10.1155/2020/7608964. [DOI] [PMC free article] [PubMed] [Google Scholar]
- 7.Jiang N, Xia W. Assessment of bone quality in patients with diabetes mellitus. Osteoporos Int. 2018;29:1721–36. doi: 10.1007/s00198-018-4532-7. [DOI] [PubMed] [Google Scholar]
- 8.Diez-Perez A, Brandi ML, Al-Daghri N Locquet M, Muratore M, Nogués X, et al. Radiofrequency echographic multi-spectrometry for the in-vivo assessment of bone strength:State of the art-outcomes of an expert consensus meeting organized by the European Society for Clinical and Economic Aspects of Osteoporosis, Osteoarthritis and Musculoskeletal Diseases (ESCEO) Aging Clin Exp Res. 2019;31:1375–89. doi: 10.1007/s40520-019-01294-4. [DOI] [PMC free article] [PubMed] [Google Scholar]
- 9.Glüer CC, Wu CY, Jergas M, Goldstein SA, Genant HK. Three quantitative ultrasound parameters reflect bone structure. Calcif Tissue Int. 1994:46–52. doi: 10.1007/BF00310168. doi:10.1007/BF00310168. [DOI] [PubMed] [Google Scholar]
- 10.Krieg MA, Barkmann R, Gonnelli S, Stewart A, Bauer DC, Del Rio Barquero L, et al. Quantitative ultrasound in the management of osteoporosis:The 2007 ISCD Official positions. J Clin Densitom. 2008;11:163–87. doi: 10.1016/j.jocd.2007.12.011. [DOI] [PubMed] [Google Scholar]
- 11.Yoshioka F, Nirengi S, Murata T, Kawaguchi Y, Watanabe T, Saeki K, et al. Lower bone mineral density and higher bone resorption marker levels in premenopausal women with type 1 diabetes in Japan. J Diabetes Investig. 2021;12:1689–96. doi: 10.1111/jdi.13530. [DOI] [PMC free article] [PubMed] [Google Scholar]
- 12.Strotmeyer ES, Cauley JA, Orchard TJ, Steenkiste AR, Dorman JS. Middle-aged premenopausal women with type 1 diabetes have lower bone mineral density and calcaneal quantitative ultrasound than nondiabetic women. Diabetes Care. 2006;29:306–11. doi: 10.2337/diacare.29.02.06.dc05-1353. [DOI] [PubMed] [Google Scholar]
- 13.Catalano A, Morabito N, Di Vieste G, Pintaudi B, Cucinotta D, Lasco A, et al. Phalangeal quantitative ultrasound and metabolic control in pre-menopausal women with Type 1 diabetes mellitus. Endocrinol Invest. 2013;36:347–251. doi: 10.3275/8646. doi:10.3275/8646. [DOI] [PubMed] [Google Scholar]
- 14.Catalano A, Pintaudi B, Morabito N, Di Vieste G, Giunta L, Bruno ML, et al. Gender differences in sclerostin and clinical characteristics I type 1 diabetes mellitus. Eur J Endocrinol. 2014;171:293–300. doi: 10.1530/EJE-14-0106. [DOI] [PubMed] [Google Scholar]
- 15.Guo Y, Yingfang W, Chen F, Wang J, Wang D. Assessment of risk factors for fractures in patients with type 2 diabetes over 60 years old:A cross-sectional study from Northeast China. J Diabetes Res. 2020;2020:1508258. doi: 10.1155/2020/1508258. doi:10.1155/2020/1508258. [DOI] [PMC free article] [PubMed] [Google Scholar]
- 16.Lasschuit JWJ, Greenfield JR, Tonks KTT. Comparison of calcaneal quantitative ultrasound and bone densitometry parameters as fracture risk predictors in type 2 diabetes mellitus Diabet Med. 2020;37:1902–9. doi: 10.1111/dme.14183. [DOI] [PubMed] [Google Scholar]
- 17.Conti F, Balducci S, Pugliese L, D'Errico V, Vitale M, Alessi E, et al. Correlates of calcaneal quantitative ultrasound parameters in patients with diabetes:The study on the assessment of determinants of muscle and bone strength abnormalities in diabetes. J Diabetes Res. 2017;2017:4749619. doi: 10.1155/2017/4749619. doi:10.1155/2017/4749619. [DOI] [PMC free article] [PubMed] [Google Scholar]
- 18.Gushiken M, Komiya I, Ueda S, Kobayashi J. Heel bone strength is related to lifestyle factors in Okinawan men with type 2 diabetes mellitus. J Diabetes Investig. 2015;6:150–7. doi: 10.1111/jdi.12285. [DOI] [PMC free article] [PubMed] [Google Scholar]
- 19.Neglia C, Agnello N, Argentiero A, Chitano G, Quarta G, Bortone I, et al. Increased risk of osteoporosis in postmenopausal women with type 2 diabetes mellitus:A three-year longitudinal study with phalangeal QUS measurements. J Biol Regul Homeost Agents. 2014;28:733–41. [PubMed] [Google Scholar]
- 20.Bulló M, Garcia-Aloy M, Basora J, Covas MI, Salas-Salvado J. Bone quantitative ultrasound measurements in relation to the metabolic syndrome and type 2 diabetes mellitus in a cohort of elderly subjects at high risk of cardiovascular disease from the PREDIMED study. J Nutr Health Aging. 2011;15:939–44. doi: 10.1007/s12603-011-0046-0. [DOI] [PubMed] [Google Scholar]
- 21.Yamaguchi T, Yamamoto M, Kanazawa I, Yamauchi M, Yano S, Tanaka N, et al. Quantitative ultrasound and vertebral fractures in patients with type 2 diabetes. J Bone Miner Metab. 2011;29:626–32. doi: 10.1007/s00774-011-0265-9. [DOI] [PubMed] [Google Scholar]
- 22.Patel S, Hyer S, Tweed K, Kerry S, Allan K, Rodin A, et al. Risk factors for fractures and falls in older women with type 2 diabetes mellitus. Calcif Tissue Int. 2008;82:87–91. doi: 10.1007/s00223-007-9082-5. [DOI] [PubMed] [Google Scholar]
- 23.Sosa M, Saavedra P, Jódar E, Lozano-Tonkin C, Quesada JM, Torrijos A, et al. Bone mineral density and risk of fractures in aging, obese post-menopausal women with type 2 diabetes. The GIUMO Study. Aging Clin Exp Res. 2009;21:27–32. doi: 10.1007/BF03324895. [DOI] [PubMed] [Google Scholar]
- 24.Tao B, Liu JM, Zhao HY, Sun LH, Wang WQ, Li XY, et al. Differences between measurements of bone mineral densities by quantitative ultrasound and dual-energy x-ray absorptiometry in type 2 diabetic postmenopausal women. J Clin Endocrinol Metab. 2008;93:1670–5. doi: 10.1210/jc.2007-1760. [DOI] [PubMed] [Google Scholar]
- 25.Dobnig H, Piswanger-Sölkner JC, Roth M, Obermayer-Pietsch B, Tiran A, Strele A. Type 2 diabetes mellitus in nursing home patients:Effects on bone turnover, bone mass, and fracture risk. J Clin Endocrinol Metab. 2006;91:3355–63. doi: 10.1210/jc.2006-0460. [DOI] [PubMed] [Google Scholar]
- 26.Chobot A, Janota O, Bąk-Drabik K, Polanska J, Pluskiewicz W. Bone status in adolescents and young adults with type 1 diabetes:A 10-year longitudinal study. Endokrynol Pol. 2020;71:532–8. doi: 10.5603/EP.a2020.0080. [DOI] [PubMed] [Google Scholar]
- 27.Conversano F, Franchini R, Greco A, Soloperto G, Chiriacò F, Casciaro E, et al. A novel ultrasound methodology for estimating spine mineral density. Ultrasound Med Biol. 2015;41:281–300. doi: 10.1016/j.ultrasmedbio.2014.08.017. [DOI] [PubMed] [Google Scholar]
- 28.Di Paola M, Gatti D, Viapiana O, Cianferotti L, Cavalli L, Caffarelli C, et al. Radiofrequency echographic multispectrometry compared with dual Xray absorptiometry for osteoporosis diagnosis on lumbar spine and femoral neck. Osteoporos Int. 2019;30:391–402. doi: 10.1007/s00198-018-4686-3. [DOI] [PubMed] [Google Scholar]
- 29.Adami G, Arioli G, Bianchi G, Brandi ML, Caffarelli C, Cianferotti L, et al. Radiofrequency echographic multi spectrometry for the prediction of incident fragility fractures:A 5-year follow-up study. Bone. 2020;134:115297. doi: 10.1016/j.bone.2020.115297. doi:10.1016/j.bone. 2020.115297. [DOI] [PubMed] [Google Scholar]
- 30.Cortet B, Dennison E, Diez-Perez A, Locquet M, Muratore M, Nogués X, et al. Radiofrequency Echographic Multi Spectrometry (REMS) for the diagnosis of osteoporosis in a European multicenter clinical context. Bone. 2021;143:115786. doi: 10.1016/j.bone.2020.115786. doi:10.1016/j.bone. 2020.115786. [DOI] [PubMed] [Google Scholar]
- 31.Caffarelli C, Tomai Pitinca MD, Al Refaie A, Ceccarelli E, Gonnelli S. Ability of radiofrequency echographic multispectrometry to identify osteoporosis status in elderly women with type 2 diabetes. Aging Clin Exp Res. 2022;34:121–7. doi: 10.1007/s40520-021-01889-w. [DOI] [PMC free article] [PubMed] [Google Scholar]