Abstract
Secondary inorganic aerosols play an important role in air pollution and climate change, and their formation modulates the atmospheric deposition of reactive nitrogen (including oxidized and reduced nitrogen), thus impacting the nitrogen cycle. Large-scale and long-term analyses of secondary inorganic aerosol formation based on model simulations have substantial uncertainties. Here we improve constraints on secondary inorganic aerosol formation using decade-long in situ observations of aerosol composition and gaseous precursors from multiple monitoring networks across the United States. We reveal a shift in the secondary inorganic aerosol formation regime in the rural United States between 2011 and 2020, making rural areas less sensitive to changes in ammonia concentrations and shortening the effective atmospheric lifetime of reduced forms of reactive nitrogen. This leads to potential increases in reactive nitrogen deposition near ammonia emission hotspots, with ecosystem impacts warranting further investigation. Ammonia (NH3), a critical but not directly regulated precursor of fine particulate matter in the United States, has been increasingly scrutinized to improve air quality. Our findings, however, show that controlling NH3 became significantly less effective for mitigating fine particulate matter in the rural United States. We highlight the need for more collocated aerosol and precursor observations for better characterization of secondary inorganic aerosols formation in urban areas.
Subject terms: Environmental sciences, Biogeochemistry, Atmospheric chemistry
Chemical regimes of atmospheric secondary inorganic aerosol formation in rural areas of the United States shifted from NH3-sensitive to NH3-insensitive between 2011 and 2020, according to analyses of long-term observational data on aerosol composition and gaseous precursors.
Main
Secondary inorganic aerosols (SIAs) are major components of fine particulate matter (PM2.5), which has detrimental impacts on human health and regional visibility and substantially influences the radiative balance of the climate system1–4. SIAs are formed predominantly through the oxidation of sulfur dioxide (SO2) and nitrogen oxides (NOx), and subsequent reaction with ammonia (NH3)5. These processes determine the physical and chemical properties of aerosols, including aerosol acidity, aerosol water uptake and growth, and potentially aerosol toxicity. SIA formation also influences the gas–particle partitioning of semivolatile inorganic reactive nitrogen (Nr) species, such as NH3, ammonium (NH4+), nitric acid (HNO3) and nitrate (NO3−)5. Because gaseous NH3 and HNO3 species deposit much more quickly than Nr compounds in PM2.5 (refs. 6,7), their phase partitioning modulates the spatial distribution of Nr atmospheric deposition, which influences human exposure to PM2.5 (and the associated health impacts), loss of biological diversity, soil and water acidification, and surface water eutrophication8–11. Therefore, a better understanding of SIA formation can facilitate policy-making in relation to many environmental challenges.
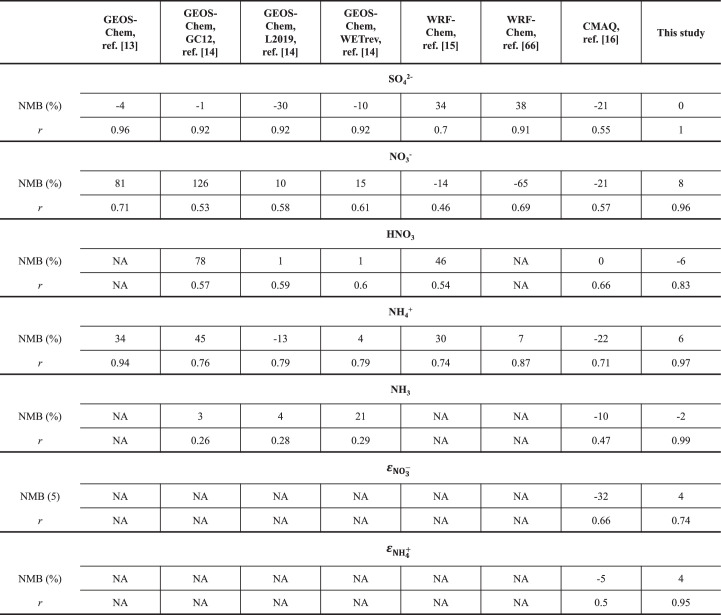
Aerosol thermodynamic analyses using measured gas concentrations and particle composition provide better constraints on SIA formation and the partitioning of semivolatile species than simulations with chemical transport models (CTMs)12. Compared to observations, regional and global CTM simulations vary substantially in terms of the simulated aerosol composition and phase partitioning of Nr species in the United States13–16 (Extended Data Table 1). This variability could result from uncertainties in emission inventories, transport, dry deposition, wet scavenging and/or heterogeneous chemical production13,14,17–20. Directly modelling SIA formation with simultaneous measurements of gas concentrations and aerosol composition (that is, concentrations of NH3, HNO3, NH4+, NO3−, SO42−, non-volatile cations (NVCs, including sodium, calcium, magnesium and potassium ions) and chloride ion (Cl−)) avoids the aforementioned uncertainties12,21. However, this is only available at a few sites or from a few intensive field campaigns with limited spatiotemporal coverage in the United States12,22,23. Moreover, past measurements are unlikely to reflect the current atmospheric composition due to rapid changes in the emissions of various precursors, impacts on gas–particle partitioning from climate change, and increases in the size and number of wildfires.
Extended Data Table 1.
Model performance for simulating SIA formation
Normalized mean biases (NMBs, %) and Pearson correlation coefficients (r) between observed and simulated annual mean values are listed for sulfate (SO42−), nitrate (NO3−), nitric acid (HNO3), ammonium (NH4+), ammonia (NH3), molar fraction of NO3− in total nitrate (), and molar fraction of NH4+ in total ammonium (. Performance of chemical transport models from references (refs. 13–16,66) are included for comparison.
In this Article we overcome the above limitations of existing datasets and a lack of constraint on simulated SIA formation by using observations from multiple long-term air-quality-monitoring networks for aerosol thermodynamic analyses. Our results show that chemical regimes of SIA formation in the rural United States shifted from NH3-sensitive to NH3-insensitive between 2011 and 2020 and led to increases in Nr deposition near NH3-emission hotspots. Although we focus on the rural United States because of the available observations, we demonstrate the benefits of collocated monitoring for aerosol composition and precursor concentrations, which should be considered for future monitoring network design in the United States and globally.
Improving constraints on SIA formation
We identified locations where sites from the monitoring networks provide essential inputs to SIA formation simulations and are located within a spatial window of 50 km (Methods). Several national networks monitor trace-gas precursors and aerosol chemical composition, but observations from an individual network are insufficient for thermodynamic modelling. Integrating collocated observations provides the inputs needed as biweekly means (averaged every 2 weeks). There were 42 and 68 locations that had collocated observations for the periods of 2011–2015 and 2016–2020, respectively (Extended Data Fig. 1 and Supplementary Tables 1 and 2). Although these areas are located outside urban centres, many of them are still in the vicinity of high-population areas, especially in the Midwestern and Northeastern United States. The areas within 50 km of the locations account for 6.7% of the land surface areas, but 9.8%, 7.0%, 8.7% and 7.5% of the population, SO2 emissions, NOx emissions and NH3 emissions in the contiguous United States, respectively24,25. Moreover, because the aerosol composition and precursors observed at sites 50–100 km apart still show good agreement (Supplementary Fig. 1), our findings may apply to rural and suburban regions outside major urban centres more generally.
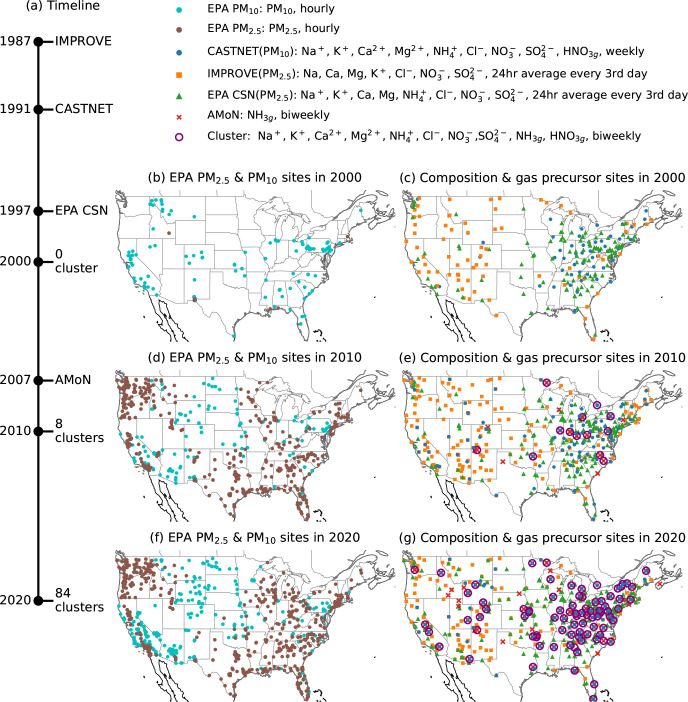
Extended Data Fig. 1. Development of air quality monitoring networks in the U.S. and locations of the monitoring networks.
(a) Development of air quality monitoring networks in the U.S. and (b–g) locations of the monitoring networks. The base map is obtained from Natural Earth.
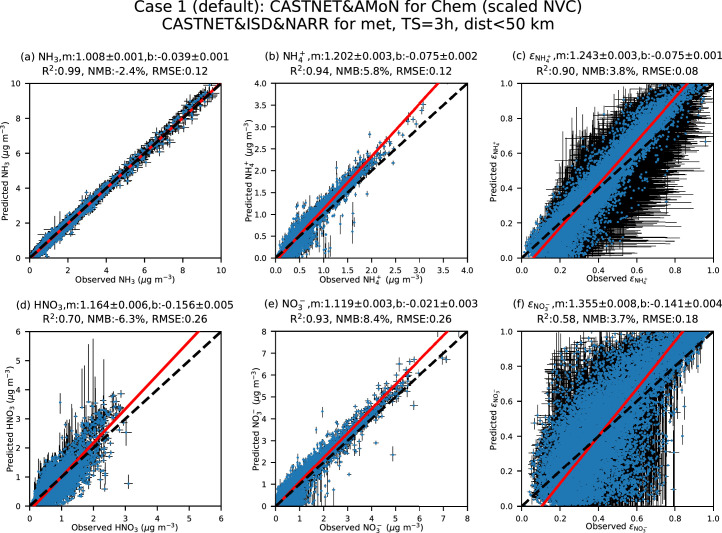
Using the ISORROPIA-II model26 (a full thermodynamic model for inorganic aerosol formation) with the integrated dataset described above, we substaintially reduce uncertainties in simulating SIA formation (Extended Data Fig. 2). Although ISORROPIA-II and other aerosol thermodynamic models have been validated with hourly or daily observations12,27, they have not been validated with biweekly observations made with different sampling methods. We conducted sensitivity tests and uncertainty analyses to develop the necessary preprocessing steps to integrate collocated observations (Methods and Supplementary Table 3), reducing the normalized mean biases (NMBs) between simulated and observed , , and (where c denotes concentration, in units of μg per m3 of air) from −28 to 11% to −6 to 8% (Supplementary Table 3). The NMBs between CTM simulations and observations are much larger (−65 to 126%) because the built-in aerosol thermodynamic model is driven by inputs determined by emission, oxidation, transport and deposition processes13–20. Although simulating these processes links the concentrations of SIA precursors (for example, SO42−, total nitrate (NO3T = HNO3 + NO3−) and total ammonium (NH4T = NH3 + NH4+)) to primary emissions, the large errors in CTMs could alter the SIA formation regime, and observations are needed to constrain these processes. Here, we first investigate regional precursor concentration responses to emission reductions by examining the relationship between precursor concentrations and their emissions. Then, with the improved constraints on SIA formation, we can better quantify the impacts of rapidly changing atmospheric composition on Nr deposition, SIA properties and SIA sensitivities to precursor reductions.
Extended Data Fig. 2. Observed and ISORROPIA-II simulated , , , , , and .
The dots and error bars represent the mean values and the 95% confidence intervals (CI; as the 2.5th and the 97.5th percentiles) of 1000 Monte Carlo simulations, respectively. Red lines show orthogonal distance regression results (prediction = m·observation + b), and corresponding regression parameters and evaluation statistics (determination coefficient (R2), normalized mean bias (NMB), and root mean square error (RMSE)) are shown in panel titles. Black dashed lines show the 1:1 line. The number of samples is 13813 for all panels.
Rapid changes in aerosol composition and acidity
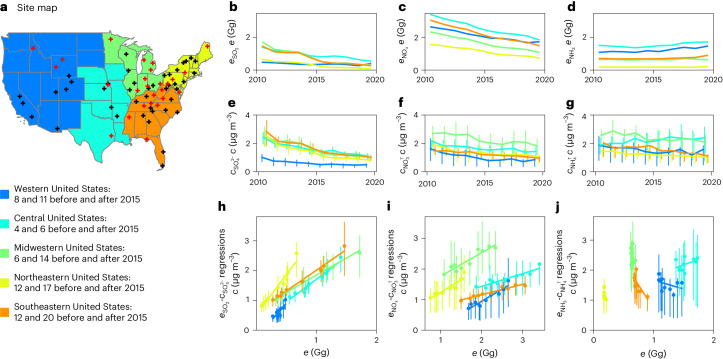
Between 2011 and 2020, all regions in the United States experienced significant decreases in and (Fig. 1e,f), whereas remained relatively stable in the Western and Midwestern United States but decreased in the Central, Northeastern and Southeastern United States (Fig. 1g and Supplementary Table 4). Concentrations of organic aerosols (OAs) also remained relatively stable during this period, except in the Western United States (Supplementary Fig. 2). Their relative contributions to PM2.5 concentrations increased significantly because of the reductions in cSIA (Supplementary Fig. 2). Annual concentrations of SIAs were still higher than OAs at the locations investigated in the Midwestern, Northeastern and Southeastern United States in 2020.
Fig. 1. Site locations and relationships between emissions of SO2, NOx and NH3 and concentrations of SO42−, NO3T and NH4T.
a, Site map. Black and red crosses represent measurement sites established before and after 2015, respectively, in the five regions indicated by specific colours. Corresponding site numbers are listed in the legends. The base map was obtained from Natural Earth. The five regions are defined according to the Regional Planning Organizations (Methods). The numbers of samples for these regions for each year are listed in Supplementary Table 2. b–d, Annual SO2 (b), NOx (c) and NH3 (d) emissions (, and ) in the five regions. e–g, Annual mean concentrations of SO42− (e), NO3T (f) and NH4T (g). h–j, Orthogonal distance regressions of annual mean and (h), and (i) and and (j), with each dot indicating one year from 2011 to 2020. The vertical bars show the 25th and 75th percentiles of annual mean concentrations observed at locations within a region.
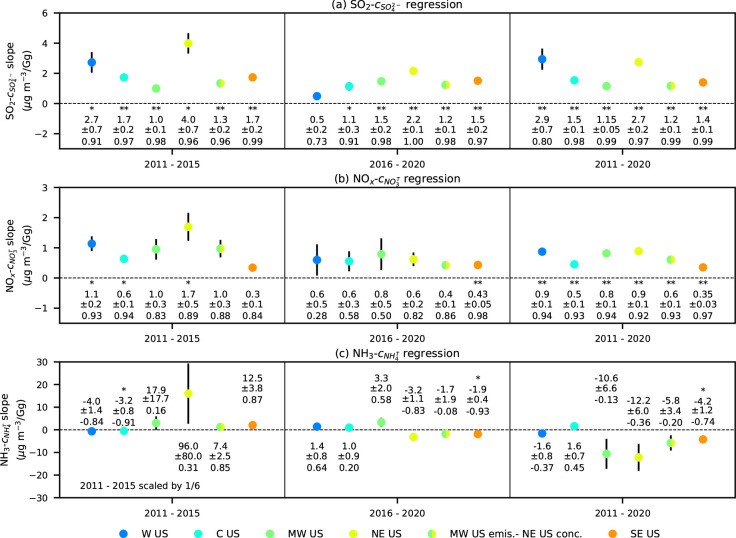
As a consequence of regulations, shifts in energy generation, and implementations of emission control technology, and (Fig. 1b,c; e denotes emission in units of Gg) decreased, respectively, by 70% and 50% in the United States between 2011 and 202028. The decreases in and correlate with these emission reductions (Fig. 1h,i), indicating that and reductions have been very effective in reducing and . The responses of and to and reductions remained largely unchanged between 2000 and 202129, and this period witnessed 90% and 65% reductions in and , respectively28. However, the responses could change if SO2 and NOx emission reductions continue (Supplementary Text 1). In contrast, has not been directly regulated and remained approximately unchanged. and are inversely correlated in the Southeastern United States and show no clear correlation in other regions (Extended Data Fig. 3). Regional Kendall tests show that these trends remain consistent with or without the sites established after 2015 (Supplementary Fig. 3 and Supplementary Table 4)30. More trend analyses and regression results are presented in Supplementary Figs. 4–6 and Supplementary Text 1. The inverse correlations and less clear relationship reflect large uncertainties in NH3 emissions and/or increased NH4T removal associated with and reductions instead of changes in .
Extended Data Fig. 3. Relationships between emissions and regional mean concentrations.
Panels (a–c) present the orthogonal distance regression slopes of (a) SO2 emission-, (b) NOx emissions-, and (c) NH3 emission- regressions for 2011–2015, 2016–2020, and 2011–2020 with observations from long-term sites only. Regional mean concentrations are used in the regressions, and the sample sizes for each region are 5, 5, and 10 for 2011–2015, 2016–2020, and 2011–2020, respectively. ‘*’ or ‘**’ indicate the regression has a p < 0.05 or <0.01, respectively. The error bars show uncertainties of the regression slopes (95% CI; calculated as ±1.96 standard deviation (SD)). The numbers below are the slopes (mean values), the uncertainties (±1.96 SD), and the Pearson correlation coefficients, respectively. To illustrate NH3- correlation results for 2011–2015 in panel (c), they are scaled by 1/6.
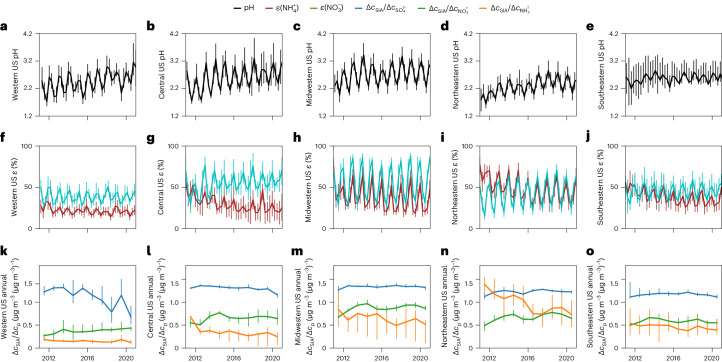
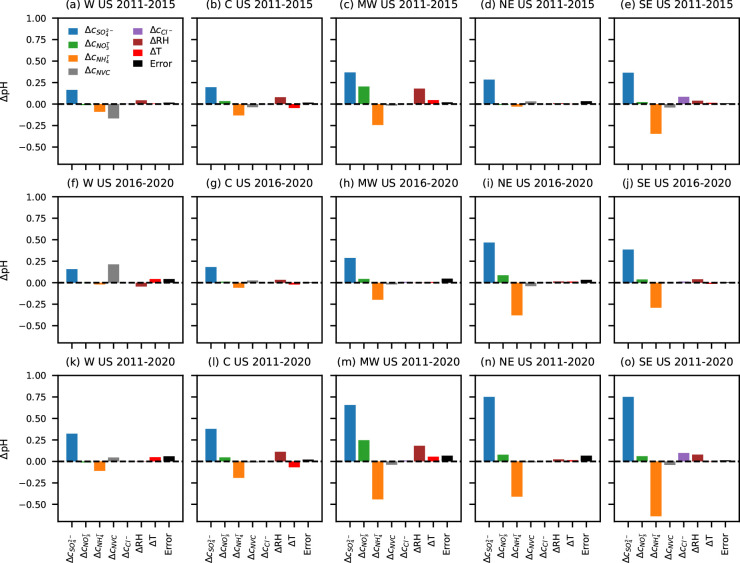
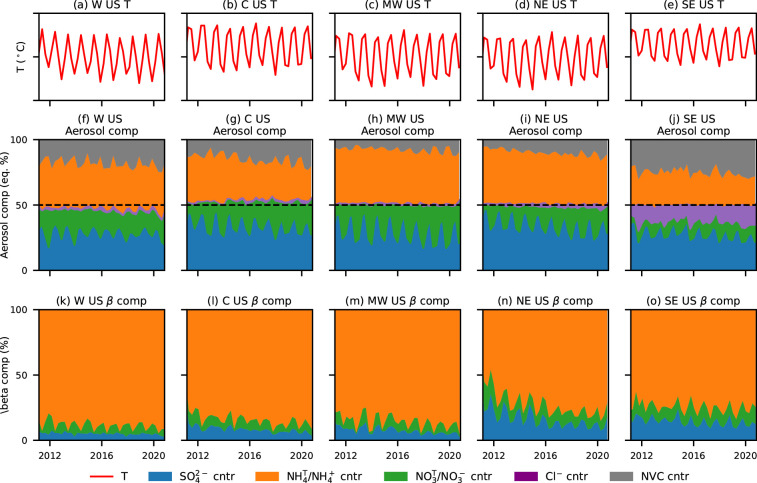
Influencing aerosol thermodynamic properties, aerosol acidity is a key indicator of potential changes in gas–particle partitioning and SIA formation caused by changes in aerosol composition31. Aerosol pH is difficult to measure directly, and is often estimated using aerosol thermodynamic simulations because of the challenges associated with collecting unperturbed samples31. Between 2011 and 2020, our simulations show that the annual mean aerosol pH increased by 0.2–0.6 units across the rural United States (Fig. 2a–e). The major contributor to the pH increase was a reduction in (Extended Data Fig. 4) in all regions, and decreases in ameliorated the extent of the pH increases in the Midwestern, Northeastern and Southeastern United States. Aerosol pH was primarily buffered by NH3 in the Western, Central and Midwestern United States (Extended Data Fig. 5). Zheng and colleagues32 have shown that this buffering regime suppresses the influence of compositional differences on aerosol pH and makes aerosol water content (AWC) and temperature (T) the primary determinants of aerosol pH, leading to larger seasonal variations in aerosol pH in those three regions. The changes in aerosol acidity and its seasonal variations could have implications for aerosol toxicity and the oxidation rates of SO2 and NOx, which requires further investigation. For example, the effectiveness of controlling SO2 emissions on reducing could decrease due to enhanced SO2 oxidation as aerosol pH increases17,31,33.
Fig. 2. Regional means of aerosol pH, gas–particle partitioning and cSIA sensitivities to precursor reductions (ΔcSIA/Δcp) from 2011 to 2020.
The numbers of samples used to calculate the mean values for each region are listed in Supplementary Table 2. a–e, Simulated aerosol pH (black lines) in the Western (a), Central (b), Midwestern (c), Northeastern (d) and Southeastern (e) United States over time. f–j, Observed molar fractions ε of NO3T (cyan) and NH4T (brown) that partition into the particle phase ( and ) in the Western (f), Central (g), Midwestern (h), Northeastern (i) and Southeastern (j) United States over time. k–o, (blue), (green) and (orange), simulated by reducing the corresponding precursors by 40% in the Western (k), Central (l), Midwestern (m), Northeastern (n) and Southeastern (o) United States over time. Vertical bars show the 25th and 75th percentiles of the corresponding values observed or simulated at locations within a region to illustrate regional variability.
Extended Data Fig. 4. Contributions of changes in , , , , , RH, and T to pH changes.
The contributions are cumulative contributions calculated as described in the Methods section (Eq. (2) and (3)).
Extended Data Fig. 5. Regional means of temperature, aerosol composition, and pH buffering capacity composition.
Regional means of temperature, aerosol composition (calculated using ion-equivalent concentrations to reflect aerosol charge balance), and pH buffering capacity composition from 2011 to 2020. Blue, green, and orange areas in panels (f–o) show contributions (cntr) of SO42−, NO3T, and NH4T to aerosol composition or aerosol pH buffering capacity. Grey and purple areas show contributions of non-volatile cations (NVC) and chloride ion (Cl−) to aerosol composition.
Regime changes in SIA formation and Nr deposition
Increases in aerosol pH led to decreases of −2 to −4% per year in the molar fraction of NH4+ in NH4T () in all regions (Fig. 2f–j provides a time series and Supplementary Table 4 shows the trends), implying that more NH4T remained as NH3 in the atmosphere in 2020 than in 2011. Thus, a greater fraction of NH4T could deposit near emission sources as NH3, because gas-phase NH3 deposits more rapidly than PM2.5 (ref. 7). The decrease in the atmospheric lifetime of NH4T could reduce the NH4T transported from NH3 sources in the Western, Central and Midwestern United States to the Northeastern and Southeastern United States, explaining the decreasing trends of in the Northeastern and Southeastern United States without significant changes.
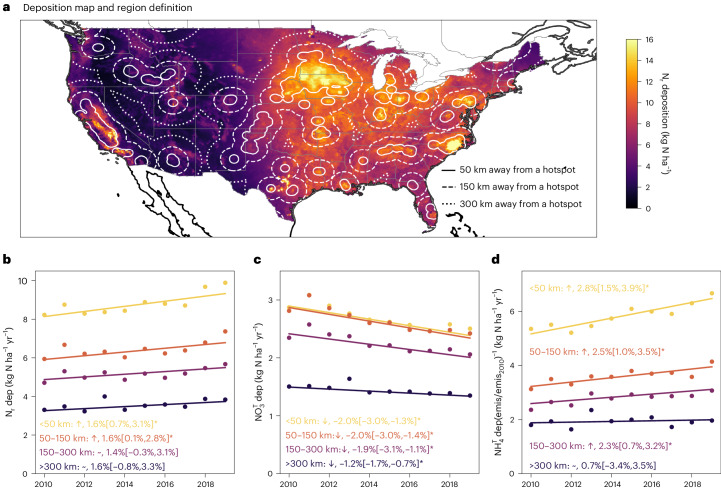
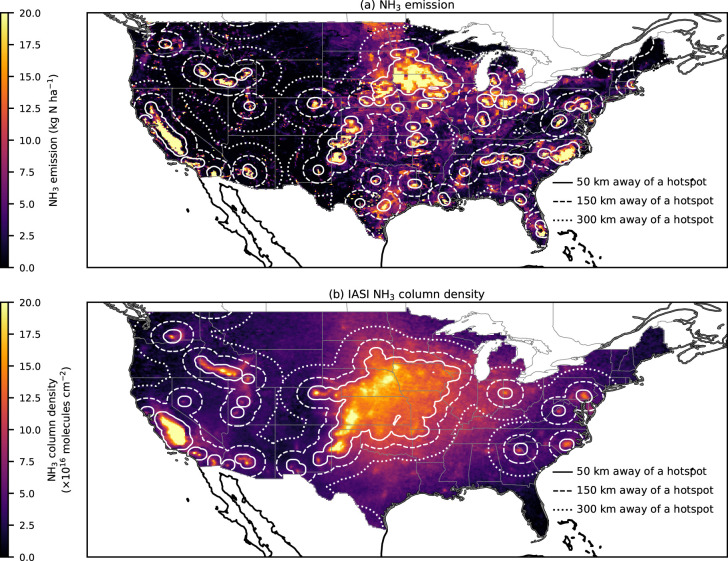
By dividing the contiguous United States into four zones according to their distances to the nearest NH3-emission hotspot (<50 km, 50–150 km, 150–300 km and >300 km), we analysed the trend of annual Nr total deposition from the ‘Total Deposition Estimates Using the Measurement Model Fusion’ (TDep MMF)34 model between 2010 and 2019 (Fig. 3a and Supplementary Text 2). Nr total deposition showed statistically significant increasing trends in areas within 150 km of an NH3-emission hotspot (Fig. 3b) and insignificant trends at >150 km from these hotspots, despite reductions in NO3T deposition (Fig. 3c). NH4T deposition increased more quickly than NH3 emissions in the corresponding zones (Fig. 3d). These results are indicative of increased NH4T near the source and probably the results of decreased and higher dry deposition rates of NH3 relative to NH4+. There are large discrepancies between the hotspots defined by NH3 emissions and those identified by satellite observations35–37 (Extended Data Fig. 6 and Supplementary Figs. 7 and 8), highlighting the need for more NH3 observations.
Fig. 3. Spatial distribution and trends of total reactive nitrogen and NH4T deposition.
a, The average annual total reactive nitrogen (Nr) deposition (dep) in the United States between 2010 and 2019. Solid, dashed and dotted lines show the boundaries of the areas within 50 km, 150 km and 300 km of an NH3-emission hotspot (Supplementary Text 2). The base map was obtained from Natural Earth. b–d, The 2010–2019 trends of annual total Nr deposition (b), NO3T deposition (c) and NH4T deposition normalized by NH3 emission (emis) (d) trends relative to the 2010 level (emis2010). The trends and relative annual change rates are determined using the Mann–Kendall test and Theil–Sen regression with a sample size of 10 (ref. 50). Numbers in the brackets are the 95% confidence intervals of the regressions (mean ± 1.96 s.d.). ‘↑’, ‘↓’ and ‘~’ indicate increasing trend, decreasing trend and no trend, respectively. *Statistically significant trend with P < 0.05 based on the Mann–Kendall test.
Extended Data Fig. 6. Differences in ammonia emission hotspots and satellite observed ammonia hotspots.
Differences in NH3 hotspots defined based on the 2017 emission inventory and satellite observations. (a) NH3 emissions and (b) NH3 column densities from the Infrared Atmospheric Sounding Interferometer (IASI). IASI NH3 column densities are derived from observations between 2008–2017 (IASI v2.2R)37. Solid, dashed, and dotted lines show the boundaries of the areas <50 km, 50–150 km, 150–300 km within an NH3 emission hotspot in panel (a) or an NH3 hotspot in panel (b). NH3 emission hotspots in panel (a) are the areas of the areas of the 95th or high NH3 emission rates in 2017 in the Contiguous US. NH3 hotspots in panel (b) are the areas of the 95th percentile NH3 column density in the Contiguous US. The base map is obtained from Natural Earth.
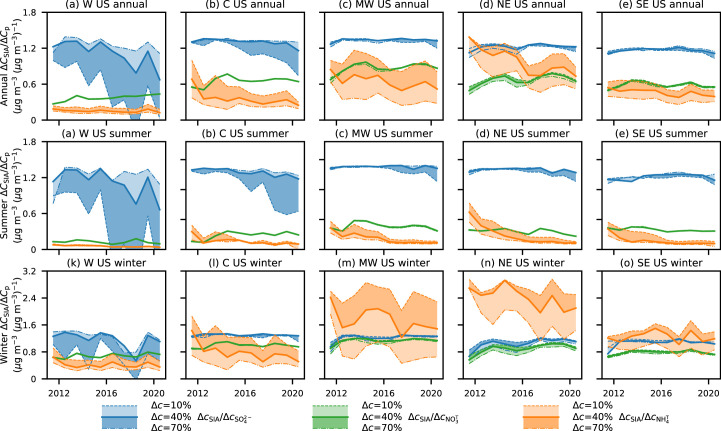
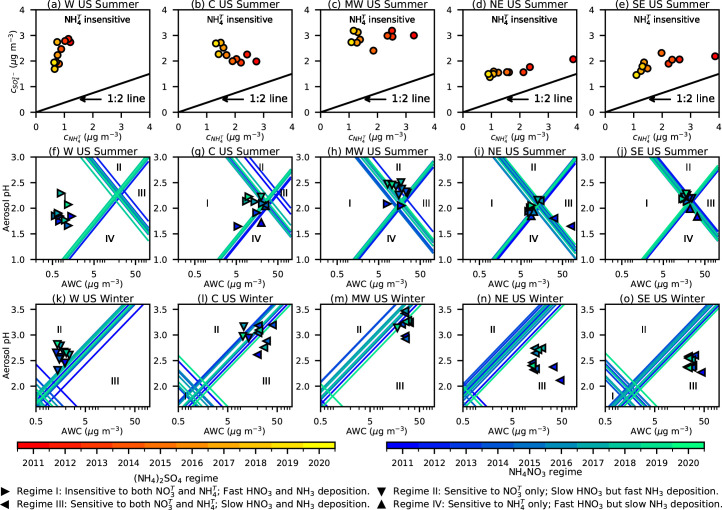
As the aerosol composition changed and NH4T partitioned less into aerosols, the SIA formation regime became less sensitive to in the rural United States (Fig. 2k–o). Although NH4NO3-containing SIA always responds to changes to some degree, a boundary is needed to distinguish NH3-sensitive and NH3-insensitive regimes to facilitate decision-making for air-quality and nitrogen-deposition purposes. Here, we define the boundary using both comparative and aerosol property-based approaches. In the comparative approach, we simulate cSIA changes () caused by 10%, 40% and 70% reductions in each precursor (, p = NH4T, NO3T or SO42−). Instead of comparing , which scales with (Supplementary Figs. 9–11), we compare , which reflects chemical and meteorological conditions more appropriately (Supplementary Text 3). A regime is considered NH3-insensitive if is smaller than and . Figure 2k–o shows with 40% reduction in each precursor, and Extended Data Fig. 7 shows with 10% and 70% reductions. With a 40% reduction, annual decreased by 2–5% per year in all regions between 2011 and 2020 (Supplementary Table 4). As a result, by 2020, SIA formation became NH3-insensitive in all regions except the Northeastern United States using the comparative approach. Seasonally, SIA formation was still NH3-sensitive in 2020 in the winter in the Midwestern, Northeastern and Southeastern United States (Extended Data Fig. 7). We found a similar regime shift trend using the aerosol property-based approach developed by Nenes and colleagues38 (Supplementary Text 3 and Extended Data Fig. 8)38. The rapid decrease in highlights the importance of the SIA formation regime change between 2011 and 2020 and indicates that NH3 controls will be less effective for PM2.5 reduction in 2020 than in 2011.
Extended Data Fig. 7. Regional means of annual, summer, and winter SIA sensitivities to precursor reductions at different levels from 2011 to 2020.
Blue, green, and orange solid lines show , , and at a reduction level of 40%, respectively. Blue, green, and orange shaded areas in the right panels represent the variabilities of , , and at reduction levels ranging from 10% (brighter areas with dashed-line boundaries) to 70% (darker areas with dotted-line boundaries).
Extended Data Fig. 8. Chemical regimes for SIA formation in summer and winter.
Panels (a)–(e) show the summer chemical regimes of (NH4)2SO4 formation. The lines in panels (a–e) indicate the condition that NH4T explicitly balances SO42− to form (NH4)2SO4 (1:2 line) for a system that is only consist of NH4T and SO42−. Above the line, reducing NH4T only removes NH3g from the system, such that. Panels (f)–(o) show NH4NO3 evaporation plays a major role. The framework of using aerosol pH and aerosol water content to determine NH4NO3 regime developed by Nenes et al.38 is used here (Text S3)20,21. The four regimes shown in panel (f)–(o) are relatively consistent when aerosol composition changes. The colour of the markers and the lines in panels (f)–(o) indicate the year.
Air quality and Nr deposition implications
Past studies have identified NH3 controls as potentially effective PM2.5 mitigation measures in the United States, because emissions have not been directly controlled and the marginal cost for low-level reductions from agricultural sources is relatively low39,40. Gu and colleagues39 argued that the US abatement cost of NH3 emissions is one-tenth the cost of NOx controls, while bringing similar welfare benefits in preventing mortality by reducing PM2.5 levels39. More broadly, of 17 studies (from 2007 to 2021) that compared the effectiveness of SO2, NOx and NH3 emission controls in the United States, eight found that controlling NH3 emissions is the most effective way to reduce PM2.5 concentrations39–41 (Supplementary Table 5 provides a full list of the studies reviewed). Because of these studies and legal action by environmental organizations, in 2016 the US Environmental Protection Agency (EPA) asked state and regional air-quality regulators to evaluate potential control measures for NH3 when designing State Implementation Plans (SIPs) for PM2.5 National Ambient Air Quality Standards (NAAQS)42. Despite the updated requirements, most relevant regulatory agencies found additional NH3-emission controls unnecessary, and only one PM2.5 NAAQS nonattainment area (Imperial County, California) included a new rule to control NH3 emissions43. For the Regional Haze Rule, which aims to restore visibility in national parks and wilderness areas in the United States, the US EPA recommends that states ignore NH3 in their SIPs44.
Our results show that the United States has missed an opportunity to more efficiently improve air quality in rural regions by controlling NH3 emissions, especially from agricultural sources, as SIA formation transitioned from more NH4T-sensitive to less NH4T-sensitive between 2011 and 2020. In the early 2010s, reducing could bring significant reductions in cSIA in all regions except the Western United States. In 2020, however, deep (40–70%) reductions would be needed to achieve reductions in annual cSIA similar to those resulting from 10–40% reductions in and in all regions except the Northeastern United States. Reducing in winter, when cSIA loadings are high, was still an effective complementary measure to SO2- and NOx-emission controls for PM2.5 reductions in 2020 in the rural Midwestern, Northeastern and Southeastern United States (Extended Data Fig. 7 and 8). However, wintertime NH3 emissions were low in these regions, especially from agricultural sources (Supplementary Table 6), and NH3-emission reductions from vehicular and industrial sources might be needed to achieve the required reductions. Recent studies have shown that NH3 emissions from mobile and industrial sources are significantly underestimated45. Finally, the shift towards an NH4T-insensitive regime and the lack of incentive for NH3 controls for air-quality purposes in the rural United States (for example, the Regional Haze Rule) are likely to continue in rural areas as climate policies increase renewable power generation and electrify transportation. SO2 and NOx emissions from fuel combustion are expected to decrease further46.
More importantly, our analyses also show that the inorganic Nr deposition regime shifted due to SO2- and NOx-emission reductions. As NOx emissions decreased, reduced-form Nr deposition became the dominant component of Nr deposition and a major concern in many sensitive ecosystems47. Our results further illustrate that deposition patterns could change as more gaseous NH3 deposits near sources rather than being converted into SIAs and being transported away, shortening the effective atmospheric lifetime of reduced forms of Nr. On the one hand, NH3 mitigation will be needed to protect sensitive ecosystems and reduce coastal eutrophication caused by increased Nr deposition near hotspots. Pan and colleagues found that 26 national parks in the United States are within 200 km of an NH3 hotspot (identified by satellite observations)35. On the other hand, increased Nr deposition, together with CO2 fertilization, has enhanced terrestrial carbon uptake, and it is unclear how the terrestrial ecosystems will respond to Nr deposition pattern and composition changes48. More flux and ecological observations are needed to investigate the multifaceted impacts of increasingly inhomogeneous Nr deposition.
Our method can be applied to routine monitoring for faster environmental policy evaluation and provides a rationale for new integrated monitoring networks in urban areas and regions impacted by enhanced wildfire and dust emissions. The integrated data and thermodynamic analysis with uncertainty estimates can also be used to improve CTMs. Our conclusions are limited to the rural United States, and urban conditions might be different. However, the approach demonstrated in this work can be used to characterize the SIA response to precursor reductions in urban regions in the United States if simultaneous observations of gaseous NH3 and HNO3, aerosol composition and meteorological conditions become available. As wildfires increase and US EPA lowers the current NAAQS for PM2.5 to 9 µg m−3 (ref. 49), the impacts on SIA formation of NVCs from dust and organic compounds from wildfires will probably become important for air-quality management in rural regions and warrants further investigation. For example, OAs are not considered in the inorganic aerosol model used in this study. Although organic acids could influence SIA formation, we do not find significant impacts of OAs on model performance, except for wildfire episodes with extremely high cOA (Extended Data Fig. 9). During those events, the model underestimates both and , which needs more examination with speciated OA observations. Finally, the benefits of collocated monitoring for aerosol composition and precursor concentrations demonstrated here should be considered in countries developing their own aerosol-monitoring networks.
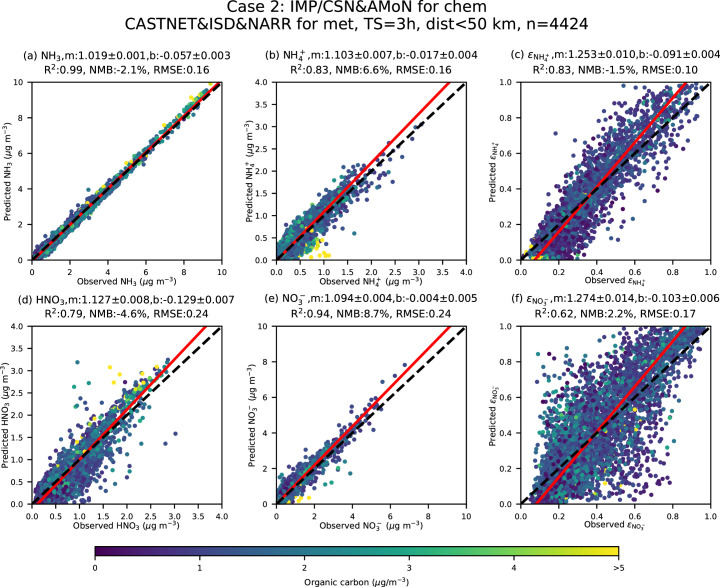
Extended Data Fig. 9. Impacts of organic compounds on ISORROPIA-II performance.
Panels (a–f) show observed and ISORROPIA-II simulated NH3, NH4+, HNO3, NO3−, , and , respectively. Inputs from CASTNET, IMPROVE, EPA CSN, AMoN, ISD, and NARR are preprocessed as described as Case 2 in Table S4 and ISRROPIA-II was run with a time step (TS) of three hours. The dots are coloured by concentrations of aerosol organic carbon from IMPROVE or EPA CSN. Red lines show orthogonal distance regression results for all data, and corresponding regression parameters and evaluation statistics are shown in panel titles. Black dashed lines show the 1:1 line. The number of samples (n = 4424) is listed in the title.
Methods
Integration of the monitoring networks of gaseous precursors, aerosol composition and meteorological conditions
Several national aerosol-monitoring networks have been created in the United States since the signing of the 1990 US Clean Air Act Amendments and the 1999 Regional Haze Rule. Those providing various suites of trace-gas precursors and chemical compositions of PMs are the Clean Air Status and Trends Network (CASTNET), the Interagency Monitoring of Protected Visual Environments (IMPROVE) network, US EPA’s PM2.5 Chemical Speciation Monitoring Network (CSN) and the Ammonia Monitoring Network (AMoN). Extended Data Fig. 1 shows the spatial distributions of their monitoring sites in 2000, 2010 and 2020. A summary of the networks is provided in the following.
CASTNET is the only network that consistently reports weekly mean concentrations of gaseous HNO3 and SO2 in the United States in addition to aerosol composition (concentrations of SO42−, NO3−, NH4+, Cl−, Na+, Ca2+, Mg2+ and K+)51,52. IMPROVE uses four separate modules to collect samples for speciated PM2.5, gravimetric PM2.5 and PM10 measurements53. Samples are collected for 24 h every third day. Concentrations of anions (, and ) are measured using ion chromatography (IC), and is reconstructed by assuming all elemental sulfur (S) and nitrogen (N) are in the forms of (NH4)2SO4 and NH4NO3 (ref. 54). This assumption could be violated when cNVC is high or the aerosol is extremely acidic. Therefore, the reconstructed has a larger uncertainty than that of CASTNET. IMPROVE also measures concentrations of trace elements, including Na, Ca, Mg and K, using energy-dispersive X-ray fluorescence (EDXRF)55. EPA CSN uses similar sampling and analysis methods as those of IMPROVE. However, unlike IMPROVE, EPA CSN analyses NH4+ and Na+ directly using IC, which is the major difference between IMPROVE and EPA CSN55. AMoN is the only network providing a consistent and long-term record of gaseous NH3 across the United States. At AMoN sites, NH3 concentrations in the air are measured by Radiello passive diffusion samplers with phosphorous acid and are reported biweekly56.
The potential biases and observation precisions of the networks are summarized in Supplementary Table 7. There are two critical issues that could affect model simulation and validation. First, Lavery and colleagues52 found that CASTNET could overestimate by 5% and underestimate by 15%, because NH4NO3 could volatilize from the Nylon filter. However, is generally conserved. Therefore, the biases only impact observed and are unlikely to influence model simulation. Second, Puchalski and colleagues57 reported a mean relative negative bias of 10% for from AMoN. Adjusting this potential bias, however, does not change trend analyses, and its impacts on model simulation will be discussed later (aerosol thermodynamic modelling) with sensitivity tests.
Only a fraction of CASTNET sites provide meteorological observations, which are also critical for thermodynamic analyses. CASTNET sites sponsored by the US EPA were terminated in 2011 to support AMoN operations. Consequently, there was no overlap between NH3 and temperature (T) and relative humidity (RH) observations for these sites. Therefore, meteorological observations from the Integrated Surface Database (ISD) are also included in the integration, which consists of global hourly and synoptic observations compiled from numerous sources58. However, there are still gaps in T (12%) and RH (15%) observations, and 2-m data from the North American Regional Reanalysis (NARR) with a resolution of 32 km are used to fill the gap.
To integrate the monitoring networks, we first identified the spatial window for collocation determination by comparing , and observations from the CASTNET, IMPROVE and EPA CSN sites as well as T and RH observations from CASTNET and ISD located within 10, 25, 50 and 100 km of each other (Supplementary Figs. 1 and 12 and Supplementary Table 8). , and from different monitoring networks generally agreed, and no significant difference was found with different spatial windows. However, T and RH from CASTNET and ISD significantly differ when a spatial window of 100 km is used. Therefore, a spatial window of 50 km was selected for observation integration. With this spatial window, we found 68 AMoN sites with at least CASTNET and ISD sites located within 50 km. Combining observations from these three networks provided all the inputs needed for aerosol thermodynamic modelling. All observations were averaged biweekly to match the start and end dates of AMoN observations, as it has the lowest sampling frequency.
Sites with integrated observations are shown in Fig. 1a. The black and red crosses in Fig. 1a are sites established before and after 2015, respectively. The sites are grouped according to the five US Regional Planning Organizations (RPOs): the Western Regional Air Partnership (WRAP), the Central States Air Resource Agencies (CENSARA), the Lake Michigan Air Directors Consortium (LADCO), the Mid-Atlantic/Northeast Visibility Union (MANE-VU) and the Southeastern Air Pollution Control Agencies (SESARM). These RPOs help state and county agencies develop regional strategies to achieve their air-quality goals. Here, these RPOs are referred to as the Western (WRAP), Central (CENSARA), Midwestern (LADCO), Northeastern (MANE-VU) and Southeastern (SESARM) United States, respectively. Observations from each site are shown in Supplementary Figs. 13–17. Annual numbers of biweekly observations are listed in Supplementary Table 2. Only sites with more than 70% seasonal coverage since establishment are included in the following analyses. Excluding the sites established after 2015 does not change our trend analyses (Extended Data Fig. 3, Supplementary Fig. 3 and Supplementary Table 4) and therefore the simulation results or conclusions. The regional Mann–Kendall test was used to derive consistent regional trends30, and only statistically significant trends (P < 0.05) are reported (Supplementary Table 4).
Although the sites are considered rural, they are generally representative of regional population density and emissions, especially in the Midwestern and Northeastern United States (Supplementary Table 2). Sites in the Western and Central United States are slightly more remote, with lower-than-average population densities and SO2 and NOx emissions. Although some AMoN sites have been reported to be impacted by nearby agricultural emission sources37,59, they are not collocated with CASTNET sites. About 50% of SO2 emissions in the United States came from power plants and were mostly located in rural regions in 201725. Highway vehicle emissions accounted for one-third of NOx emissions in 2017, which were spread across the United States. In 2017, 10% and 5% of NOx emissions were related to power generation and oil and gas production outside urban areas25. Therefore, the majority of the rural sites discussed in this study are representative of regional conditions.
Aerosol thermodynamic modelling
We use ISORROPIA-II, a full thermodynamic model for inorganic aerosol formation, to simulate the aerosol properties and sensitivities of SIA formation to precursors. , , , , , , , T and RH from the integrated dataset are used as inputs to ISORROPIA-II. The model is run in the ‘forward mode’ to simulate gas–particle partitionings of NH4T and NO3T. Although ISORROPIA-II has been validated with observations from intensive field campaigns, using it with biweekly averaged observations from monitoring networks has not been tested before and requires careful evaluation. We conducted nine case studies to investigate the impacts of measurement biases and low temporal resolutions (Supplementary Table 3). Following refs. 21 and 12, we evaluated the model performance by comparing simulated and observed partitionings of NH4T and NO3T.
The simulation results shown in this study include preprocessing of the integrated observations from the monitoring networks (case 1, Extended Data Fig. 2), because running ISORROPIA-II with raw CASTNET inputs and a time step of two weeks (case 3, Supplementary Fig. 18) leads to large errors in both and .
CASTNET utilizes an open-face filter and collects both fine- and coarse-mode aerosols. Because ISORROPIA-II does not consider aerosol size and its mixing state31, using , , and observations from CASTNET directly could cause an overestimation of and an underestimation of . Replacing CASTNET observations of NVCs and Cl− with those from IMPROVE/CSN (case 2, Extended Data Fig. 9), which use an aerodynamic filter to collect PM2.5 samples, reduces the NMB of from −28% (case 4, Supplementary Fig. 19) to −2%. However, not all sites have collocated IMPROVE or CSN sites. Therefore, in the default preprocessing (case 1), CASTNET observations of , , and are scaled using the orthogonal distance regressions (ODRs) between concentrations of the corresponding elements or ions measured by IMPROVE or EPA CSN and those measured by CASTNET. When there is no collocated IMPROVE or EPA CSN in a site or the correlation is weak (r < 0.3 or P > 0.05), the regression result from the closest site that meets the requirements is used (Supplementary Fig. 20).
Case 2 also provides an opportunity to investigate the impacts of OAs on model performance, because IMPROVE and CSN report concentrations of organic carbon in PM2.5 (Extended Data Fig. 9). ISORROPIA-II overestimated gaseous NH3 and HNO3 but underestimated NH4+ and NO3− during periods with high concentrations of organic carbon (>5 µg m−3). These periods also have high cK, indicating they originated from biomass burning60. ISORROPIA-II failing to reproduce and might be because the observations were averaged biweekly and could not capture the rapidly changing conditions when wildfire plumes passed by the sites or both NH4+ and NO3− were combined with OAs. It is also unclear how the increased OAs from wildfires affect aerosol acidity. More observations are needed to investigate the impacts of OAs.
A lack of daily and diel variations of T and RH leads to significant underestimation of (case 5, Supplementary Fig. 21), with an NMB of −13% and an ODR slope of 1.63. Thus, for all case studies except for cases 3 and 5, ISORROPIA-II was run with a time step of 3 h to reflect the diel patterns of T and RH, while , , , and at each time step were the same as their biweekly average. The impacts of the diel patterns of the chemical inputs are considered in cases 6 (Supplementary Fig. 22) and 7 (Supplementary Fig. 23), which moderately improve the model performance. However, they were not used in the default case because they require additional empirical assumptions. Cases 8 (Supplementary Fig. 24) and 9 (Supplementary Fig. 25) show that potential sampling biases do not affect model evaluation.
Additional simulations were conducted with 10%, 40% and 70% reductions in , and from default preprocessing to derive , and . We compare to determine the effectiveness of controlling different precursors instead of directly (Supplementary Figs. 9–11), because is determined mostly by the SIA formation regime, whereas also depends on the precursor concentration when a fractional reduction is considered. Simulated results for each site are shown in Supplementary Figs. 26–30. Regional results are summarized in Supplementary Tables 9–20.
Simulation uncertainties related to observation precisions and detection limits (Supplementary Table 7) were estimated using a Monte Carlo approach. Observation uncertainties were calculated using the corresponding precisions unless the absolute values were smaller than their detection limits, in which case the uncertainties were set to the detection limits. Additional uncertainties (100%) were added to NVCs to account for uncertainties introduced by the scaling processes. Assuming that the observation uncertainties are independent of each other and are normally distributed, we generated 1,000 sets of inputs randomly for the default preprocessing (case 1) and ran ISORROPIA-II 1,000 times. For , and , 500 simulations were conducted for each reduction level. The 2.5th and 97.5th percentiles of the simulated results were used as the lower and upper bounds (LB and UB) of uncertainties. The mean relative LB and UB uncertainties of all sites were −21% and 28% for simulated and −21% and 22% for simulated . The relative LB and UB uncertainties for were much larger than those of the observed (−6% and 6% on average), highlighting that NO3T partitioning is very sensitive to input errors. The regional mean uncertainties are summarized in Supplementary Tables 9–20.
Aerosol pH
Aerosol acidity is a critical characteristic of the multiphase system61. Aerosol acidity, together with AWC, drives partitionings of the NH4T and NO3T. Directly measuring aerosol acidity and AWC is challenging31. Chemical transport models have been used to simulate aerosol pH in the United States and globally16,32. Thermodynamic models have also been used to estimate aerosol pH based on simultaneous observations of gas and particle compositions in California, northeastern United States, southeastern United States and southeastern Canada12,22,23,27. Here we estimate aerosol pH using ISORROPIA-II with the integrated dataset for the rural United States from 2011 to 2020. Aerosol pH is calculated as
| 1 |
where and are the molality-based activity coefficient and molality (mol per kg water) of hydrogen ions, respectively. is assumed to be unity in ISORROPIA-II when single-ion activities for H+ are required, introducing only minor uncertainties.
Guo and colleagues21 have shown the validity of using ISORROPIA-II with high-frequency in situ measurements from intensive field campaigns, and this method has been used to study aerosol composition and acidity changes around the world12,62,63. However, comparisons of pH estimated by different thermodynamic models showed that relatively constant biases exist, which should not affect the trend analyses shown here31,64. In addition to the assumption of , the pH simulated in this study could be slightly biased because the model only considers inorganic compounds. Previous studies have shown that organic compounds only have minor impacts on aerosol pH in the Southeastern United States where concentrations of organic compounds are high12,21.
To understand the drivers of aerosol pH trends, we use a first-order approximation to attribute contributions of each factor to pH changes annually. For a site at time t of the year (for example, 1 January 2012, 3:00), the inputs to ISORROPIA-II are , , , , , Tt and , and change by , , , , , and in a year (that is, at 1 January 2013, 3:00). Then, the change in pH resulting from the change in an input variable (v; ) is estimated as a sum of pH changes caused by the same variable but with a smaller change (10% of the annual change):
| 2 |
Estimating using equation (2) minimizes the nonlinear pH response to chemical regime shift due to large changes in input variables. We calculate the annual mean contribution of a variable (ΔpHv) to the annual mean pH change (ΔpH) as the time average of equation (2). We estimate the error of this attribution method as
| 3 |
The results for each site are shown in Supplementary Figs. 31–35. The results shown in Extended Data Fig. 4 are cumulative contributions for 2011–2015, 2016–2020 and 2011–2020.
Aerosol pH buffering capacities of HSO4−/SO42−, HNO3/NO3− and NH4+/NH3 acid–base conjugate pairs were also estimated using the multiphase buffer theory developed by Zheng and colleagues32. The buffering capacity is defined as the ratio between the amount of acid or base added to the system (nacid or nbase in moles per kg solution) and the associated pH change. The analytical expression for the buffering capacity in an aerosol multiphase buffer system is
| 4 |
where and are the molar masses of H+ and OH−, ci is the total concentration of the buffering agent in µmol per m3 air, and only HSO4−/SO42−, HNO3/NO3− and NH4+/NH3 are considered. The effective acid dissociation constant, (in µmol m−3), is
| 5 |
where Ka, BOH and Ka, HA are the liquid-phase acid dissociation constant for BOH and HA expressed in molality32, Hi is the Henry’s law constant for BOH or HA in molality (mol kg−1 atm−1)32, and the contributions of HSO4−/SO42−, HNO3/NO3− and NH4+/NH3 acid–base conjugate pairs to the total buffering capacity can be expressed as
| 6 |
Reporting summary
Further information on research design is available in the Nature Portfolio Reporting Summary linked to this Article.
Online content
Any methods, additional references, Nature Portfolio reporting summaries, source data, extended data, supplementary information, acknowledgements, peer review information; details of author contributions and competing interests; and statements of data and code availability are available at 10.1038/s41561-024-01455-9.
Supplementary information
Supplementary text 1–3, Figs. 1–35 and Tables 1–20.
Acknowledgements
This work is supported by the High Meadows Environmental Institute–Science, Technology and Environmental Policy (HMEI-STEP) Fellowship Program and the NASA Health and Air Quality Applied Sciences team (NASA NNX16AQ90G). The views are those of the authors alone and do not necessarily reflect the views and policies of the US National Park Service and the US Environmental Protection Agency.
Extended data
Author contributions
D.P., D.L.M. and M.A.Z. designed the study. D.P., R.W. and X.G. integrated the observations. D.P., M.P., Y.G., A.P.S., B.A.S. and J.L.C. analysed and interpreted the observations. D.P. and S.S. conducted aerosol thermodynamic modelling. D.P. and D.T. analysed and interpreted emission data. D.P., D.L.M., J.L.C. and M.A.Z. wrote the paper, with input from all the other authors.
Peer review
Peer review information
Nature Geoscience thanks the anonymous reviewers for their contribution to the peer review of this work. Primary Handling Editor: Xujia Jiang, in collaboration with the Nature Geoscience team.
Data availability
The integrated observation data that support the findings of this study and the source data for figures presented in the main text, Extended Data and Supplementary Information are available in Dryad with the identifier 10.5061/dryad.zpc866tg3 (ref. 65).
Code availability
The ISORROPIA-II model is available at https://nenes.eas.gatech.edu/ISORROPIA/index_old.html.
Competing interests
The authors declare no competing interests.
Footnotes
Publisher’s note Springer Nature remains neutral with regard to jurisdictional claims in published maps and institutional affiliations.
Contributor Information
Da Pan, Email: da.pan@colostate.edu.
Mark A. Zondlo, Email: mzondlo@princeton.edu
Extended data
is available for this paper at 10.1038/s41561-024-01455-9.
Supplementary information
The online version contains supplementary material available at 10.1038/s41561-024-01455-9.
References
- 1.Bellouin N, et al. Aerosol forcing in the Climate Model Intercomparison Project (bCMIP5) simulations by HadGEM2-ES and the role of ammonium nitrate. J. Geophys. Res. Atmos. 2011;116:D20206. doi: 10.1029/2011JD016074. [DOI] [Google Scholar]
- 2.Heal MR, Kumar P, Harrison RM. Particles, air quality, policy and health. Chem. Soc. Rev. 2012;41:6606–6630. doi: 10.1039/c2cs35076a. [DOI] [PubMed] [Google Scholar]
- 3.Myhre, G. et al. in Climate Change 2013: the Physical Science Basis Ch. 8, 659–740 (Cambridge Univ. Press, 2014).
- 4.Pope Iii CA, et al. Lung cancer, cardiopulmonary mortality and long-term exposure to fine particulate air pollution. JAMA. 2002;287:1132–1141. doi: 10.1001/jama.287.9.1132. [DOI] [PMC free article] [PubMed] [Google Scholar]
- 5.Seinfeld, J. H. & Pandis, S. N. Atmospheric Chemistry and Physics, from Air Pollution to Climate Change (Wiley, 1997).
- 6.Zhang L, et al. A database of modeled gridded dry deposition velocities for 45 gaseous species and three particle size ranges across North America. J. Environ. Sci. 2023;127:264–272. doi: 10.1016/j.jes.2022.05.030. [DOI] [PubMed] [Google Scholar]
- 7.Nenes A, et al. Aerosol acidity and liquid water content regulate the dry deposition of inorganic reactive nitrogen. Atmos. Chem. Phys. 2021;21:6023–6033. doi: 10.5194/acp-21-6023-2021. [DOI] [Google Scholar]
- 8.Clark CM, Tilman D. Loss of plant species after chronic low-level nitrogen deposition to prairie grasslands. Nature. 2008;451:712–715. doi: 10.1038/nature06503. [DOI] [PubMed] [Google Scholar]
- 9.Phoenix GK, et al. Impacts of atmospheric nitrogen deposition: responses of multiple plant and soil parameters across contrasting ecosystems in long‐term field experiments. Glob. Change Biol. 2012;18:1197–1215. doi: 10.1111/j.1365-2486.2011.02590.x. [DOI] [Google Scholar]
- 10.Holtgrieve GW, et al. A coherent signature of anthropogenic nitrogen deposition to remote watersheds of the northern hemisphere. Science. 2011;334:1545–1548. doi: 10.1126/science.1212267. [DOI] [PubMed] [Google Scholar]
- 11.Janssens I, et al. Reduction of forest soil respiration in response to nitrogen deposition. Nat. Geosci. 2010;3:315–322. doi: 10.1038/ngeo844. [DOI] [Google Scholar]
- 12.Weber RJ, Guo H, Russell AG, Nenes A. High aerosol acidity despite declining atmospheric sulfate concentrations over the past 15 years. Nat. Geosci. 2016;9:282–285. doi: 10.1038/ngeo2665. [DOI] [Google Scholar]
- 13.Zhang L, et al. Nitrogen deposition to the United States: distribution, sources and processes. Atmos. Chem. Phys. 2012;12:4539–4554. doi: 10.5194/acp-12-4539-2012. [DOI] [Google Scholar]
- 14.Luo G, Yu F, Moch JM. Further improvement of wet process treatments in GEOS-Chem v12. 6.0: impact on global distributions of aerosols and aerosol precursors. Geosci. Model Dev. 2020;13:2879–2903. doi: 10.5194/gmd-13-2879-2020. [DOI] [Google Scholar]
- 15.Yahya K, Wang K, Gudoshava M, Glotfelty T, Zhang Y. Application of WRF/Chem over North America under the AQMEII Phase 2: Part I. Comprehensive evaluation of 2006 simulation. Atmos. Environ. 2015;115:733–755. doi: 10.1016/j.atmosenv.2014.08.063. [DOI] [Google Scholar]
- 16.Chen Y, Shen H, Russell AG. Current and future responses of aerosol pH and composition in the US to declining SO2 emissions and increasing NH3 emissions. Environ. Sci. Technol. 2019;53:9646–9655. doi: 10.1021/acs.est.9b02005. [DOI] [PubMed] [Google Scholar]
- 17.Shah V, et al. Chemical feedbacks weaken the wintertime response of particulate sulfate and nitrate to emissions reductions over the eastern United States. Proc. Natl Acad. Sci. USA. 2018;115:8110–8115. doi: 10.1073/pnas.1803295115. [DOI] [PMC free article] [PubMed] [Google Scholar]
- 18.Heald CL, et al. Atmospheric ammonia and particulate inorganic nitrogen over the United States. Atmos. Chem. Phys. 2012;12:10295–10312. doi: 10.5194/acp-12-10295-2012. [DOI] [Google Scholar]
- 19.Holt J, Selin NE, Solomon S. Changes in inorganic fine particulate matter sensitivities to precursors due to large-scale US emissions reductions. Environ. Sci. Technol. 2015;49:4834–4841. doi: 10.1021/acs.est.5b00008. [DOI] [PubMed] [Google Scholar]
- 20.Bash JO, Cooter EJ, Dennis RL, Walker JT, Pleim JE. Evaluation of a regional air-quality model with bidirectional NH3 exchange coupled to an agroecosystem model. Biogeosciences. 2013;10:1635–1645. doi: 10.5194/bg-10-1635-2013. [DOI] [Google Scholar]
- 21.Guo H, et al. Fine-particle water and pH in the southeastern United States. Atmos. Chem. Phys. 2015;15:5211–5228. doi: 10.5194/acp-15-5211-2015. [DOI] [Google Scholar]
- 22.Guo H, et al. Fine particle pH and gas-particle phase partitioning of inorganic species in Pasadena, California, during the 2010 CalNex campaign. Atmos. Chem. Phys. 2017;17:5703–5719. doi: 10.5194/acp-17-5703-2017. [DOI] [Google Scholar]
- 23.Guo H, et al. Fine particle pH and the partitioning of nitric acid during winter in the northeastern United States. J. Geophys. Res. Atmos. 2016;121:10,355–310,376. doi: 10.1002/2016JD025311. [DOI] [Google Scholar]
- 24.Center for International Earth Science Information Network (CIESIN) Revision 11 (NASA Socioeconomic Data and Applications Center, 2018).
- 25.Foley KM, et al. 2002–2017 anthropogenic emissions data for air quality modeling over the United States. Data Brief. 2023;47:109022. doi: 10.1016/j.dib.2023.109022. [DOI] [PMC free article] [PubMed] [Google Scholar]
- 26.Fountoukis C, Nenes A. ISORROPIA II: a computationally efficient thermodynamic equilibrium model for K+-Ca2+-Mg2+-NH4+-Na+-SO42−-NO3−-Cl−-H2O aerosols. Atmos. Chem. Phys. 2007;7:4639–4659. doi: 10.5194/acp-7-4639-2007. [DOI] [Google Scholar]
- 27.Tao Y, Murphy JG. The sensitivity of PM2.5 acidity to meteorological parameters and chemical composition changes: 10-year records from six Canadian monitoring sites. Atmos. Chem. Phys. 2019;19:9309–9320. doi: 10.5194/acp-19-9309-2019. [DOI] [Google Scholar]
- 28.Air Pollutant Emissions Trends Data Air Pollutant Emissions Trends Data (US EPA, 2023).
- 29.Hand JL, Prenni AJ, Schichtel BA. Trends in seasonal mean speciated aerosol composition in remote areas of the United States from 2000 through 2021. J. Geophys. Res. Atmos. 2023;129:e2023JD039902. doi: 10.1029/2023JD039902. [DOI] [Google Scholar]
- 30.Helsel DR, Frans LM. Regional Kendall test for trend. Environ. Sci. Technol. 2006;40:4066–4073. doi: 10.1021/es051650b. [DOI] [PubMed] [Google Scholar]
- 31.Pye HO, et al. The acidity of atmospheric particles and clouds. Atmos. Chem. Phys. 2020;20:4809–4888. doi: 10.5194/acp-20-4809-2020. [DOI] [PMC free article] [PubMed] [Google Scholar]
- 32.Zheng G, et al. Multiphase buffer theory explains contrasts in atmospheric aerosol acidity. Science. 2020;369:1374–1377. doi: 10.1126/science.aba3719. [DOI] [PubMed] [Google Scholar]
- 33.Thurston GD, Chen LC, Campen M. Particle toxicity’s role in air pollution. Science. 2022;375:506. doi: 10.1126/science.abn4481. [DOI] [PubMed] [Google Scholar]
- 34.National Atmospheric Deposition Program; https://nadp.slh.wisc.edu/
- 35.Pan D, et al. Ammonia dry deposition in an alpine ecosystem traced to agricultural emission hotpots. Environ. Sci. Technol. 2021;55:7776–7785. doi: 10.1021/acs.est.0c05749. [DOI] [PubMed] [Google Scholar]
- 36.Van Damme M, et al. Industrial and agricultural ammonia point sources exposed. Nature. 2018;564:99–103. doi: 10.1038/s41586-018-0747-1. [DOI] [PubMed] [Google Scholar]
- 37.Wang R, et al. Monthly patterns of ammonia over the contiguous United States at 2‐km resolution. Geophys. Res. Lett. 2021;48:e2020GL090579. doi: 10.1029/2020GL090579. [DOI] [PMC free article] [PubMed] [Google Scholar]
- 38.Nenes A, Pandis SN, Weber RJ, Russell A. Aerosol pH and liquid water content determine when particulate matter is sensitive to ammonia and nitrate availability. Atmos. Chem. Phys. 2020;20:3249–3258. doi: 10.5194/acp-20-3249-2020. [DOI] [Google Scholar]
- 39.Gu B, et al. Abating ammonia is more cost-effective than nitrogen oxides for mitigating PM2.5 air pollution. Science. 2021;374:758–762. doi: 10.1126/science.abf8623. [DOI] [PubMed] [Google Scholar]
- 40.Lee CJ, et al. Response of global particulate-matter-related mortality to changes in local precursor emissions. Environ. Sci. Technol. 2015;49:4335–4344. doi: 10.1021/acs.est.5b00873. [DOI] [PubMed] [Google Scholar]
- 41.Lelieveld J, Evans JS, Fnais M, Giannadaki D, Pozzer A. The contribution of outdoor air pollution sources to premature mortality on a global scale. Nature. 2015;525:367–371. doi: 10.1038/nature15371. [DOI] [PubMed] [Google Scholar]
- 42.US EPA. Fine particulate matter national ambient air quality standards: state implementation plan requirements. Fed. Register. 2016;81:FR 58009. [Google Scholar]
- 43.State Implementation Plan for the Imperial County 12 µg/m3PM2.5 Annual Standard (California Air Resources Board, 2018).
- 44.Tsirigotis, P. Guidance on Regional Haze State Implementation Plans for the Second Implementation Period (US EPA, 2019).
- 45.Chen Z-L, et al. Significant contributions of combustion-related sources to ammonia emissions. Nat. Commun. 2022;13:7710. doi: 10.1038/s41467-022-35381-4. [DOI] [PMC free article] [PubMed] [Google Scholar]
- 46.Gidden MJ, et al. Global emissions pathways under different socioeconomic scenarios for use in CMIP6: a dataset of harmonized emissions trajectories through the end of the century. Geosci. Model Dev. 2019;12:1443–1475. doi: 10.5194/gmd-12-1443-2019. [DOI] [Google Scholar]
- 47.Li Y, et al. Increasing importance of deposition of reduced nitrogen in the United States. Proc. Natl Acad. Sci. USA. 2016;113:5874–5879. doi: 10.1073/pnas.1525736113. [DOI] [PMC free article] [PubMed] [Google Scholar]
- 48.O’sullivan M, et al. Process-oriented analysis of dominant sources of uncertainty in the land carbon sink. Nat. Commun. 2022;13:4781. doi: 10.1038/s41467-022-32416-8. [DOI] [PMC free article] [PubMed] [Google Scholar]
- 49.US EPA. Reconsideration of the national ambient air quality standards for particulate matter. Fed. Register. 2024;89:FR 16202. [Google Scholar]
- 50.Sen PK. Estimates of the regression coefficient based on Kendall’s tau. J. Am. Stat. Assoc. 1968;63:1379–1389. doi: 10.1080/01621459.1968.10480934. [DOI] [Google Scholar]
- 51.US Environmental Protection Agency Clean Air Markets Division; https://campd.epa.gov/
- 52.Lavery TF, Rogers CM, Baumgardner R, Mishoe KP. Intercomparison of clean air status and trends network nitrate and nitric acid measurements with data from other monitoring programs. J. Air Waste Manag. Assoc. 2009;59:214–226. doi: 10.3155/1047-3289.59.2.214. [DOI] [PubMed] [Google Scholar]
- 53.The Federal Land Manager Environmental Database; https://views.cira.colostate.edu/fed/
- 54.Malm WC, Sisler JF, Huffman D, Eldred RA, Cahill TA. Spatial and seasonal trends in particle concentration and optical extinction in the United States. J. Geophys. Res. Atmos. 1994;99:1347–1370. doi: 10.1029/93JD02916. [DOI] [Google Scholar]
- 55.Solomon PA, et al. US national PM2.5 chemical speciation monitoring networks—CSN and IMPROVE: description of networks. J. Air Waste Manag. Assoc. 2014;64:1410–1438. doi: 10.1080/10962247.2014.956904. [DOI] [PubMed] [Google Scholar]
- 56.Puchalski MA, et al. Passive ammonia monitoring in the United States: comparing three different sampling devices. J. Environ. Monit. 2011;13:3156–3167. doi: 10.1039/c1em10553a. [DOI] [PubMed] [Google Scholar]
- 57.Puchalski M, et al. A statistical comparison of active and passive ammonia measurements collected at Clean Air Status and Trends Network (CASTNET) sites. Environ. Sci. Process Impacts. 2015;17:358–369. doi: 10.1039/C4EM00531G. [DOI] [PubMed] [Google Scholar]
- 58.Smith A, Lott N, Vose R. The integrated surface database: recent developments and partnerships. Bull. Am. Meteorol. Soc. 2011;92:704–708. doi: 10.1175/2011BAMS3015.1. [DOI] [Google Scholar]
- 59.Nair AA, Yu F, Luo G. Spatioseasonal variations of atmospheric ammonia concentrations over the United States: comprehensive model‐observation comparison. J. Geophys. Res. Atmos. 2019;124:6571–6582. doi: 10.1029/2018JD030057. [DOI] [Google Scholar]
- 60.Pachon JE, Weber RJ, Zhang X, Mulholland JA, Russell AG. Revising the use of potassium (K) in the source apportionment of PM2.5. Atmos. Pollut. Res. 2013;4:14–21. doi: 10.5094/APR.2013.002. [DOI] [Google Scholar]
- 61.Tilgner A, et al. Acidity and the multiphase chemistry of atmospheric aqueous particles and clouds. Atmos. Chem. Phys. 2021;21:13483–13536. doi: 10.5194/acp-21-13483-2021. [DOI] [PMC free article] [PubMed] [Google Scholar]
- 62.Cheng Y, et al. Reactive nitrogen chemistry in aerosol water as a source of sulfate during haze events in China. Sci. Adv. 2016;2:e1601530. doi: 10.1126/sciadv.1601530. [DOI] [PMC free article] [PubMed] [Google Scholar]
- 63.Guo H, et al. Effectiveness of ammonia reduction on control of fine particle nitrate. Atmos. Chem. Phys. 2018;18:12241–12256. doi: 10.5194/acp-18-12241-2018. [DOI] [Google Scholar]
- 64.Peng X, et al. Detailed analysis of estimated pH, activity coefficients and ion concentrations between the three aerosol thermodynamic models. Environ. Sci. Technol. 2019;53:8903–8913. doi: 10.1021/acs.est.9b00181. [DOI] [PubMed] [Google Scholar]
- 65.Pan, Da et al. Regime shift in secondary inorganic aerosol formation and nitrogen deposition in the rural US. Dryad10.5061/dryad.zpc866tg3 (2024).
- 66.Tessum C, Hill J, Marshall J. Twelve-month, 12 km resolution North American WRF-Chem v3.4 air quality simulation: performance evaluation. Geosci. Model Dev. 2015;8:957–973. doi: 10.5194/gmd-8-957-2015. [DOI] [Google Scholar]
Associated Data
This section collects any data citations, data availability statements, or supplementary materials included in this article.
Supplementary Materials
Supplementary text 1–3, Figs. 1–35 and Tables 1–20.
Data Availability Statement
The integrated observation data that support the findings of this study and the source data for figures presented in the main text, Extended Data and Supplementary Information are available in Dryad with the identifier 10.5061/dryad.zpc866tg3 (ref. 65).
The ISORROPIA-II model is available at https://nenes.eas.gatech.edu/ISORROPIA/index_old.html.


