

Abstract
We assessed factors determining the tissue-specific bioactivation of ProTide prodrugs by comparing the disposition and activation of remdesivir (RDV), its methylpropyl and isopropyl ester analogs (MeRDV and IsoRDV), the oral prodrug GS-621763, and the parent nucleotide GS-441524 (Nuc). RDV and MeRDV yielded more active metabolite remdesivir-triphosphate (RDV-TP) than IsoRDV, GS-621763, and Nuc in human lung cell models due to superior cell permeability and higher susceptivity to CathepsinA. Intravenous administration in mice showed that RDV and MeRDV delivered significantly more RDV-TP to the lung than other compounds. Nevertheless, all four ester prodrugs exhibited very low oral bioavailability (< 2%), with Nuc being the predominant metabolite in blood. In conclusion, ProTides, such as RDV and MeRDV, are more efficient in delivering active metabolites to the lung than Nuc, driven by high cell permeability and susceptivity to CathepsinA. Optimizing ProTides’ ester structures is an effective strategy to enhance prodrug activation in the lung.
Introduction
Nucleoside analogs are an essential class of antivirals. All nucleoside analogs exert their antiviral activity through their triphosphate nucleoside metabolites (TP-Nuc), which are formed in the intracellular space. Nucleoside analogs usually have two limitations in generating TP-Nuc in cells: limited cell membrane permeability and slow first phosphorylation1–2. When applying nucleoside analogs for pulmonary infections like COVID-19, how to efficiently deliver antiviral active metabolites into the lung is essential because stopping a pandemic requires an effective antiviral treatment as early as possible, usually within five days after infection3.
There are mainly two prodrug design strategies to boost the cell membrane permeability and bioavailability of nucleoside analogs: one is covering the hydrophilic groups like hydroxyl groups (-OH) on the ribose sugar moiety with ester moieties, which will improve the lipophilicity4–5. An example employing this strategy is GS-621763, which covers the three −OH with isopropyl esters6–7. In this case, the parent nucleoside analog GS-441524 (Nuc) itself is the major compound present in the systemic circulation after oral administration because the liver has abundant esterases that can cleave ester moieties and thus convert an ester prodrug back to Nuc4–5, 7. Another strategy is using monophosphate nucleoside (MP-Nuc) as the start point and adding ester and other hydrophobic moieties to cover the −OH on the phosphate group, such as the nucleoside phosphoramidate (ProTide) prodrug. ProTides can load MP-Nuc into cells after ester hydrolysis by intracellular esterases, bypassing the slow and rate-limiting first phosphorylation step that is needed for Nuc. This work will investigate which prodrug form is more favorable for treating pulmonary infections and provide evidence for optimizing the bioactivation of other antiviral nucleoside analogs in the lung.
An example of a ProTide prodrug is remdesivir (RDV), the first antiviral drug approved by the FDA for COVID-19 treatment. RDV loads monophosphate-RDV (RDV-MP) intracellularly after its ester hydrolyzed by carboxylesterase 1 (CES1) and cathepsin A (CTSA), and its P-N bond cleaved by human histidine triad nucleotide binding protein-1 (HINT1)1–2 (Fig. 1). RDV showed potent antiviral activity against SARS-CoV-2 in cell lines and preclinical species8–9, and retained potent antiviral activity against later on emerged SARS-CoV-2 variants (e.g., Delta, Lambda, Omicron)10. RDV showed significantly stronger anti-SARS-CoV-2 activity than its non-prodrug form, GS-441524 (Nuc), in various cell models1.
Fig. 1.

Despite these preclinical advantages, the results of RDV clinical trials in treating patients with COVID-19 varied. The clinical study ACTT-1 (NCT 04280705) showed superior effects of RDV than placebo in shortening the time to recovery, symptom improvement, and controlling mortality11. However, several other clinical trials12–14 failed to find statistically significant clinical benefits of RDV compared with the control group. The reasons why RDV’s potent anti-SARS-CoV-2 activity cannot be reflected in clinical outcomes remain obscure. Several scholars pointed out that the limited efficacy of RDV in patients could result from its premature hydrolysis in human plasma15–17. RDV has a relatively poor plasma stability with a half-life of 69 min in human plasma ex vivo18. Previously, the premature hydrolysis of RDV in the human plasma was thought to reduce the plasma concentration of RDV significantly and generate less effective downstream metabolites, the alanine metabolite (GS-704277, Ala) and Nuc, with Nuc being the predominant metabolite detected in human plasma after intravenous (IV) infusion of RDV.19 Yan et al. assumed that RDV’s hydrolytic metabolite, Nuc, in the plasma drives RDV-TP formation in the lung rather than RDV17. However, it remains unclear to what degree the plasma stability issue affects the distribution of RDV and the formation of its antiviral active metabolite RDV-TP in the lung.
Two other approved ProTides, tenofovir alafenamide and sofosbuvir, have greater human plasma stability than RDV20–22. Tenofovir alafenamide and sofosbuvir use isopropyl ester as their prodrug moiety, whereas RDV uses ethylbutyl ester. Thus, we hypothesized that modifying the ester structure of RDV may lower its susceptibility to plasma esterases and improve its plasma stability. Thereby, we evaluated two RDV derivatives with different ester moieties: methylpropyl and isopropyl, namely MeRDV and IsoRDV (Fig. 2). In this work, we compared the bioactivation of these different prodrugs across human cell models. Moreover, we compared their active metabolite distribution profiles in Ces1 knockout (Ces1c−/−) mice. This work revealed which prodrug form could be more favorable for treating pulmonary infections and provided evidence for optimizing the bioactivation of other antiviral nucleoside analogs in the lung.
Fig. 2.
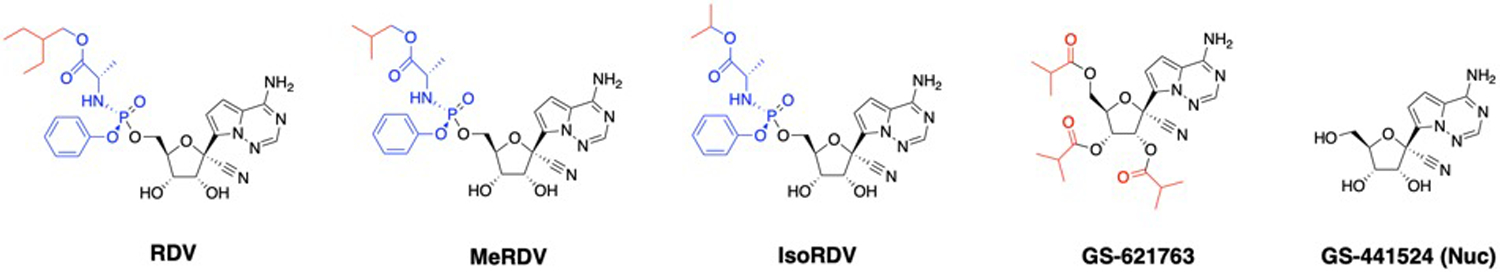
Chemical structures of RDV, MeRDV, IsoRDV, GS-441524, and GS-621763.
Results
Enzyme susceptibility, tissue homogenate hydrolysis profiles, and plasma stability
To evaluate the susceptibility of ProTides to CES1 and CatA, we performed an in vitro enzymatic activity assay based on the method reported in a previous study23. After the prodrugs were incubated with recombinant human CatA (rhCatA) or CES1(rhCES1), the concentrations of prodrugs and metabolites were measured by LC-MS/MS. The enzyme activity was calculated by dividing the reduction of the prodrug by the enzyme concentration and incubation time. The activities of rhCatA and rhCES1 on RDV, MeRDV, and IsoRDV hydrolysis are displayed in Fig. 3A. The activity of rhCatA for MeRDV was significantly higher than that for RDV (2,561.2 ± 38.0 vs. 1,786.5 ± 179.2 pmol/min/μg protein, n = 3, P < 0.01, Fig. 3A left), while rhCES1 activity for MeRDV was lower than that for RDV although the difference is not statistically significant (P=0.058, Fig.3A right). The activities of both rhCatA and rhCES1 for IsoRDV were significantly lower than that for RDV (rhCatA: 236.7 ± 172.8 vs. 1,786.5 ± 179.2 pmol/min/μg protein, n = 3, P < 0.001, Fig. 3A left, rhCES1: 7.7 ± 1.4 vs. 15.5 ± 1.8 pmol/min/μg protein, n = 3, P < 0.01, Fig. 3 A right).
Fig. 3. Enzyme susceptibility, ex vivo human plasma stability, and tissue homogenate hydrolysis profiles.
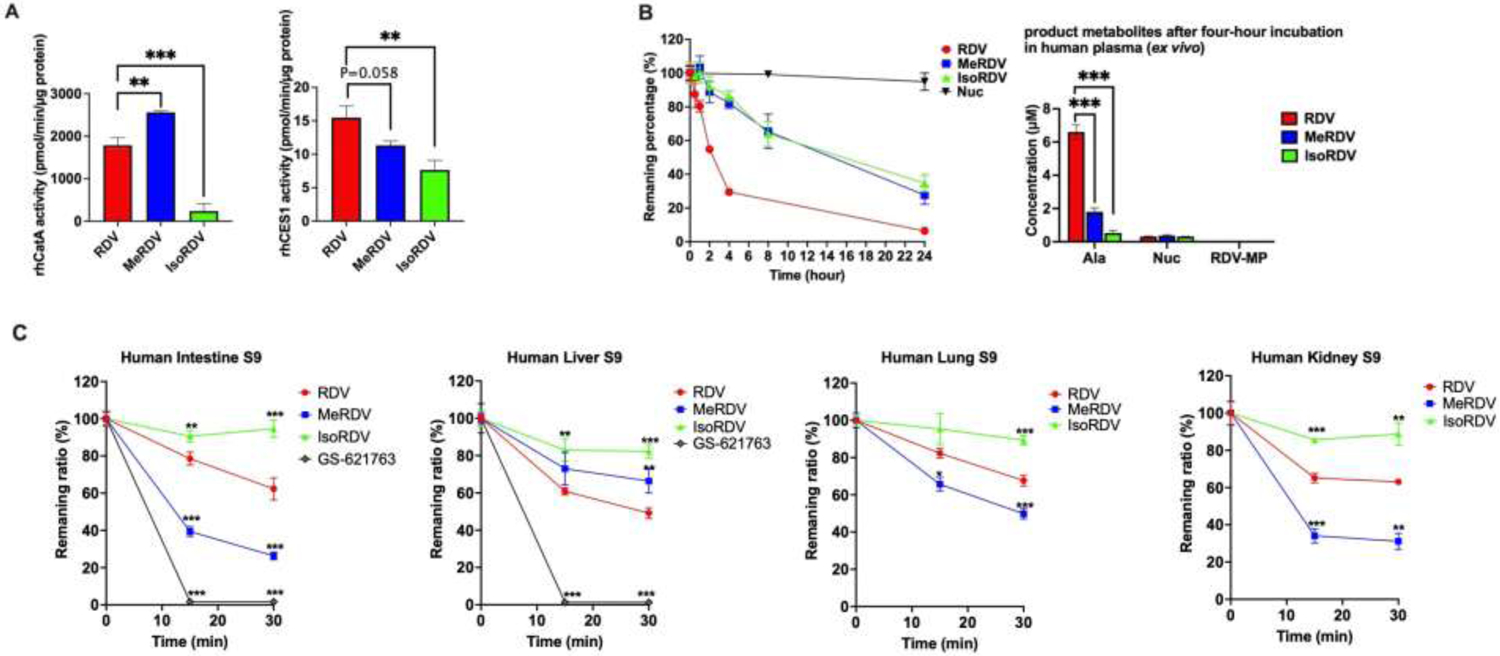
(A) Activity of rhCatA and rhCES1 for hydrolysis of RDV, MeRDV, and IsoRDV. 20 μM prodrug was incubated with 0.5 ng/μL rhCatA for 10 min (left), 40 ng/μL rhCES1 for 20 min (right). Bars show mean values (± S.D.) from three independent experiments. *P < 0.05, **P < 0.01, ***P < 0.001 indicate statistically significant differences between groups by one-way ANOVA with post-hoc Tukey multiple comparison test.
(B) Stability of RDV, MeRDV, IsoRDV, and Nuc in human plasma. The remaining percentages of each drug after incubation for 24 hours (left), and the major metabolites generated following 4 hours of incubation (right). Bars show mean values (± S.D.) from three independent experiments.
(C) Hydrolysis profiles of prodrugs in human tissue homogenates. Prodrug hydrolysis in 1 mg/mL human intestine S9 fractions (HIS9), 0.5 mg/mL human liver S9 fractions (HLS9), 1 mg/mL human lung S9 fractions (HLungS9), and 0.5 mg/mL human kidney S9 fractions (HKS9). Bars show mean values (± S.D.) from three independent experiments. *P < 0.05, **P < 0.01, ***P < 0.001 indicate statistically significant differences from the RDV group by one-way ANOVA with post-hoc Tukey multiple comparison test.
The ex vivo human plasma stability of RDV, MeRDV, IsoRDV, and Nuc are shown in Fig. 3B. Nuc was stable in human plasma with only a 5% reduction after 24 hours of incubation with human plasma. MeRDV and IsoRDV are significantly more stable than RDV in human plasma. After incubation for 4 hours, approximately 70% of RDV was hydrolyzed, whereas MeRDV and IsoRDV were hydrolyzed by about 18% and 15 %, respectively. The major metabolite for these prodrugs in human plasma was Ala. After a 4-hour plasma incubation, RDV generated approximately 3- and 12-fold more Ala than MeRDV and IsoRDV, respectively. Minimal amounts of Nuc and almost no RDV-MP were detected in human plasma after the 4-hour incubation with these prodrugs.
The concentrations of prodrugs and product metabolites of three ProTides after incubation with homogenates (S9 fractions) of four human tissues (lung, liver, intestine, and kidney) were determined by an HPLC-MS/MS assay. The reduction rates of the prodrugs following incubation with the tissue S9 fractions are shown in Fig. 3C. As GS-621763 was designated for oral administration, we only tested its stability in human intestine and liver homogenates, in which GS-621763 could barely be detected after 15 min incubations. Among the tested three ProTides, MeRDV displayed higher hydrolysis rates than RDV in human lung S9 (HlungS9), human intestine S9 (HIS9), and human kidney S9 (HKS9) (P < 0.05). However, in human liver S9 (HLS9), RDV was hydrolyzed at a higher rate than MeRDV (P < 0.05). In all tested tissue S9 fractions, IsoRDV showed the slowest hydrolysis rates among the prodrugs. The metabolites generated after incubation with the human tissue S9 are shown in Fig. S1. Ala was the major metabolite of RDV, MeRDV, and IsoRDV after incubation with human tissue S9. However, Nuc was the major product metabolite of GS-621763 in HIS9 and HLS9. Overall, the metabolic rates of MeRDV were higher in HlungS9 and lower in HLS9 than RDV. These data suggest that a higher susceptibility to CatA could lead to a more efficient ester hydrolysis, the initial activation step, in human lungs.
Intracellular bioactivation and drug entry of prodrugs in various cell lines.
To evaluate the bioactivation of the four prodrugs in human cells, we measured the intracellular concentrations of RDV-TP in human lung carcinoma cells A549, A549 cells expressing ACE2 and TMPRSS2 (A549-ACE2-TMPRSS-2), Calu-3, Caco-2, Vero E6, normal human bronchial epithelial cells BEAS-2B, human liver carcinoma cells Huh-7, renal epithelial cells HEK293 at 6, 12, and 24 hours post incubation. We did not observe any measurable cytotoxicity of the prodrugs and Nuc at the tested concentrations after incubation with the cell lines (data not shown). The tested concentrations of RDV and Nuc in VeroE6 cells (10 μM), iPSC-AT2 (5 μM), and Caco-2 cells (5 μM) were at least five folds lower than the 50% cytotoxic concentration (CC50) values of RDV (101, 32.7, and >100 μM, respectively) and Nuc (>100 μM) in these cell lines based on previously reported data24.
The bioactivation of RDV, MeRDV, IsoRDV, Nuc, and GS-621763 in various cell lines is displayed in Fig. 4. RDV is the most efficient in generating active metabolite RDV-TP in all cell lines tested, followed by MeRDV. Exposure of RDV-TP within 24 hours following incubation (AUC0–24h) and total drug entry within 6 hours in cell lines are summarized in Table S1 and S2, respectively. RDV-TP formation rates within 6 hours are summarized in Table S3. Compared with Nuc, RDV generated significantly more RDV-TP, with 2-fold higher in Calu-3 cells, 2.3-fold higher in Vero E6 cells, 11-fold higher in A549 cells, 19-fold higher in BEAS-2B cells, and 75-fold higher in iPSC-AT2 cells than Nuc. Moreover, RDV generated approximately 649-fold, 360-fold, and 62-fold more RDV-TP than Nuc in Caco-2, HEK293, and Huh-7 cells, respectively. The intracellular levels of RDV-TP generated from RDV gradually declined after 12 hours in A549, A549-ACE2-TMPRSS-2, BEAS-2B, iPSC-AT2, Caco-2, and HEK293 cells. Of note, in Huh-7 cells, the intracellular levels of RDV-TP generated by RDV and MeRDV declined significantly after 6 and 12 hours, respectively, with minimal RDV-TP being detected at 24 hours after treatment. Interestingly, a considerable amount (~1.3 μM) of Nuc was detected in the culture medium of Huh-7 cells after 24 hours of incubations with RDV and MeRDV, while almost no Nuc was detected in the cell-free culture medium (Fig. S4), suggesting that Huh-7 cells could convert RDV back to Nuc.
Fig. 4. RDV-TP formation by RDV, MeRDV, IsoRDV, Nuc, and GS-621763 in various cell lines.
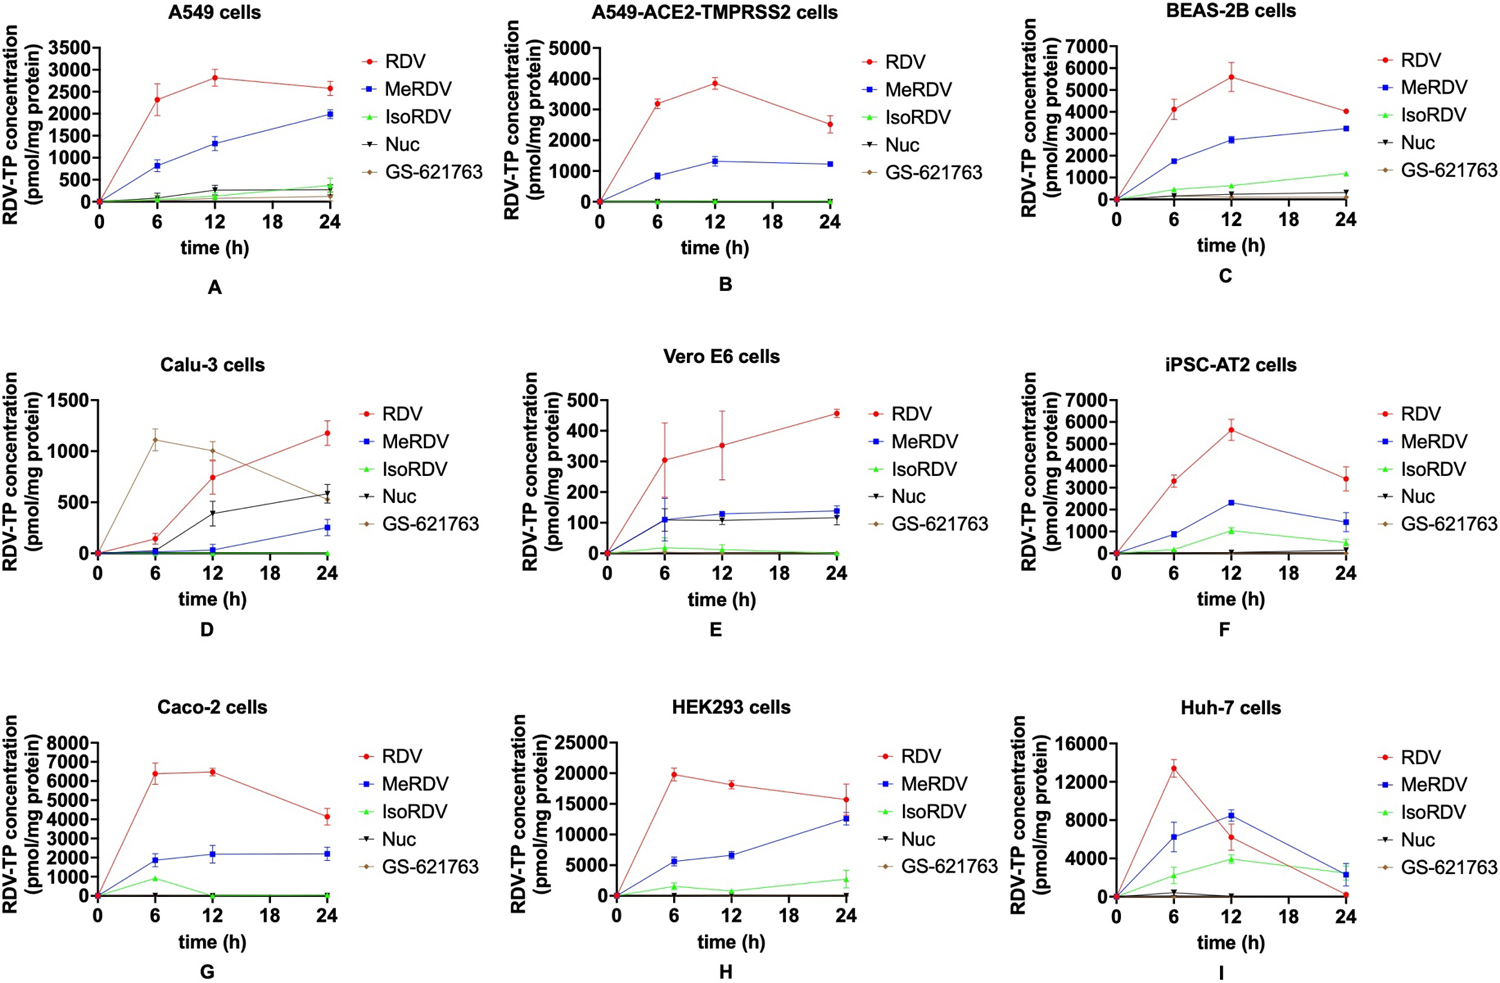
Ten μM drugs were incubated in A549 (A), A549-ACE2-TMPRSS2 (B), BEAS-2B (C), Calu-3 (D), and Vero E6 (E) cells. 5 μM drugs were incubated in iPSC-AT2 (F), Caco-2 (G), HEK293 (H), and Huh-7 (I) cells. Data are shown as mean ± S.D. from three biological replications.
We also measured the intracellular concentrations of RDV-MP (Fig. S2), prodrugs, Nuc, and Ala (Fig. S3) at 6 hours post-treatment. The sums of the amount of these intracellular compounds represent the total drug entry within 6 hours (Fig. 5A). Of note, we were unable to measure RDV-DP because this intermediate metabolite is unstable, and its concentrations are low, only accounting for a minor portion of the total metabolites. Except for Calu-3 cells, RDV showed significantly higher drug entry in multiple cell lines than MeRDV, IsoRDV, Nuc, and GS-621763 (P < 0.05). Compared with Nuc, the total drug entry of RDV was approximately 5-fold higher in A549 and A549-ACE2-TMPRSS2 cells, 2.5-fold higher in BEAS-2B cells, 2-fold higher in iPSC-AT2 cells, and 2.5- to 3.5-fold higher in Caco-2, HEK293, and Huh-7 cells (Fig. 5A, Table S2). The total drug entry and the intracellular AUC0–24h of the active metabolite of RDV were approximately 1- to 2-fold higher than those of MeRDV in various cell lines (Fig. 4, Table S1). In addition, MeRDV had significantly higher drug entry and more intracellular active metabolite formation than Nuc in multiple cell lines (P < 0.05) except for Vero E6 and Calu-3 cells.
Fig. 5. Intracellular bioactivation and drug uptake of prodrugs and Nuc in cell lines.


(A) Cell-dependent uptake and bioactivation of prodrugs. The total drug cell entry amount of each drug within six hours in various cell lines (up); The intracellular accumulation of RDV-TP within 24 hours in various cell lines (down). Data are shown as mean ± S.D. from three biological replications. *P < 0.05, **P < 0.01, ***P < 0.001 indicate statistically significant differences between groups by one-way ANOVA with post-hoc Tukey multiple comparison test.
(B) Association between drug entry and intracellular exposure of RDV-TP for RDV, MeRDV, IsoRDV, and Nuc.
(C) Effects of CES1 inhibitor BNPP and CatA inhibitor telaprevir on bioactivation of ProTides. Ten μM RDV (left) or MeRDV (middle) were co-incubated with various concentrations of BNPP or telaprevir in BEAS-2B cells for 24 hours; 10 μM IsoRDV (right) was co-incubated with various concentrations of BNPP or telaprevir in BEAS-2B cells for 48 hours. Data are shown as mean ± S.D. from three biological replications. ***P < 0.001 indicates a statistically significant difference from the control group by one-way ANOVA with post-hoc Tukey multiple comparison tests.
Association between cell drug entry and intracellular bioactivation
To understand the mechanisms underlying differences in activation rates of the ProTides and Nuc, we investigated the relationship between drug entry within six hours and AUC0–24h of RDV-TP across different cell lines for RDV, MeRDV, IsoRDV, and Nuc. As displayed in Fig. 5A, RDV, MeRDV, and IsoRDV showed a significant cell-dependent pattern in their activations and cell entry: HEK293 and Huh-7 took up more ProTides and generated more RDV-TP than other cell lines. Calu-3 and Vero E6 accumulated significantly less ProTides and generated less RDV-TP than other cell lines. The cell entry rates of RDV, MeRDV, and IsoRDV showed a strong correlation with their intracellular accumulation of RDV-TP, with the R2 values being greater than 0.85 (Fig. 5B). In contrast, Nuc and GS-621763 did not correlate with their drug uptake and intracellular accumulation of RDV-TP (Fig. 5B). These results indicated that the higher cell permeability of RDV compared to MeRDV, IsoRDV, and Nuc could be a major contributor to its higher generation of RDV-TP in various cell lines.
Contributions of CES1 and CatA to ProTide activation in BEAS-2B cells
To evaluate the impact of CES1 and CatA activity in the bioactivation of ProTides in BEAS-2B, the intracellular concentrations of RDV-TP were measured following coincubation of each ProTide with various concentrations of the CES1 inhibitor BNPP or the CatA inhibitor telaprevir. As shown in Fig. 5C, BNPP, even at 20 μM, the highest inhibitor concentration tested, did not significantly alter the formation of RDV-TP. In contrast, telaprevir, at 5 μM, the lowest inhibitor concentration tested, reduced the RDV-TP formation by approximately 80%, 70%, and 100% for RDV, MeRDV, and IsoRDV, respectively, indicating that CatA is the major enzyme responsible for bioactivation of ProTides in BEAS-2B cells.
Antiviral activity of RDV and its analogs against SARS-CoV-2
To determine the antiviral efficacy of RDV, MeRDV, IsoRDV, and Nuc against SARS-CoV-2, we infected lung-derived A549 cells expressing the viral receptor ACE2 and protease TMPRSS2 with two strains of SARS-CoV-2 (MOI 1.0), the early strain WA1 and Omicron variant BA.1, in the presence of increasing concentrations of compounds (Fig. 6). DMSO was used as vehicle control. Cell viability remained around 80% or above at the highest concentration used (i.e., 25 μM) (Fig. S5). After 24 hours, infectious virus titers were determined by TCID50. While all analogs had antiviral efficacy against SARS-CoV-2 in a dose-dependent manner, RDV displayed the highest antiviral efficacy against WA1 (EC50 = 0.06 μM), followed by MeRDV (EC50 = 0.15 μM), Nuc (EC50 = 2.2 μM) and IsoRDV (EC50 = 5.2 μM). Similarly, RDV displayed the highest antiviral efficacy against Omicron variant BA.1 (EC50 = 0.0003 μM), followed by MeRDV (EC50 = 0.03 μM), Nuc (EC50 = 0.49 μM) and IsoRDV (EC50 = 0.54 μM). These data are consistent with the more efficient delivery of the active metabolite RDV-TP into lung cell lines from RDV and MeRDV compared to Nuc and IsoRDV.
Fig. 6. Antiviral activity of RDV, MeRDV, IsoRDV, and Nuc against SARS-CoV-2 in A549-ACE2-TMPRSS2 cells.

Data are shown as mean ± S.D. from two biological replicates (i.e., experiments 1 and 2) with four technical replicates each. Viral titers were determined by 50% tissue culture infectious dose (TCID50) assay in A549-ACE2-TMPRSS2 cells.
Mouse Pharmacokinetics
We compared the Pharmacokinetic (PK) profiles of different prodrugs and Nuc after the administration of the compounds at a molar equivalent dose basis in the plasma of Ces1c knockout (Ces1c−/−) mice. Although several studies reported lung PK profiles of RDV-TP in mice, they used wild-type mice, which have higher expressions of plasma Ces1 than humans25–26. RDV plasma stability is poorer in mice (half-life, <5 min)27 than in humans (half-life, 69 min)28. Studies based on normal mouse models may underestimate the tissue exposure of RDV due to the extensive Ces1-medicated RDV hydrolysis in mouse plasma. RDV plasma stability was significantly improved (half-life, ~25 min) in Ces1c−/− mice27. Thus, Ces1c−/− mice is more appropriate than wild-type mice for the studies of RDV and its ProTide derivatives that are Ces1 substrates. The plasma concentration-time profiles of prodrugs and their major metabolites, Nuc and Ala, are shown in Fig. 7. The major PK parameters for oral and IV administration are displayed in Table 1 and Table 2, respectively. After oral administration with 54.4 μmole/kg of RDV, MeRDV, IsoRDV, or GS-621763, the prodrug forms were barely detected in the plasma, suggesting an extensive first-pass effect after oral administration. The estimated oral bioavailability of RDV, MeRDV, and IsoRDV was less than 2%. Nuc was the major metabolite for all the prodrugs tested. The AUC0–12h of Nuc was comparable between these prodrugs following oral administration. Ala was the minor metabolite in the plasma for oral ProTides (RDV, MeRDV, and IsoRDV).
Fig. 7. Plasma PK of prodrugs and Nuc in Ces1c−/− mice.

Plasma PK of the prodrugs (A), Nuc (B), and Ala (C) after oral administration of the prodrugs. Plasma PK of the unchanged prodrugs and Nuc (D) after IV injection of the prodrugs and Nuc. Plasma PK of Nuc (E) and Ala (F) after IV injections of the prodrugs. The data for each time point are shown as mean ± S.D. from three to four mice.
Table 1.
Mean plasma PK parameters of the major metabolite Nuc after oral administration of RDV, MeRDV, and IsoRDV in Ces1c−/− mice.
| Parameters | Nuc from RDV | Nuc from MeRDV | Nuc from IsoRDV | Nuc from GS-621763 |
|---|---|---|---|---|
| AUC0-∞ (h⋅nM) | 9,528.3 ± 2,263.2 | 11,600.5 ± 1,612.5 | 14,878.9 ± 9,899.4 | 6,355 ± 1,075.2 |
| AUC0-t (h⋅nM) | 8,526.0 ± 1,666.0 | 11,549.1 ± 1,633.5 | 9,275.6 ± 2,312.6 | 6,244.9 ± 1,100.7 |
| CL/F (L⋅h−1) | 0.15 ± 0.04 | 0.12 ± 0.02 | 0.12 ± 0.06 | 0.22 ± 0.04 |
| Cmax (nM) | 1,534.7 ± 276.5 | 2,474.4 ± 366.4 | 1,651.6 ± 152.1 | 4,084.1 ± 763.4 |
| t1/2 (h) | 5.97 ± 2.98 | 3.84 ± 1.81 | 7.98 ± 2.41 | 4.38 ± 2.23 |
Data are shown as mean ± S.D. from three to four mice.
Table 2.
Mean plasma PK parameters after IV administration (bolus) of RDV, MeRDV, IsoRDV, and Nuc in Ces1c−/− mice
| Parameters | RDV | MeRDV | IsoRDV | Nuc |
|---|---|---|---|---|
| AUC0-∞ (h⋅nM) | 1,576.2 ± 948 | 2,382.6 ± 1,154.5 | 4,950.3 ± 628.2 | 26,312.3 ± 839.4 |
| AUC0-t (h⋅nM) | 1,570.2 ± 947.8 | 2,370.4 ± 1,152.0 | 4,941.6 ± 626.4 | 25,123.2 ± 285.4 |
| CL/F (L⋅h−1) | 1.06 ± 0.44 | 0.79 ± 0.62 | 0.28 ± 0.03 | 0.052 ± 0.002 |
| Cmax (nM) | 1,371.7 ± 515.1 | 2,268.9 ± 949.5 | 5,888.3 ± 587.8 | 18,132.7 ± 2,656.8 |
| t1/2 (h) | 1.25 ± 0.39 | 0.92 ± 0.22 | 1.04 ± 0.33 | 6.34 ± 4.01 |
| Vd (L) | 1.91 ± 0.94 | 0.93 ± 0.48 | 0.42 ± 0.17 | 0.47 ± 0.29 |
| Nuc from RDV | Nuc from MeRDV | Nuc from IsoRDV | - | |
| AUC0-t (h⋅nM) | 10,345 ± 1,469.1 | 7,868.6 ± 2,237.1 | 8,561.4 ± 3,657.8 | - |
| Cmax (nM) | 1,859.5 ± 523.4 | 2,183.7 ± 947.4 | 1,810.6 ± 776.0 | - |
| Ala from RDV | Ala from MeRDV | Ala from IsoRDV | - | |
| AUC0-t (h⋅nM) | 5,059 ± 1,151.1 | 5,329.7 ± 1,920.3 | 4,237.6 ± 2,453.1 | - |
| Cmax (nM) | 8,632.1 ± 1,809.2 | 8,627.9 ± 3,318.5 | 8,262.1 ± 4,594.9 | - |
Data are shown as mean ± S.D. from three to four mice for each time point.
After IV administration, RDV plasma concentration declined at a more rapid rate than MeRDV, followed by IsoRDV. At the first time point (15 min after IV injection), the plasma concentrations of RDV (1,371.7 ± 515.0 nM) and MeRDV (2,268.9 ± 949.5 nM) were significantly lower than those of IsoRDV (5,888.3 ± 587.7 nM) and Nuc (18,132.7 ± 2,656.8 nM). RDV and MeRDV were barely detectable in the plasma 4 hours after IV administration. RDV (1,570.2 ± 947.8 h⋅nM) and MeRDV(2,370.4 ± 1,152 h⋅nM) had significantly lower AUC0-t(8h) in mouse plasma (P < 0.01) compared with IsoRDV (4,941.6 ± 626.4 h⋅nM) and Nuc (25,123.2 ± 285.4 h⋅nM). The plasma Cmax of RDV and MeRDV were significantly lower than IsoRDV’s (5,888.3 ± 587.8 nM, P < 0.05) and Nuc’s (18,132.7 ± 2,656.8 nM, P < 0.01). RDV had a significantly larger apparent distribution volume Vd (1.91 ± 0.94 L) than IsoRDV (0.42 ± 0.17 L, P < 0.05) and Nuc (0.47 ± 0.29 L, P < 0.05), but was not significantly different from MeRDV (0.93 ± 0.48 L, P > 0.05). No significant difference (P > 0.05) was observed in the plasma AUC and Cmax for the downstream metabolites Nuc and Ala among RDV, MeRDV, and IsoRDV after IV administration.
Tissue distribution of RDV-MP and RDV-TP after IV administration
We determined the levels of RDV-MP and RDV-TP in six tissues of mice within 8 hours after IV administration of 54.4 μmole/kg of RDV, MeRDV, IsoRDV, and Nuc (Fig. 8 and Fig. 9). In the mouse lung, RDV (AUC0–8h: 4,764.2 ± 753.1 pmol•h/g tissue) and MeRDV (3,322.5 ± 331.5 pmol•h/g tissue) generated significantly more RDV-TP than Nuc (1,668.4 ± 276.9 nM•h, P < 0.001). The EC50 (358 pmol/g tissue) and EC90 (521 pmol/g tissue) of RDV-TP in mouse lungs were estimated based on the anti-SARS-CoV-2 potency reported in cell models8 and the number of cells in each gram of mouse lung29. It is of note that the RDV-TP concentrations measured in the mouse lung after IV administration of RDV were below the estimated EC90 and EC50 levels after 4 and 8 hours, respectively. The RDV-TP levels in the mouse lung after IV administration of Nuc were constantly below EC50. No significant difference was detected between RDV and MeRDV in the AUC0–8h of RDV-TP and RDV-MP in the liver, kidney, small intestine, and brain. RDV and MeRDV generated significantly more RDV-TP and RDV-MP than Nuc in all the tissues tested. Of note, the amounts of RDV-TP in mouse brain were below the detectable level for all drugs in this study.
Fig. 8. Tissue PK of RDV-MP and RDV-TP after IV administration of RDV, MeRDV, IsoRDV, and Nuc in Ces1c−/− mice.

Data for each time point are shown as mean ± S.D. from three mice. The EC50 (393 pmol/g tissue) and EC90 (679 pmol/g tissue) of RDV-TP in mouse lungs were estimated based on the anti-SARS-CoV-2 potency reported in cell models8 and the number of cells in each gram of mouse lung29.
Fig. 9. Tissue exposure of RDV-MP and RDV-TP after IV administration of RDV, MeRDV, and Nuc in Ces1c−/− mice.

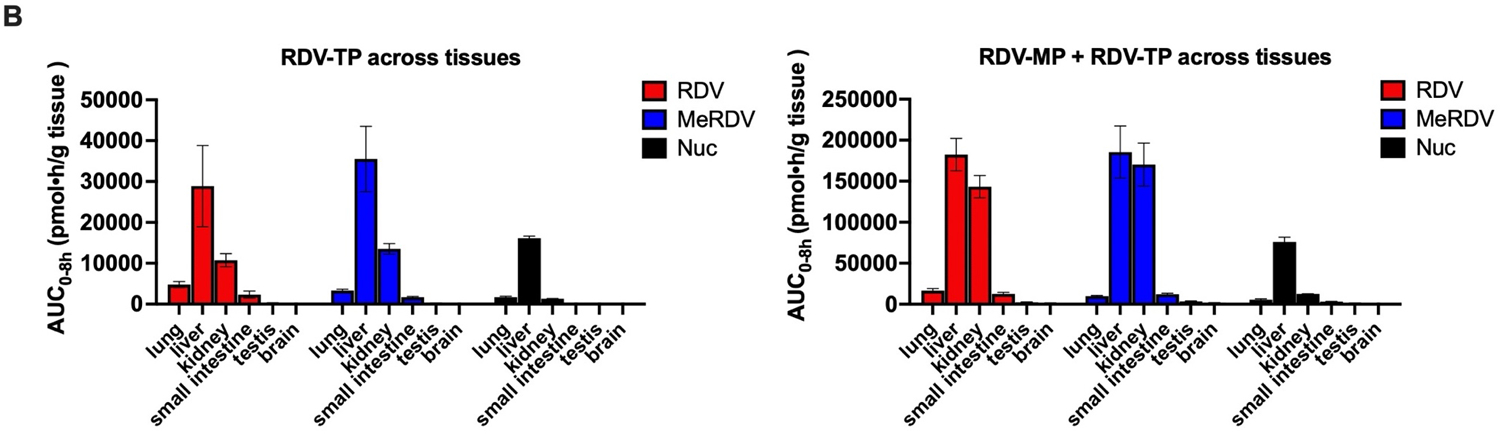
(A) RDV-MP and RDV-TP accumulation (AUC0–8h) in lung, liver, kidney, small intestine, testis, and brain; (B) tissue allocation profiles of RDV-TP alone and RDV-TP plus RDV-MP. Data are shown as mean ± S.D. from three mice.
RDV and MeRDV showed a preferential distribution of RDV-MP and RDV-TP in liver and kidney (Fig. 9): For RDV, the mouse liver and kidney had approximately 10- and 8-fold higher accumulation of RDV-MP + RDV-TP than the lung, respectively; for MeRDV, the mouse liver and kidney had approximately 18- and 16-fold higher accumulation of RDV-MP + RDV-TP than the lung, respectively; for Nuc, the mouse liver and kidney had nearly 13-, and 1.4-fold higher accumulation of RDV-MP + RDV-TP than the lung. These findings suggest a significantly stronger ester hydrolysis capability (mediated by Ces1 and Ctsa) and P-N bond cleavage capability (mediated by Hint1) in the liver and kidney.
Discussion and Conclusions
Unlike CES1 that is specifically highly expressed in the liver, CatA is widely expressed in all types of human lung and bronchus cells at a considerable level. A western blot assay revealed that CatA protein expression was significantly higher than CES1 protein expression (3.3 vs. 0.1 ng/μg total protein) in NHBE cells30. In line with previous evidence30, our inhibitor study demonstrated that CatA is the major enzyme activating RDV, MeRDV, and IsoRDV in BEAS-2B cells (Fig. 5C). Therefore, we hypothesized that a higher susceptibility to CatA would lead to more efficient bioactivation in human lung cells for a ProTide prodrug. To test this hypothesis, in this study, we included two new ProTides, MeRDV and IsoRDV, that replaced the ester moiety of RDV with methylpropyl ester and isopropyl ester, respectively. This change altered the enzymatic susceptibility/selectivity, with MeRDV being more susceptible to CatA and less susceptible to CES1 than RDV and IsoRDV being significantly less susceptible to both CatA and CES1. MeRDV has increased selectivity for CatA over CES1 by threefold when compared to RDV (Fig. 3A). Accordingly, MeRDV showed an approximately 2-fold higher hydrolysis rate in human lung S9 than RDV (Fig. 3C). However, RDV generated at least 2-fold more active metabolites than MeRDV in human lung cell lines, which warrants further investigation to determine whether cell permeability is a key factor. Of note, the cell permeability of RDV and Nuc has not been fully evaluated in previous studies because the intracellular concentrations of prodrug and other intermediate metabolites Ala and Nuc were not determined31–32. In this study, we simultaneously measured the intracellular levels of prodrugs, Nuc, Ala, RDV-MP, and RDV-TP, enabling estimations of the total amount of drug entry into the cells. We found that the cell permeability of RDV was approximately 1- to 2-fold greater than MeRDV in various cell lines (Table S2). The cell permeability of RDV, MeRDV, or IsoRDV was highly correlated with the intracellular levels of the RDV-TP (Fig. 5B), suggesting that cell permeability is a key factor determining the intracellular generation of active metabolite for a ProTide.
Differential expression of ProTide activating enzymes and transporters may account for the cell-dependent bioactivation. We analyzed the expression of enzymes and transporters involved in the disposition and activation of ProTide prodrugs in the cell lines utilized in our in vitro studies and compared to different types of respiratory tissue cells using data retrieved from the Human Protein Atlas (HPA) database (Fig. S6). A549 cells closely resemble the expression levels of CES1, CatA, HINT1, and P-glycoprotein of AT2 cells and respiratory ciliated cells. Calu-3 and Vero E6 had significantly lower expression of CES1 and HINT1 but higher expression of P-glycoprotein than A549 cells. In an absolute quantitative proteomics study33, Calu-3 had a significantly higher P-glycoprotein expression(0.44 pmol/mg protein) than A549 and BEAS-2B cells (not detectable). In addition, Vero E6 cells expressed one-fold higher expression of ABCC4 than A549 cells. These findings indicate that VeroE6 and Calu-3 cells may underestimate the bioactivation efficiency of ProTide prodrugs due to their higher expression of drug efflux transporters P-glycoprotein and MRP4.
Tissue expression patterns of activating enzymes in mouse may explain the preferential bioactivation of ProTides in the liver and kidney (Fig.9). We analyzed the protein expressions of relevant enzymes and transporters using data retrieved from the ProteomicsDB (Fig. S7). Mouse liver showed the highest expression of Ces1 among the tissues examined, with more than 10-fold higher than the lung. Mouse kidney and liver exhibited approximately 5- and 2-fold more Ctsa than the lung, respectively. Similarly, the human liver and kidney showed the highest CES1 and CatA expression levels, respectively, suggesting that RDV and MeRDV may also have hepatic and renal preferential bioactivation in humans.
Oral prodrug GS-621763 mainly delivers Nuc to the systemic circulation. Overall, Nuc is significantly less efficient in delivering antiviral active metabolites to the lung because of its lower cell permeability and less intracellular bioactivation than RDV. This study’s findings align with data from the Gilead group that Nuc constantly yielded significantly lower levels of RDV-TP (at least 40-fold lower) than RDV within 48 hours after drug treatment in human bronchial epithelial cells34. Moreover, our mouse lung PK data is in line with Gilead’s data in African green monkeys, which showed that the concentrations of RDV-TP generated from Nuc were approximately 8-fold lower than RDV in the lung 24 hours after IV administration34. The PK profiles of IV injection of Nuc in mice demonstrated that Nuc has a lower distribution rate to tissues and is less efficient in generating RDV-TP than RDV and MeRDV in the lung, even though Nuc has a larger AUC in the plasma. Nuc seemed trapped in the systemic circulation, while RDV and MeRDV can efficiently enter different tissues and cells. IsoRDV showed a similar behavior to Nuc in that it maintained at higher plasma concentrations but generated less amount of RDV-MP and RDV-TP in the lung and other various tissues than RDV and MeRDV. Siegel et al. described the synthesis of RDV (compound 4b) and its analogs, including IsoRDV (compound 4i), and its structure-activity relationship (SAR)22. The performances of IsoRDV observed in our cell study are consistent with the study by Siegel et al.22, in which IsoRDV was more stable in human plasma than RDV (1561 min vs. 69 min), but its antiviral activity was significantly weaker to Ebola virus in various cell lines. Meanwhile, the logD values of Nuc (0.3) and IsoRDV (1.1) are dramatically lower than RDV (2.1)22, indicating that Nuc and IsoRDV had a lower cell membrane permeability than RDV. Our results and the data from Siegel et al. demonstrated that the selection of ester moiety for ProTide prodrugs will determine plasma stability, cell membrane permeability, and intracellular activity. All these data showed that the formation of RDV-MP and RDV-TP in the lung is driven by the cell permeability as well as susceptivity to CatA.
Our animal PK data showed that RDV-TP (Fig. 8) could reach its Cmax in the lung within 1 hour and a large portion (about 90%) of plasma RDV disappeared within 30 minutes after IV administration. Considering that the half-life of RDV in a human plasma ex vivo incubation experiment was 69 min28, the rapidly reduced RDV plasma concentrations is very likely caused by its rapid distribution into tissues. Although Nuc was effective against SARS-CoV-2 in monkeys and mice34–35, Nuc required at least a 10-fold higher dosage than RDV. Collectively, our findings support the use of RDV via IV administration over Nuc due to RDV’s quick tissue distribution and significantly more efficient bioactivation in the lung than Nuc. Moreover, it is favorable for RDV to maintain its intact prodrug form when reaching human lung cells. Therefore, an inhalation formulation could further improve the pulmonary load of RDV and its active metabolite RDV-TP while reducing its distribution in the liver and kidney25, 36.
Our animal PK data suggest that RDV is rapidly distributed in tissues and quick-acting. RDV-TP in the mouse lung increased quickly within one hour and then gradually declined over an eight-hour period after IV bolus injection of RDV (Fig. 8). The concentrations of RDV-TP in the mouse lung may be below the EC90 and EC50 at 4 and 8 hours, respectively, suggesting that the dosage utilized in the mouse study might be inadequate to provide sustainable RDV-TP concentration in the lung during the entire treatment interval. We concur that it could be difficult to correlate the RDV-TP level in gross lung tissue to the in vivo antiviral activity since this concentration number may not reflect its concentration in particular cells infected by the viruses. The RDV dosage in this animal PK study was scaled from the human loading dose on the first day of treatment. The current RDV treatment regimen for COVID-19 patients is IV infusion over 0.5 to 2 hours with 200 mg RDV on Day one, followed by 100 mg once per day37. Thus, whether the pulmonary RDV-TP concentration in patients could remain above its effective level during the interval between two doses (i.e., 24 hours) may warrant further investigations. Given the rapid tissue distribution and intracellular activation of RDV, we assumed that a slow IV infusion rate and a more frequent dosing regimen may help maintain the pulmonary concentration of RDV-TP above the effective level throughout the entire period of treatment. In vivo antiviral study in Ces1c−/− mice showed that 25 mg/kg RDV twice daily significantly reduced the lung virus titers on 2 days post infection while 50 mg/kg RDV single dose daily could not27.
In conclusion, the ProTide prodrugs RDV and MeRDV significantly improved efficiency in delivering the active metabolite to the lung compared to the parent compound (i.e., Nuc). The improved cell permeability is the major factor enabling RDV to deliver more RDV-TP to the lung than other prodrugs and Nuc. CatA is the primary activating enzyme for ProTides in the lung and airway. High susceptibility to CatA is another factor that will boost a ProTide to generate active metabolite in the lung. Data from this study will provide evidence for optimizing the prodrug structure of other nucleoside antivirals for treating pulmonary infections like COVID-19.
Experimental Section
Materials
All compounds are >95% pure. RDV (≥ 98%), MeRDV (≥ 98%), IsoRDV (≥ 98%), GS-621763 (≥ 98%) were purchased from Cayman Chemical (Ann Arbor, MI). TAF (≥ 99%), GS-441524 (Nuc) (≥ 99%), the alanine metabolite GS-704277 (Ala) (≥ 95%), RDV-MP (≥ 98%), and RDV-TP (≥ 98%) were purchased from MedChem Express (Monmouth Junction, NJ). PhosSTOP EASYpack (PhosSTOP) was purchased from Roche (Basel, Switzerland). Bis-(p-nitrophenyl) phosphate (BNPP), dithiolthreitol, 55’ dithiobis (2-nitrobenzoic acid) (DTNB), and Tris-base (Trizma base) were purchased from Sigma-Aldrich (St. Louis, MO, USA). The internal standards, 2-chloroadenosine (2-Cl-adenosine) and adenosine-15N’ 5’-triphosphate disodium salt solution, were purchased from Sigma-Aldrich (St. Louis, MO, USA). Qubit™ protein assay kit was obtained from Thermo Fisher Scientific (Waltham, MA). MTS Assay Kit (ab197010) was purchased from Abcam (Cambridge, MA, USA).
Recombinant human CatA (rhCatA) and CES1 (rhCES1) were purchased from R&D Systems (Minneapolis, MN, USA). Blank human plasma was purchased from Innovative Research (Novi, Michigan, USA). Pooled human tissue S9 fractions, including liver (HLS9), lung (HlungS9), intestine (HIS9), and kidney (HKS9), were products from XenoTech LLC (Kansas City, KS, USA). All other chemicals and reagents were of analytical grade and commercially available. The demographic information about the tissue donors is summarized in Table S4.
Cell lines
Cell lines tested in this study is summarized in Table S5. The African monkey kidney cell line Vero E6 was obtained from ATCC and grown in Eagle’s Minimum Essential Medium (EMEM) supplemented with 10% fetal bovine serum (FBS) (GIBCO, ThermoFisher Scientific). Human hepatocellular carcinoma cell line Huh7 cells were provided by Dr. Lei Yin at the University of Michigan and grown in Dulbe’co’s Modified Eagle Medium (DMEM) supplemented with 10% FBS. Human lung adenocarcinoma epithelial cells Calu-3 were provided by Dr. Daniel Goldstein at the University of Michigan and grown in EMEM supplemented with 10% FBS. Normal human bronchial epithelial cell line BEAS-2B cells were purchased from ATCC (Manassas, VA) and grown in bronchial epithelial cell growth medium (BEGM) (CC-3171) supplemented with BEGM™ SingleQuots™ supplements and growth factors (CC-4175) purchased from Lonza (Walkersville, MD). A549-ACE2-TMPRSS2 cells (catalog no. a549-hace2tpsa) were purchased from InvivoGen (San Diego, CA) and grown in F-12K supplemented with 10% FBS. Human pneumocyte type II carcinoma cells A549 (ATCC® CCL-185™), human epithelial colorectal adenocarcinoma cell Caco-2 (ATCC® HTB-37™), and HEK293 (ATCC CRL-1573™) were purchased from ATCC (Manassas, VA). A549 cells were propagated in F-12K medium (ATCC) with 10% fetal bovine serum (FBS; Gibco) and ‰1 penicillin-streptomycin-amphotericin B solution (ATCC). Caco-2 cells were cultured in EMEM (ATCC) with 20% FBS and ‰1 penicillin-streptomycin-amphotericin B solution. HEK293 cells were cultured in DMEM with 20% FBS and 1‰ penicillin-streptomycin-amphotericin B solution. All the cells were propagated at 37°C in a humidified atmosphere of 5% CO2. Cell passages were performed with TrypLE™ Express Enzyme (Gibco) when cells reached about 80–90% confluence. iPSC-derived alveolar type 2 (iPSC-AT2) cells (SPC2 line, clone SPC2-ST-B2, Boston University) were differentiated as previously described38–39. After removal of CHIR99021 between days 32 and 37 cells were maintained as three-dimensional alveolospheres embedded in Matrigel (Corning; 356231) in ‘CK + DCI’ media. For experiments alveolospheres were dissociated and seeded onto tissue culture-treated plates coated with Human Collagen Type IV (Sigma: C5533) at 67 μg/mL.
Enzyme, tissue S9, and human plasma activity assay
The activity of rhCatA and rhCES1 for hydrolyzing RDV, MeRDV, and IsoRDV was evaluated using a method similar to a previous study23 with minor modifications. The optimized buffer systems for rhCatA and rhCES1 were MES assay buffer (pH 5.5) and Tris buffer (pH 7.5), respectively. The CatA assay was carried out in a 50 μL reaction mixture containing 0.5 ng/μL activated rhCatA and 20 μM prodrug (RDV, MeRDV, or IsoRDV) in the MES assay buffer (pH 5.5). The rhCatA assay mixture was incubated at 37 °C for 5 and 10 min with shaking at 1200 rpm. The rhCES1 assay was conducted in a 20 μL reaction mixture containing 40 ng/μL or 20 ng/μL rhCES1 and 20 μM prodrug in the Tris buffer (pH 7.5). The rhCES1 assay mixture was incubated at 37 °C for 20 and 40 min with shaking at 1,200 rpm. Our preliminary study found a linear relationship between the prodrug hydrolysis and the tested enzyme concentrations (CatA: 0.1–0.5 ng/μL; CES1: 20–40 ng/μL) and the incubation times (CatA: 0–10 min; CES1: 0–40 min). We calculated the enzyme activity by dividing the reduction of the prodrug by the enzyme concentration and incubation time.
We incubated 20 μM of each ProTide (RDV, MeRDV, IsoRDV) with each tissue’s S9 fractions (0.5 mg/mL HLS9, or 0.5 mg/mL HKS9, or 1 mg/mL HlungS9, or 1 mg/mL HIS9) in Tris buffer (pH 7.5) at 37 °C for 15 min and 30 min in a shaker at a speed of 1,200 rpm (Benchmark, Multi-Therm™). For the human plasma stability study, we incubated 10 μM prodrug or Nuc in human plasma at 37 °C for 0.5, 1, 2, 4, 8, and 24 hours with shaking at 1,200 rpm (Benchmark, Multi-Therm™). The reactions were terminated by adding a two-fold volume of acetonitrile (ACN) containing the internal standards TAF (5 μM) and 2-Cl-adenosine (0.5 μM). The samples were then vortexed for 0.5 min and centrifuged at 21,130 g for 10 min at 4°C to remove the precipitated proteins. The resulting supernatant was collected and diluted with ten volumes of 3% (v/v) ACN containing 0.1% (v/v) formic acid before being injected into an LC-MS/MS system for analysis with an assay method described below.
Cytotoxicity assay
We seeded cells at a density of 15,000 cells/well in a white-wall clear-bottom 96-well plate (Corning) and incubated cells at 37 °C overnight. When cells reached 70–80% confluence, we added serial dilutions (0, 1, 5, 10, 25, 50 μM) of prodrugs or Nuc in medium to each well and incubated the cells for 24 hours at 37 °C. Cytotoxicity was determined using the MTS Assay Kit (ab197010) according to the manufacturer’s instructions.
Bioactivation of prodrugs in various cell lines
The cell incubations and sample preparation for LC-MS/MS analysis were performed based on previously published methods26, 40–42 with some minor modifications. First, we prepared the lysis buffer containing 70% methanol (v/v, MeOH: H2O = 7:3), 0.5 μM 2-chloroadenosine and 5 μM adenosine-15N’ 5’-triphosphate as internal standards and 2% formic acid, 10% PhosStop, and 50 μM DTNB as protectors for MP- and TP-Nuc41. Cells were plated at a density of 0.5 × 10⁶ cells/well in a 6-well plate. After at least 24 hours, when the cells reached 80–90% confluence, we replaced the cell culture media with media containing drugs and incubated at 37 °C. We used 5 μM of prodrugs for HEK293, Huh-7, and iPSC-AT2 cells and 10 μM of prodrugs for Vero E6, A549, A549-ACE2-TMPRSS2, Calu-3, and BEAS-2B cells. We aspirated the medium at 6, 12, and 24 hours after adding drugs. Then, we washed the cells twice with 2 mL ice-cold PBS, scraped cells into 0.3 mL ice-cold lysis buffer, and transferred the lysis buffer to a new 2 mL tube. Then, we washed the well with 0.3 mL water and collected the wash water into the same tube. We shook the collected samples at 1500 rpm on a shaker (Benchmark, Multi-Therm™) and then stored the samples at −80 °C. Upon analysis, extracts were centrifugated twice at 21,130 × g for 10 min at 4 °C to remove the precipitated proteins. The supernatants were transferred to clean tubes for LC-MS/MS injections and total protein concentration measurement using a Qubit assay. The inhibitors’ effects on the bioactivation of RDV, MeRDV, and IsoRDV in BEAS-2B cells were evaluated by incubating BEAS-2B cells with cell culture medium containing 10 μM of each prodrug with or without various concentrations of telaprevir (5, 10, and 20 μM) and BNPP (5, 10, and 20 μM) at 37 °C for 24 hours (RDV and MeRDV) or 48 hours (IsoRDV). After drug incubations, we aspirated the medium and collected cell lysis samples as described above.
In vitro antiviral activity study of RDV and its analogs
SARS-CoV-2 was obtained through BEI Resources [SARS-related coronavirus 2, isolates USA-WA1/2020, NR-52281 and hCoV-19/USA/GA-EHC-2811C/2021 (omicron variant lineage B.1.1.529), NR-56481]. The lack of genetic drift of our viral stock was confirmed by deep sequencing. Viral titers were determined by 50% tissue culture infectious dose (TCID50) assays in A549-ACE2-TMPRSS2 cells (Reed and Muench method). All experiments using SARS-CoV- 2 were performed at the University of Michigan under biosafety level 3 (BSL3) protocols in compliance with containment procedures in laboratories approved for use by the University of Michigan Institutional Biosafety Committee and Environment, Health and Safety. For infections, A549-ACE2-TMPRSS2 cells were seeded in 24 well plates at 50,000 cells/well and allowed to grow overnight. Cells were infected with SARS-CoV-2 at a MOI of 1 in drug-containing DMEM media with 2% FBS at the final concentration of 0, 1, 5, 10, and 25 uM. The infection was allowed to proceed for 24 hours before harvesting and determination of infectious virus titers by TCID50 on A549-ACE2-TMPRSS2 cells (Reed and Muench method).
Animals
Homogeneous Ces1c−/− mice were obtained from the Jackson Laboratory (JAX stock # 014096). Mice were bred in the University of Michigan animal facility. Adult males (8–12 weeks) with body weight ranging from 23 to 27 g were used for the study. All works were conducted under an animal protocol (PRO00010244) approved by the Institutional Animal Care and Use Committee at the University of Michigan according to the guidelines set by the Association for the Assessment and Accreditation of Laboratory Animal Care and the U.S. Department of Agriculture. The PK study procedure was similar to previous remdesivir mouse PK studies26–27. Briefly, mice received a single equal mole dose (54.4 μmole/kg) of RDV (32.8 mg/kg), IsoRDV (30.5 mg/kg), MeRDV (31.3 mg/kg) via tail vein injection (IV bolus) and oral gavage. Mice received a single equal mole dose of Nuc (15.8 mg/kg) via tail vein injection (IV bolus). Mice received a single equal mole dose of GS-621763 (27.3 mg/kg) only via oral gavage because GS-621763 is designated as an oral prodrug of Nuc6–7 and its cell incubations did not show significant improvement in intracellular bioactivation than Nuc in this study. The dose was converted from the recommended human dose (i.e., Day one loading dose: 200 mg) by a factor of 12.3. For each drug treatment by each dose route, 5 × 3 or 4 (replicates) mice were used: specifically, for each complete PK curve, we used five (A, B, C, D, E) mice: mouse A donated its plasma samples at 0.25 and 1 hour and its tissue samples at 1-hour post drug administration; mouse B donated its plasma samples at 0.5 and 2 hour and its tissue samples at 2-hour post drug administration; mouse C donated its plasma samples at 4 and 8 hour and its tissue samples at 8-hour post drug administration; mouse D donated its plasma sample and tissue samples at 12-hour post drug administration; mouse E donated its plasma sample and tissue samples at 24-hour post drug administration. In total, we used approximately 160 mice.
Mouse plasma sample preparation for quantification of prodrugs, Ala, and Nuc
Orbital blood was taken from four mice at 0.25, 0.5, 1, 2, 4, 6, 8, 12, and 24 hours after drug administration. Blood samples were centrifuged under 7000 × g for 5 min at 4 °C. The supernatants (plasma) were collected and stored at −80 °C until analysis. 20 μL of plasma were mixed with 100 μL of methanol containing 0.25 μM 2-chloro-adenosine (2-Cl-adenosine) as an internal standard. The samples were then vortexed for 5 min and centrifuged at 21,130× g for 10 min at 4 °C, and 80 μL supernatants were transferred to clean tubes and evaporated in a SpeedVac SPD1010 vacuum concentrator (Thermo Scientific, Hudson, NH). The dried samples were resuspended in 40 μL of 3% acetonitrile containing 0.1% formic acid for LC-MS/MS analysis.
Mouse tissue sample preparation for quantification of active metabolites
Extraction buffer was prepared according to the formula from a previous study that can stabilize RDV-MP and RDV-TP in the mouse tissue samples26, 41: The PhosSTOP working solution was prepared by dissolving one tablet of PhosSTOP EASY pack in 1 mL water. The extraction buffer consisted of 70% methanol, 10% PhosSTOP working solution, 50 μM DTNB, and 2% formic acid. Lungs, livers, kidneys, testis, and brains were collected 1, 2, 4, and 8 hours after drug administration and snap frozen. On dry ice, frozen tissue samples were pulverized and weighed. Two volumes of ice-cold extraction buffer were immediately added to the powder of mouse lung, kidney, small intestine, testis, and brain. Three volumes of ice-cold extraction buffer were immediately added to the mouse liver powder. The mixture was vortexed thoroughly and then added with an equal volume of water (equal to the volume of extraction buffer). The mixture was vortexed at 1,500 rpm on a shaker (Benchmark, Multi-Therm™) for 10 min and then centrifugated at 21,130 × g for 10 min at 4 °C to remove the precipitated proteins. The supernatants were transferred to clean tubes and then centrifugated at 21,130 × g for 10 min at 4 °C before the LC-MS/MS analysis.
LC-MS/MS analysis for prodrugs and metabolites
The LC-MS/MS analysis methods for prodrugs RDV, MeRDV, IsoRDV, and GS-621763, and metabolites Ala, Nuc, RDV-MP, and RDV-TP were established based on the methods reported from previous studies26, 40–42 with minor modifications. The LC-MS/MS system consisted of a SCIEX API 3000 mass spectrometer and a Shimadzu UFLC system (Shimadzu, Tokyo, Japan). For the quantification of RDV, MeRDV, IsoRDV, Ala, and Nuc, We used a RESTEK Ultra II C18 column (5 μm, 50 cm × 2.1 mm, Bellefonte, PA, USA) with a RESTEK UltraShield UHPLC precolumn filter (0.2 μm frit, Bellefonte, PA, USA) for chromatographic separation at 45 °C. Mobile phase A was water containing 0.1% (v/v) formic acid, and mobile phase B was ACN containing 0.1% (v/v) formic acid. The mobile phase flow rate was 0.5 mL/min, and 1 μL sample was injected for analysis. For the gradient program, mobile phase B was at 5% for the first 0.1 min, increased to 90% during the period of 0.1 min – 2 min and maintained at 90% for 1 min, then returned to 5% at 3.1 min and maintained at 5% until the end of the gradient at 5 min.
For the quantification of RDV-MP and RDV-TP, we used a BioBasic AX column (2.1 × 50 mm, 4.6 μm; ThermoFisher) with a RESTEK UltraShield UHPLC precolumn filter (0.2 μm frit, Bellefonte, PA, USA) for chromatographic separation at 50 °C. Mobile phase A was ACN-H2O (3:7, v/v) with 10 mM NH4Ac (pH 6.0), and mobile phase B was ACN-H2O (3:7, v/v) with 1 mM NH4Ac (pH 10). The mobile phase flow rate was 0.6 mL/min, and 10 μL sample was injected for analysis. For the gradient program, mobile phase B was at 2% for the first 0.1 min, increased to 60% during the period of 0.1 min – 0.35 min, and maintained at 60% until 0.75 min, then continued to increase to 98% during the period of 0.75 – 3.5 min and returned to 2% at 3.7 min and maintained at 2% until the end of the gradient at 5 min. We operated the MS in a positive mode with turbo electrospray ionization. The following MS parameters were adopted for all compounds: nebulizer gas: 15 psi; curtain gas: 15 psi; collision gas: 6 psi; ion spray voltage: 5500 V; source temperature: 550°C. For each compound, the MS delustering potential (DP), focusing potential (FP), entrance potential (EP), collision energy (CE), and collision cell exit potential (CXP) were summarized in Table S6. For prodrugs, Ala, and Nuc in tissue S9, enzyme reaction samples, and mouse plasma, the analytes were quantified using an 8-point standard curve with concentrations ranging from 31.25 to 20,000 nM, and the calibrators were prepared in extracts from untreated tissue S9, enzyme reaction systems, or mouse plasma. For intracellular metabolites quantification, analytes were quantified using a 5- to 8-point standard curve ranging in concentration from 39.0625 to 10,000 nM prepared in extracts from untreated cells or mouse tissues. All the regression coefficients of calibration curves were greater than 0.99. The peak area ratios of analytes to the internal standards were used for quantification. Quality control samples were used to ensure accuracy and precision and prepared with untreated tissue S9, enzyme reaction systems, and extracts from cells, mouse plasma, or mouse tissues.
Expression of enzymes and transporters affecting the bioactivation of RDV
RDV-activating enzymes and related transporters were selected based on their functions confirmed in previous studies, summarized in Table S7. The mRNA expression data of the enzymes and transporters of interest were extracted from the Human Protein Atlas (HPA) (http://www.proteinatlas.org)43, in which the highest single-cell mRNA expression value found in a particular cell type or cell line was adopted. The mRNA expression of enzymes and transporters in Vero E6 and Calu-3 cells was extracted from a recent study44. We selected several human tissue single cells for data analysis, including three types of human lung tissue cells: alveolar epithelial type 1 (AT1) and type 2 (AT2) cells, macrophages, endothelial cells, and two types of human bronchus cells: basal respiratory cells and respiratory ciliated cells. Among these, AT2 and respiratory ciliated cells are the major targets infected by SARS-CoV-245–46. The protein expression data in human and mouse tissues were obtained from the ProteomicsDB (https://www.proteomicsdb.org)47.
Data analysis
The plasma PK data were analyzed using the software MonolixSuite 2023R1 (Lixoft; Orsay–France). The main PK parameters were calculated using a noncompartmental model. The maximum blood or tissue concentration (Cmax) and time to Cmax (Tmax) were determined from the observed data. The area under the concentration versus time curve up to the last measured point (AUC0-t) was calculated using the trapezoidal rule. The area under the concentration versus time curve from time zero to infinity (AUC0-∞) was estimated by extrapolating AUC0-t to infinity using the trapezoidal rule-extrapolation method. The terminal elimination half-life (t1/2) was calculated by dividing ln2 by the terminal elimination rate constant λz, which was determined by linear regression of at least three data points from the terminal portion of the concentration versus time plots. The total drug cell entry within 6 hours was estimated by the summation of intracellular concentrations of the prodrug, Ala, Nuc, RDV-MP, and RDV-TP measured 6 hours post-treatment.
GraphPad Prism 9.0 (GraphPad Software, San Diego, CA) was used to generate graphs. IBM SPSS 28.0 (IBM Corp, Armonk, NY) was used for statistical analysis. The analysis of variance (ANOVA) was used to analyze the differences between groups. The linear association between two variances was assessed using Pearson’s correlation analysis. A P-value less than 0.05 was considered statistically significant. Specific tests to determine statistical significance are noted in each figure legend.
Supplementary Material
Fig. S1. Major product metabolites in human tissue homogenates after incubation with prodrugs.
Fig. S2. Intracellular concentrations of RDV-MP in various cell lines.
Fig. S3. Intracellular concentrations of prodrugs, Nuc, and Ala at six hours post-treatment in various cell lines.
Fig. S4. Nuc concentrations in the culture medium after 24 hours of drug incubations with or without Huh-7 cells.
Fig. S5. A549-ACE2-TMPRSS2 cell viability at 24 hours after the addition of 25 μM drugs.
Fig. S6. mRNA expression of ProTides activating enzymes and transporters in various cells.
Fig. S7. Protein expression of activating enzymes and transporters in mouse and human tissues.
Table S1. Intracellular accumulation of the active metabolite RDV-TP of prodrugs in various cell lines.
Table S2. Total drug cell entry within six hours of prodrugs in various cell lines.
Table S3. Active metabolite formation rate of prodrugs in various cell lines.
Table S4. Demographic information of the tissue S9 donors.
Table S5. Cell lines selected for this study.
Table S6. Mass spectrometry parameters for RDV analogs and their metabolites.
Table S7. Enzymes and transporters involved in the metabolism and disposition of RDV.
Acknowledgements
The authors thank Dr. Ruiting Li for the development of LC-MS/MS analysis method, thank Dr. Kathleen A. Stringer, Dr. Hui Jiang, and Dr. Jeong Mi Park at University of Michigan for advice on the study design and data analysis, and thank Dr. Darrell Kotton, Dr. Kostas Alysandratos and Kasey Minakin at the Center for Regenerative Medicine of Boston University and Boston Medical Center for providing iPSC-derived Alveolar Type 2 (iAT2) cells. This work was partly supported by the National Institute of Allergy and Infectious Diseases (R21AI163425, to H.J.Z.) and the National Institute of General Medical Sciences (R01GM144401, to H.J.Z.). J.L. was supported by the Rackham Predoctoral Fellowship program. Preparation and sharing of iAT2s was supported by NHLBI resources sharing grant, N01: 75N92020C00005 (Kotton).
Abbreviations Used:
- Ala
GS-704277, alanine metabolite of Remdesivir
- AUC
area under the curve
- AT1
alveolar epithelial type 1 cells
- AT2
alveolar epithelial type 2 cells
- ACN
acetonitrile
- ANOVA
analysis of variance
- BNPP
Bis-(p-nitrophenyl) phosphate
- BEGM
bronchial epithelial cell growth medium
- COVID-19
Coronavirus disease 2019
- CES1
carboxylesterase 1
- CatA
Cathepsin A
- Ces1c −/−
carboxylesterase 1c knockout
- CC50
50% cytotoxic concentration
- CE
collision energy
- CTSA
Cathepsin A
- Ctsa
Cathepsin A
- CXP
collision cell exit potential
- DTNB
55’ dithiobis (2-nitrobenzoic acid)
- DP
delustering potential
- DMEM
Dulbecco’s Modified Eagle Medium
- EC50
half maximal effective concentration
- EP
entrance potential
- EMEM
Eagle’s Minimum Essential Medium
- FBS
fetal bovine serum
- FP
focusing potential
- HINT1
histidine triad nucleotide binding protein-1
- HlungS9
human lung S9
- HIS9
human intestine S9
- HKS9
human kidney S9
- HLS9
human liver S9
- HPA
Human Protein Atlas
- IsoRDV
isopropyl ester analog of remdesivir
- IV
intravenous
- iPSC-AT2
induced pluripotent stem cell-derived alveolar epithelial type II-like cells
- LC-MS/MS
liquid chromatography with tandem mass spectrometry
- MeRDV
methylpropyl ester analog of remdesivir
- MOI
multiplicity of infection
- MRP4
multidrug resistance-associated protein 4
- OATP1B1
Organic anion transporting polypeptide 1B1
- P-gp
P-glycoprotein
- PK
pharmacokinetic
- ProTide
phosphoramidate prodrug
- RDV
remdesivir
- RDV-TP
remdesivir-triphosphate
- RDV-MP
remdesivir-monophosphate
- rhCatA
recombinant human Cathepsin A
- rhCES1
recombinant human carboxylesterase 1
- SARS-CoV-2
severe acute respiratory syndrome related coronavirus
- S.D.
standard deviation
- SAR
structure-activity relationship
- TCID50
50% tissue culture infectious dose
Footnotes
Supporting Information
Molecular Formula Strings (CSV)
Supplementary data tables and figures (PDF)
REFERENCES
- 1.Mackman RL, Phosphoramidate Prodrugs Continue to Deliver, The Journey of Remdesivir (GS-5734) from RSV to SARS-CoV-2. ACS Medicinal Chemistry Letters 2022, 13 (3), 338–347. [DOI] [PMC free article] [PubMed] [Google Scholar]
- 2.Eastman RT; Roth JS; Brimacombe KR; Simeonov A; Shen M; Patnaik S; Hall MD, Remdesivir: A Review of Its Discovery and Development Leading to Emergency Use Authorization for Treatment of COVID-19. ACS Cent Sci 2020, 6 (5), 672–683. [DOI] [PMC free article] [PubMed] [Google Scholar]
- 3.Rahmah L; Abarikwu SO; Arero AG; Essouma M; Jibril AT; Fal A; Flisiak R; Makuku R; Marquez L; Mohamed K; Ndow L; Zarębska-Michaluk D; Rezaei N; Rzymski P, Oral antiviral treatments for COVID-19: opportunities and challenges. Pharmacological Reports 2022, 74 (6), 1255–1278. [DOI] [PMC free article] [PubMed] [Google Scholar]
- 4.Li J; Xue Y; Wang X; Smith LS; He B; Liu S; Zhu H-J, Tissue- and cell-expression of druggable host proteins provide insights into repurposing drugs for COVID-19. Clinical and Translational Science 2022, 15 (12), 2796–2811. [DOI] [PMC free article] [PubMed] [Google Scholar]
- 5.De Schutter C; Ehteshami M; Hammond ET; Amblard F; Schinazi RF, Metabolism of nucleosides and nucleotides prodrugs. Current Pharmaceutical Design 2017, 23 (45), 6984–7002. [DOI] [PubMed] [Google Scholar]
- 6.Schäfer A; Martinez DR; Won JJ; Meganck RM; Moreira FR; Brown AJ; Gully KL; Zweigart MR; Conrad WS; May SR; Dong S; Kalla R; Chun K; Pont VD; Babusis D; Tang J; Murakami E; Subramanian R; Barrett KT; Bleier BJ; Bannister R; Feng JY; Bilello JP; Cihlar T; Mackman RL; Montgomery SA; Baric RS; Sheahan TP, Therapeutic treatment with an oral prodrug of the remdesivir parental nucleoside is protective against SARS-CoV-2 pathogenesis in mice. Science Translational Medicine 2022, 0 (0), eabm3410. [DOI] [PMC free article] [PubMed] [Google Scholar]
- 7.Cox RM; Wolf JD; Lieber CM; Sourimant J; Lin MJ; Babusis D; DuPont V; Chan J; Barrett KT; Lye D; Kalla R; Chun K; Mackman RL; Ye C; Cihlar T; Martinez-Sobrido L; Greninger AL; Bilello JP; Plemper RK, Oral prodrug of remdesivir parent GS-441524 is efficacious against SARS-CoV-2 in ferrets. Nature Communications 2021, 12 (1), 6415. [DOI] [PMC free article] [PubMed] [Google Scholar]
- 8.Pruijssers AJ; George AS; Schäfer A; Leist SR; Gralinksi LE; Dinnon KH; Yount BL; Agostini ML; Stevens LJ; Chappell JD; Lu X; Hughes TM; Gully K; Martinez DR; Brown AJ; Graham RL; Perry JK; Du Pont V; Pitts J; Ma B; Babusis D; Murakami E; Feng JY; Bilello JP; Porter DP; Cihlar T; Baric RS; Denison MR; Sheahan TP, Remdesivir Inhibits SARS-CoV-2 in Human Lung Cells and Chimeric SARS-CoV Expressing the SARS-CoV-2 RNA Polymerase in Mice. Cell Reports 2020, 32 (3), 107940. [DOI] [PMC free article] [PubMed] [Google Scholar]
- 9.Williamson BN; Feldmann F; Schwarz B; Meade-White K; Porter DP; Schulz J; van Doremalen N; Leighton I; Yinda CK; Pérez-Pérez L; Okumura A; Lovaglio J; Hanley PW; Saturday G; Bosio CM; Anzick S; Barbian K; Cihlar T; Martens C; Scott DP; Munster VJ; de Wit E, Clinical benefit of remdesivir in rhesus macaques infected with SARS-CoV-2. Nature 2020, 585 (7824), 273–276. [DOI] [PMC free article] [PubMed] [Google Scholar]
- 10.Pitts J; Li J; Perry JK; Pont VD; Riola N; Rodriguez L; Lu X; Kurhade C; Xie X; Camus G; Manhas S; Martin R; Shi P-Y; Cihlar T; Porter DP; Mo H; Maiorova E; Bilello JP, Remdesivir and GS-441524 Retain Antiviral Activity against Delta, Omicron, and Other Emergent SARS-CoV-2 Variants. Antimicrobial Agents and Chemotherapy 2022, 66 (6), e00222–22. [DOI] [PMC free article] [PubMed] [Google Scholar]
- 11.Beigel JH; Tomashek KM; Dodd LE; Mehta AK; Zingman BS; Kalil AC; Hohmann E; Chu HY; Luetkemeyer A; Kline S; Lopez de Castilla D; Finberg RW; Dierberg K; Tapson V; Hsieh L; Patterson TF; Paredes R; Sweeney DA; Short WR; Touloumi G; Lye DC; Ohmagari N; Oh M.-d.; Ruiz-Palacios GM; Benfield T; Fätkenheuer G; Kortepeter MG; Atmar RL; Creech CB; Lundgren J; Babiker AG; Pett S; Neaton JD; Burgess TH; Bonnett T; Green M; Makowski M; Osinusi A; Nayak S; Lane HC, Remdesivir for the Treatment of Covid-19 — Final Report. 2020. [DOI] [PMC free article] [PubMed]
- 12.Repurposed Antiviral Drugs for Covid-19 — Interim WHO Solidarity Trial Results. New England Journal of Medicine 2020, 384 (6), 497–511. [DOI] [PMC free article] [PubMed] [Google Scholar]
- 13.Goldman JD; Lye DCB; Hui DS; Marks KM; Bruno R; Montejano R; Spinner CD; Galli M; Ahn M-Y; Nahass RG; Chen Y-S; SenGupta D; Hyland RH; Osinusi AO; Cao H; Blair C; Wei X; Gaggar A; Brainard DM; Towner WJ; Muñoz J; Mullane KM; Marty FM; Tashima KT; Diaz G; Subramanian A, Remdesivir for 5 or 10 Days in Patients with Severe Covid-19. New England Journal of Medicine 2020, 383 (19), 1827–1837. [DOI] [PMC free article] [PubMed] [Google Scholar]
- 14.Wang Y; Zhang D; Du G; Du R; Zhao J; Jin Y; Fu S; Gao L; Cheng Z; Lu Q; Hu Y; Luo G; Wang K; Lu Y; Li H; Wang S; Ruan S; Yang C; Mei C; Wang Y; Ding D; Wu F; Tang X; Ye X; Ye Y; Liu B; Yang J; Yin W; Wang A; Fan G; Zhou F; Liu Z; Gu X; Xu J; Shang L; Zhang Y; Cao L; Guo T; Wan Y; Qin H; Jiang Y; Jaki T; Hayden FG; Horby PW; Cao B; Wang C, Remdesivir in adults with severe COVID-19: a randomised, double-blind, placebo-controlled, multicentre trial. The Lancet 2020, 395 (10236), 1569–1578. [DOI] [PMC free article] [PubMed] [Google Scholar]
- 15.Sun D, Remdesivir for Treatment of COVID-19: Combination of Pulmonary and IV Administration May Offer Aditional Benefit. The AAPS journal 2020, 22 (4), 77–77. [DOI] [PMC free article] [PubMed] [Google Scholar]
- 16.Yan VC; Muller FL, Why Remdesivir Failed: Preclinical Assumptions Overestimate the Clinical Efficacy of Remdesivir for COVID-19 and Ebola. Antimicrobial Agents and Chemotherapy 2021, 65 (10), e01117–21. [DOI] [PMC free article] [PubMed] [Google Scholar]
- 17.Yan VC; Muller FL, Advantages of the Parent Nucleoside GS-441524 over Remdesivir for Covid-19 Treatment. ACS Medicinal Chemistry Letters 2020, 11 (7), 1361–1366. [DOI] [PMC free article] [PubMed] [Google Scholar]
- 18.Zhang F; Li H-X; Zhang T-T; Xiong Y; Wang H-N; Lu Z-H; Xiong L; He Y-Q; Ge G-B, Human carboxylesterase 1A plays a predominant role in the hydrolytic activation of remdesivir in humans. Chemico-Biological Interactions 2022, 351, 109744. [DOI] [PubMed] [Google Scholar]
- 19.Humeniuk R; Mathias A; Cao H; Osinusi A; Shen G; Chng E; Ling J; Vu A; German P, Safety, Tolerability, and Pharmacokinetics of Remdesivir, An Antiviral for Treatment of COVID‐19, in Healthy Subjects. Clinical and Translational Science 2020, 13 (5), 896–906. [DOI] [PMC free article] [PubMed] [Google Scholar]
- 20.Babusis D; Phan TK; Lee WA; Watkins WJ; Ray A. S. J. M. p., Mechanism for effective lymphoid cell and tissue loading following oral administration of nucleotide prodrug GS-7340. 2013, 10 (2), 459–466. [DOI] [PubMed] [Google Scholar]
- 21.Sofia MJ; Bao D; Chang W; Du J; Nagarathnam D; Rachakonda S; Reddy PG; Ross BS; Wang P; Zhang HR; Bansal S; Espiritu C; Keilman M; Lam AM; Micolochick Steuer HM; Niu C; Otto MJ; Furman PA, Discovery of a β-d-2′-deoxy-2′-α-fluoro-2′-β-C-methyluridine nucleotide prodrug (PSI-7977) for the treatment of hepatitis C virus. J. Med. Chem 2010, 53, 7202. [DOI] [PubMed] [Google Scholar]
- 22.Siegel D; Hui HC; Doerffler E; Clarke MO; Chun K; Zhang L; Neville S; Carra E; Lew W; Ross B; Wang Q; Wolfe L; Jordan R; Soloveva V; Knox J; Perry J; Perron M; Stray KM; Barauskas O; Feng JY; Xu Y; Lee G; Rheingold AL; Ray AS; Bannister R; Strickley R; Swaminathan S; Lee WA; Bavari S; Cihlar T; Lo MK; Warren TK; Mackman RL, Discovery and Synthesis of a Phosphoramidate Prodrug of a Pyrrolo[2,1-f][triazin-4-amino] Adenine C-Nucleoside (GS-5734) for the Treatment of Ebola and Emerging Viruses. Journal of Medicinal Chemistry 2017, 60 (5), 1648–1661. [DOI] [PubMed] [Google Scholar]
- 23.Murakami E; Tolstykh T; Bao H; Niu C; Steuer HMM; Bao D; Chang W; Espiritu C; Bansal S; Lam AM, Mechanism of activation of PSI-7851 and its diastereoisomer PSI-7977. Journal of Biological Chemistry 2010, 285 (45), 34337–34347. [DOI] [PMC free article] [PubMed] [Google Scholar]
- 24.Schooley RT; Carlin AF; Beadle JR; Valiaeva N; Zhang X-Q; Clark AE; McMillan RE; Leibel SL; McVicar RN; Xie J; Garretson AF; Smith VI; Murphy J; Hostetler KY, Rethinking Remdesivir: Synthesis, Antiviral Activity, and Pharmacokinetics of Oral Lipid Prodrugs. Antimicrobial Agents and Chemotherapy 2021, 65 (10), e01155–21. [DOI] [PMC free article] [PubMed] [Google Scholar]
- 25.Li J; Zhang K; Wu D; Ren L; Chu X; Qin C; Han X; Hang T; Xu Y; Yang L; Yin L, Liposomal remdesivir inhalation solution for targeted lung delivery as a novel therapeutic approach for COVID-19. Asian Journal of Pharmaceutical Sciences 2021, 16 (6), 772–783. [DOI] [PMC free article] [PubMed] [Google Scholar]
- 26.Hu W.-j.; Chang L; Yang Y; Wang X; Xie Y.-c.; Shen J.-s.; Tan B; Liu J, Pharmacokinetics and tissue distribution of remdesivir and its metabolites nucleotide monophosphate, nucleotide triphosphate, and nucleoside in mice. Acta pharmacologica Sinica 2021, 42 (7), 1195–1200. [DOI] [PMC free article] [PubMed] [Google Scholar]
- 27.Sheahan TP; Sims AC; Graham RL; Menachery VD; Gralinski LE; Case JB; Leist SR; Pyrc K; Feng JY; Trantcheva I; Bannister R; Park Y; Babusis D; Clarke MO; Mackman RL; Spahn JE; Palmiotti CA; Siegel D; Ray AS; Cihlar T; Jordan R; Denison MR; Baric RS, Broad-spectrum antiviral GS-5734 inhibits both epidemic and zoonotic coronaviruses. Science Translational Medicine 2017, 9 (396), eaal3653. [DOI] [PMC free article] [PubMed] [Google Scholar]
- 28.Siegel D; Hui HC; Doerffler E; Clarke MO; Chun K; Zhang L; Neville S; Carra E; Lew W; Ross B, Discovery and Synthesis of a Phosphoramidate Prodrug of a Pyrrolo [2, 1-f][triazin-4-amino] Adenine C-Nucleoside (GS-5734) for the Treatment of Ebola and Emerging Viruses. ACS Publications: 2017. [DOI] [PubMed] [Google Scholar]
- 29.Falconer DS; Gauld IK; Roberts RC, Cell numbers and cell sizes in organs of mice selected for large and small body size. Genetics Research 1978, 31 (3), 287–301. [DOI] [PubMed] [Google Scholar]
- 30.Li R; Liclican A; Xu Y; Pitts J; Niu C; Zhang J; Kim C; Zhao X; Soohoo D; Babusis D; Yue Q; Ma B; Murray Bernard P; Subramanian R; Xie X; Zou J; Bilello John P; Li L; Schultz Brian E; Sakowicz R; Smith Bill J; Shi P-Y; Murakami E; Feng Joy Y, Key Metabolic Enzymes Involved in Remdesivir Activation in Human Lung Cells. Antimicrobial Agents and Chemotherapy 2021, 0 (ja), AAC.00602–21. [DOI] [PMC free article] [PubMed] [Google Scholar]
- 31.Tao S; Zandi K; Bassit L; Ong YT; Verma K; Liu P; Downs-Bowen JA; McBrayer T; LeCher JC; Kohler JJ; Tedbury PR; Kim B; Amblard F; Sarafianos SG; Schinazi RF, Comparison of anti-SARS-CoV-2 activity and intracellular metabolism of remdesivir and its parent nucleoside. Current Research in Pharmacology and Drug Discovery 2021, 2, 100045. [DOI] [PMC free article] [PubMed] [Google Scholar]
- 32.Mackman RL; Hui HC; Perron M; Murakami E; Palmiotti C; Lee G; Stray K; Zhang L; Goyal B; Chun K; Byun D; Siegel D; Simonovich S; Du Pont V; Pitts J; Babusis D; Vijjapurapu A; Lu X; Kim C; Zhao X; Chan J; Ma B; Lye D; Vandersteen A; Wortman S; Barrett KT; Toteva M; Jordan R; Subramanian R; Bilello JP; Cihlar T, Prodrugs of a 1′-CN-4-Aza-7,9-dideazaadenosine C-Nucleoside Leading to the Discovery of Remdesivir (GS-5734) as a Potent Inhibitor of Respiratory Syncytial Virus with Efficacy in the African Green Monkey Model of RSV. Journal of Medicinal Chemistry 2021, 64 (8), 5001–5017. [DOI] [PubMed] [Google Scholar]
- 33.Fallon JK; Houvig N; Booth-Genthe CL; Smith PC, Quantification of membrane transporter proteins in human lung and immortalized cell lines using targeted quantitative proteomic analysis by isotope dilution nanoLC–MS/MS. J Pharm Biomed Anal 2018, 154, 150–157. [DOI] [PubMed] [Google Scholar]
- 34.Pitts J; Babusis D; Vermillion MS; Subramanian R; Barrett K; Lye D; Ma B; Zhao X; Riola N; Xie X; Kajon A; Lu X; Bannister R; Shi P-Y; Toteva M; Porter DP; Smith BJ; Cihlar T; Mackman R; Bilello JP, Intravenous delivery of GS-441524 is efficacious in the African green monkey model of SARS-CoV-2 infection. Antiviral Research 2022, 203, 105329. [DOI] [PMC free article] [PubMed] [Google Scholar]
- 35.Li Y; Cao L; Li G; Cong F; Li Y; Sun J; Luo Y; Chen G; Li G; Wang P; Xing F; Ji Y; Zhao J; Zhang Y; Guo D; Zhang X, Remdesivir Metabolite GS-441524 Effectively Inhibits SARS-CoV-2 Infection in Mouse Models. Journal of Medicinal Chemistry 2022, 65 (4), 2785–2793. [DOI] [PubMed] [Google Scholar]
- 36.Vermillion MS; Murakami E; Ma B; Pitts J; Tomkinson A; Rautiola D; Babusis D; Irshad H; Siegel D; Kim C; Zhao X; Niu C; Yang J; Gigliotti A; Kadrichu N; Bilello JP; Ellis S; Bannister R; Subramanian R; Smith B; Mackman RL; Lee WA; Kuehl PJ; Hartke J; Cihlar T; Porter DP, Inhaled remdesivir reduces viral burden in a nonhuman primate model of SARS-CoV-2 infection. Science Translational Medicine 2022, 0 (0), eabl828. [DOI] [PMC free article] [PubMed] [Google Scholar]
- 37.Gilead Sciences, I. Veklury Prescribing Information.; 2022.
- 38.Jacob A; Vedaie M; Roberts DA; Thomas DC; Villacorta-Martin C; Alysandratos K-D; Hawkins F; Kotton DN, Derivation of self-renewing lung alveolar epithelial type II cells from human pluripotent stem cells. Nature Protocols 2019, 14 (12), 3303–3332. [DOI] [PMC free article] [PubMed] [Google Scholar]
- 39.Jacob A; Morley M; Hawkins F; McCauley KB; Jean JC; Heins H; Na C-L; Weaver TE; Vedaie M; Hurley K; Hinds A; Russo SJ; Kook S; Zacharias W; Ochs M; Traber K; Quinton LJ; Crane A; Davis BR; White FV; Wambach J; Whitsett JA; Cole FS; Morrisey EE; Guttentag SH; Beers MF; Kotton DN, Differentiation of Human Pluripotent Stem Cells into Functional Lung Alveolar Epithelial Cells. Cell Stem Cell 2017, 21 (4), 472–488.e10. [DOI] [PMC free article] [PubMed] [Google Scholar]
- 40.Ouyang B; Zhou F; Zhen L; Peng Y; Sun J; Chen Q; Jin X; Wang G; Zhang J, Simultaneous determination of tenofovir alafenamide and its active metabolites tenofovir and tenofovir diphosphate in HBV-infected hepatocyte with a sensitive LC–MS/MS method. J Pharm Biomed Anal 2017, 146, 147–153. [DOI] [PubMed] [Google Scholar]
- 41.Hu W; Chang L; Ke C; Xie Y; Shen J; Tan B; Liu J, Challenges and stepwise fit-for-purpose optimization for bioanalyses of remdesivir metabolites nucleotide monophosphate and triphosphate in mouse tissues using LC–MS/MS. J Pharm Biomed Anal 2021, 194, 113806. [DOI] [PMC free article] [PubMed] [Google Scholar]
- 42.Rower JE; Jimmerson LC; Chen X; Zheng J-H; Hodara A; Bushman LR; Anderson PL; Kiser JJ, Validation and Application of a Liquid Chromatography-Tandem Mass Spectrometry Method To Determine the Concentrations of Sofosbuvir Anabolites in Cells. Antimicrobial agents and chemotherapy 2015, 59 (12), 7671–7679. [DOI] [PMC free article] [PubMed] [Google Scholar]
- 43.Uhlén M; Fagerberg L; Hallström BM; Lindskog C; Oksvold P; Mardinoglu A; Sivertsson Å; Kampf C; Sjöstedt E; Asplund AJS, Tissue-based map of the human proteome. Science (New York, N.Y.) 2015, 347 (6220). [DOI] [PubMed] [Google Scholar]
- 44.Zhang J; He M; Xie Q; Su A; Yang K; Liu L; Liang J; Li Z; Huang X; Hu J; Liu Q; Song B; Hu C; Chen L; Wang Y, Predicting In Vitro and In Vivo Anti-SARS-CoV-2 Activities of Antivirals by Intracellular Bioavailability and Biochemical Activity. ACS Omega 2022, 7 (49), 45023–45035. [DOI] [PMC free article] [PubMed] [Google Scholar]
- 45.Schaefer I-M; Padera RF; Solomon IH; Kanjilal S; Hammer MM; Hornick JL; Sholl LM, In situ detection of SARS-CoV-2 in lungs and airways of patients with COVID-19. Modern Pathology 2020, 33 (11), 2104–2114. [DOI] [PMC free article] [PubMed] [Google Scholar]
- 46.Hou YJ; Okuda K; Edwards CE; Martinez DR; Asakura T; Dinnon KH; Kato T; Lee RE; Yount BL; Mascenik TM; Chen G; Olivier KN; Ghio A; Tse LV; Leist SR; Gralinski LE; Schäfer A; Dang H; Gilmore R; Nakano S; Sun L; Fulcher ML; Livraghi-Butrico A; Nicely NI; Cameron M; Cameron C; Kelvin DJ; de Silva A; Margolis DM; Markmann A; Bartelt L; Zumwalt R; Martinez FJ; Salvatore SP; Borczuk A; Tata PR; Sontake V; Kimple A; Jaspers I; O’Neal WK; Randell SH; Boucher RC; Baric RS, SARS-CoV-2 Reverse Genetics Reveals a Variable Infection Gradient in the Respiratory Tract. Cell 2020, 182 (2), 429–446.e14. [DOI] [PMC free article] [PubMed] [Google Scholar]
- 47.Wilhelm M; Schlegl J; Hahne H; Gholami AM; Lieberenz M; Savitski MM; Ziegler E; Butzmann L; Gessulat S; Marx H; Mathieson T; Lemeer S; Schnatbaum K; Reimer U; Wenschuh H; Mollenhauer M; Slotta-Huspenina J; Boese J-H; Bantscheff M; Gerstmair A; Faerber F; Kuster B, Mass-spectrometry-based draft of the human proteome. Nature 2014, 509 (7502), 582–587. [DOI] [PubMed] [Google Scholar]
Associated Data
This section collects any data citations, data availability statements, or supplementary materials included in this article.
Supplementary Materials
Fig. S1. Major product metabolites in human tissue homogenates after incubation with prodrugs.
Fig. S2. Intracellular concentrations of RDV-MP in various cell lines.
Fig. S3. Intracellular concentrations of prodrugs, Nuc, and Ala at six hours post-treatment in various cell lines.
Fig. S4. Nuc concentrations in the culture medium after 24 hours of drug incubations with or without Huh-7 cells.
Fig. S5. A549-ACE2-TMPRSS2 cell viability at 24 hours after the addition of 25 μM drugs.
Fig. S6. mRNA expression of ProTides activating enzymes and transporters in various cells.
Fig. S7. Protein expression of activating enzymes and transporters in mouse and human tissues.
Table S1. Intracellular accumulation of the active metabolite RDV-TP of prodrugs in various cell lines.
Table S2. Total drug cell entry within six hours of prodrugs in various cell lines.
Table S3. Active metabolite formation rate of prodrugs in various cell lines.
Table S4. Demographic information of the tissue S9 donors.
Table S5. Cell lines selected for this study.
Table S6. Mass spectrometry parameters for RDV analogs and their metabolites.
Table S7. Enzymes and transporters involved in the metabolism and disposition of RDV.