

Summary
The innate immune cGAS-STING pathway is activated by cytosolic dsDNA, a ubiquitous danger signal, to produce interferon, a potent anti-viral and anti-cancer cytokine. However, STING activation must be tightly controlled because aberrant interferon production leads to debilitating interferonopathies. Here, we discover PELI2 as a crucial negative regulator of STING. Mechanistically, PELI2 inhibits the transcription factor IRF3 by binding to phosphorylated Thr354 and Thr356 on the C-terminal tail of STING, leading to ubiquitination and inhibition of the kinase TBK1. PELI2 sets a threshold for STING activation that tolerates low levels of cytosolic dsDNA, such as that caused by silenced TREX1, RNASEH2B, BRCA1, or SETX. When this threshold is reached, such as during viral infection, STING-induced interferon production temporarily downregulates PELI2, creating a positive feedback loop allowing robust immune response. Lupus patients have insufficient PELI2 levels and high basal interferon production, suggesting PELI2 dysregulation may drive onset of lupus and other interferonopathies.
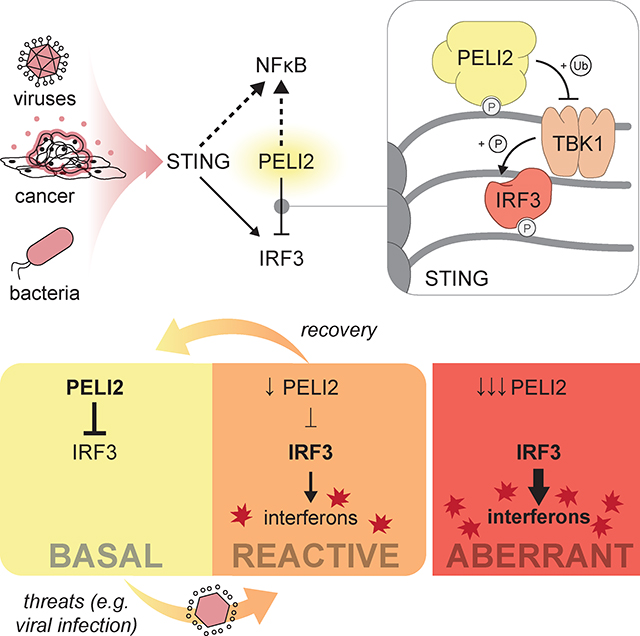
Graphical Abstract:
Introduction
The human body must properly detect and respond to both external threats, such as viral and bacterial infection, and internal threats, such as the development of cancer. Human cells are equipped with an array of innate immune pathways that detect these threats as different danger signals. One nearly ubiquitous pathway is the cGAS-STING pathway, which detects cytosolic double stranded DNA (dsDNA), a danger signal of many threats, including pathogen infection, cellular damage, and cancer. Following detection of cytosolic dsDNA, the enzyme cGAS is activated and synthesizes the small molecule second messenger of the pathway, 2′3′-cyclic-GMP-AMP (cGAMP), which binds and activates the pathway’s receptor, STING (Stimulator of Interferon Genes). STING activation triggers multiple distinct signaling events, including production of type-I interferons (IFNs) which have potent anti-viral and anti-cancer effects.1
While it is crucial that the cGAS-STING pathway responds potently to threats that result in high levels of cytosolic dsDNA, such as cancer and viral infection, the pathway must also be able to tolerate low levels of cytosolic dsDNA that are present basally. Without this tolerance, chronic activation of STING can result in lupus, Aicardi-Goutières syndrome (AGS), and neurodegeneration.2–4 Basal low levels of cytosolic dsDNA can arise from multiple sources, including endogenous retroviral elements, day-to-day cellular damage, and aging. It is clear that controlling basal levels of cytosolic dsDNA is essential for avoiding autoimmunity, as mutations in the cytosolic exonuclease gene TREX1 (Three Prime Exonuclease I) can cause the autoimmune condition AGS. 5 It is unknown, however, if the cGAS-STING pathway itself contains mechanisms to tolerate natural fluctuations in cytosolic dsDNA downstream of dsDNA sensing.
Here we identify PELI2 (Pellino E3 Ubiquitin Protein Ligase) as a regulator of STING signaling that prevents the pathway from being activated by basal levels of cytosolic dsDNA. Mechanistically, we show that PELI2 is recruited to phosphothreonine residues on STING where it can target the kinase TBK1 (TANK-Binding Kinase 1) for ubiquitination, preventing IRF3 (Interferon Regulatory Factor 3) phosphorylation and activation. Importantly, we find that once cytosolic dsDNA reaches a threshold, IFNs are produced to downregulate PELI2, creating a positive feedback loop that allows robust STING activation. Interestingly, in patients harboring autoimmune conditions we observe decreased PELI2 levels compared to healthy controls, suggesting that erroneous downregulation of PELI2 may fuel onset of autoimmunity.
Results
PELI2 selectively inhibits the IRF3 axis of STING signaling
We previously performed genome-wide CRISPR screens to identify regulators of STING signaling in U937 human monocytic cells.6,7 One of the highest ranked negative regulators from these screens is the E3-ubiquitin ligase PELI2. While PELI2 has not previously been suggested to be involved in STING signaling, studies have shown that PELI2 positively regulates other immune pathways, including TLR9 (Toll-like Receptor 9) signaling and NLRP3 (NLR Family Pyrin Domain Containing 3) inflammasome activation.8,9 To validate PELI2 as a negative regulator of STING signaling, we transduced U937 cells with a vector expressing Cas9 and a PELI2 sgRNA to create a PELI2 sgRNA cell line with ~81% knockout efficiency (Figure S1A). Although STING signaling is multibranched and activates multiple distinct pathways, our CRISPR screens enriched selectively for regulators of the IRF3 axis of STING signaling. We thus first focused on determining PELI2’s effects on the STING-IRF3 signaling axis. Mechanistically, the sequence of events that lead to activation of the transcription factor IRF3 through STING signaling have been well characterized: first, cGAMP binding to STING leads to a conformational change that exposes STING’s C-terminal tail (CTT; residues 341–379); second, the kinase TBK1 binds to a motif at the end of STING’s CTT and becomes active through auto-phosphorylation; third, active TBK1 phosphorylates the STING CTT on multiple serine and threonine residues, including Ser366; finally, IRF3 binds to phosphorylated Ser366 on the STING CTT, positioning IRF3 to be phosphorylated and activated by TBK1.
We evaluated the effect of PELI2 on each of these steps by measuring phosphorylation levels of TBK1, STING, and IRF3 following cGAMP treatment in WT or PELI2 sgRNA cells. Interestingly, cGAMP-treated PELI2 sgRNA cells had significantly more IRF3 phosphorylation than WT cells (Figure 1A–B); however, STING and TBK1 phosphorylation was not affected (Figure 1C–D). To see if this effect could be rescued by expression of ectopic PELI2, we transduced a doxycycline-inducible, sgRNA-resistant PELI2-FLAG expression vector into U937 PELI2 sgRNA cells to create U937 tet-PELI2-FLAG cells. By performing a titration of doxycycline induction of PELI2 in these cells, we found that increasing levels of PELI2-FLAG expression decreased levels of IRF3 phosphorylation in a dose dependent manner (Figure 1E). To mimic relevant, endogenous expression levels of PELI2, all subsequent experiments with tet-PELI2-FLAG cells were performed with 20 ng/mL doxycycline since this concentration restores the IRF3 phosphorylation response in PELI2 sgRNA cells to that of WT cells. We found that such induction of PELI2-FLAG in PELI2 sgRNA cells reduces IRF3 phosphorylation in response to cGAMP by ~50% (Figure 1F–G). Furthermore, PELI2-FLAG also reduced STING phosphorylation by ~25%, while having no effect on TBK1 phosphorylation (Figure 1H–I).
Figure 1: PELI2 selectively inhibits the IRF3 axis of STING signaling.
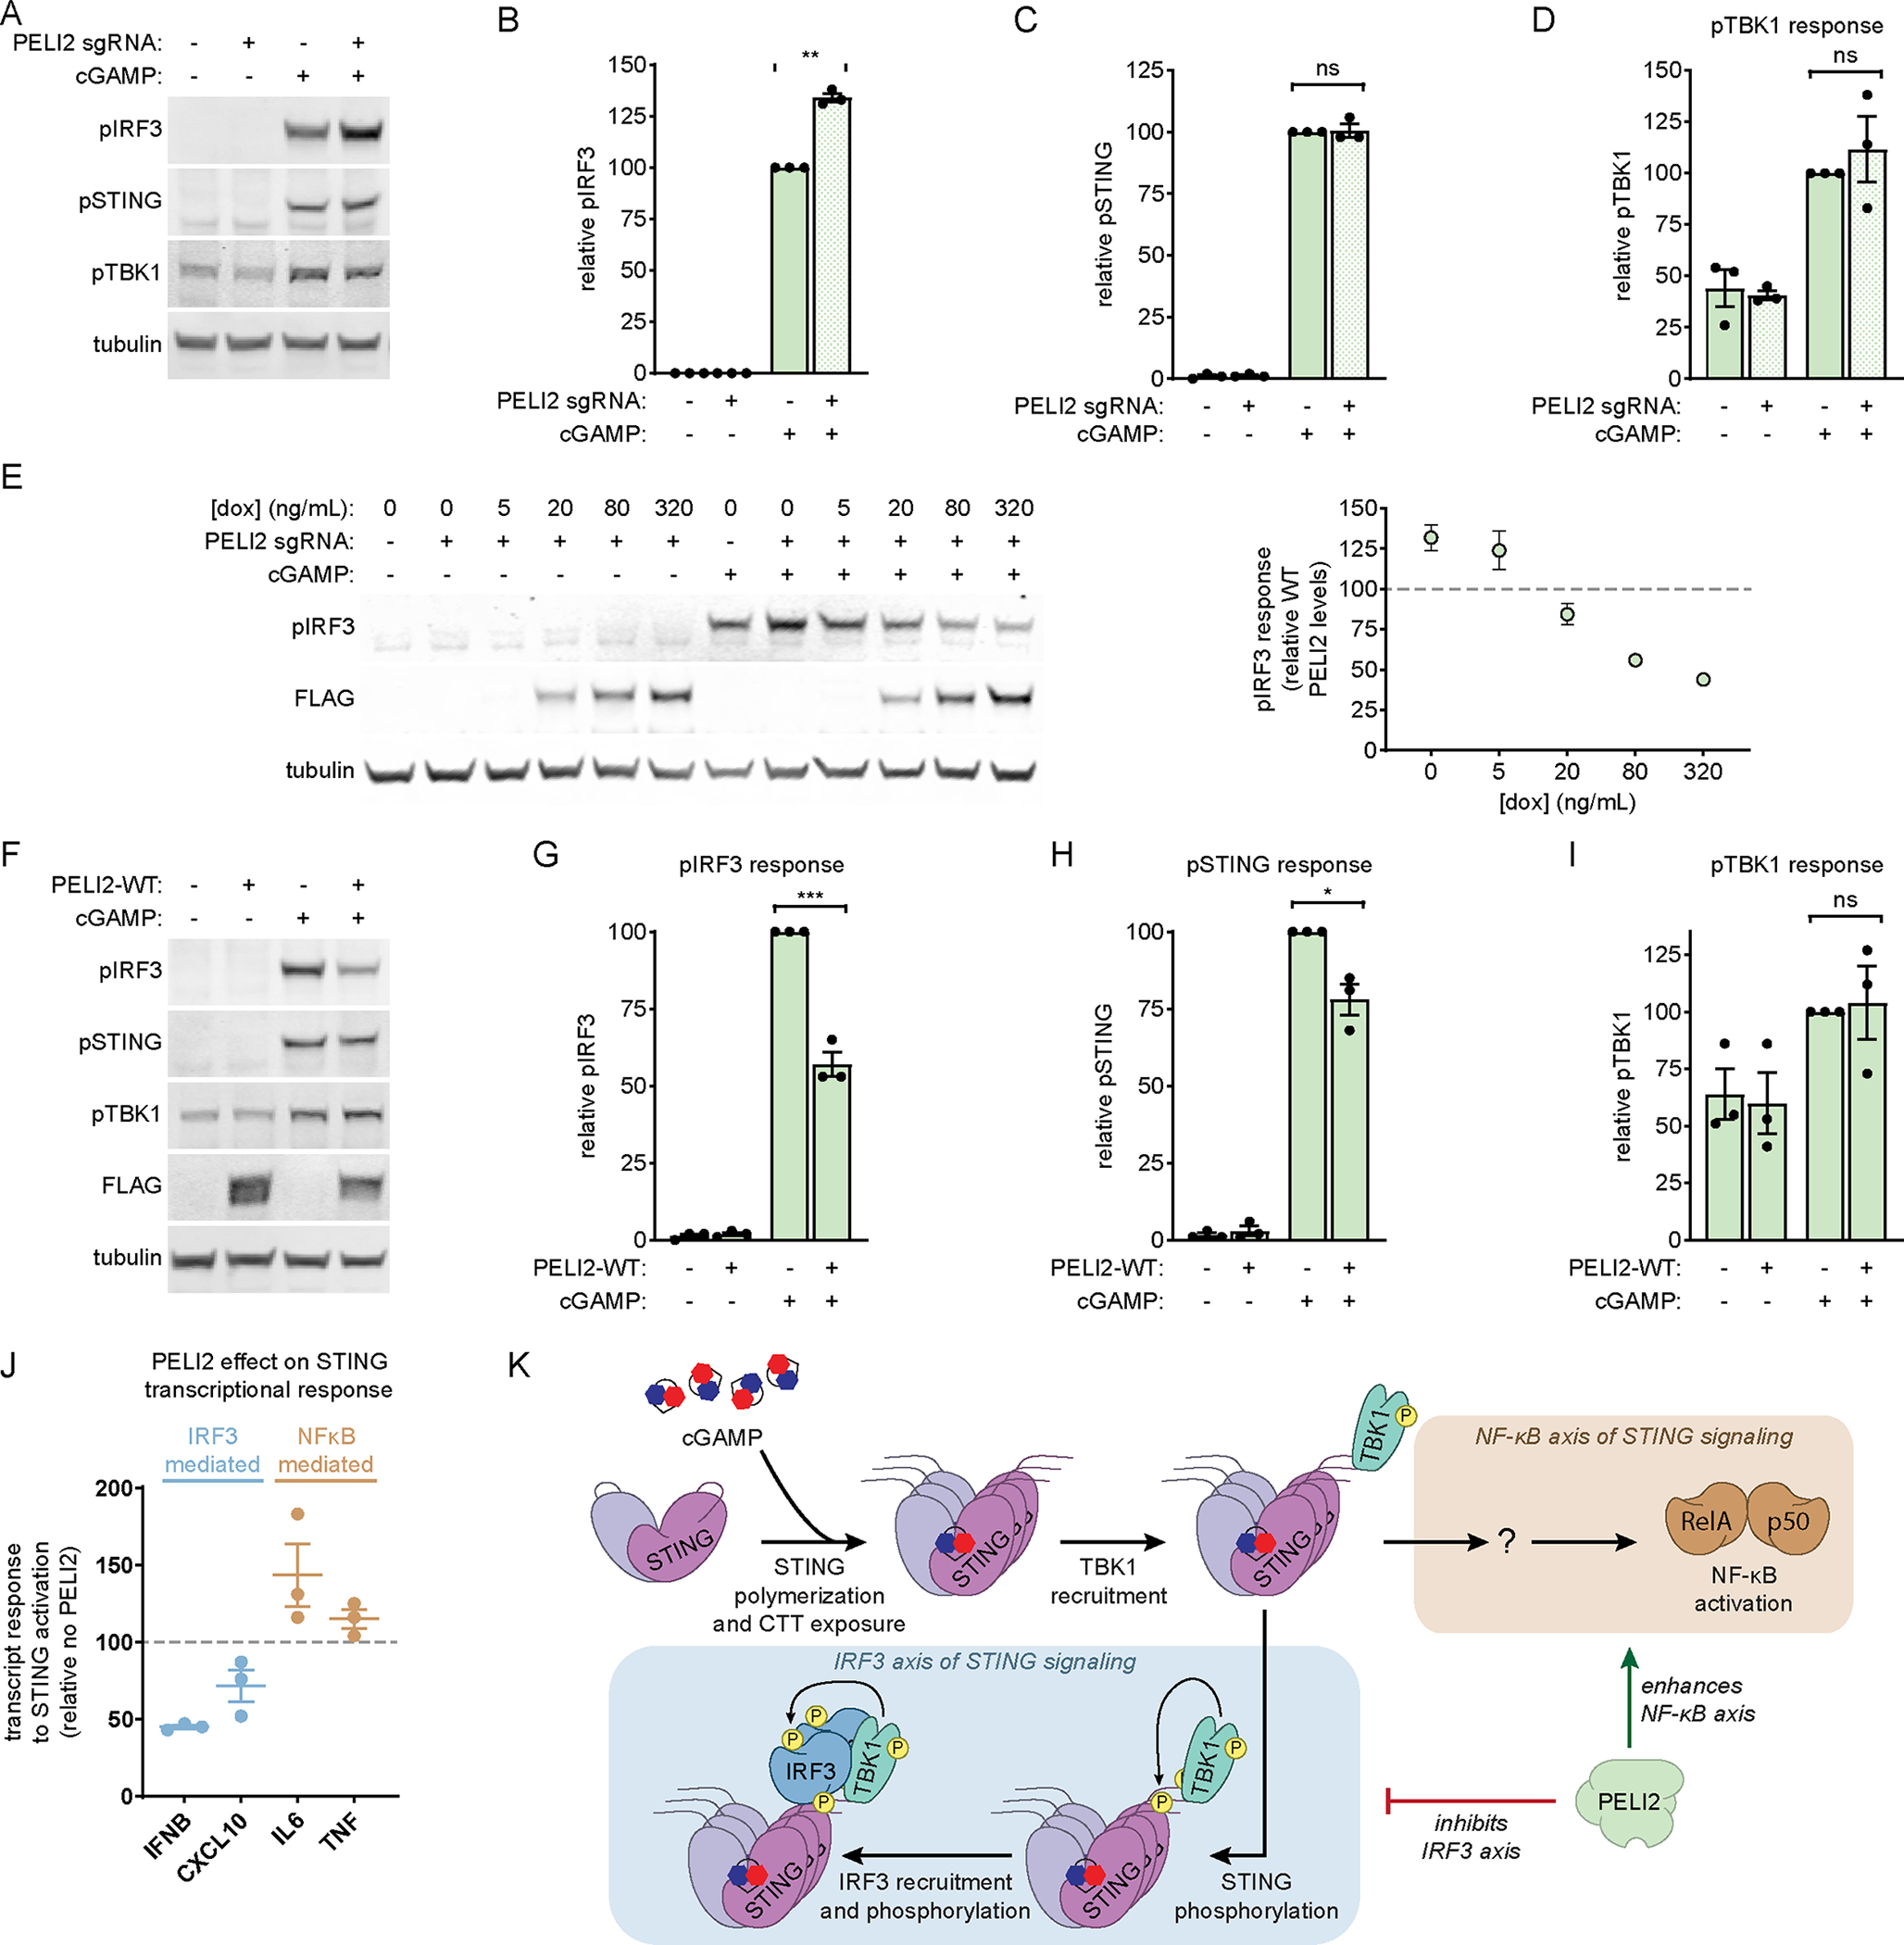
A) U937 WT and PELI2 sgRNA cells were treated with 50 μM cGAMP for 2 h. Band intensity was quantified and normalized to tubulin for B) phosphorylated IRF3, C) phosphorylated STING, and D) phosphorylated TBK1 (n = 3).
E) U937 tet-PELI2-FLAG-WT cells with PELI2 sgRNA were treated with a range of doxycycline (5–320 ng / mL) before treatment with 50 μM cGAMP for 2 h. Phosphorylated IRF3 band intensity was quantified and normalized to tubulin. Dotted line represents phosphorylated IRF3 response of U937 WT cells containing endogenous levels of PELI2 (n = 2).
F) U937 tet-PELI2-FLAG-WT cells were treated with 20 ng / mL doxycycline overnight before treatment with 50 μM cGAMP for 2 h. Band intensity was quantified and normalized to tubulin for G) phosphorylated IRF3, H) phosphorylated STING, and I) phosphorylated TBK1 (n = 3).
J) U937 tet-PELI2-FLAG-WT cells were induced with 20 ng / mL doxycycline overnight before treatment with 100 μM cGAMP for 3 h. Samples were then processed for RT-qPCR analysis of IFNB, CXCL10, IL6, and TNF transcript levels. Shown are transcript levels in PELI2 induced cells relative to uninduced cells (n = 3).
K) Model for PELI2’s regulation of STING signaling.
(A), (E), and (F) show Western blots representative of multiple independent experiments. For (B)-(E) and (G)-(J) data are shown as mean ± SEM. See also Figure S1.
Together, these data indicate that PELI2 negatively regulates the IRF3 axis of STING signaling. To verify that PELI2’s inhibition of the IRF3 axis of STING signaling is not unique to U937 monocytic cells, we also evaluated the role of PELI2 in two additional cell lines: MDA-MB-231 breast carcinoma cells and HeLa cervical carcinoma cells. After first knocking out endogenous PELI2 in these cells with PELI2 sgRNA, we found that induction of PELI2-FLAG resulted in decreased IRF3 phosphorylation for both cell lines (Figure S1B–C). This indicates that PELI2’s effects on STING signaling are not cell type specific.
In addition to being activated by the cGAS-STING pathway, IRF3 is also activated by other innate immune pathways. To test whether PELI2 reduces IRF3 activation in other contexts, we evaluated the effect of PELI2-FLAG induction on the response to extracellular and transfected poly(I:C), which activates the TLR3 (Toll-like Receptor 3) and MDA5/RIG-I (Melanoma Differentiation-associated Protein 5/Retinoic Acid-inducible Gene I) pathways, respectively. PELI2-FLAG had no effect on phosphorylated IRF3 levels in response to either extracellular or transfected poly(I:C), indicating that PELI2’s control of IRF3 activation is specific to STING signaling (Figure S1D).
Since PELI2 and its family members have been previously implicated in indirect positive regulation of the NF-κB (Nuclear Factor Kappa B) pathway through their effects on TLR signaling,8,10 we next investigated whether PELI2 had a similar effect on NF-κB activation through the STING pathway. To do this, we treated U937 tet-PELI2-WT cells and measured the effect of PELI2 induction on the NF-κB-controlled transcripts IL6 (Interleukin 6) and TNF (Tumor Necrosis Factor) by RT-qPCR following cGAMP stimulation. While PELI2 induction reduced levels of IRF3-controlled transcripts IFNB (Interferon Beta 1) and CXCL10 (CXC Motif Chemokine Ligand 10), it increased levels of NF-κB-regulated transcripts in response to cGAMP (Figure 1J).
In addition to activating IRF3 and NF-κB, STING signaling has also been shown to activate autophagy.11 To assess whether PELI2 affects the autophagy axis of STING signaling, we examined the effects of PELI2-FLAG induction on LC3 (Microtubule Associated Protein 1 Light Chain 3) lipidation in HeLa tet-PELI2-FLAG cells. While cGAMP increased levels of LC3 lipidation as previously reported, PELI2-FLAG induction had no effect on this response, indicating that PELI2 does not affect the autophagy axis of STING signaling (Figure S1E).
Taken together, these results indicate that PELI2 specifically alters the transcriptional response of STING signaling by inhibiting the IRF3 axis of STING signaling, while simultaneously enhancing the NF-κB axis (Figure 1K).
PELI2 phosphothreonine binding is necessary for inhibition of the STING-IRF3 axis
Since the IRF3 axis of STING signaling has been mechanistically well characterized, while the NF-κB axis has not, we decided to focus our efforts on uncovering the molecular details of how PELI2 specifically inhibits IRF3 activation. PELI2 consists of two known functional domains: an N-terminal FHA (Forkhead Associated) domain that binds to phosphothreonine residues and a C-terminal RING (Really Interesting New Gene) domain that facilitates ubiquitination of target substrates. A mutation in the FHA domain, R106A, has previously been shown to prevent binding to phosphothreonine (Figure 2A).12 To assess whether PELI2’s phosphothreonine binding activity is necessary for inhibition of the STING-IRF3 axis, we inserted a dox-inducible, sgRNA-resistant PELI2-FLAG-R106A expression vector into U937 PELI2 sgRNA cells. In contrast to expression of PELI2-WT, induction of PELI2-R106A did not inhibit IRF3 or STING phosphorylation in response to cGAMP (Figure 2B–E). These results suggest that PELI2 must bind to some unknown phosphothreonine residue as a requisite step in its inhibition of the STING-IRF3 axis.
Figure 2: PELI2 binds to phosphorylated Thr354 and Thr356 on STING’s CTT to inhibit IRF3 activation.

A) Schematic of domain composition and function of PELI2 WT and R106A.
B) U937 tet-PELI2-FLAG-R106A cells were treated with 20 ng / mL doxycycline overnight before treatment with 50 μM cGAMP for 2 h. Band intensity was quantified and normalized to tubulin for C) phosphorylated IRF3, D) phosphorylated STING, and E) phosphorylated TBK1 (n = 3).
F) U937 tet-PELI2-FLAG-WT and tet-PELI2-FLAG-R106A cells were induced with 20 ng / mL doxycycline overnight before treatment with 50 μM cGAMP for 2 h. PELI2-FLAG was then immunoprecipitated from whole cell lysate with anti-FLAG beads (representative of 2 independent experiments).
G) Schematic of CTT sequence of STING WT and STING CTT mutants. WT threonines are highlighted in yellow, whereas threonines mutated to alanine are highlighted in red.
H) HEK293T cells were transfected with PELI2-FLAG-WT and either STING-WT or STING-5T>A. Then, 2 d post transfection, cells were treated with 100 μM cGAMP for 2 h before lysing cells for FLAG immunoprecipitation (representative of 2 independent experiments).
I) HEK293T cells were transfected with PELI2-FLAG WT and either STING-WT or various STING CTT mutants. Then, 2 d post transfection, cells were treated with 100 μM cGAMP for 2 h before lysing cells for FLAG immunoprecipitation. Levels of immunoprecipitated phosphorylated STING mutants were quantified and normalized to levels of immunoprecipitated phosphorylated STING-WT (n = 2).
J) U937 STING−/− + cmv-STING-5T>A + tet-PELI2-FLAG-WT cells were induced with 20 ng / mL doxycycline overnight before treatment for 2 h. Band intensity was quantified and normalized to tubulin for K) phosphorylated IRF3, L) phosphorylated STING, and M) phosphorylated TBK1 (n = 4).
(B), (F), (H), and (J) show Western blots representative of multiple independent experiments.
For (C)-(E) and (K)-(M) data are shown as mean ± SEM. See also Figure S2.
PELI2 binds to phosphothreonines on the C-terminal tail of STING to inhibit IRF3 activation
Given that IRF3 is activated on STING’s CTT, which is phosphorylated on multiple serine and threonine sites following STING activation, the STING CTT appeared to be a likely candidate for the binding site of PELI2. We first tested whether PELI2 interacts with full-length STING through immunoprecipitation assays of PELI2-FLAG from lysates of U937 tet-PELI2-FLAG cells (Figure 2F). Pulldown of unphosphorylated STING by anti-FLAG beads was the same in both negative control and PELI2-FLAG expressing cells, indicating that PELI2 does not interact with unphosphorylated STING. In cells treated with cGAMP, STING phosphorylation can be detected both with: 1) an antibody that specifically recognizes phosphorylation of Ser366 on STING and 2) the appearance of a higher phosphorylated STING band above the normal, unphosphorylated STING band. With both of these detection methods, we observed that phosphorylated STING is pulled down specifically by WT PELI2-FLAG, but not by R106A PELI2-FLAG or negative control cells. Together, these data indicate that PELI2 binds to phosphorylated STING.
While Ser366 is the best characterized phosphosite on STING’s CTT, it is not necessary for PELI2’s interaction with phosphorylated STING (Figure S2A). However, the STING CTT contains five threonine residues that, once phosphorylated, could potentially act as binding sites for PELI2 (Figure 2G). To determine if these threonines are necessary for PELI2’s interaction with STING, we first mutated each threonine individually to alanine. However, none of these single mutants affected the PELI2-STING interaction (Figure S2B–D). We next created a STING mutant where all five threonines are mutated to alanine (STING-5T>A) and coexpressed it with PELI2-FLAG for co-IP analysis. While wild-type STING strongly co-precipitated with PELI2-FLAG, STING-5T>A did not. Importantly, phosphorylation of Ser366 was not diminished for STING-5T>A, demonstrating that the lack of PELI2 interaction observed for this mutant is not due to an overall defect in STING phosphorylation (Figure 2H). To determine which threonines alone are sufficient to enable PELI2 binding to phosphorylated STING, we created an additional five STING mutants in which all but one of the threonines in the CTT are mutated to alanine. We found that STING mutants containing either only Thr354 or only Thr356 were both sufficient to completely rescue pulldown by PELI2-FLAG (Figure 2I, Figure S2E). Interestingly, the STING mutant containing only Thr348 was also weakly pulled down by PELI2, suggesting that Thr348 may be a minor binding site for PELI2. Mutation of both Thr354 and Thr356 to alanine was sufficient to nearly abolish the interaction between PELI2 and phosphorylated STING, with the residual interaction likely due to the presence of Thr348 (Figure S2F). Together, these results demonstrate that PELI2 binds primarily to either phosphorylated Thr354, Thr356, or both on the CTT of activated STING.
While Thr354 and Thr356 are located in the CTT of STING, a region known to be hyperphosphorylated upon activation, direct evidence that Thr354 and Thr356 are phosphorylated is lacking. A recent study was able to detect Thr354 and Thr356 phosphorylation with mass spectrometry, but it still remains to be determined if phosphorylation of these residues is increased upon cGAS-STING pathway activation.13 It has long been observed that phosphorylation of proteins can slow their mobility on SDS-PAGE gels, resulting in an upward band shift.14 To take advantage of this phenomenon, we created a phosphorylation deficient mutant of STING where all 12 threonines and serines on STING’s CTT were mutated to alanine (STING no T/S). Although this STING mutant had no detectable phosphorylation by SDS-PAGE, it was still able to induce the phosphorylation of TBK1 in response to cGAMP (Figure S2G–H). Addition of Ser366 back to this mutant (STING no T/S + S366) restored STING phosphorylation, which could be detected with an antibody specific for Ser366 phosphorylation (Figure S2G–H). Notably, the phosphorylated STING no T/S + S366 band was noticeably lower than the phosphorylated STING WT band as expected, given the reduced number of phosphosites in the STING no T/S + S366 mutant. We next created additional STING mutants where Thr354 and/or Thr356 were added to the STING no T/S + S366 background. The addition of either Thr354 or Thr356 resulted in an additional phosphorylated STING band that was higher than the band corresponding to only Ser366 phosphorylation, validating that both Thr354 and Thr356 are phosphosites on STING. Furthermore, these bands disappeared following phosphatase treatment, indicating that they indeed represent phosphorylated STING species (Figure S2I). To determine if Thr354 and Thr356 are phosphorylated following cGAS-STING activation, we co-transfected these STING mutants along with high levels of cGAS, which results in constitutive pathway activation. Co-transfection of cGAS greatly increased levels of both Thr354 and Thr356 phosphorylation (Figure S2J). Together, these results demonstrate that Thr354 and Thr356 are phosphorylated following cGAS-STING activation.
To validate that PELI2 binding to STING is necessary for its inhibition of STING-IRF3 signaling, we created a U937 cell line with endogenous STING knocked out and replaced with STING-5T>A, then transduced our tet-PELI2-FLAG-WT vector into these cells. Activation of STING-IRF3 signaling by these STING-5T>A cells appears to be unimpaired, as these cells still phosphorylate TBK1, STING, and IRF3 in response to cGAMP stimulation. In contrast to cells with endogenous STING, however, PELI2 expression had no effect on the STING-IRF3 signaling axis in these STING-5T>A cells (Figure 2J–M), showing that PELI2 binding to STING is necessary for its inhibition of the STING-IRF3 axis.
The RING domain of PELI2 is required for its inhibition of STING-IRF3 signaling
Given that the PELI2 and IRF3 binding sites on STING’s CTT are close to each other, it is possible that PELI2 inhibits IRF3 activation by sterically blocking IRF3 from binding to STING. Alternatively, we considered that PELI2 binding to STING could bring PELI2 into close proximity with potential ubiquitination substrates like TBK1 or IRF3 – whose ubiquitination and degradation would be expected to inhibit STING-IRF3 signaling. To distinguish between these two possibilities, we took advantage of the previously described PELI2-C397/400A mutant (PELI2-CC>AA), which has a defective E3 ubiquitin ligase RING domain (Figure 3A).15 After inserting our tet-PELI2-FLAG-CC>AA vector into U937 PELI2 sgRNA cells, we found that PELI2-CC>AA retained the ability to pull down phosphorylated STING, indicating that it still has a functional FHA domain (Figure S3A). PELI2-CC>AA induction, however, did not inhibit phosphorylation of IRF3, STING, or TBK1 in response to cGAMP, indicating that a functional RING domain is required for inhibition of the STING-IRF3 axis (Figure 3B–E). Furthermore, induction of a truncated PELI2 containing only the FHA domain was unable to inhibit phosphorylation of IRF3, STING, or TBK1 (Figure S3B–E), indicating that PELI2 binding to STING alone is not sufficient to inhibit STING-IRF3 signaling. Also consistent with this model, we found that although normal expression of the binding mutant PELI2-R106A mutant was unable to inhibit IRF3 phosphorylation (Figure 2C), overexpression of PELI2-R106A did result in a slight decrease in IRF3 phosphorylation (Figure S3F–G), indicating that PELI2 binding to STING is not required when PELI2 levels greatly exceed normal endogenous levels; however, overexpression of the ubiquitination mutant PELI2-CC>AA still had no effect on IRF3 phosphorylation (Figure S3H), indicating that PELI2’s ubiquitination activity is required in all contexts.
Figure 3: The RING domain of PELI2 promotes ubiquitination of TBK1 and is necessary for STING-IRF3 inhibition.
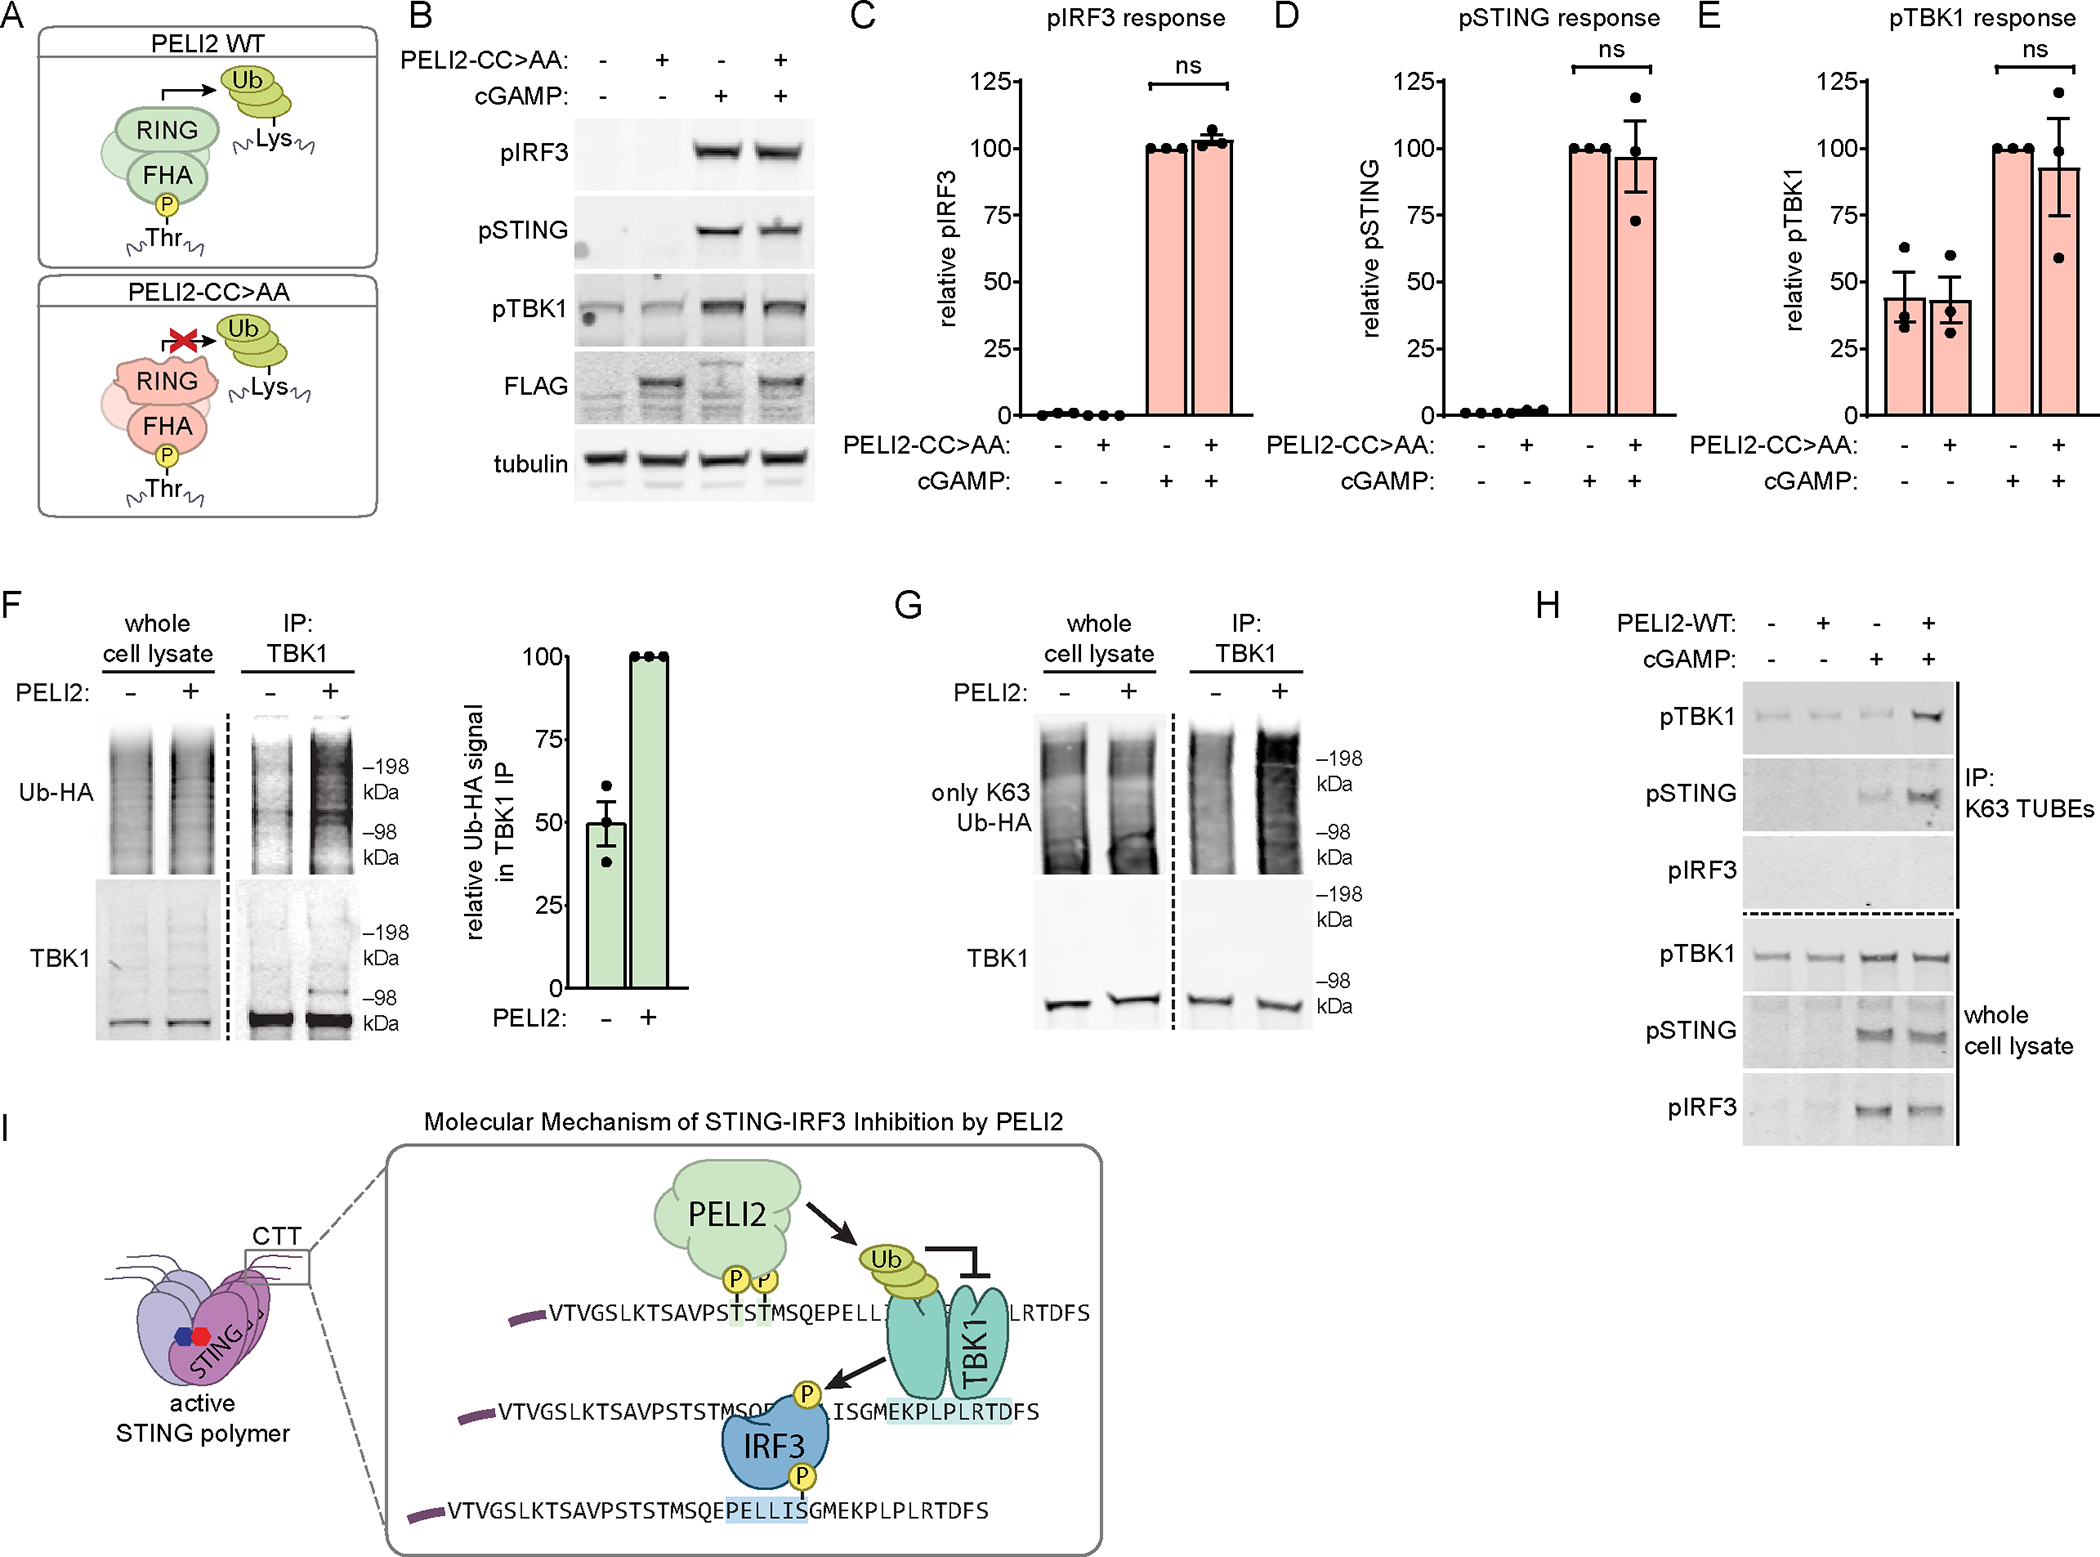
A) Schematic of domain composition and function of PELI2 WT and CC>AA.
B) U937 tet-PELI2-FLAG-CC>AA cells were treated with 20 ng / mL doxycycline overnight before treatment with 50 μM cGAMP for 2 h.. Band intensity was quantified and normalized to tubulin for C) phosphorylated IRF3, D) phosphorylated STING, and E) phosphorylated TBK1 (n = 3).
F) HEK293T cells were transfected with or without PELI2-FLAG-WT and with HA tagged ubiquitin (Ub-HA). Then, 2 d post transfection, cells were treated with 100 μM cGAMP for 2 h before lysing cells for TBK1 immunoprecipitation (representative of 3 independent experiments).
G) Similar to F), except cells were transfected with an Ub-HA mutant where all lysines except K63 are mutated to arginine (only K63 Ub-HA).
H) U937 tet-PELI2-FLAG-WT cells were treated with 20 ng / mL doxycycline overnight before treatment with 50 μM cGAMP for 2 h. K63-linked ubiquitin chains were then pulled down with K63 TUBE reagent.
I) Model for the molecular mechanism of STING-IRF3 inhibition by PELI2.
(B) and (F) show Western blots representative of multiple independent experiments. For (C)-(E), data are shown as mean ± SEM. See also Figure S3.
Since the E3 ubiquitin ligase activity of PELI2 is required for its inhibition of STING-IRF3 signaling, we next investigated what target(s) PELI2 could be ubiquitinating to exert these effects. We used HEK293T cells expressing HA-tagged ubiquitin together with transfected STING-FLAG to measure ubiquitination levels of endogenous IRF3, endogenous TBK1, or heterologous STING-FLAG. While overexpression of PELI2 had no effect on ubiquitination of IRF3 or STING (Figure S3I–J), we found a notable increase in ubiquitination of endogenous TBK1 upon PELI2 overexpression (Figure 3F).
Since PELI family members have been suggested to be capable of forming both K48 and K63 linked ubiquitin chains, we sought to determine which type of ubiquitin chain PELI2 adds to TBK1. To do this, we used ubiquitin mutants capable of forming either only K48- or only K63-linked chains. While PELI2 had no effect on TBK1 ubiquitination by K48-only Ub-HA (Figure S3K), PELI2 still increased TBK1 ubiquitination by K63-only Ub-HA (Figure 3G).
While our data demonstrate that PELI2 can ubiquitinate TBK1 in an overexpression system, we wanted to confirm that this occurs in an endogenous setting. To do this, we measured levels of K63 ubiquitinated proteins in our U937 tet-PELI2-WT cell line with K63 TUBEs. We found that induction of endogenous levels of PELI2 alongside cGAMP treatment resulted in noticeably more phosphorylated TBK1 in K63 TUBE pulldowns, indicating that PELI2 can ubiquitinate TBK1 in endogenous contexts (Figure 3H). Interestingly, PELI2 alongside cGAMP treatment also increased levels of K63 ubiquitinated phosphorylated STING, suggesting an additional mechanism through which PELI2 might inhibit STING signaling. Although PELI2 ubiquitinates TBK1, it is unable to pulldown TBK1 (Figure S3K), suggesting that the PELI2-TBK1 interaction is not direct but is instead mediated through the CTT of STING which acts as a scaffold.
Together, these results suggest the following model for how PELI2 inhibits STING-IRF3 signaling: after TBK1 phosphorylates the STING CTT, it creates a binding site for PELI2 at phospho-Thr354/356; PELI2 bound to STING CTT is brought in close proximity to TBK1, leading to its K63-linked ubiquitination; K63-linked ubiquitination of TBK1 results in its decreased activity (Figure 3I), explaining how PELI2 expression leads to decreased phosphorylation of STING and IRF3 (Figures 1G–H). Since K63-linked ubiquitination has previously been implicated in activating NF-κB signaling,16 this could also provide a possible explanation for how PELI2 increases NF-κB signaling.
PELI2 dynamically regulates STING-IRF3 during viral infection
The anti-viral properties of STING signaling have been well characterized, particularly with regard to Herpes Simplex Virus 1 (HSV). Since PELI2 inhibits STING-IRF3 signaling, it seemed likely that PELI2 would consequently also inhibit the anti-viral response to HSV. To test this, we infected tet-PELI2-WT cells with HSV and assessed transcript levels of the HSV late gene gB to measure viral replication. We found that PELI2 overexpression increased HSV gB transcript levels by over 50% (Figure 4A), indicating that PELI2 hinders the anti-viral response to HSV.
Figure 4: PELI2 is downregulated by interferon.

A) MDA-MB-231 tet-PELI2-FLAG-WT cells were induced with 20 ng / mL doxycycline overnight before infection with HSV at 1 MOI. Then, 6 hours post infection, cells were lysed and HSV gB transcript levels were measured by RT-qPCR (n = 3).
B) RNA-seq quantification of PELI2 transcript levels in HSV infected cells (GSE124118). HFF-1 cells were mock infected or infected with HSV at 0.5 MOI for 4 or 8 h.
C) Relative transcript levels of PELI2 in PBMCs infected with Listeria monocytogenes (5 MOI) for the indicated times (GSE67983).
D) Pseudotime analysis of PELI2, IFNB1, and ISG transcript levels in plasmacytoid dendritic cells following infection with influenza virus.
E) U937 WT and IRF3 sgRNA cells were treated with 100 μM cGAMP for 3 h or 6 h before RT-qPCR analysis.
F) U937 WT cells were treated with a low dose of cGAMP (10 μM) overnight before RT-qPCR analysis.
G) U937 WT cells were treated with 50 ng / mL IFNβ for 3 h before RT-qPCR analysis. For (A)-(C) and (E)-(G) data are shown as mean ± SEM. See also Figure S4.
From our data so far, we can conclude that PELI2 plays an important role in negatively regulating STING-IRF3 signaling. While this inhibition could be beneficial in some contexts, such as to prevent chronic interferonopathies, it would be detrimental in contexts that require a robust immune response, such as during viral infection. We thus considered the possibility that PELI2 could be downregulated during viral infection and other threatening contexts to prevent it from hindering effective immunity. To assess this, we analyzed published bulk RNA-seq data and found that PELI2 transcript levels drastically decrease following HSV infection (Figure 4B). Similarly, analysis of a separate dataset shows that PELI2 transcript levels decrease following infection with the intracellular bacteria Listeria monocytogenes (Figure 4C).
To obtain a higher resolution depiction of the dynamics of PELI2 and IFNβ transcript levels following viral infection, we performed diffusion pseudotime analysis on published data from primary cells infected with influenza virus.17 Viral treatment time correlated well with pseudotime, validating that our pseudotime analysis is capturing the transcriptional response to viral infection over time (Figure S4A). Consistent with the bulk RNA-seq analysis above, we found that PELI2 levels rapidly decrease by ~80% following viral infection. This decrease coincides with an initial increase in IFNB transcript expression, which then starts to plateau. Interestingly, after PELI2 levels reach a minimum, IFNB transcript levels start to increase even further, supporting a model where downregulation of PELI2 initiates a positive feedback loop to potentiate IFNβ signaling. Furthermore, PELI2 expression appears to be restored late in viral infection, resetting a basal-like state (Figure 4D).
Given that viral infection results in cGAMP production,18 we reasoned that the observed downregulation of PELI2 transcript may actually lie downstream of the STING pathway itself. Indeed, we found that PELI2 transcript levels were downregulated in cells following treatment with a high-dose of cGAMP. Interestingly, this effect was not observed in IRF3 sgRNA cells, indicating that PELI2 downregulation depends on activation of the STING-IRF3 axis. Furthermore, PELI2 downregulation was only observed after 6 h of cGAMP stimulation, with no effect at the earlier 3 h timepoint (Figure 4E). Supporting the idea that a particular threshold of STING signaling must be reached to initiate PELI2 downregulation, we did not observe PELI2 downregulation in cells where STING was weakly stimulated with a low concentration of cGAMP (Figure 4F). The delayed downregulation of PELI2 in response to cGAMP suggests that PELI2 may be further downstream in the IRF3 regulon, possibly downstream of the IRF3 controlled gene IFNβ. In fact, we found that IFNβ treatment alone was sufficient to decrease PELI2 levels (Figure 4G), suggesting that PELI2 is a target downstream of the STING-IRF3-IFNβ axis. While IFNβ is sufficient to downregulate PELI2 levels, it is possible that STING signaling downregulates PELI2 through non-IFNβ mechanisms as well.
Together, our data suggest that once STING activation surpasses a certain threshold, enough IFNβ is produced to downregulate PELI2, priming cells for possible threats by increasing the sensitivity of the STING pathway
PELI2 prevents basal STING activation from leading to elevated interferon signaling
Prolonged activation of STING-IRF3 can lead to interferonopathy and serious autoimmune conditions, including SAVI and systemic lupus encephalitis (SLE).2–4,19 SLE is characterized by chronic elevated interferon signaling resulting in upregulation of interferon stimulated genes (ISGs), downstream of IRF3 activation. Since our previous experiments demonstrated that PELI2 suppresses STING-IRF3 signaling following short, high dose cGAMP stimulation, we next sought to determine whether PELI2 also suppresses chronic low levels of STING signaling that present in autoimmune conditions. We previously observed that some cell lines produce low levels of cGAMP basally without any external stimulus.20 Given this, we decided to examine how PELI2 affects the ISG response to these basal levels of cGAMP. To do this, we measured transcript levels of a panel of ISGs in either scramble sgRNA, PELI2 sgRNA, or STING sgRNA cells under basal, unstimulated conditions. Remarkably, we found that ISG expression levels were consistently higher in PELI2 sgRNA cells compared to scramble sgRNA cells, and that all but one of the measured ISGs were downregulated in STING−/− cells (Figure 5A). Together, these results suggest that PELI2 inhibits basal STING-IRF3-ISG signaling. To validate that PELI2’s suppression of ISGs is occurring through STING, we used tet-PELI2 cells with WT or 5T>A STING. Strikingly, PELI2 reduced ISG levels by ~90% in WT STING cells following a prolonged, low dose cGAMP treatment; in contrast, PELI2 had little to no effect on ISG levels in 5T>A STING cells under the same conditions (Figure 5B). Together, these results indicate that PELI2 substantially dampens IRF3-ISG signaling in conditions of chronic STING activation.
Figure 5: PELI2 suppresses interferon signaling from basal STING activation.
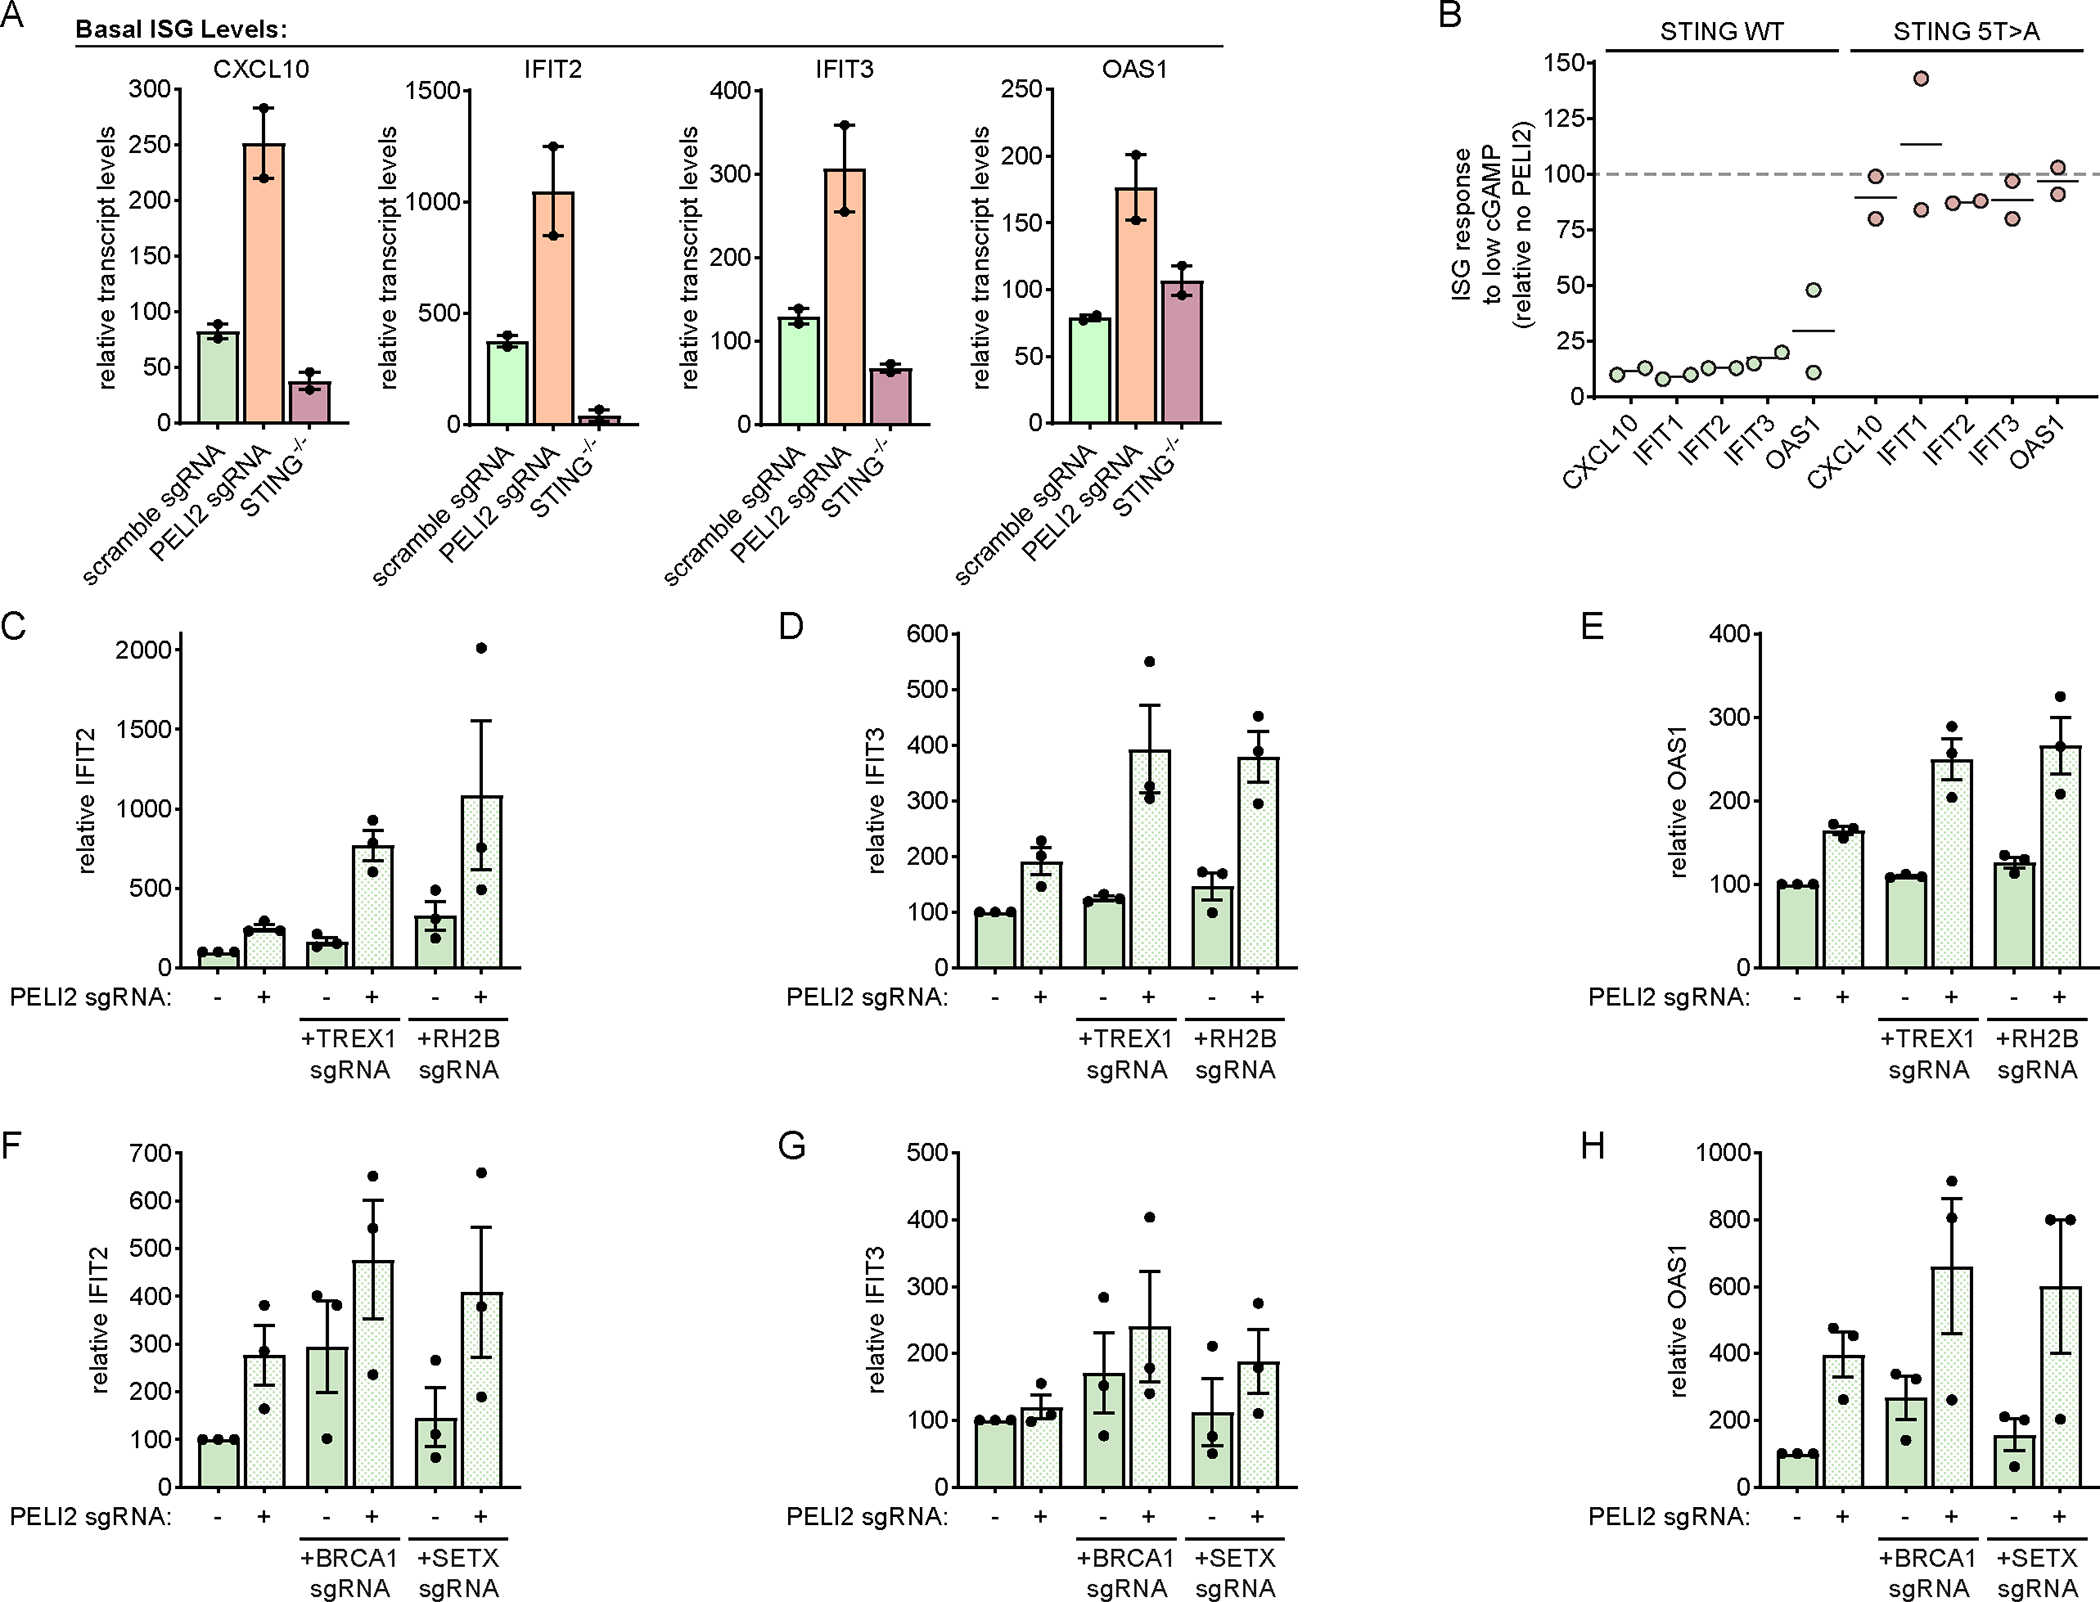
A) Basal levels of ISGs in U937 scramble sgRNA, PELI2 sgRNA, or STING−/− cells were analyzed by RT-qPCR (n = 2).
B) U937 tet-PELI2-FLAG-WT cells with endogenous STING and U937 STING−/− + cmv-STING-5T>A + tet-PELI2-FLAG-WT cells were induced with 20 ng / mL doxycycline overnight before treatment with low dose cGAMP (10 μM) for 23 h. Levels of ISGs were analyzed by RT-qPCR and are shown relative to uninduced cells (n = 2).
C-E) Basal levels of ISGs in U937 scramble, TREX1, or RNASHE2B sgRNA cells with or without PELI2 sgRNA were analyzed by RT-qPCR (n = 3).
F-G) Basal levels of ISGs in HeLa scramble, BRCA1, or SETX sgRNA cells with or without PELI2 sgRNA were analyzed by RT-qPCR (n = 3).
For (A) and (C)-(H) data are shown as mean ± SEM. See also Figure S5.
To better mimic physiologically relevant conditions of chronic cGAMP production, we generated TREX1 and RNASEH2B sgRNA U937 cells (Figure S5A–B). As mentioned earlier, inactivating mutations of TREX1 or RNASEH2B lead to autoimmune disorders including AGS by increasing cytosolic dsDNA levels, leading to persistent STING activation. Previous studies have shown that knockout of TREX1 alone is sufficient to increase ISG levels in some cell types, but not others.21 We found that in U937 cells, sgRNA knockout of TREX1 or RNASEH2B alone had little effect on the levels of the ISGs IFIT2 (Interferon Induced Protein with Tetratricopeptide Repeats 2), IFIT3 (Interferon Induced Protein with Tetratricopeptide Repeats 3), and OAS1 (2′–5′-Oligoadenylate Synthetase 1). However, when coupled with knockout of PELI2, knockout of TREX1 and RNASEH2B both led to substantially elevated levels of these ISGs (Figure 5C–E). These results indicate that PELI2 can increase the threshold of stimulus that leads to STING activation. While PELI2 was able to completely suppress ISG induction resulting from TREX1/RNASEH2B deficiency in U937 cells, additional studies will need to be performed to assess the ability of PELI2 to control ISG levels in response to TREX1/RNASEH2B deficiency in other cell types.
In addition to the autoimmune associated genes TREX1 and RNASEH2B, mutations in the DNA repair pathway genes BRCA1 (BRCA1 DNA Repair Associated) and SETX (Senataxin) can also lead to chronic STING signaling.22 Importantly, mutations in these genes are frequent drivers of cancer development. To assess the role of PELI2 in controlling the STING response to these stimuli, we performed sgRNA knockout of BRCA1 and SETX in HeLa cells. In contrast to TREX1 and RNASEH2B knockout, BRCA1 and SETX knockout alone were sufficient to lead to elevated levels of ISGs. Levels of ISGs in these knockouts were further increased when coupled with knockout of PELI2 (Figure 5F–H).
Decreased PELI2 levels are observed in human patients with autoimmune conditions
Having shown that PELI2 suppresses interferon signaling through STING, we wondered if decreased expression of PELI2 could increase risk of autoimmunity. The majority of patients with SLE develop skin lesions driven by elevated interferon signaling following UV exposure.23,24 Given that keratinocytes have been suggested to be the major initial source of elevated interferons in these lesions,25 we investigated PELI2 levels in keratinocytes from skin samples of lupus patients from a previously published single-cell RNA (scRNA) sequencing dataset.26 After cell type clustering (Figure S6A), we found that PELI2 expression was over 50% lower in the keratinocytes of lupus patients compared to healthy donors (Figure 6A). Furthermore, there was a reverse correlation between PELI2 expression and expression of IFNβ and ISGs in these keratinocytes (Figure 6B, S6B). These results suggest that reduced PELI2 levels in lupus patients could contribute to their hypersensitivity towards UV light.
Figure 6: PELI2 is downregulated in patients with autoimmune conditions and cancer.
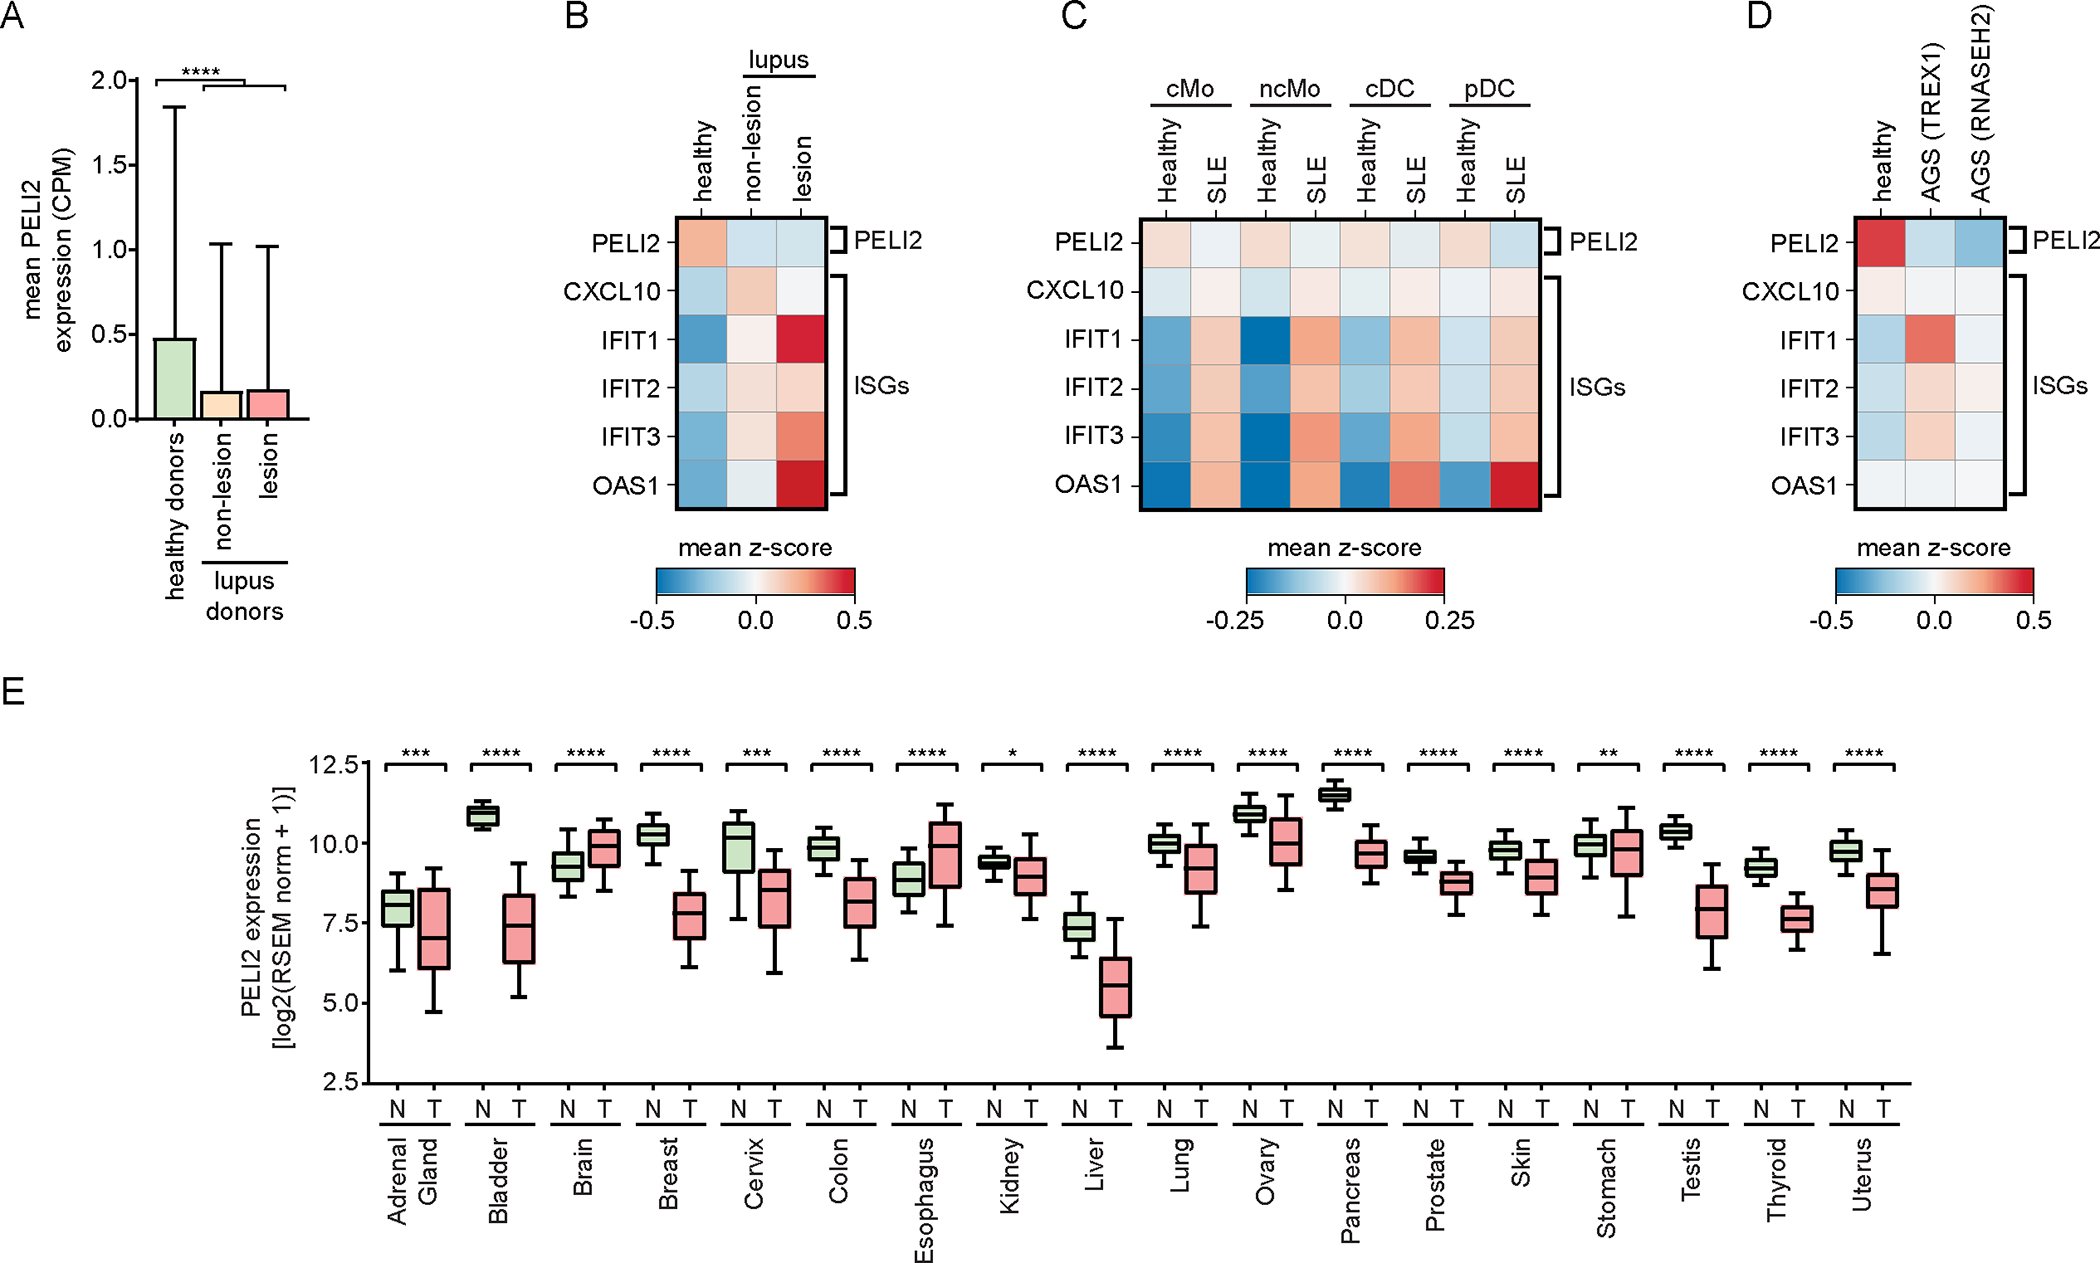
A) Single cell RNA-seq data showing mean expression of PELI2 in keratinocytes from healthy donors or lupus patients (GSE186476).
B) Heatmap showing relative expression of PELI2, IFNB1, and ISGs in keratinocytes from healthy donors and lupus patients.
C) Heatmap showing relative expression of PELI2 and ISGs from classical monocytes (cMo), non-classical monocytes (ncMo), classical dendritic cells (cDC), and plasmacytoid dendritic cells (pDC) in PBMCs of healthy patients and SLE patients (GSE174188).
D) Heatmap showing relative expression of PELI2 and ISGs from astrocytes derived from iPSCs of a healthy patient, an AGS patient with a TREX1 mutation, and an AGS patients with an RNASEH2 mutation (GSE193710).
E) PELI2 transcript expression levels in samples from normal (N) and tumor (T) tissue across 18 different tissue sites. Normal and tumor tissue samples are from GTEx and TCGA/TARGET studies, respectively. Whiskers of box and whisker plots span 10–90th percentile of samples.
Samples outside of this range are omitted from plot for clarity.
For (A) data are shown as mean ± SD. See also Figure S6.
We also probed PELI2 levels in patient samples of other autoimmune conditions by analyzing additional, previously published scRNA sequencing datasets. Strikingly, we found that PELI2 transcript levels were lower in the innate immune cells of patients for all autoimmune conditions we examined, including SLE PBMCs,27 AGS astrocytes,28 and primary sclerosing cholangitis (PSC) NK cells29 (Figure 6C–D, S6C). Taken together, these data show a striking correlation between decreased PELI2 levels and autoimmune status. Future experiments will need to be performed to fully understand the potential role of PELI2 in controlling autoimmunity.
Given that chromosomal instability and basal cGAMP production is a hallmark of cancer, we examined levels of PELI2 in the context of cancer. RNA expression analysis of normal and tumor tissues from GTEX and TCGA datasets, respectively, shows that average PELI2 expression was significantly decreased in tumor samples for 16 out of 18 different tissue sites (Figure 6E). These associations support the notion that PELI2 is downregulated in response to pathogen infection and cancer to allow for maximal STING activation.
Discussion
Over the past decade, the STING pathway has emerged as a central pathway in immunity implicated in a plethora of diseases and conditions, including viral infection, cancer, neurodegeneration, heart attack, and autoimmunity.4,30–34 The strength of the STING pathway must be dynamically regulated to ensure a balance between tolerating weak stimuli of pathway activation that may occur basally, while decisively responding to strong stimuli of pathway activation that occur during cellular threats such as viral infection. We discovered that PELI2 inhibits interferon production by binding to a phosphorylated site on STING’s CTT and subsequently ubiquitinating TBK1, thereby constraining its activation of IRF3. Interferon production, in turn, downregulates PELI2, creating a positive feedback loop. The advantage of a positive feedback loop in signal transduction is twofold. First, it sets a threshold preventing the pathway from responding to basal fluctuations in cytosolic dsDNA levels. Second, it allows sustained activation of the STING pathway and interferon production to ensure effective downstream immune cascades.
While acute induction of interferon signaling is vital for the immune system to defend against foreign threats, chronic interferonopathy can break our immune system’s tolerance against self-antigens. PELI2’s role in setting a threshold to regulate STING signaling enables it to play an essential role in preventing chronic interferonopathy. This suggests that dysregulation of PELI2 could be a culprit in chronic interferonopathies. While we observed decreased PELI2 levels in patients with autoimmune conditions, it remains to be determined what caused these decreased levels. In our viral infection model, we showed that after first decreasing, PELI2 levels recover over time, restoring its ability to act as a negative regulator. It is conceivable that in these autoimmune patients, the mechanism normally allowing for recovery of PELI2 after viral infections is disrupted, leading to persistently low PELI2 levels and chronic STING activation. This could explain the observation that viral infection can trigger the onset of interferonopathies.
In mammals, the CTT of STING plays an essential role in the activation of interferon signaling by recruiting TBK1 and IRF3 through specific motifs. Interestingly, in STING homologs of other vertebrates, such as zebrafish, the CTT contains alternative motifs that recruit other effectors instead of TBK1 and IRF3. Because of this, zebrafish STING primarily activates NF-κB signaling instead of interferon signaling.35 This indicates that the composition of STING’s CTT has a strong influence on the effects of STING signaling, and that different vertebrate species have evolved distinct CTT compositions to best suit their needs. With our identification of the PELI2 recruitment motif on STING’s CTT, we have identified another mechanism through which the CTT can be decorated to modulate STING signaling.
While most mammals possess at least one of the threonines important for PELI2 recruitment in human STING, some clades have no predicted PELI2 recruitment site (e.g. the Muridae family, containing mice). Furthermore, only a few clades contain a redundant threonine recruitment site like that observed in human STING (e.g. the Simiiformes infraorder of primates) (Figure S7). One possible explanation for these differences is that certain species, such as mice, may have lost the PELI2 recruitment site to evolve a STING pathway that is more sensitive to pathogens; alternatively, other species, such as humans, may have gained an additional PELI2 recruitment site to evolve a STING pathway that is more selective to stimulation. This is in line with previous findings that suggest the human STING pathway is more selective than that of mice.36
PELI2 has previously been demonstrated to positively regulate multiple immune pathways, including NLRP3 inflammasome activation, TLR9 signaling, and IL-1R signaling.8,9,15 With our study, we provide the first evidence that PELI2 can also negatively regulate immune signaling. The role of PELI2 in differentially regulating immune pathways suggests it may influence the overall immune response to threats. Since threats such as bacterial infection can activate multiple distinct immune pathways, the presence of PELI2 may allow for the preferential activation of certain pathways (e.g. TLR signaling) over others (e.g. STING signaling). Given that different immune pathways elicit distinct immune responses, balancing activation of these different pathways through PELI2 could allow cells to ensure a context appropriate response to threats. Thus, PELI2 may not only determine the threshold and strength of a cell’s immune response to threats, but also the type of immune response.
Taken together, our study establishes PELI2 as a key negative regulator of STING signaling, dynamically tuning the STING activation threshold to appropriately respond to a wide range of conditions including basal activity, chronic low-grade stimulation, acute viral infection, and recovery after viral infection. PELI2 is therefore a critical regulatory mechanism for human STING, and future studies will further illuminate its contributions to autoimmunity, viral infection, and many other contexts in which STING signaling is implicated.
Limitations of the Study
While this study demonstrated that PELI2 suppresses STING induced interferon signaling in cell assays, it remains to be determined how significant this suppression is in controlling interferonopathies. Since mouse STING does not contain the main threonines that are important for PELI2 binding in human STING, it seems unlikely that mouse cells will recapitulate the effect PELI2 has on STING signaling in human cells, making mice a poor model for studying this facet of PELI2 biology. However, we did find that PELI2 transcript expression is downregulated in samples of human patients with different autoimmune conditions, suggesting a crucial role for PELI2 in preventing interferonopathies.
Our study primarily focused on the role of PELI2 in only a subset of cell types, and the role of PELI2 in suppressing STING signaling may not be applicable to all cell types given differences in gene expression. Additional studies will need to be performed to determine how broadly applicable PELI2’s role in STING signaling is across cell types.
All our analyses of patient data (Figure 6) were performed on previously published datasets. As a result, we do not have access to these patient samples, and are unable to perform additional experiments that would allow us to further examine the role of PELI2 in these autoimmune conditions.
STAR Methods
Resource Availability
Lead contact
Further information and requests for resources and reagents should be directed to and will be fulfilled by the lead contact, Lingyin Li (lingyin@arcinstitute.org).
Materials availability
All newly generated materials associated with this paper will be made available upon request.
Data and code availability
All RNA-seq data analyzed in this paper is from existing, publicly available datasets. The accession numbers for these datasets are listed in the key resources table.
This paper does not report original code.
Any additional information required to reanalyze the data reported in this paper is available from the lead contact upon request.
Key resources table.
| REAGENT or RESOURCE | SOURCE | IDENTIFIER |
|---|---|---|
| Antibodies | ||
| DYKDDDDK Tag (FLAG) Rabbit Antibody | Cell Signaling Technology | Cat#2368; RRID:AB_2217020 |
| LC3A/B Rabbit Antibody | Cell Signaling Technology | Cat#4108; RRID:AB_2137703 |
| Phospho-IRF-3 (Ser396) (4D4G) Rabbit mAb | Cell Signaling Technology | Cat#4947; RRID:AB_823547 |
| Phospho-STING (Ser366) (D7C3S) Rabbit mAb | Cell Signaling Technology | Cat# 19781; RRID: AB_2737062 |
| Phospho-TBK1/NAK (Ser172) (D52C2) XP Rabbit mAb | Cell Signaling Technology | Cat#5483; RRID:AB_10693472 |
| TBK1/NAK (D1B4) Rabbit mAb | Cell Signaling Technology | Cat#3504; RRID:AB_2255663 |
| α-Tubulin (DM1A) Mouse mAb | Cell Signaling Technology | Cat#3873; RRID:AB_1904178 |
| Bacterial and virus strains | ||
| Human herpesvirus 1 | ATCC | Cat#VR-1493 |
| Chemicals, peptides, and recombinant proteins | ||
| 2’3’-cGAMP | Ritchie et al.6 | N/A |
| Anti-DYKDDDDK Magnetic Agarose | Thermo Fisher Scientific | Cat#A36797 |
| K63 TUBE (Magnetic Beads) | LifeSensors | Cat#UM404M |
| Protein A Magnetic Beads | Cell Signaling Technology | Cat#73778 |
| Recombinant Human IFN-β | PeproTech | Cat#300–02BC |
| Critical commercial assays | ||
| AccuPower 2X GreenStar master mix for qPCR | Bioneer | Cat#K-6251 |
| Deposited data | ||
| Bulk RNA-seq data of HFF-1 cells infected with HSV-1 | Tseng Lab; GEO | GEO GSE124118 |
| Bulk RNA-seq data of normal and tumor tissue samples | UCSC Xena | TCGA, TARGET, and GTEx cohorts |
| Microarray data of primary monocytes infected with Listeria monocytogenes | Wee Lab; GEO | GEO GSE67983 |
| scRNA-seq data of skin samples from healthy donors and lupus patients | Dunlap et al.,26 GEO | GEO GSE186476 |
| scRNA-seq data of differentiated iPSCs from healthy donor and AGS patients | Giordano et al.,28 GEO | GEO GSE193710 |
| scRNA-seq data of PBMCs from healthy donors and SLE patients | Perez et al.,27 GEO | GEO GSE174188 |
| scRNA-seq data of hepatic NK cells from patients with different liver diseases | Maretti-Mira et al.,29 GEO | GEO GSE217968 |
| scRNA-seq data of primary plasmacytoid dendritic cells infected with influenza virus | Ghanem et al.,17 GEO | GEO GSE189120 |
| Experimental models: Cell lines | ||
| HEK293T | ATCC | Cat#CRL-3216; RRID:CVCL_0063 |
| HeLa | ATCC | Cat#CRM-CCL-2; RRID:CVCL_0030 |
| MDA-MB-231 | ATCC | Cat#CRM-HTB-26; RRID:CVCL_0062 |
| U937 | ATCC | Cat#CRL-1593.2; RRID:CVCL_0007 |
| Oligonucleotides | ||
| All oligonucleotides used in this study are listed in Table S1 | This paper | Table S1 |
| Recombinant DNA | ||
| pcDNA3-hSTING-HA-WT | Ergun et al.40 | N/A |
| pcDNA3-hSTING-HA-T342A | This paper | N/A |
| pcDNA3-hSTING-HA-T348A | This paper | N/A |
| pcDNA3-hSTING-HA-T354A | This paper | N/A |
| pcDNA3-hSTING-HA-T356A | This paper | N/A |
| pcDNA3-hSTING-HA-T354/356A | This paper | N/A |
| pcDNA3-hSTING-HA-S366A | This paper | N/A |
| pcDNA3-hSTING-HA-T376A | This paper | N/A |
| pcDNA3-hSTING-HA-only-T342 | This paper | N/A |
| pcDNA3-hSTING-HA-only-T348 | This paper | N/A |
| pcDNA3-hSTING-HA-only-T354 | This paper | N/A |
| pcDNA3-hSTING-HA-only-T356 | This paper | N/A |
| pcDNA3-hSTING-HA-only-T376 | This paper | N/A |
| pcDNA3-hSTING-HA-5T>A | This paper | N/A |
| pcDNA3.1 (+) | Thermo Fisher Scientific | Cat#V79020 |
| pcDNA3.1-PELI2-FLAG | This paper | N/A |
| pLenti-CMV-GFP-puro | Campeau et al.,41 Addgene | Cat#17448; RRID:Addgene_17448 |
| pLenti-CMV-STING-5T>A-puro | This paper | N/A |
| pLentiCRISPR-v2 | Sanjana et al.,37 Addgene | Cat#52961; RRID:Addgene_52961 |
| pLVX-TetOne-FLAG | Lahey et al.7 | N/A |
| pLVX-TetOne-PELI2-FLAG-WT-blast | This paper | N/A |
| pLVX-TetOne-PELI2-FLAG-R106A-blast | This paper | N/A |
| pLVX-TetOne-PELI2-FLAG-C397/400A-blast | This paper | N/A |
| pLVX-TetOne-PELI2-FLAG-FHA-blast | This paper | N/A |
| pRK5-HA-Ubiquitin-WT | Lim et al.,42 Addgene | Cat#17608; RRID:Addgene_17608 |
| pRK5-HA-Ubiquitin-K48 | Lim et al.,42 Addgene | Cat#17605; RRID:Addgene_17605 |
| pRK5-HA-Ubiquitin-K63 | Lim et al.,42 Addgene | Cat#17606; RRID:Addgene_17606 |
| psPAX2 | Trono Lab, Addgene | Cat#12260; RRID:Addgene_12260 |
| pHDM-G | Harvard PlasmID | Cat#EvNO00061606 |
| Software and algorithms | ||
| CellO (Cell Ontology-based classification) | Bernstein et al.43 | http://github.com/deweylab/CellO |
| GraphPad Prism version 9.5.1 | GraphPad Software | https://www.graphpad.com/ |
| ImageJ version 1.53c | Schneider et al.45 | http://imagej.net/ij/ |
| Python version 3.8.10 | Python Software Foundation | http://www.python.org |
| Scanpy version 1.9.2 | Scanpy Development Team | http://scanpy.readthedocs.io/en/stable/ |
| GraphPad Prism version 9.5.1 | GraphPad Software | https://www.graphpad.com/ |
Experimental Model and Study Participant Details
Mammalian Cell Culture
HEK293T, HeLa, and MDA-MB-231 cells were maintained in DMEM supplemented with 10% FBS and 1% penicillin-streptomycin. U937 cells were maintained in RPMI supplemented with 10% heat-inactivated FBS and 1% penicillin-streptomycin. All cells were maintained in a 5% CO2 incubator at 37 °C and were purchased from ATCC.
Method Details
Creation of recombinant DNA
pLentiCRISPRv2 was used as the 3rd-generation lentiviral backbone for all knockout lines. Oligonucleotides containing guide sequences (Table S1) were cloned into this lentiviral backbone using previously described protocols.37,38
pLVX-TetOne-FLAG was used as the lentiviral backbone for all inducible lines. PELI2-WT, PELI2-R106A, PELI2–2C>2A, and PELI2 FHA were PCR amplified (Table S1) and cloned into the EcoRI-BamHI site of this lentiviral backbone through isothermal Gibson assembly as previously described.7,39 PELI2-WT was originally amplified from cDNA of U937 cells.
To create pcDNA3.1-PELI2-FLAG, PELI2-FLAG was PCR amplified (Table S1) from pLVX-TetOne-FLAG and cloned into the BamHI-EcoRI site of pcDNA3.1 (+) through isothermal Gibson assembly.
To create mutants of PELI2 and STING, mutagenesis primers (Table S1) were designed using the online QuikChange Primer Design tool from Agilent. These primers were then used with the QuikChange Site-Directed Mutagenesis Kit (Agilent) to create mutants of pcDNA3.1-PELI2-FLAG and pcDNA3-hSTING-HA.40
The STING no T/S mutant was synthesized by Twist Biosciences and cloned into the pTwist-CMV backbone. Mutants of this STING no T/S were generated using the QuikChange Site-Directed Mutagenesis Kit, with primers listed in Table S1.
pLenti-CMV-GFP-puro41 was used as the lentiviral backbone for creating stably expressing mutant STING lines. STING-5T>A was PCR amplified (Table S1) and cloned into the BamHI-SalI site of this lentiviral backbone through isothermal Gibson assembly.
Creation of cell lines
To produce lentivirus, HEK293T cells were transfected with 500 ng lentiviral plasmid, 750 ng pSPAX2, and 750 ng pHDM-G with FuGENE 6 transfection reagent. Viral media was exchanged after 24 h and harvested after 48 h. This viral media was then passed through a 0.45 μm filter before infection of cells. To infect U937 cells, 5 × 10⁴ cells were added to 1 mL viral media with 8 μg/mL polybrene. These cells were spun in a 24 well plate at 1000 × g for 1 h then resuspended in fresh media. To infect MDA-MB-231 cells, 5 × 10⁴ cells were split into a 12 well plate 24 h before infection. Then, media was removed from cells and replaced with 1 mL viral media. After a 24 h incubation, viral media was removed from cells and replaced with fresh media.
cGAMP stimulation experiments for Western blot analysis
For experiments involving inducible U937 cell lines, cells were either left uninduced or induced with 20 ng / mL doxycycline overnight at a density of 5 × 10⁵ cells / mL before treatment. For all treatments, cells were pelleted and treated with the indicated concentration of cGAMP for 2 h at a density of 5 × 10⁵ cells / mL in 1.4 mL media. After treatment, cells were pelleted and lysed with 70 μL Laemmli Sample Buffer. Lysates were then sonicated and boiled for 10 min before running on an acrylamide gel for Western blot analysis. All gels were run in MES-SDS buffer, except for gels in Supplementary Figure 2I–J, which were run in MOPS-SDS buffer.
cGAMP stimulation experiments for RT-qPCR analysis
Cells were either left uninduced or induced with 20 ng / mL doxycycline overnight at a density of 5 × 10⁵ cells / mL before treatment. Cells were then pelleted and treated with the indicated concentration of cGAMP in the presence of 10 μM STF-1084 for the indicated amount of time at a density of 5 × 10⁵ cells / mL in 2 mL media. After treatment, cells were pelleted, wash with 1 mL PBS, and lysed with 350 μL TRIzol. RNA was purified from TRIzol using Direct-zol RNA miniprep kits (Zymo Research).
Immunoprecipitation experiments
For immunoprecipitation experiments in U937 cells, cells were either left uninduced or induced with 20 ng / mL doxycycline at a density of 5 × 10⁵ cells / mL. Cells were then pelleted and treated with the indicated concentration of cGAMP for 2 h at a density of 1.5 × 10⁶ cells / mL in 1.4 mL media. Cells were then pelleted and lysed in 400 μL lysis buffer (Cell Signaling Technology) supplemented with protease and phosphatase inhibitors (Roche). Lysate was then clarified by centrifugation at 12,000 × g for 15 min.
For immunoprecipitation experiments in HEK293T cells, 1.5 × 10⁵ cells were split into a 6 well plate 24 h before transfection. For experiments investigating PELI2-FLAG pulldown of different STING mutants, cells were transfected with 20 ng pcDNA3-hSTING-HA mutants, 2000 ng pcDNA3.1, and either 500 ng pcDNA3.1-PELI2-FLAG-WT or 500 ng pcDNA3.1 as a negative control. For experiments investigating ubiquitination of different proteins by PELI2, cells were transfected with 1000 ng pRK5-HA-Ub,42 1800 pcDNA3.1, and either 200 ng pcDNA3.1-PELI2-WT-FLAG or 200 ng pcDNA3.1 as a negative control. For all HEK293T experiments, transfected cells were split into 10 cm dishes 24 h after transfection. Then, 48 h after transfection, cells were treated with 100 uM cGAMP for 2 h, washed with PBS, then lysed in 400 μL lysis buffer (Cell Signaling Technology) supplemented with protease and phosphatase inhibitors (Roche). Lysate was then clarified by centrifugation at 12,000 × g for 15 min. For immunoprecipitation of PELI2-FLAG, 30 μL of anti-FLAG magnetic agarose (Pierce) was equilibrated 3x with lysis buffer. Then, 300 μL of clarified lysate was added to equilibrated agarose and incubated for 20 min rotating at room temperature. Agarose was then washed 5x with 500 μL lysis buffer, transferred to a new tube, and eluted by boiling 2x in 35 μL Laemmli Sample Buffer for 5 min.
For immunoprecipiration of TBK1 and IRF3, 6 μL of either anti-TBK1 or anti-IRF3 was added to 294 μL clarified lysate and incubated overnight rotating at 4 °C. Then, 30 μL of protein A magnetic agarose was added incubated for an additional 4 h rotating at 4 °C. Agarose was then washed 5x with 500 μL lysis buffer, transferred to a new tube, and eluted by boiling 2x in 35 μL Laemmli Sample Buffer for 5 min.
For immunoprecipitation of K63-linked polyubiquitin chains from U937 cell lysate, 30 μL of K63 TUBE magnetic beads (LifeSensors) was added to 300 μL cell lysate and incubated overnight rotating at 4 °C. Magnetic beads were then washed 5x with 500 μL lysis buffer, transferred to a new tube, and eluted by boiling 2x in 35 μL Laemmli Sample Buffer for 5 min.
HSV infection
2 × 10⁵ MDA-MB-231 PELI2 sgRNA + tet-PELI2-FLAG WT cells were split into 12 well plate and either left uninduced or induced with 20 ng / mL doxycycline overnight. Then, cells were infected in 200 uL serum free DMEM with HSV-1 at 1 MOI. Plate was rocked every 15 min to ensure adequate coverage of the cells. After 1 h, virus was removed from the cells and replaced with 1 mL fresh, complete media. After an additional 6 h incubation, media was removed, and cells were lysed with 350 μL TRIzol. RNA was purified from TRIzol using Direct-zol RNA miniprep kits (Zymo Research). cDNA was the synthesized from RNA using Maxima RT (Thermo Fisher) and qPCR was performed with GreenStar Master Mix (Bioneer).
Analysis of bulk expression data
RNA-seq data for effects of HSV infection on transcript expression in HFF-1 cells were obtained from GEO, accession GSE124118. Counts of PELI2 transcript levels were normalized to counts per million (CPM) per sample.
Microarray data for effects of Listeria monocytogenes infection on transcript expression of primary monocytes was obtained from GEO, accession GSE67983. Quantile normalized values of probe ILMN_1780132 (which hybridizes to PELI2) were used to determine PELI2 expression values.
RNA-seq data of normal and tumor tissue samples of 18 different tissue sites was obtained from the UCSC Xena combined cohort of TCGA, TARGET, and GTEx samples. Only tissues containing both normal samples (from GTEx) and tumor samples (from TCGA/TARGET) are analyzed for PELI2 levels.
Analysis of single cell RNA-seq data
Single cell RNA-seq (scRNA) data of skin biopsies from healthy donors and lupus patients were obtained from GEO, accession GSE186476,26 and processed with scanpy version 1.9. Single cells with less than 500 genes detected or greater than 25% mitochondrial genes were filtered out prior to analysis. UMI counts were normalized to counts per million and log + 1 transformed. UMAPs of cells were created by running the following scanpy methods sequentially using the default parameters: pp.highly_variable_genes(), tl.pca(), pp.neighbors(), then tl.umap(). Leiden clustering was then performed on UMAPs by running tl.leiden() with resolution=0.1. Cell type annotations of Leiden clusters were determined by obtaining initial annotations with the CellO package,43 then manually updating these annotations to align with cell types known to be present in the skin. Cells annotated as keratinocytes were then selected to compare gene expression between patient conditions.
scRNA-seq data of differentiated iPSCs isolated from one healthy donor and two AGS patients were obtained from GEO, accession GSE193710,28 and processed with scanpy version 1.9. Single cells with less than 750 genes detected or greater than 30% mitochondrial genes were filtered out prior to analysis. UMI counts were normalized to counts per million and log + 1 transformed. Cells were then batch corrected with Harmony.44 UMAPs of cells were created by running the following scanpy methods sequentially using the default parameters: pp.highly_variable_genes(), tl.pca(), pp.neighbors(), then tl.umap(). Leiden clustering was then performed on UMAPs by running tl.leiden() with resolution=0.2. Cell type annotations of Leiden clusters were determined with the CellO package.43 Cells annotated as astrocytes were then selected to compare gene expression between patient conditions.
scRNA-seq data of PBMCs isolated from healthy and SLE patients were obtained from GEO, accession GSE174188,27 and processed with scanpy version 1.9. Depositor supplied metadata was used to label cell types of single cells. Specified cell types were selected to compare gene expression between patient conditions.
scRNA-seq data of hepatic NK cells isolated from patients with different liver diseases were obtained from GEO, accession GSE217968,29 and processed with scanpy version 1.9. Single cells with less than 1000 genes detected, greater than 4000 genes detected, or greater than 20% mitochondrial genes were filtered out prior to analysis. UMI counts were normalized to counts per million and log + 1 transformed before comparing gene expression between patient conditions.
scRNA-seq data of donor isolated plasmacytoid dendritic cells infected with influenza virus were obtained from GEO, accession GSE189120,17 and processed with scanpy version 1.9. Single cells with less than 1000 genes, more than 6000 genes, or more than 20% mitochondrial genes were filtered out prior to analysis. UMI counts were normalized to counts per million and log + 1 transformed. UMAPs of cells were created by running the following scanpy methods sequentially using the default parameters: pp.highly_variable_genes(), tl.pca(), pp.neighbors(), then tl.umap(). Leiden clustering was then performed on UMAPs by running tl.leiden() with resolution=0.5. While the majority of cells clustered close together in UMAP space, a minority of cells appeared in a separate, distal cluster (cluster 5) and were filtered out prior to pseudotime analysis. Cells were assigned an ISG score using tl.score_genes() using the following list of 10 ISGs: IFIT1, IFIT2, IFIT3, CXCL10, OAS1, ISG15, ISG20, IRF7, IFI44L, and IFIH1. The cell with the lowest ISG score was designated as the root cell for pseudotime analysis. Diffusion pseudotime analysis was performed by sequentially running tl.diffmap() then tl.dpt(). To account for gene dropout in the single cell data, right aligned moving averages of gene expression were calculated for cells along pseudotime with a window size of 1000 cells. These moving averages were then plotted against pseudotime to show PELI2, IFNB1, and ISG expression over the course of viral infection.
Quantification and Statistical Analysis
Signal strength of bands from Western blots was quantified with ImageJ v1.53c.45 GraphPad Prism was used to perform paired t tests on data. n indicates biological replicates from independent experiments. * p < 0.05; ** p < 0.005; *** p < 0.0005.
Supplementary Material
STING activation and interferon production are crucial for anti-viral immunity, but dysregulation causes debilitating autoimmune conditions. Here, Ritchie and Li report PELI2 as a dynamic negative regulator and threshold setter of STING activation. PELI2 inhibits interferon production at homeostasis but is rapidly downregulated during viral infection to mount anti-viral immunity.
PELI2 binds phosphorylated STING to negatively regulate IRF3–interferon signaling
When STING activation reaches a threshold PELI2 is downregulated to commit to defense
PELI2 prevents basal inflammation and autoimmune patients have lower PELI2 levels
Acknowledgements
We would like to thank all Li lab members and Dr. B. Xu Hua Fu for their insightful comments that helped guide this study. This study was funded by NIH Grant DP2CA228044 and the Arc Institute. C.R. was supported by NIH Grant 5T32GM007276 and the Stanford Graduate Fellowship.
Footnotes
Declaration of Interests
C.R. and L.L. have filed a patent on using PELI2 as a biomarker (Application No. PCT/US24/24438).
Publisher's Disclaimer: This is a PDF file of an unedited manuscript that has been accepted for publication. As a service to our customers we are providing this early version of the manuscript. The manuscript will undergo copyediting, typesetting, and review of the resulting proof before it is published in its final form. Please note that during the production process errors may be discovered which could affect the content, and all legal disclaimers that apply to the journal pertain.
References
- 1.Ritchie C, Carozza JA, and Li L (2022). Biochemistry, Cell Biology, and Pathophysiology of the Innate Immune cGAS-cGAMP-STING Pathway. Annu. Rev. Biochem. 91, 599–628. 10.1146/annurev-biochem-040320-101629. [DOI] [PubMed] [Google Scholar]
- 2.Lee-Kirsch MA, Gong M, Chowdhury D, Senenko L, Engel K, Lee Y-A, de Silva U, Bailey SL, Witte T, Vyse TJ, et al. (2007). Mutations in the gene encoding the 3’−5’ DNA exonuclease TREX1 are associated with systemic lupus erythematosus. Nat. Genet. 39, 1065–1067. 10.1038/ng2091. [DOI] [PubMed] [Google Scholar]
- 3.Gall A, Treuting P, Elkon KB, Loo Y-M, Gale M, Barber GN, and Stetson DB (2012). Autoimmunity initiates in nonhematopoietic cells and progresses via lymphocytes in an interferon-dependent autoimmune disease. Immunity 36, 120–131. 10.1016/j.immuni.2011.11.018. [DOI] [PMC free article] [PubMed] [Google Scholar]
- 4.Gao D, Li T, Li X-D, Chen X, Li Q-Z, Wight-Carter M, and Chen ZJ (2015). Activation of cyclic GMP-AMP synthase by self-DNA causes autoimmune diseases. Proc. Natl. Acad. Sci. U. S. A. 112, E5699–705. 10.1073/pnas.1516465112. [DOI] [PMC free article] [PubMed] [Google Scholar]
- 5.Stetson DB, Ko JS, Heidmann T, and Medzhitov R (2008). Trex1 prevents cell-intrinsic initiation of autoimmunity. Cell 134, 587–598. 10.1016/j.cell.2008.06.032. [DOI] [PMC free article] [PubMed] [Google Scholar]
- 6.Ritchie C, Cordova AF, Hess GT, Bassik MC, and Li L (2019). SLC19A1 Is an Importer of the Immunotransmitter cGAMP. Mol. Cell 75, 372–381.e5. 10.1016/j.molcel.2019.05.006. [DOI] [PMC free article] [PubMed] [Google Scholar]
- 7.Lahey LJ, Mardjuki RE, Wen X, Hess GT, Ritchie C, Carozza JA, Böhnert V, Maduke M, Bassik MC, and Li L (2020). LRRC8A:C/E Heteromeric Channels Are Ubiquitous Transporters of cGAMP. Mol. Cell 80, 578–591.e5. 10.1016/j.molcel.2020.10.021. [DOI] [PMC free article] [PubMed] [Google Scholar]
- 8.Oleszycka E, Rodgers AM, Xu L, and Moynagh PN (2021). Dendritic Cell-Specific Role for Pellino2 as a Mediator of TLR9 Signaling Pathway. J. Immunol. 207, 2325–2336. 10.4049/jimmunol.2100236. [DOI] [PMC free article] [PubMed] [Google Scholar]
- 9.Humphries F, Bergin R, Jackson R, Delagic N, Wang B, Yang S, Dubois AV, Ingram RJ, and Moynagh PN (2018). The E3 ubiquitin ligase Pellino2 mediates priming of the NLRP3 inflammasome. Nat. Commun. 9, 1560. 10.1038/s41467-018-03669-z. [DOI] [PMC free article] [PubMed] [Google Scholar]
- 10.Moynagh PN (2014). The roles of Pellino E3 ubiquitin ligases in immunity. Nat. Rev. Immunol. 14, 122–131. 10.1038/nri3599. [DOI] [PubMed] [Google Scholar]
- 11.Gui X, Yang H, Li T, Tan X, Shi P, Li M, Du F, and Chen ZJ (2019). Autophagy induction via STING trafficking is a primordial function of the cGAS pathway. Nature 567, 262–266. 10.1038/s41586-019-1006-9. [DOI] [PMC free article] [PubMed] [Google Scholar]
- 12.Huoh Y-S, and Ferguson KM (2014). The pellino e3 ubiquitin ligases recognize specific phosphothreonine motifs and have distinct substrate specificities. Biochemistry 53, 4946–4955. 10.1021/bi5005156. [DOI] [PMC free article] [PubMed] [Google Scholar]
- 13.Ma M, Dang Y, Chang B, Wang F, Xu J, Chen L, Su H, Li J, Ge B, Chen C, et al. (2023). TAK1 is an essential kinase for STING trafficking. Mol. Cell 83, 3885–3903.e5. 10.1016/j.molcel.2023.09.009. [DOI] [PubMed] [Google Scholar]
- 14.Lee C-R, Park Y-H, Min H, Kim Y-R, and Seok Y-J (2019). Determination of protein phosphorylation by polyacrylamide gel electrophoresis. J. Microbiol. 57, 93–100. 10.1007/s12275-019-9021-y. [DOI] [PubMed] [Google Scholar]
- 15.Kim TW, Yu M, Zhou H, Cui W, Wang J, DiCorleto P, Fox P, Xiao H, and Li X (2012). Pellino 2 is critical for Toll-like receptor/interleukin-1 receptor (TLR/IL-1R)-mediated post-transcriptional control. J. Biol. Chem. 287, 25686–25695. 10.1074/jbc.M112.352625. [DOI] [PMC free article] [PubMed] [Google Scholar]
- 16.Deng L, Wang C, Spencer E, Yang L, Braun A, You J, Slaughter C, Pickart C, and Chen ZJ (2000). Activation of the IkappaB kinase complex by TRAF6 requires a dimeric ubiquitin-conjugating enzyme complex and a unique polyubiquitin chain. Cell 103, 351–361. 10.1016/s0092-8674(00)00126-4. [DOI] [PubMed] [Google Scholar]
- 17.Ghanem MH, Shih AJ, Khalili H, Werth EG, Chakrabarty JK, Brown LM, Simpfendorfer KR, and Gregersen PK (2022). Proteomic and Single-Cell Transcriptomic Dissection of Human Plasmacytoid Dendritic Cell Response to Influenza Virus. Front. Immunol. 13, 814627. 10.3389/fimmu.2022.814627. [DOI] [PMC free article] [PubMed] [Google Scholar]
- 18.Zhou C, Chen X, Planells-Cases R, Chu J, Wang L, Cao L, Li Z, López-Cayuqueo KI, Xie Y, Ye S, et al. (2020). Transfer of cGAMP into Bystander Cells via LRRC8 Volume-Regulated Anion Channels Augments STING-Mediated Interferon Responses and Anti-viral Immunity. Immunity 52, 767–781.e6. 10.1016/j.immuni.2020.03.016. [DOI] [PubMed] [Google Scholar]
- 19.Jeremiah N, Neven B, Gentili M, Callebaut I, Maschalidi S, Stolzenberg M-C, Goudin N, Frémond M-L, Nitschke P, Molina TJ, et al. (2014). Inherited STING-activating mutation underlies a familial inflammatory syndrome with lupus-like manifestations. J. Clin. Invest. 124, 5516–5520. 10.1172/JCI79100. [DOI] [PMC free article] [PubMed] [Google Scholar]
- 20.Carozza JA, Böhnert V, Nguyen KC, Skariah G, Shaw KE, Brown JA, Rafat M, von Eyben R, Graves EE, Glenn JS, et al. (2020). Extracellular cGAMP is a cancer cell-produced immunotransmitter involved in radiation-induced anti-cancer immunity. Nat. cancer 1, 184–196. 10.1038/s43018-020-0028-4. [DOI] [PMC free article] [PubMed] [Google Scholar]
- 21.Peschke K, Achleitner M, Frenzel K, Gerbaulet A, Ada SR, Zeller N, Lienenklaus S, Lesche M, Poulet C, Naumann R, et al. (2016). Loss of Trex1 in Dendritic Cells Is Sufficient To Trigger Systemic Autoimmunity. J. Immunol. 197, 2157–2166. 10.4049/jimmunol.1600722. [DOI] [PubMed] [Google Scholar]
- 22.Crossley MP, Song C, Bocek MJ, Choi J-H, Kousorous J, Sathirachinda A, Lin C, Brickner JR, Bai G, Lans H, et al. (2023). R-loop-derived cytoplasmic RNA-DNA hybrids activate an immune response. Nature 613, 187–194. 10.1038/s41586-022-05545-9. [DOI] [PMC free article] [PubMed] [Google Scholar]
- 23.Furie R, Khamashta M, Merrill JT, Werth VP, Kalunian K, Brohawn P, Illei GG, Drappa J, Wang L, Yoo S, et al. (2017). Anifrolumab, an Anti-Interferon-α Receptor Monoclonal Antibody, in Moderate-to-Severe Systemic Lupus Erythematosus. Arthritis Rheumatol. (Hoboken, N.J.) 69, 376–386. 10.1002/art.39962. [DOI] [PMC free article] [PubMed] [Google Scholar]
- 24.Skopelja-Gardner S, An J, Tai J, Tanaka L, Sun X, Hermanson P, Baum R, Kawasumi M, Green R, Gale M, et al. (2020). The early local and systemic Type I interferon responses to ultraviolet B light exposure are cGAS dependent. Sci. Rep. 10, 7908. 10.1038/s41598-020-64865-w. [DOI] [PMC free article] [PubMed] [Google Scholar]
- 25.Psarras A, Alase A, Antanaviciute A, Carr IM, Md Yusof MY, Wittmann M, Emery P, Tsokos GC, and Vital EM (2020). Functionally impaired plasmacytoid dendritic cells and non-haematopoietic sources of type I interferon characterize human autoimmunity. Nat. Commun. 11, 6149. 10.1038/s41467-020-19918-z. [DOI] [PMC free article] [PubMed] [Google Scholar]
- 26.Dunlap GS, Billi AC, Xing X, Ma F, Maz MP, Tsoi LC, Wasikowski R, Hodgin JB, Gudjonsson JE, Kahlenberg JM, et al. (2022). Single-cell transcriptomics reveals distinct effector profiles of infiltrating T cells in lupus skin and kidney. JCI insight 7. 10.1172/jci.insight.156341. [DOI] [PMC free article] [PubMed] [Google Scholar]
- 27.Perez RK, Gordon MG, Subramaniam M, Kim MC, Hartoularos GC, Targ S, Sun Y, Ogorodnikov A, Bueno R, Lu A, et al. (2022). Single-cell RNA-seq reveals cell type-specific molecular and genetic associations to lupus. Science 376, eabf1970. 10.1126/science.abf1970. [DOI] [PMC free article] [PubMed] [Google Scholar]
- 28.Giordano AMS, Luciani M, Gatto F, Abou Alezz M, Beghè C, Della Volpe L, Migliara A, Valsoni S, Genua M, Dzieciatkowska M, et al. (2022). DNA damage contributes to neurotoxic inflammation in Aicardi-Goutières syndrome astrocytes. J. Exp. Med. 219. 10.1084/jem.20211121. [DOI] [PMC free article] [PubMed] [Google Scholar]
- 29.Maretti-Mira AC, Salomon MP, Hsu AM, Dara L, and Golden-Mason L (2023). Etiology of end-stage liver cirrhosis impacts hepatic natural killer cell heterogenicity. Front. Immunol. 14, 1137034. 10.3389/fimmu.2023.1137034. [DOI] [PMC free article] [PubMed] [Google Scholar]
- 30.Sliter DA, Martinez J, Hao L, Chen X, Sun N, Fischer TD, Burman JL, Li Y, Zhang Z, Narendra DP, et al. (2018). Parkin and PINK1 mitigate STING-induced inflammation. Nature 561, 258–262. 10.1038/s41586-018-0448-9. [DOI] [PMC free article] [PubMed] [Google Scholar] [Retracted]
- 31.Yu C-H, Davidson S, Harapas CR, Hilton JB, Mlodzianoski MJ, Laohamonthonkul P, Louis C, Low RRJ, Moecking J, De Nardo D, et al. (2020). TDP-43 Triggers Mitochondrial DNA Release via mPTP to Activate cGAS/STING in ALS. Cell 183, 636–649.e18. 10.1016/j.cell.2020.09.020. [DOI] [PMC free article] [PubMed] [Google Scholar]
- 32.King KR, Aguirre AD, Ye Y-X, Sun Y, Roh JD, Ng RP, Kohler RH, Arlauckas SP, Iwamoto Y, Savol A, et al. (2017). IRF3 and type I interferons fuel a fatal response to myocardial infarction. Nat. Med. 23, 1481–1487. 10.1038/nm.4428. [DOI] [PMC free article] [PubMed] [Google Scholar]
- 33.Ishikawa H, Ma Z, and Barber GN (2009). STING regulates intracellular DNA-mediated, type I interferon-dependent innate immunity. Nature 461, 788–792. 10.1038/nature08476. [DOI] [PMC free article] [PubMed] [Google Scholar]
- 34.Woo S-R, Fuertes MB, Corrales L, Spranger S, Furdyna MJ, Leung MYK, Duggan R, Wang Y, Barber GN, Fitzgerald KA, et al. (2014). STING-dependent cytosolic DNA sensing mediates innate immune recognition of immunogenic tumors. Immunity 41, 830–842. 10.1016/j.immuni.2014.10.017. [DOI] [PMC free article] [PubMed] [Google Scholar]
- 35.de Oliveira Mann CC, Orzalli MH, King DS, Kagan JC, Lee ASY, and Kranzusch PJ (2019). Modular Architecture of the STING C-Terminal Tail Allows Interferon and NF-κB Signaling Adaptation. Cell Rep. 27, 1165–1175.e5. 10.1016/j.celrep.2019.03.098. [DOI] [PMC free article] [PubMed] [Google Scholar]
- 36.Zhou W, Whiteley AT, de Oliveira Mann CC, Morehouse BR, Nowak RP, Fischer ES, Gray NS, Mekalanos JJ, and Kranzusch PJ (2018). Structure of the Human cGAS-DNA Complex Reveals Enhanced Control of Immune Surveillance. Cell 174, 300–311.e11. 10.1016/j.cell.2018.06.026. [DOI] [PMC free article] [PubMed] [Google Scholar]
- 37.Sanjana NE, Shalem O, and Zhang F (2014). Improved vectors and genome-wide libraries for CRISPR screening. Nat. Methods 11, 783–784. 10.1038/nmeth.3047. [DOI] [PMC free article] [PubMed] [Google Scholar]
- 38.Shalem O, Sanjana NE, Hartenian E, Shi X, Scott DA, Mikkelson T, Heckl D, Ebert BL, Root DE, Doench JG, et al. (2014). Genome-scale CRISPR-Cas9 knockout screening in human cells. Science 343, 84–87. 10.1126/science.1247005. [DOI] [PMC free article] [PubMed] [Google Scholar]
- 39.Cordova AF, Ritchie C, Böhnert V, and Li L (2021). Human SLC46A2 Is the Dominant cGAMP Importer in Extracellular cGAMP-Sensing Macrophages and Monocytes. ACS Cent. Sci. 7, 1073–1088. 10.1021/acscentsci.1c00440. [DOI] [PMC free article] [PubMed] [Google Scholar]
- 40.Ergun SL, Fernandez D, Weiss TM, and Li L (2019). STING Polymer Structure Reveals Mechanisms for Activation, Hyperactivation, and Inhibition. Cell 178, 290–301.e10. 10.1016/j.cell.2019.05.036. [DOI] [PubMed] [Google Scholar]
- 41.Campeau E, Ruhl VE, Rodier F, Smith CL, Rahmberg BL, Fuss JO, Campisi J, Yaswen P, Cooper PK, and Kaufman PD (2009). A versatile viral system for expression and depletion of proteins in mammalian cells. PLoS One 4, e6529. 10.1371/journal.pone.0006529. [DOI] [PMC free article] [PubMed] [Google Scholar]
- 42.Lim KL, Chew KCM, Tan JMM, Wang C, Chung KKK, Zhang Y, Tanaka Y, Smith W, Engelender S, Ross CA, et al. (2005). Parkin mediates nonclassical, proteasomal-independent ubiquitination of synphilin-1: implications for Lewy body formation. J. Neurosci. 25, 2002–2009. 10.1523/JNEUROSCI.4474-04.2005. [DOI] [PMC free article] [PubMed] [Google Scholar]
- 43.Bernstein MN, Ma Z, Gleicher M, and Dewey CN (2021). CellO: comprehensive and hierarchical cell type classification of human cells with the Cell Ontology. iScience 24, 101913. 10.1016/j.isci.2020.101913. [DOI] [PMC free article] [PubMed] [Google Scholar]
- 44.Korsunsky I, Millard N, Fan J, Slowikowski K, Zhang F, Wei K, Baglaenko Y, Brenner M, Loh P-R, and Raychaudhuri S (2019). Fast, sensitive and accurate integration of single-cell data with Harmony. Nat. Methods 16, 1289–1296. 10.1038/s41592-019-0619-0. [DOI] [PMC free article] [PubMed] [Google Scholar]
- 45.Schneider CA, Rasband WS, and Eliceiri KW (2012). NIH Image to ImageJ: 25 years of image analysis. Nat. Methods 9, 671–675. [DOI] [PMC free article] [PubMed] [Google Scholar]
Associated Data
This section collects any data citations, data availability statements, or supplementary materials included in this article.
Supplementary Materials
Data Availability Statement
All RNA-seq data analyzed in this paper is from existing, publicly available datasets. The accession numbers for these datasets are listed in the key resources table.
This paper does not report original code.
Any additional information required to reanalyze the data reported in this paper is available from the lead contact upon request.
Key resources table.
| REAGENT or RESOURCE | SOURCE | IDENTIFIER |
|---|---|---|
| Antibodies | ||
| DYKDDDDK Tag (FLAG) Rabbit Antibody | Cell Signaling Technology | Cat#2368; RRID:AB_2217020 |
| LC3A/B Rabbit Antibody | Cell Signaling Technology | Cat#4108; RRID:AB_2137703 |
| Phospho-IRF-3 (Ser396) (4D4G) Rabbit mAb | Cell Signaling Technology | Cat#4947; RRID:AB_823547 |
| Phospho-STING (Ser366) (D7C3S) Rabbit mAb | Cell Signaling Technology | Cat# 19781; RRID: AB_2737062 |
| Phospho-TBK1/NAK (Ser172) (D52C2) XP Rabbit mAb | Cell Signaling Technology | Cat#5483; RRID:AB_10693472 |
| TBK1/NAK (D1B4) Rabbit mAb | Cell Signaling Technology | Cat#3504; RRID:AB_2255663 |
| α-Tubulin (DM1A) Mouse mAb | Cell Signaling Technology | Cat#3873; RRID:AB_1904178 |
| Bacterial and virus strains | ||
| Human herpesvirus 1 | ATCC | Cat#VR-1493 |
| Chemicals, peptides, and recombinant proteins | ||
| 2’3’-cGAMP | Ritchie et al.6 | N/A |
| Anti-DYKDDDDK Magnetic Agarose | Thermo Fisher Scientific | Cat#A36797 |
| K63 TUBE (Magnetic Beads) | LifeSensors | Cat#UM404M |
| Protein A Magnetic Beads | Cell Signaling Technology | Cat#73778 |
| Recombinant Human IFN-β | PeproTech | Cat#300–02BC |
| Critical commercial assays | ||
| AccuPower 2X GreenStar master mix for qPCR | Bioneer | Cat#K-6251 |
| Deposited data | ||
| Bulk RNA-seq data of HFF-1 cells infected with HSV-1 | Tseng Lab; GEO | GEO GSE124118 |
| Bulk RNA-seq data of normal and tumor tissue samples | UCSC Xena | TCGA, TARGET, and GTEx cohorts |
| Microarray data of primary monocytes infected with Listeria monocytogenes | Wee Lab; GEO | GEO GSE67983 |
| scRNA-seq data of skin samples from healthy donors and lupus patients | Dunlap et al.,26 GEO | GEO GSE186476 |
| scRNA-seq data of differentiated iPSCs from healthy donor and AGS patients | Giordano et al.,28 GEO | GEO GSE193710 |
| scRNA-seq data of PBMCs from healthy donors and SLE patients | Perez et al.,27 GEO | GEO GSE174188 |
| scRNA-seq data of hepatic NK cells from patients with different liver diseases | Maretti-Mira et al.,29 GEO | GEO GSE217968 |
| scRNA-seq data of primary plasmacytoid dendritic cells infected with influenza virus | Ghanem et al.,17 GEO | GEO GSE189120 |
| Experimental models: Cell lines | ||
| HEK293T | ATCC | Cat#CRL-3216; RRID:CVCL_0063 |
| HeLa | ATCC | Cat#CRM-CCL-2; RRID:CVCL_0030 |
| MDA-MB-231 | ATCC | Cat#CRM-HTB-26; RRID:CVCL_0062 |
| U937 | ATCC | Cat#CRL-1593.2; RRID:CVCL_0007 |
| Oligonucleotides | ||
| All oligonucleotides used in this study are listed in Table S1 | This paper | Table S1 |
| Recombinant DNA | ||
| pcDNA3-hSTING-HA-WT | Ergun et al.40 | N/A |
| pcDNA3-hSTING-HA-T342A | This paper | N/A |
| pcDNA3-hSTING-HA-T348A | This paper | N/A |
| pcDNA3-hSTING-HA-T354A | This paper | N/A |
| pcDNA3-hSTING-HA-T356A | This paper | N/A |
| pcDNA3-hSTING-HA-T354/356A | This paper | N/A |
| pcDNA3-hSTING-HA-S366A | This paper | N/A |
| pcDNA3-hSTING-HA-T376A | This paper | N/A |
| pcDNA3-hSTING-HA-only-T342 | This paper | N/A |
| pcDNA3-hSTING-HA-only-T348 | This paper | N/A |
| pcDNA3-hSTING-HA-only-T354 | This paper | N/A |
| pcDNA3-hSTING-HA-only-T356 | This paper | N/A |
| pcDNA3-hSTING-HA-only-T376 | This paper | N/A |
| pcDNA3-hSTING-HA-5T>A | This paper | N/A |
| pcDNA3.1 (+) | Thermo Fisher Scientific | Cat#V79020 |
| pcDNA3.1-PELI2-FLAG | This paper | N/A |
| pLenti-CMV-GFP-puro | Campeau et al.,41 Addgene | Cat#17448; RRID:Addgene_17448 |
| pLenti-CMV-STING-5T>A-puro | This paper | N/A |
| pLentiCRISPR-v2 | Sanjana et al.,37 Addgene | Cat#52961; RRID:Addgene_52961 |
| pLVX-TetOne-FLAG | Lahey et al.7 | N/A |
| pLVX-TetOne-PELI2-FLAG-WT-blast | This paper | N/A |
| pLVX-TetOne-PELI2-FLAG-R106A-blast | This paper | N/A |
| pLVX-TetOne-PELI2-FLAG-C397/400A-blast | This paper | N/A |
| pLVX-TetOne-PELI2-FLAG-FHA-blast | This paper | N/A |
| pRK5-HA-Ubiquitin-WT | Lim et al.,42 Addgene | Cat#17608; RRID:Addgene_17608 |
| pRK5-HA-Ubiquitin-K48 | Lim et al.,42 Addgene | Cat#17605; RRID:Addgene_17605 |
| pRK5-HA-Ubiquitin-K63 | Lim et al.,42 Addgene | Cat#17606; RRID:Addgene_17606 |
| psPAX2 | Trono Lab, Addgene | Cat#12260; RRID:Addgene_12260 |
| pHDM-G | Harvard PlasmID | Cat#EvNO00061606 |
| Software and algorithms | ||
| CellO (Cell Ontology-based classification) | Bernstein et al.43 | http://github.com/deweylab/CellO |
| GraphPad Prism version 9.5.1 | GraphPad Software | https://www.graphpad.com/ |
| ImageJ version 1.53c | Schneider et al.45 | http://imagej.net/ij/ |
| Python version 3.8.10 | Python Software Foundation | http://www.python.org |
| Scanpy version 1.9.2 | Scanpy Development Team | http://scanpy.readthedocs.io/en/stable/ |
| GraphPad Prism version 9.5.1 | GraphPad Software | https://www.graphpad.com/ |