

Summary
While ultraviolet (UV) radiation damages DNA, eliciting the DNA damage response (DDR), it also damages RNA, triggering transcriptome-wide ribosomal collisions and eliciting a ribotoxic stress response (RSR). However, the relative contributions, timing, and regulation of these pathways in determining cell fate is unclear. Here we use time-resolved phosphoproteomic, chemical-genetic, single-cell imaging, and biochemical approaches to create a chronological atlas of signaling events activated in cells responding to UV damage. We discover that UV-induced apoptosis is mediated by the RSR kinase ZAK and not through the DDR. We identify two negative-feedback modules that regulate ZAK-mediated apoptosis: (1) GCN2 activation limits ribosomal collisions and attenuates ZAK-mediated RSR signaling and (2) ZAK activity leads to phosphodegron autophosphorylation and its subsequent degradation. These events tune ZAK’s activity to collision levels to establish regimes of homeostasis, tolerance, and death, revealing its key role as the cellular sentinel for nucleic acid damage.
Keywords: ZAK, GCN2, ribosomes, collisions, ribotoxic stress, phosphoproteomics, signaling, apoptosis
Graphical Abstract

In brief
A comprehensive analysis of molecular and cellular changes following UV irradiation reveals that the ribotoxic stress response, rather than the DNA damage response, mediates UV-dependent programmed cell death.
Introduction
The ability of cells to respond to changing environmental conditions is critical for their survival1. Cellular responses to environmental perturbations rely on signaling cascades that regulate gene expression and activate stress response programs to restore homeostasis2–6. When stress cannot be resolved, cells trigger programmed cell death to prevent dysfunctional cells from causing harm to the organism1,7.
Ribosomes serve as primary stress sensors, activating signaling pathways that determine cell fate8,9. In unstressed cells, translational homeostasis is maintained by adjusting initiation rates on mRNAs10. However, ribosomes occasionally encounter problematic mRNAs arising from defects in gene expression or from chemical damage11,12. Prolonged stalling leads to ribosome collisions which distinguish slow from defective elongation13. Collisions recruit quality control (QC) factors that target the mRNA and nascent peptide for degradation and rescue stalled ribosomes14. However, excessive collisions transform collided ribosomes into signaling platforms, initiating global stress responses15–17.
UV radiation induces DNA damage and activates DNA damage response (DDR) pathways18,19. These DNA lesions induce replication fork stalling and activate ATR20–22. Signaling by ATR and its effector kinase, CHEK1, helps resolve replication stress and maintain genomic integrity. These signaling pathways also arrest the cell cycle, allowing time for repair20. The severity of DNA damage and the cell’s repair capacity determine whether it survives or undergoes p53-mediated apoptosis23,24. UV also induces transcriptome-wide RNA damage through photochemical reactions generating pyrimidine dimers and other photoproducts12. UV damage results in decoding defects as ribosomes stall on damaged codons rich in pyrimidines17. Other chemical agents that introduce bulky adducts on mRNA, such as 4NQO and MMS, also lead to ribosome stalling15,25 that activates the ribotoxic stress response (RSR), first defined by Magun and colleagues8,9. However, the relative contributions of the DDR and the RSR to determining cell fate after nucleic acid damage are not well understood.
Early studies demonstrated that ribotoxic stress activates the p38 and JNK mitogen-activated protein kinases (MAPKs)8,9. Subsequent studies identified ZAKα (referred to as ZAK throughout) as the upstream MAPK kinase kinase (MAP3K) responding to ribotoxic stress26–28. UV-induced translational dysfunction was also linked to GCN2 and ISR (integrated stress response) activation29. We recently showed that ribosomal collisions directly activate the ZAK and GCN2 kinases17. ZAK associates with elongating ribosomes and is activated upon collision17, subsequently activating p38 and JNK to trigger cell cycle arrest and apoptosis, respectively15–17 (Figure 1A). Collisions also activate GCN2, leading to eIF2α phosphorylation and global protein synthesis suppression through the ISR17,30 (Figure 1A).
Figure 1: Immediate-early response to UV radiation is dominated by ribosome-mediated signaling.

(A) Schematic of ZAK and GCN2 activation in response to ribosome collisions. (B) Immunoblots of HaCaT cells pretreated (30 min) with DMSO, ZAK inhibitor (ZAKi, Nilotinib, 1 μM) or GCN2 inhibitor (GCN2i, A-92, 2 μM) followed by treatment with DMSO (UT, 15 min), low-dose anisomycin (ANS, 0.38 μM, 15 min) or UV-C (500 J/m2, 15 min recovery). * = non-specific. (n=3). (C) MCF10a cells expressing CDK2 biosensor83,84 were treated with UV-C and live imaged for 12 h. Proportion of S/G2 cells undergoing mitosis, cell cycle arrest, or cell death was quantified. (D) Sucrose gradients of RNase A-digested lysates of untreated (UT) or UV-C (500 J/m2) treated HaCaT cells; (right) closer view of RNase-resistant disomes and trisomes. (E) Immunoblots of UT or UV-C treated (500 J/m2) HaCaT cells harvested at indicated time points post-UV-C. (F-I) Volcano plots display difference in phosphorylated peptide abundance between cells retrieved at 1, 5, 15, and 30 min post-UV-C (500 J/m2) and untreated (UT) sample (see Figure S1F). ZAK, GCN2, p38, and JNK (and their known effectors) are colored according to panel (A). Statistically up- or down-regulated phosphopeptides determined by two-sided Welch’s t-test (adjusted to 1% FDR for multiple comparisons). Dotted lines delineate r1.5-fold change (x-axis) and 0.05 p-value (y-axis). (see Figures S1–S4, Table S1 and HTML plots in Supp. Item).
While these studies revealed that collided ribosomes activate the RSR and ISR pathways, they failed to clarify how cells coordinate a measured response to collisions by integrating outputs from the ZAK and GCN2 pathways to determine cell fate. An attractive model is that the abundance and duration of collisions functions as a molecular rheostat, regulating the balance between cell survival (through ISR and p38-mediated cell cycle arrest) and death (through JNK-mediated apoptosis). A corollary is that regulatory mechanisms should temper ZAK’s hyper-responsiveness to incidental collisions, ensuring signal cessation.
Here, we reveal that UV radiation elicits an immediate-early response, primarily driven by ZAK signaling, that reconfigures the global phosphoproteome post-UV stress. By comparing the relative contributions of ZAK and key components of the DDR pathway, we discover that ZAK (and the RSR) is the primary driver of early apoptosis and cell cycle arrest in response to UV. We identify two critical negative-feedback processes regulating the RSR: (1) GCN2 activation limits ZAK activity by reducing collisions on damaged mRNAs and (2) ZAK activity triggers autophosphorylation of a conserved phosphodegron, leading to its degradation and signal termination. Together, these mechanisms fine-tune ZAK signaling for a controlled cellular response.
Results
Immediate-early response to UV radiation is dominated by ribosome-mediated signaling
We initially assessed the ability of UV radiation to induce ribosome collisions compared to classical agonists such as the elongation inhibitor anisomycin (ANS). Unlike elongation inhibitors, which induce persistent stress, treatment with UV allowed us to monitor the temporal dynamics of signaling responses as cells recovered from transient ribotoxic stress. Consistent with previous studies15,17, HaCaT cells (a non-tumorigenic human keratinocyte line27,31) treated with ANS or UV-C showed an increase in ribosomal protein eS10 ubiquitylation, characteristic of ribosomal collisions32,33 (Figure 1B). Both ANS and UV activated ZAK as evidenced by phosphorylation of the latter (Figures 1B and S1A–S1D, STAR methods). There was also an increase in p38 and JNK phosphorylation, and all three signatures were blocked by pretreatment of cells with a ZAK inhibitor (ZAKi) but not a GCN2 inhibitor (GCN2i) (Figure 1B). ANS and UV treatment also activated GCN2, as seen by an increase in eIF2α phosphorylation, and this was blocked by GCN2i but not ZAKi (Figure 1B).
To investigate how cells mount a graded respond to UV, we quantified the proportion of MCF10a cells undergoing cell cycle arrest versus apoptosis at different UV-C fluences. At lower fluences, a larger proportion of cells arrested in G2 (p < 0.0001) with minimal cell death, while higher UV fluences resulted in a significant increase in apoptosis (p < 0.0001) (Figure 1C). Thus, cells mount a graded response to UV. While the DDR is known to induce G2 arrest19, ribosomal collisions also trigger G2 arrest via ZAK signaling15. Time-resolved assays showed immediate G2 arrest in wild-type cells post-UV treatment, while inhibition of ZAK delayed cell cycle arrest (Figure S1E), suggesting the involvement of the RSR in early cell cycle arrest.
To visualize the dynamics of ribosomal collisions in cells responding to UV-C, we treated cell lysates with ribonuclease A at various time points during recovery and resolved ribosomes on sucrose gradients. In untreated cells, polysomes collapsed into 80S monosomes34 (Figure 1D). Within one minute of UV-treatment, we observed a striking increase in nuclease-resistant disomes and trisomes (Figure 1D, right panel) and a corresponding decrease in 80S monosomes (Figure 1D, left panel). The fraction of disomes and trisomes peaked between 5 and 15 minutes, then began to decrease within 30 minutes and returned to baseline by three hours (Figure 1D). Thus, ribosome collisions accumulate within minutes of UV exposure and are cleared within hours.
We performed a time-course analysis to compare the activation kinetics of the RSR, ISR, and DDR signaling pathways. Consistent with the collision analysis (Figure 1D) and eS10-Ub (Figure 1E), ZAK was partially phosphorylated within minutes of UV treatment and fully phosphorylated within 15 minutes, together with rapid activation of p38 and JNK (Figure 1E). Modest eIF2α phosphorylation emerged early and increased monotonically (Figure 1E). DDR effectors, including CHEK135 and H2AX36, displayed slower phosphorylation kinetics. PARP cleavage peaked at late time points, indicative of apoptosis37 (Figure 1E). Together, these data reveal a robust immediate-early response to UV radiation driven by ribosome-mediated signaling.
We next performed time-resolved phospho- and total proteomics to create a chronological atlas of global phosphorylation events in HaCaT cells responding to UV damage (Figures 1F–1I and S1F–S1K; Table S1). We quantified 50,420 unique phosphorylation sites from samples collected 1, 5, 15, and 30 minutes post-UV-C treatment and observed that the complexity of the cellular phosphoproteome evolved dramatically in response to UV (Figures 1F–1I; Table S1). One minute after UV treatment, we observed significant up- and downregulation of 399 and 56 phosphosites, respectively (Figure 1F). Phosphosites on ZAK (MAP3K20), GCN2 (EIF2AK4), and p38 (MAPK13 and MAPK14) were notably enriched along with p38 effectors such as TTP (ZFP36), MSK2 (RPS6KA4), and GIGYF1/2 proteins3,38 (Figure 1F). In contrast, we only observed a significant increase in phosphorylation on JNK (MAPK9 and MAPK10) and its effectors (JUN and JUND39) at later times (Figures 1G–1I). Phosphosites on DDR effectors (CHEK1, CHEK2, XPC, and MDC1)35,40,41 emerged more strongly at later times, consistent with our immunoblot analysis (Figures 1F–1I; Table S1).
These data represent a comprehensive resource revealing significant reorganization of the phosphoproteome in response to UV; at 5, 15, and 30 minutes post-UV, approximately 12, 21, and 26 % of the phosphoproteome was differentially regulated compared to untreated cells (Figures 1G–1I). We classified differentially regulated phosphosites into functional categories, tracing their evolution at early (5 min) and late (30 min) time points (Figure S2; Table S1).
To track phosphorylation dynamics, we used k-means clustering of phosphosites, revealing fourteen distinct temporal trajectories (Figures S3A, S3B, and S3C; Table S1). For instance, phosphosites on ZAK grouped into clusters whose intensities peaked within 15 minutes (cluster 10) or 30 minutes (clusters 2 and 3) (Figure S3A; Table S1). These clusters were also enriched for activating phosphosites on p38, JNK, and various RSR effectors. In contrast, phosphosites associated with the DDR (ATM, CHEK1, CHEK2, SMC1A, XPC) were grouped in cluster 14 whose trajectories displayed slower kinetics (still rising after 30 minutes) (Figure S3A, compare clusters 10 and 14; Table S1).
We used a catalog of kinase motifs to assign phosphosites to their most probable kinase42 (Figure S4A). By comparing the percentage of phosphosites for which each kinase was predicted among the significantly up- or down-regulated sites (frequency factor), we determined temporal kinase activity patterns in response to UV (Figures S4A–S4E; Table S1). The MAPK-activated protein kinase (MAPKAPK) family of p38 effector kinases (MAPKAPK2, MAPKAPK3 and MAPKAPK5)43 showed strong activation at the earliest times (1 and 5 min), indicating rapid activation of the p38-mediated cell cycle arrest pathway (Figures S4B and S4C; Table S1). By 15 minutes, coinciding with peak collision abundance (Figure 1D), JNK kinases (JNK1, JNK2, JNK3) displayed increased activity (Figure S4D; Table S1). Consistent with our clustering analysis (Figure S3A), we noted modest activity of the DDR kinases ATR and ATM at the earliest times although their activities became prominent later (Figure S4E; Table S1).
Using kinase translocation reporters (KTRs) that convert p38- and JNK-mediated phosphorylation into a quantifiable nucleocytoplasmic shuttling event44,45, we directly measured the activation kinetics of p38 and JNK following UV treatment across single cells (Figure S4F). Rapid live-cell imaging revealed that p38 reached half-maximal activation 3–8 minutes before JNK in response to two UV doses (Figures S4G and S4H). Inhibiting p38 pharmacologically led to faster JNK activation, suggesting that p38 negatively regulates JNK in early stages of the RSR (Figures S4G and S4H). These data reveal sequential activation of p38, JNK, and DDR kinases in UV-stressed cells and highlight the dominance of ribosome-mediated signaling in the earliest UV response.
ZAK and GCN2 define the immediate-early phosphoproteome of cells responding to UV stress
We investigated the contributions of ZAK and GCN2 to phosphoproteome remodeling post-UV treatment. We performed phospho- and total proteomics in ZAK knockout (ΔZAK) and WT MCF10a cells left untreated (UT) or treated with UV-C and harvested 15 min post-UV (Figures 2A, S5A, and S5B; Table S2). We also compared ΔZAK lines to WT cells pretreated with ZAK inhibitor (Nilotinib) (Figures 2B, S5A, and S6A; Table S2). Our analysis identified 2,487 (10.5% of all quantified sites) and 2,374 (10.1%) ZAK-dependent phosphorylation events in the ΔZAK and ZAKi data sets, respectively (Figures 2A–2B, blue dots; Figure S5C; Table S2). These phosphosites exhibited a strong correlation (Figures S5D and S5E). Similar experiments in HaCaT cells using two ZAK inhibitors46, Nilotinib and Vemurafenib, revealed remarkable congruity with ZAK-dependent sites captured in MCF10a ΔZAK and ZAKi cells (Figures S6A–S6B, S6G–S6H, and S7A; Table S3).
Figure 2: ZAK and GCN2 activities define the immediate-early phosphoproteome of cells responding to UV-mediated ribotoxic stress.
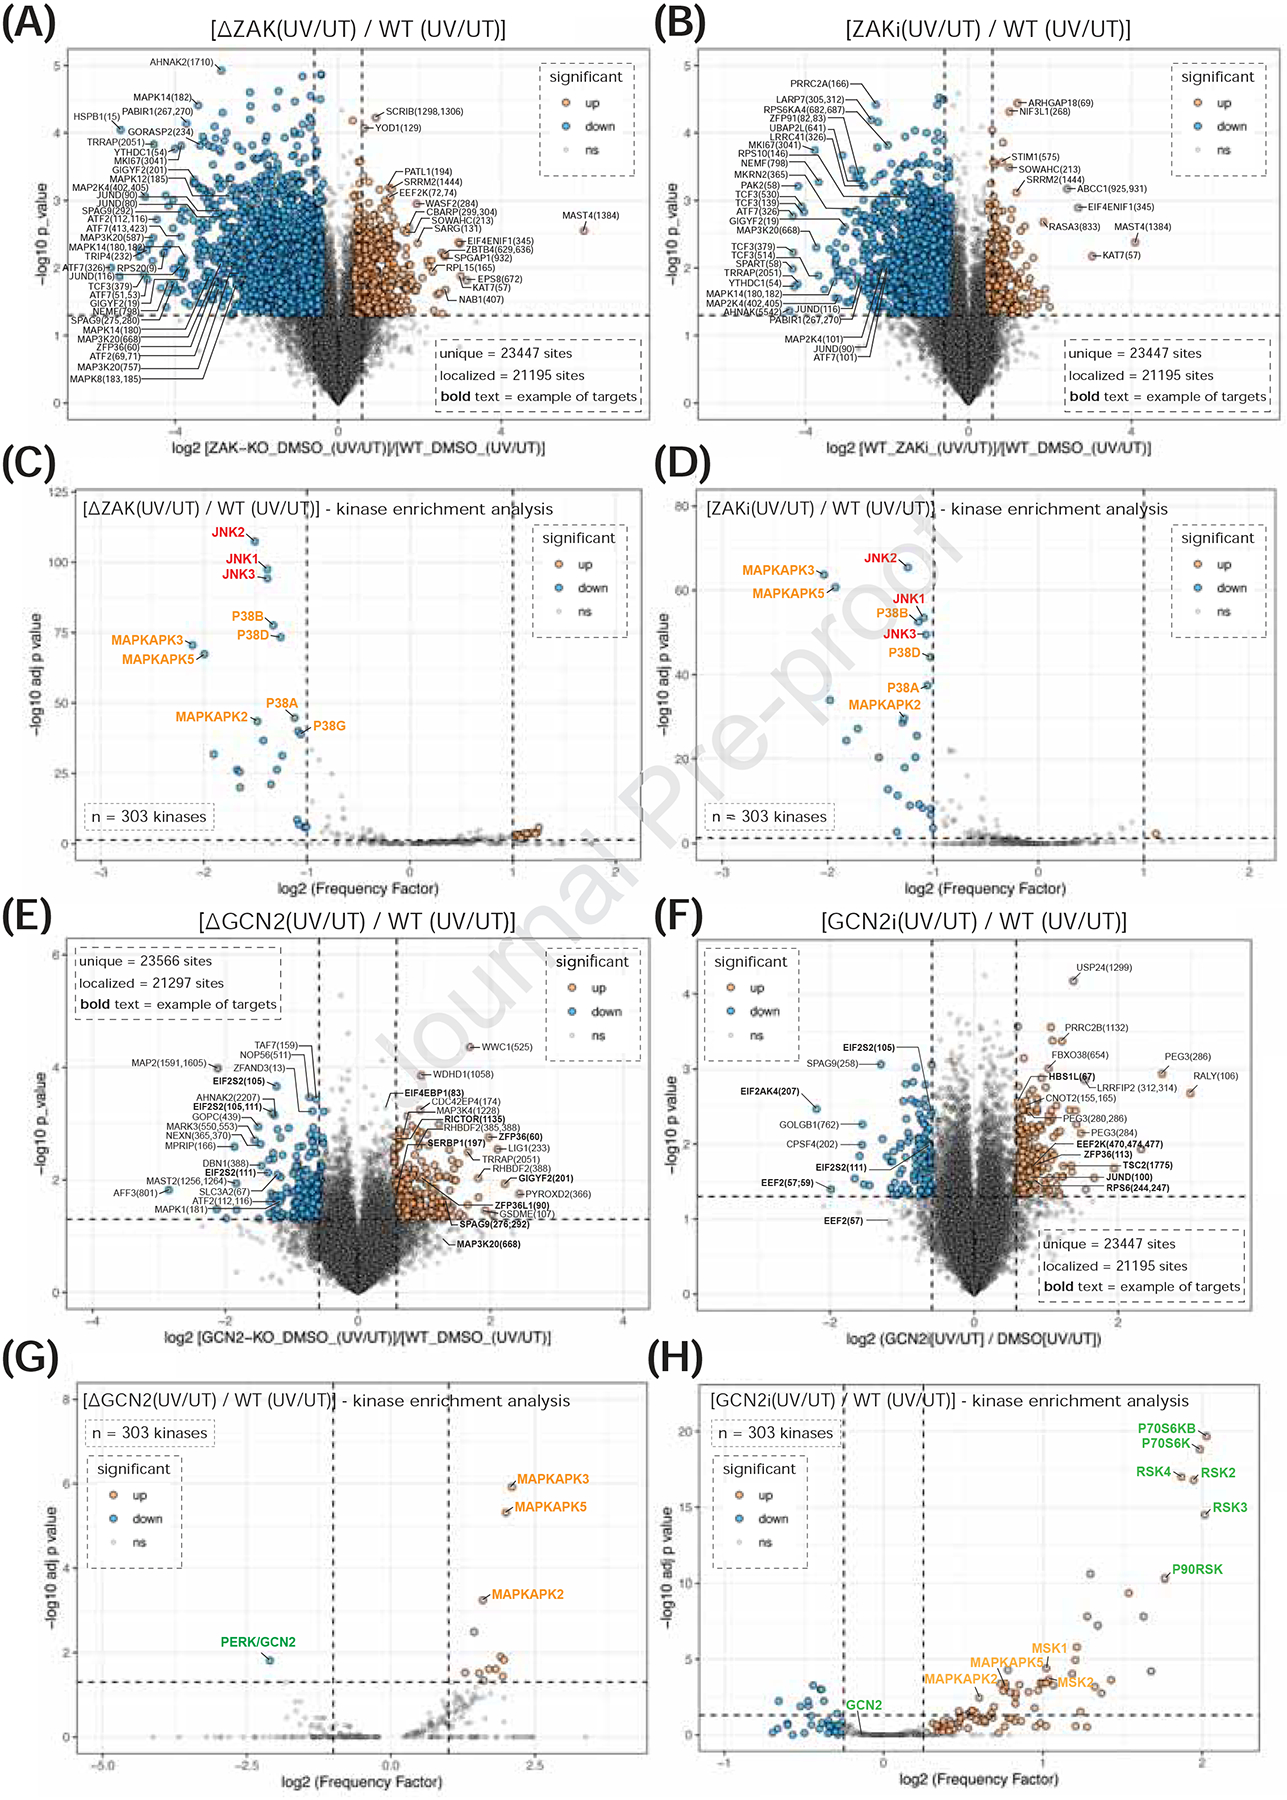
(A-B) Volcano plots display differences in phosphosite abundance in response to UV-C (500 J/m2) between MCF10a ΔZAK and WT cells (panel A), or MCF10a cells pretreated (30 min) with ZAKi (Nilotinib, 1 μM) compared to WT (mock-treated) (panel B). Up- or down-regulated phosphopeptides determined by two-sided Welch’s t-test (adjusted to 1% FDR for multiple comparisons). Dotted lines delineate r1.5-fold change (x-axis) and 0.05 p-value (y-axis). (see Figure S5, Table S2, and HTML plots in Supp. Item). (C-D) Motif enrichment analysis of phosphoproteomic data in panels A-B. Kinases whose activities are up- or down-regulated upon UV-C treatment in MCF10a ΔZAK (C) or ZAKi (D) compared to WT cells represented in volcano plots. Statistical significance determined using one-sided exact Fisher’s test and p-values adjusted for multiple hypotheses using Benjamini-Hochberg method. (see Table S2). (E-F) As in (A-B) but for MCF10a ΔGCN2 compared to WT (panel E) (see Figure S9A and Table S2), or between HaCaT cells pretreated (30 min) with GCN2i (A-92, 2 μM) compared to WT (panel F), (see Figure S6G and Table S3). Statistical tests as panel A-B. (see Figures S9 and S6G, Tables S2–S3, and Supp. Item). (G-H) As in (C-D) but for MCF10a ΔGCN2 compared to WT (panel G) or HaCaT GCN2i compared to WT (panel H) (see Figures S9 and S6G, Tables S2–S3).
Among phosphosites showing strong ZAK dependence, we identified sites on ZAK itself, its downstream substrates (e.g., MAP2K4), activating phosphosites on p38 and JNK (MAPK8, MAPK12, MAPK14), and various downstream effectors (e.g., ATF2, ATF7, ZFP36, RPS6KA4, JUN, JUND). (Figures 2A, 2B, and S7A; Tables S2 and S3). Changes in phosphosites on other factors (e.g., PABIR1, GORASP2, SPAG9) suggest additional regulation by ZAK or its downstream effectors. ZAK-dependent phosphosites on ribosome-associated QC factors (e.g. TRIP4, GIGYF2, NEMF, MKRN2) and on 40S r-proteins decorating the disome interface (uS10 and eS10)47,48 suggest regulation of some QC factors by ZAK (Figures 2A, 2B, and S7A; Tables S2 and S3). Kinase-enrichment analysis revealed significant downregulation of p38, MAPKAPK, and JNK kinase activities in ΔZAK and ZAKi cells post-UV (Figures 2C, 2D, and S7B; Tables S2 and S3). Thus, ZAK-mediated signaling drives the majority of immediate-early RSR downstream of UV.
We then used p38 (SB 203580) and JNK (JNKi VIII) inhibitors (Figures S6D and S6E) and performed phospho- and total proteomics in HaCaT cells treated with UV-C and harvested 15 min post-UV (Figures S6G, S7C, and S7E; Table S3). We observed strong overlap between statistically-significant sites dependent on ZAKi and p38i, and between ZAKi and JNKi, respectively (Figure S6H). Kinase-enrichment analysis confirmed the sensitivity of phosphosites to p38 and JNK inhibition (Figures S7D and S7F; Table S3).
We identified 709 p38-dependent phosphosites (Figure S7C; Table S3), with those regulated by ZAK being sensitive to both ZAK and p38 inhibition (Figure S8A). ZAK- and p38-dependent phosphosites were identified on ribosome-associated QC factors, including GIGYF2, HBS1L, and ZFP36 (TTP) (Figures S8A). p38-dependent phosphorylation of ZFP363 may contribute to the expression of inflammatory and stress-responsive mRNAs during RSR (Figure S8C). We identified 253 JNK-dependent phosphosites (Figure S7E; Table S3). Inhibition of JNK led to increased phosphorylation of ZAK and the p38 target GIGYF2, indicative of negative-feedback regulation (Figure S7E). Using cross-correlation analysis, we identified JNK-dependent sites regulated by ZAK (Figure S8B); known JNK targets, JUN, JUND, and ATF2, emerged as positive controls. Other significant targets regulated by ZAK through JNK included GORASP238, SPAG9, FAM122A (PABIR1)49, and ubiquitin E3 ligases UBE4B and TRIM28 (Figures S8B and S8C).
The p38 and JNK inhibitor datasets allowed us to identify direct substrates of ZAK. By comparing the effects of Nilotinib (ZAKi-Nil) to p38i and JNKi (Figure S8D), we identified phosphosites sensitive to ZAKi (along y=x), but not p38i or JNKi, which likely represent direct substrates of ZAK or its MAP2 kinases (MAP2Ks). Notably, autophosphorylation sites on ZAK (268, 587, 636, 637, 668) were observed (discussed later). Phosphosites on the p38 (MAPK12) and JNK (MAPK10) activation loops were easily identified as MAP2K substrates (Figure S8D). Several proteins, including G3BP1, SSH2, CLIP4, and AHNAK2, may be directly phosphorylated by ZAK in response to ribotoxic stress (Figure S8D). Overall, these inhibitor datasets provide valuable insights into each kinase’s impact on the phosphoproteome during ribotoxic stress.
Next, we identified GCN2 substrates upon UV treatment using phospho- and total proteomics in GCN2 knockout (ΔGCN2) and WT MCF10a cells (Figures 2E. S9A, S9B; Table S2). We also compared ΔGCN2 lines to WT MCF10a and HaCaT cells pretreated with the GCN2 inhibitor A-92 (Figures 2F, S6C, S6G, S9A, S9E and S9H; Tables S2 and S3). We identified 221 UV-responsive phosphosites that were significantly down-regulated in ΔGCN2 cells (Figures 2E and S9C; Table S2). Kinase-enrichment analysis confirmed that phosphosites sensitive to GCN2 inhibition were bona fide substrates of eIF2α kinases (Figures 2G, and S9F; Table S2), including known sites on EIF2S250 (Figures 2E and S9E). These data were validated with immunoblots (Figure S9D). Several downstream targets of p38 (e.g., GIGYF2 and ZFP36) were hyper-phosphorylated in ΔGCN2 cells (Figure 2E), and kinase-enrichment confirmed hyperactivation of p38 effector kinases (MAPKAPK2/3/5) in ΔGCN2 cells post-UV (Figure 2G; Table S2). These data from MCF10a cells were consistent with data from HaCaT cells pretreated with GCN2i (Figures 2F and 2H; Table S3).
We noted increased phosphorylation of well-characterized mTOR substrates (RPS6, p70 RPS6 kinases, EIF4EBP1, eukaryotic elongation factor 2 (EEF2)-kinase, and LARP151) in ΔGCN2 and GCN2i cells responding to UV (Figures 2E, 2F, S9E and S9G; Tables S2–S3). Kinase enrichment analysis confirmed a robust increase in the activity of p70 S6Ks in GCN2i HaCaT cells in response to ribotoxic stress (Figure 2H; Table S3).
Lastly, we asked if the RSR and DDR share phosphosite targets in cells responding to UV. Phosphosites specific to DDR were identified using an ATR inhibitor (Figure S6F, VE-82152) and phosphoproteomics (Figure S7G, Table S3). These data revealed known targets of ATR (CHEK1 and TOPBP1)20 and patterns reminiscent of the DDR (Figures S7G and S7H). Crucially, we found no meaningful correlation between phosphosites targeted by ZAK or ATR, suggesting that the ZAK-mediated RSR and ATR-mediated DDR pathways operate independently in UV-responsive cells (Figure S8E).
Cell death in response to UV is mediated through ZAK and not the DDR pathway.
The lack of cross-talk between ATR-mediated DDR and ZAK-mediated RSR implies minimal impact on each other’s functionality. In biochemical and immunofluorescence assays, ZAK inhibition blocked p38 and JNK phosphorylation without affecting CHEK1 phosphorylation in response to UV, while ATR inhibition blocked CHEK1 phosphorylation without affecting p38 and JNK phosphorylation (Figures 3A and 3B). UV exposure uniformly induced cyclobutene pyrimidine dimer (CPD) formation in all cells (Figure S10A). Interestingly, while the majority of cells activate the RSR, as evidenced by JNK phosphorylation (Figure 3B and Figure S10B), DDR activation was confined to cells in S phase, characterized by coincident PCNA foci53,54 and CHEK1 phosphorylation (Figure S10B). These data suggest that mRNA damage serves as an early and ubiquitous indicator of UV-induced cellular damage. Consistent with our previous observations (Figure 1E), H2AX and p53 phosphorylation, and p53 stabilization occurred later and were unaffected by ZAK or ATR inhibition (Figures 3A and 3B).
Figure 3: Cell death in response to UV is mediated through ZAK and not the DDR pathway.
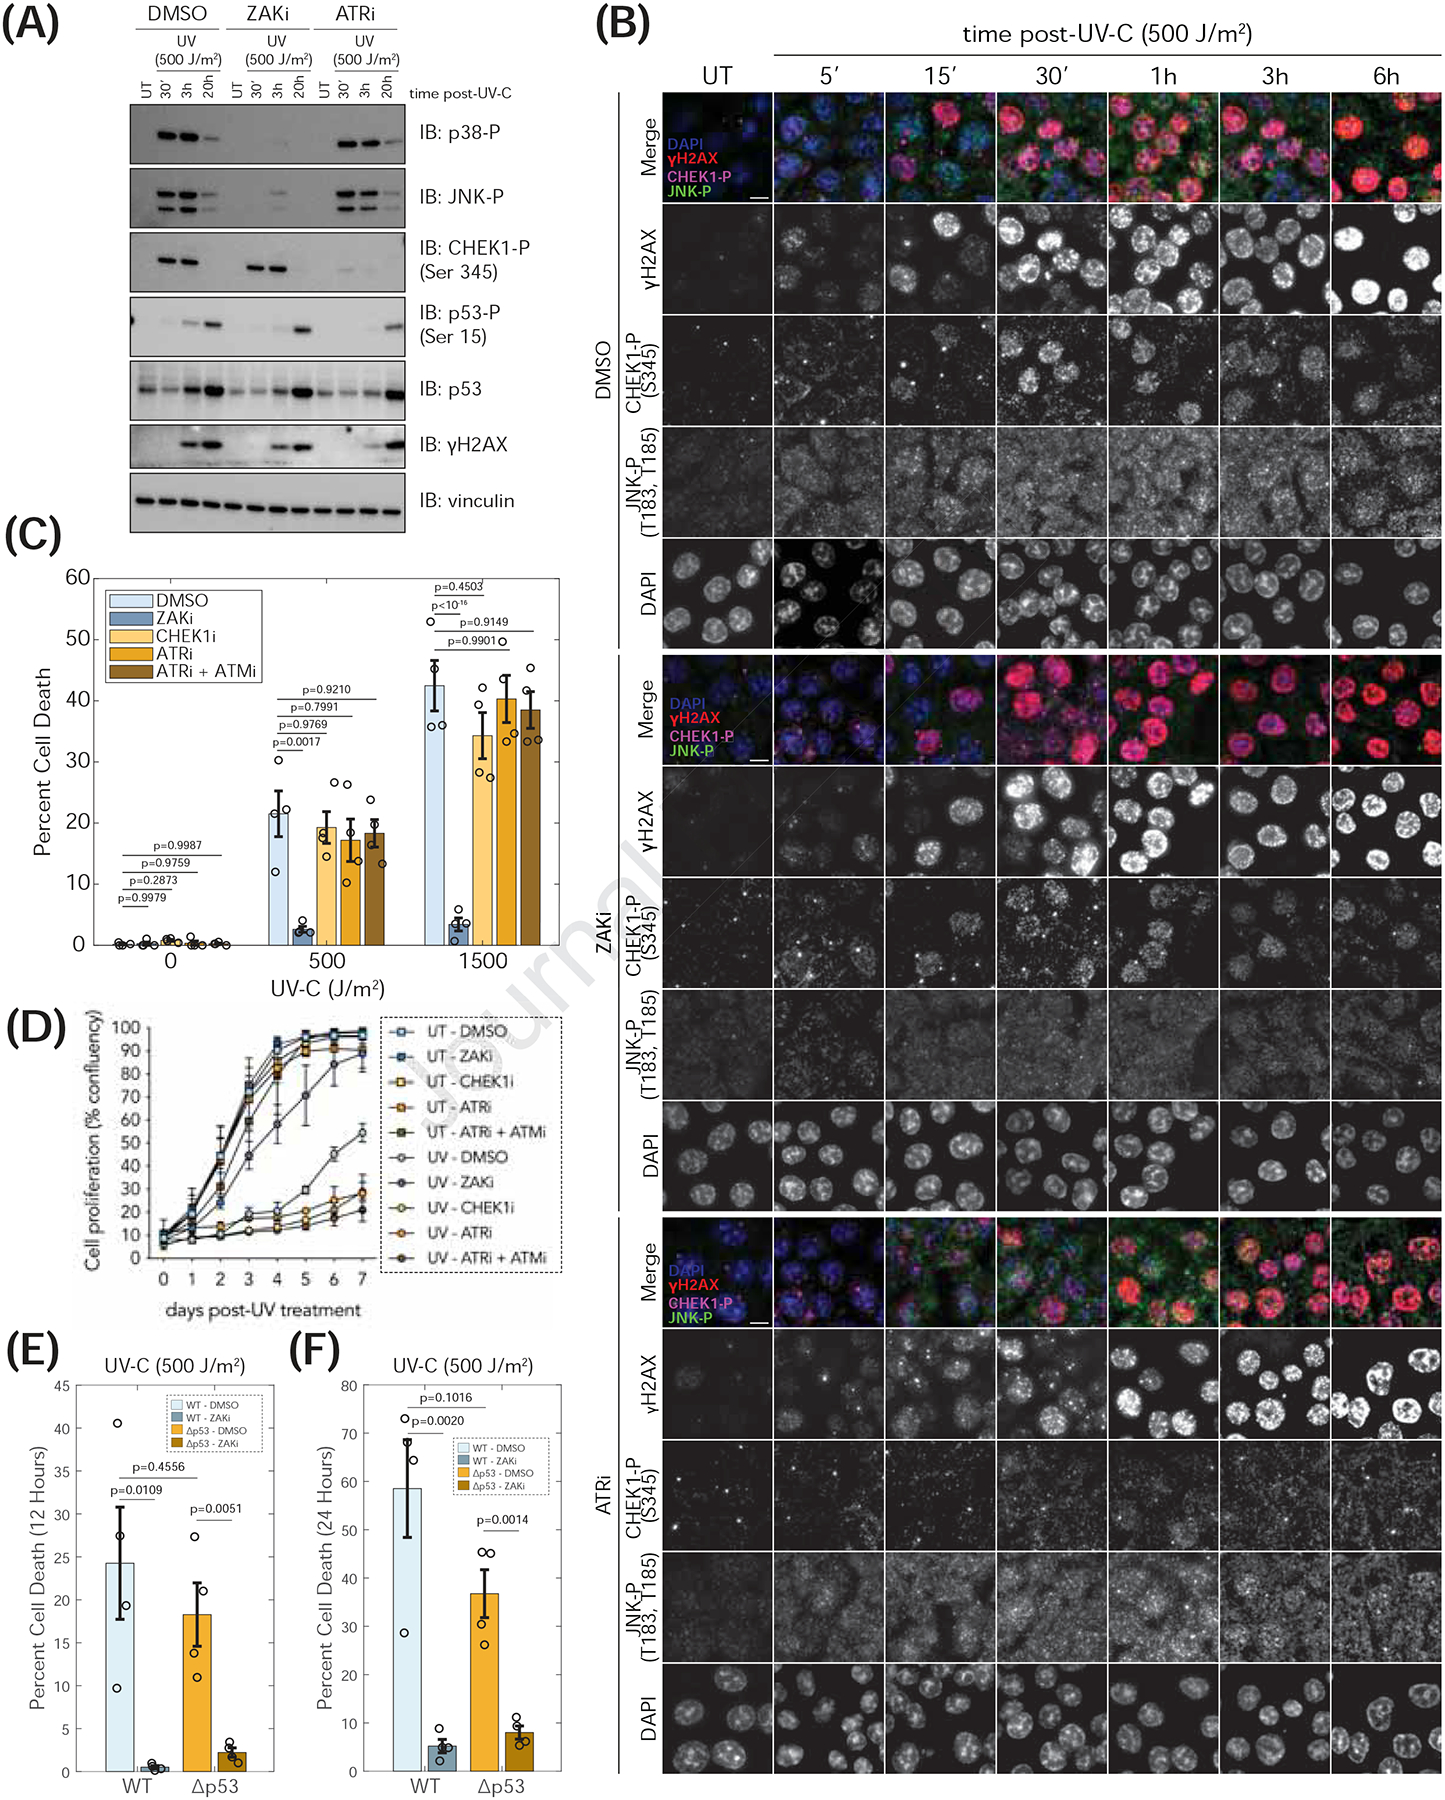
(A) Immunoblots of MCF10a WT cells pretreated (1 h) with DMSO, ZAKi (Nilotinib, 1 μM) or ATRi (VE-821, 2.5 μM) left untreated (UT) or treated with UV-C and harvested at indicated time. (B) Fixed immunofluorescence images of untreated (UT) or UV-C treated MCF10a WT cells harvested at indicated time. Cells were pre-incubated (1 h) as in panel A prior to UV-C treatment. Scale bar = 10 μm. (C) MCF10a WT cells pre-treated (1 h) with DMSO, ZAKi (PLX4720, 5 μM), CHEK1i (LY2603618, 2.5 μM), ATRi (VE-821, 2.5 μM), or a combination of ATRi and ATMi (VE-821, 2.5 μM; KU-55933, 10 μM) left untreated or treated with UV-C. Cell death measured with a fluorescent Caspase 3/7 dye. One-way ANOVA with Tukey-Kramer post-hoc test. (D) Proliferation curves of UT or UV-C treated (1000 J/m2) MCF10a cells grown in the presence of indicated inhibitors; DMSO, ZAKi (Nilotinib, 1 μM), CHEK1i (LY2603618, 1 μM), ATRi (VE-821, 1 μM), or a combination of ATRi and ATMi (VE-821, 1 μM; KU-55933, 1 μM). (E-F) MCF10a WT and Δp53 cells were pretreated (1 h) with DMSO or ZAKi (PLX4720, 5 μM) followed by UV-C treatment. Cumulative cell death measured with fluorescent Caspase 3/7 dye up to 12 h (E) or 24 h (F). Two-sided T-test. (see Figure S10).
We next assessed the contributions of the RSR and DDR to cell fate following UV exposure. We used live-cell imaging to measure cumulative cell death for 12 hours after UV in MCF10a cells pretreated with ZAK or DDR inhibitors (Figure 3C). Untreated cells showed minimal cell death, but UV treatment led to significant apoptosis (Figure 3C). Pre-treatment with a ZAK inhibitor fully reversed apoptosis, while inhibitors targeting CHEK1, ATR, or a combination of ATR and ATM did not (Figure 3C). These data indicate that ZAK drives early apoptosis in response to UV through the RSR.
We also noted a ~10-fold reduction in the proportion of cells progressing into mitosis shortly after UV exposure, consistent with cell cycle arrest at the G2/M checkpoint (Figure S10C). ATR inhibition had negligible impact, while ZAK inhibition substantially rescued mitotic entry post-UV (Figure S10C). Consistent with previous observations17, these data underscore ZAK’s critical role in early G2/M checkpoint activation following UV exposure.
In long-term proliferation assays, ATR inhibition slightly reduced cell growth in untreated cells, reflecting its critical role in cell viability55,56 (Figure 3D). Following UV treatment, cell growth was impaired (Figure 3D). Inhibiting ATR, CHEK1, or both ATR and ATM increased UV sensitivity, while ZAK inhibition conferred resistance to UV-induced growth inhibition (Figure 3D). These data are strikingly consistent with our direct measurements of apoptosis (Figure 3C).
In addition to regulating cell cycle arrest and DNA repair, p53 is implicated in inducing apoptosis in response to genotoxic stress23,24. We compared the contributions of ZAK and p53 in moderating apoptosis at early (<12 h) and late (<24 h) times after UV treatment (Figures 3E, 3F, S10D, and S10E). Apoptosis was almost entirely blocked in wild-type cells pre-treated with a ZAK inhibitor (ZAKi) and in ΔZAK cells, while apoptosis was only modestly decreased in cells lacking p53 (Δp53) (Figures 3E, 3F, S10D, and S10E). Notably, apoptosis was almost completely blocked by pre-treatment of Δp53 cells with ZAK inhibitor (Figures 3E and 3F). These results suggest that ZAK primarily determines the early response to UV damage in cells.
GCN2 prevents ZAK-mediated cell death by limiting ribosome load
Our phosphoproteomic data make two strong predictions about the role of GCN2 during ribotoxic stress: (1) GCN2 blocks translation initiation by phosphorylating eIF2α and inhibiting mTOR activity and (2) in the absence of GCN2, increased translational initiation on damaged mRNAs leads to a buildup of collided ribosomes and hyperactivation of the RSR.
We first explored the connection between GCN2 and mTOR. The abundance of ribosomal proteins (r-proteins) serves as a proxy for mTOR activity based on known regulation of mRNAs bearing 5’ terminal oligopyrimidine motifs57. Mass spectrometry revealed increased abundance of r-proteins in ΔGCN2 cells, indicating elevated mTOR activity (Figures S11A and S11B). Validation through immunoblots confirmed elevated levels of r-proteins (RPS2, RPS10, RPS24) and increased EIF4EBP1 phosphorylation, and total proteomic analysis revealed a decrease in lysosomal protein abundance in ΔGCN2 cells (Figures S11C and S11D). These data indicate that GCN2 negatively regulates mTOR activity even under basal conditions.
We anticipated that loss of GCN2 would increase translational initiation, resulting in more collisions. Indeed, ΔGCN2 cells showed an increase in the fraction of nuclease-resistant disomes, trisomes, and tetrasomes accompanied by a decrease in monosomes after UV-C treatment (Figure 4A); similar results were observed in HaCaT cells pretreated with GCN2i (Figure S11E). We also observed increased eS10 ubiquitylation in ΔGCN2 cells following UV treatment (Figures S11F, S11G, and S11H). These results indicate that GCN2 activation limits the accumulation of collided ribosomes on damaged mRNAs.
Figure 4: GCN2 prevents ZAK-mediated cell death by limiting ribosome load.

(A) Sucrose gradients of RNase A-digested lysates of untreated (UT) or UV-C treated MCF10a WT and ΔGCN2 cells, harvested 15 min after UV. (B) Immunoblots of UT or UV-C treated MCF10a WT and ΔGCN2 cells. (C-D) MCF10a WT (panel C) and ΔGCN2 (panel D) cells expressing JNK KTR-mRuby2 and H2B-iRFP treated with UV-C (500 J/m2) and live imaged for 12 h. Representative images shown 5 min before UV, and 30 and 150 min after. Scale bar = 10 μm. (E) MCF10a WT and ΔGCN2 cells were treated as in C-D and JNK activity quantified with JNK KTR. Bold lines and shaded regions represent median and interquartile range, respectively. (F) MCF10a WT and ΔGCN2 cells treated as in C-D but pretreated (1 h) with DMSO, ZAKi (PLX4720, 5 μM), or JNKi (JNKi VIII, 2.5 μM). Cell death measured with fluorescent Caspase 3/7 dye. Two-sided T-test. (see Figure S11).
We next asked whether accumulation of collided ribosomes in the absence of GCN2 hyperactivates the RSR through increased ZAK activity. We treated MCF10a WT and ΔGCN2 cells with UV-C and monitored the activation kinetics of RSR components. In ΔGCN2 cells, eS10 ubiquitylation remained elevated throughout, indicating persistent buildup of collided ribosomes (Figure 4B). Importantly, while JNK phosphorylation exhibited oscillatory dynamics, we observed consistently higher JNK phosphorylation in ΔGCN2 cells at early and late time points; in contrast p38 activation exhibited a milder increase, possibly due to negative feedback mechanisms58–60 (Figure 4B).
To better follow JNK dynamics, we performed live single-cell imaging with the JNK KTR in WT and ΔGCN2 cells responding to ribotoxic stress. In untreated cells, the JNK KTR remained nuclear, indicating low basal activity (Figures 4C, 4D, and S11I). Following UV-C treatment, the JNK KTR translocated to the cytoplasm, indicating increased activity (Figures 4C and 4D). JNK activity peaked at 20 minutes, declined at 1 hour, then maintained an intermediate, pulsatile state for several hours (Figure 4E). While both cell types exhibited similar JNK dynamics, ΔGCN2 cells showed higher overall JNK activity (Figures 4E and S11J) consistent with increased JNK phosphorylation observed by immunoblotting (Figure 4B). The initial peak of JNK activity was ~50% greater in ΔGCN2 cells, while the later steady-state activity was ~30% greater (Figure 4E). Thus, loss of GCN2 leads to sustained hyperactivation of JNK signaling post-UV treatment. In contrast, we observed a minimal increase in p38 activity in ΔGCN2 cells (Figure S11M).
We hypothesized that increased JNK activity in ΔGCN2 cells would lead to elevated apoptosis. We performed live-cell imaging and measured cell death for 12 hours post-UV treatment in WT and ΔGCN2 cells. We observed little to no cell death in untreated cells (Figure S11K) and a modest increase in the percentage of WT cells undergoing apoptosis following UV treatment, which was reversed by pretreatment with ZAKi or JNKi (Figures 4F and S11L). In contrast, ΔGCN2 cells exhibited significantly higher levels of apoptosis post-UV, also reversed by ZAKi or JNKi (Figures 4F and S11L). These results support a model wherein GCN2 activation limits accumulation of collided ribosomes on damaged mRNAs and restricts apoptosis by attenuating ZAK-mediated JNK signaling.
ZAK autophosphorylation regulates ribosome dissociation and subsequent degradation
Having established how collisions activate the RSR, we focused on pathway attenuation, considering previous experiments showing degradation of ZAK following activation (Figures 1E and 4B). ZAK is a multidomain MAP3K with an N-terminal kinase domain, a leucine-zipper domain, a sterile alpha motif (SAM) domain, and a C-terminal intrinsically disordered ribosome binding region (RBR)16,17 (Figure 5A). While initial activation of ZAK likely involves autophosphorylation of activation loop residues Thr-161 and Ser-16546, we quantified up to thirty-four additional phosphorylation sites on ZAK that vary in amplitude and dynamics over time (Figures 5A, 5B and S8D; Table S1). Clustering analysis based on phosphorylation kinetics categorized individual sites into three distinct clusters: (1) cluster 1 (red, n=15), containing sites whose phosphorylation status is invariant over time; (2) cluster 2 (green, n=10), featuring sites close to ZAK’s RBR that peak 15 minutes post-UV, and (3) cluster 3 (blue, n=6), with sites that peak at ~30 minutes (Figures 5A and 5C; Table S1). Within cluster 2 (residues 557, 568, 584, 587, 660, 661, 664, 666, 668, 685), a conserved densely phosphorylated region (between 656–668) near ZAK’s ribosome sensing region matched a reported phosphodegron recognition motif (656DSGFSS661) of β-TrCP16 (Figures 5A, 5C and 5D; Table S1). β-TrCP2 (FBXW11) and its paralog β-TrCP1 (FBXW1A) are substrate adaptors for the CUL1-RBX1-SKP1 (CRL1) ubiquitin ligase complex that catalyzes proteasomal degradation of substrates phosphorylated at such motifs61.
Figure 5: ZAK autophosphorylation regulates ribosome dissociation and subsequent degradation.

(A) Domain organization of ZAKα; LZ, leucine zipper; SAM, sterile alpha-motif; CTD, C-terminal domain; RBR, ribosome-binding region; orange, phosphodegron motif (656DSGFSS661); purple, intrinsically disordered regions (IDR). Colored dots represent change in abundance (height) of phosphosites 15 min after UV-C (500 J/m2) compared to UT; phosphosites colored based on clustering (panel C). (B) Hierarchical clustering of phosphosites on ZAK. Columns: log2-fold-change in abundance of phosphosite at indicated time post-UV-C compared to UT; rows: phosphosites. (C) Three ZAK phosphosite clusters isolated by k-means clustering; number of phosphosites per cluster (n) specified; cluster means, bottom right (see Table S1). (D) Sequence alignment of ZAK showing conservation of β-TrCP phosphodegron motif. Identical residues depicted in white on red background; phosphosites on ZAK depicted. (E) Immunoprecipitation of mNeonGreen-tagged ZAK from MCF10a ΔZAK cells. Volcano plots of change in abundance of proteins isolated from ZAK-IP following low-dose ANS (0.38 μM) compared to mock (n=2). p-values calculated by two-sided Welch’s t-test (adjusted with 1% FDR for multiple comparisons) (see Table S4). (F) Sucrose gradients from MCF10a ΔZAK cells complemented with indicated ZAK variants, UT or UV-C treated (500 J/m2) and recovered for 30 min. Fractions analyzed by immunoblotting for ZAK. (G) Immunoblots from MCF10a ΔZAK cells complemented with indicated ZAK variants, treated with sub-inhibitory dose of ANS (0.38 μM) and harvested as indicated. (H) Quantification of ZAK levels as in (G). Data points, mean ± SD (n=2). (I-K) Immunoblots of MCF10a ΔZAK cells complemented with indicated ZAK variants pretreated (1 h) with DMSO, MLN4924 (2 μM), or bortezomib (0.5 μM), followed by sub-inhibitory dose of ANS (0.38 μM) and harvested as indicated. Data points, mean ± SD (n=3). (see Figure S12).
We immunoprecipitated ZAK from MCF10a ΔZAK cells complemented with mNeonGreen-tagged ZAK and treated with a collision-inducing dose of ANS (0.38 μM) (Figure 5E; Table S4). Interaction between ZAK and β-TrCP2 increased significantly post-ANS treatment (Figure 5E; Table S4); immunoprecipitation of β-TrCP1 or β-TrCP2 also revealed their interaction with ZAK post-UV (Figure S12A). As reported previously16, activated ZAK interacts with 14-3-3 proteins that facilitate kinase dimerization through recognition of phosphoserine motifs (RSxpSxP)62,63 (Figure 5E). One such motif is present in ZAK (590RSQSNP595) where Ser-593 is phosphorylated upon ribotoxic stress (Figure 5B, fold change (15 min post-UV/UT) = 1.65). Also, in the presence of anisomycin, ZAK loses affinity for ribosomal proteins and collision sensors such as GCN1L164, suggesting dissociation from ribosomes upon activation (Figure 5E).
To assess how phosphosites within each cluster affect ZAK’s activity, we generated cluster variants by mutating all serine (or threonine) residues within each individual cluster to alanine, generating polyclonal ZAK (S-A) cluster phosphomutant lines stably expressed in the ΔZAK background. First, we resolved ribosomes from untreated and UV-treated cells across sucrose gradients and probed for ZAK via immunoblotting. In untreated cells, wild-type (WT), kinase-dead (K45M), and the cluster 2 (S-A) phosphomutant co-sedimented with polysomes (Figure 5F). Thirty minutes post-UV treatment, WT ZAK dissociated from polysomes and accumulated at the top of the gradient while both the kinase-dead and the cluster 2 (S-A) mutants remained bound (Figure 5F). Conversely, a cluster 2 phosphomimetic (S-D) ZAK variant was largely dissociated from polysomes even under basal conditions (Figure S12B). These results suggest that phosphorylation of cluster 2 residues near the RBR regulates ZAK’s association with ribosomes.
We next examined the role of cluster 2 phosphosites in ZAK turnover in response to ribotoxic stress. While WT ZAK is rapidly degraded (t1/2 = 3.3 h) in response to low-dose ANS, a kinase-dead mutant (T161A-S165A) is not (Figures 5G and 5H). And, while mutation of phosphosites (S-A) in cluster 1 (t1/2 = 2.5 h) and cluster 3 (t1/2 = 3.6 h) had minimal effect, the cluster 2 (S-A) phosphomutant was entirely resistant to low-dose ANS-mediated degradation (Figures 5G and 5H). Additionally, the “all clusters” (S-A) variant also resisted degradation (Figures 5G and 5H). Similar results were observed with UV-C treatment (Figure S12C).
A pulse-labeling experiment in HaCaT cells showed that ZAK degradation is triggered by collisions rather than protein synthesis inhibition. Cells were pulsed with azidohomoalanine (AHA) for two hours to label newly synthesized proteins. After a one-hour wash-out and recovery, cells were treated with DMSO (mock) or low-dose ANS to induce collisions (Figure S12D). At specific time points, lysates were extracted, the azide group in labeled proteins was functionalized with biotin-alkyne, purified with streptavidin resin, and immunoblotted for ZAK. Degradation of pre-labeled ZAK (t1/2 = 3.4 h) occurred specifically in response to collisions (Figure S12D).
We next tested whether ZAK is degraded by the CRL1 Cullin-RING ligase by pre-treating cells with MLN4924 (which inhibits NEDDylation and prevents activation of CRLs65) or with bortezomib (a proteasome inhibitor) prior to treatment with low-dose ANS. Pre-treatment with MLN4924 or bortezomib prevented ZAK turnover in response to collisions (Figure 5I). As above, the kinase-dead (T161A-S165A) and cluster 2 (S-A) phosphomutant were resistant to ANS-mediated degradation, and MLN4924 and bortezomib did not further stabilize them (Figures 5J and 5K). Live single-cell imaging also showed that mNeonGreen-tagged WT ZAK was degraded in response to low-dose ANS treatment, and its degradation was prevented by MLN4924 or bortezomib (Figure S12E), while kinase-dead ZAK (T161A-S165A) and the cluster 2 (S-A) phosphomutant were resistant to degradation (Figures S12F and S12G). We further showed that ribosome-mediated activation is critical for ZAK degradation since a ZAK mutant (ZAK-ΔSΔCTD) with an intact phosphodegron but lacking the sensing (residues 670–713) and C-terminal (774–800) domains (previously shown to be critical for ribosome binding16) failed to activate JNK and remained stable upon low-dose ANS treatment (Figures S12H, S12I, and S12J). These results support a role for the CRL1 E3 ubiquitin ligase complex in degrading ZAK upon collision-mediated activation.
ZAK degradation restricts apoptosis and induces tolerance under conditions of persistent ribotoxic stress
We hypothesized that programmed ZAK degradation regulates signaling and cell fate. To test this hypothesis, we compared the activities of ZAK (S-A) phosphomutants (clusters 1, 2, 3, and all clusters) to ΔZAK cells or those expressing WT and kinase-dead variants (K45M, T161A-S165A) (Figure 6A). Compared to WT ZAK, mutation of phosphosites in cluster 2 rendered ZAK mildly hyperactive under basal (UT) conditions (Figure 6A, ZAK Phos-tag, compare lane 3 to lanes 7 and 9), accompanied by elevated JNK phosphorylation (Figure 6A). These data suggest that phosphosites within cluster 2 negatively regulate JNK signaling in response to basal collisions. As expected, in UV-treated WT cells, we observed an increase in ZAK, p38, and JNK phosphorylation and no activation of ZAK or its downstream MAPKs with the kinase-dead variants (K45M, T161A-S165A) (Figure 6A). There were no apparent differences in ZAK, p38, or JNK phosphorylation with any of the (S-A) cluster mutants 15 minutes after UV treatment (Figure 6A).
Figure 6: ZAK degradation restricts apoptosis and induces tolerance under conditions of persistent ribotoxic stress.

(A) Immunoblots of MCF10a WT, ΔZAK, and ΔZAK cells complemented with indicated ZAK variants, untreated or UV-C treated (500 J/m2) and harvested 15 minutes post-UV-C. (B-C) MCF10a ΔZAK cells expressing JNK and p38 KTRs complemented with indicated ZAK variants were treated with ANS (0.094 μM) followed by live imaging. Median p38 (panel B) and JNK (panel C) activities shown for each cell line. (D-E) MCF10a ΔZAK cells complemented with WT or cluster 2 (S-A) ZAK variant were pre-treated (19 h) with DMSO (panel D, see Figure S13H) or ANS (0.38 μM, panel E, see Figure S13I). Cells were washed and recovered (1 h) prior to treatment with UV-C followed by live cell imaging. Median JNK activities (bold lines) and interquartile ranges (shaded regions) indicated. (F-G) MCF10a ΔZAK cells complemented with WT or cluster 2 (S-A) ZAK variant were pre-treated (19 h) with DMSO or ANS (0.38 μM). Cells were washed and recovered (1 h) prior to treatment with indicated dose of UV-C and live imaged for 12 h. Cell death measured with fluorescent Caspase 3/7 dye. Two-sided T-test. (H) Proliferation curves of MCF10a ΔZAK cells complemented with WT or cluster 2 (S-A) ZAK variant pre-treated (19 h) with DMSO or ANS (0.38 μM) as above (see Figure S13G). Cells washed and recovered (1 h) prior to UV-C (1000 J/m2). Cell confluency measured post-UV-C once every 24 h for 8 days. (see Figure S13).
We used the p38 and JNK KTRs to obtain better temporal resolution in the same collection of ZAK cell lines under ribotoxic stress. Baseline activity was generally low, except for the all clusters (S-A) mutant, which showed slightly elevated JNK activity (Figures S13A and S13B). While there were minimal differences in p38 activity between WT and the phosphomutant variants post-ANS treatment (Figure 6B), we observed striking differences in JNK activity between WT and cluster 2 (S-A) phosphomutant variants (Figure 6C). WT cells exhibited an initial peak of JNK activity, followed by modest steady-state activation thereafter, whereas cluster 2 (S-A) mutants exhibited sustained JNK hyperactivation for up to 24 hours post-ANS (Figures 6C, S13C, S13D and S13E). These data suggest that ZAK turnover prevents sustained JNK activity.
We hypothesized that sustained JNK hyperactivation due to impaired ZAK turnover would increase apoptosis and indeed observed a modest 1.9-fold increase in apoptosis associated with the cluster 2 (S-A) phosphomutant compared to WT cells (Figure S13F). Long-term proliferation assays following ANS treatment similarly showed stronger growth inhibition in cluster 2 (S-A) phosphomutant cells compared to WT (Figure S13G), indicating that ZAK turnover initiates a negative-feedback loop, downregulating JNK activity and reducing cell death.
We hypothesized that turnover of activated ZAK might desensitize cells to persistent ribotoxic stress, allowing them to restore homeostasis. While previous studies have shown that pre-treating cells with ANS rendered them insensitive to subsequent stimulation with UV, the underlying mechanism was unclear66. To test this, we pre-treated ZAK WT and cluster 2 (S-A) phosphomutant cells with DMSO (Figures 6D and S13H) or low-dose ANS (0.38 μM) (Figures 6E and S13I) for 19 hours, washed out the compounds, and 1 hour later treated the recovering cells with UV-C. In WT or cluster 2 (S-A) mock (DMSO)-treated cells, we observed no JNK activity for the initial 19 hours (Figure S13H), and subsequent stimulation with UV led to rapid JNK activation (Figure 6D). In contrast, for cells pre-treated with ANS (Figure S13I), WT cells exhibited no JNK response to subsequent UV treatment, while the cluster 2 (S-A) phosphomutant exhibited a robust JNK response (Figure 6E). Thus, ZAK turnover renders cells tolerant to persistent ribotoxic stress.
We predicted that ZAK degradation under moderate ribotoxic stress would induce tolerance and reduce apoptosis upon exposure to subsequent ribotoxic stressors. Following ANS (or DMSO) pre-treatment as above, cells were treated with varying fluences of UV-C and cell death was monitored by live-cell imaging (Figures 6F and 6G). In DMSO-treated cells, subsequent UV stimulation showed no significant difference in cell death between WT and cluster 2 (S-A) phosphomutant cells (Figure 6F). In contrast, with ANS pre-treatment, the cluster 2 (S-A) phosphomutant cells exhibited significantly higher apoptosis upon subsequent exposure to intermediate doses of UV (Figure 6G). ZAK turnover also impacted long-term proliferation; WT and cluster 2 (S-A) phosphomutants, pre-treated with DMSO, displayed similar growth inhibition upon subsequent UV treatment (Figure 6H) while, when pre-treated with ANS, the cluster 2 (S-A) phosphomutant cells displayed significant growth impairment compared to WT (Figure 6H). These results establish that ZAK degradation limits apoptosis and promotes tolerance under conditions of sustained ribotoxic stress.
Discussion
This study unveils the molecular mechanisms regulating ZAK activity upon UV-induced ribosome collisions. ZAK triggers an immediate-early response which reconfigures the global phosphoproteome. RSR signaling through ZAK, not DDR signaling, is responsible for early apoptosis and cell cycle arrest in response to UV. Two negative-feedback mechanisms regulate the RSR following UV exposure: (1) GCN2 activation limits ZAK activity by reducing collisions on damaged mRNAs and (2) autophosphorylation of a conserved phosphodegron in ZAK promotes its degradation. The absence of either mechanism increases apoptosis in UV-irradiated cells.
We propose that a graded response to translational stress is determined by the abundance and duration of ribosome collisions (Figure 7). In this model, ZAK serves as the critical dose sensor, regulating downstream signaling based on the magnitude and duration of collisions, thereby linking cell fate decisions (homeostasis, tolerance, and death) to the intensity of the encountered stimulus (Figure 7). ZAK’s kinase activity plays a dual role in signal transduction, activating the RSR through p38 and JNK phosphorylation, while facilitating dissociation from ribosomes for subsequent degradation through autophosphorylation. In this model, the abundance and duration of ribosomal collisions regulate ZAK levels, and these factors collectively determine whether JNK activity exceeds a critical threshold for initiating apoptosis (Figure 7).
Figure 7: Regulatory events fine-tune ZAK activity according to level and duration of ribosome collisions.

Signaling from ZAK to p38 and JNK is regulated by three collision regimes—low, intermediate, and high, which together with ZAK levels, link cell fate (homeostasis, tolerance, and death) to the intensity and duration of the encountered ribotoxic stress. Scheme illustrates collision levels (top), changes in ZAK levels and JNK activity over time (middle two panels) and key signaling events (bottom) in response to collision regimes (see text for details).
In the first regime (homeostasis), low-level ribosome collisions activate p38, inducing G2 arrest and moderating JNK activity (Figure 7, left panel). p38 signaling regulates effectors that resolve collisions and control cytokine mRNA stability (e.g., GIGYF2, HBS1L, ZFP36). GCN2 activation coupled with mTOR downregulation actively reduces collisions, keeping JNK activity below its critical threshold, enabling restoration of homeostasis. ZAK protein levels remain relatively unchanged in this regime, allowing effective response to subsequent stimuli. In the second regime (tolerance), intermediate-level collisions persist without triggering apoptosis (Figure 7, middle panel). Here, ZAK degradation prevents JNK hyperactivation and desensitizes cells to persistent ribotoxic stress, establishing ZAK as a critical dose-sensing node. This tolerant state allows time for gene expression programs to alleviate translational distress. In the third regime (apoptosis), high-level collisions accumulate rapidly, leading to robust JNK activity triggered by ZAK activation, surpassing the apoptosis threshold (Figure 7, right panel). In this regime, GCN2 activity and ZAK degradation fail to prevent apoptosis, rendering tolerance irrelevant as cells commit to apoptosis.
The phosphosites in cluster 2 that regulate ZAK’s stability and ribosome association, cluster near its RBR (Figure 5), close to a known phosphodegron motif16. While this previous study mutated the motif but failed to capture impacts on ZAK function, we show using genetic, biochemical, and live-cell imaging approaches that ZAK associates with β-TrCP1/2 and is degraded by the CRL1 E3 ubiquitin ligase complex (Figure 5). This autophosphorylation event plays a critical role in signal termination.
Kinases often confer tolerance through self-regulation within signaling pathways. For example, IRAK1 regulates its own stability by sensing the dose of the imparted agonist (e.g. IL-1β, LPS), rendering cells cross-tolerant to further stimulation67. Similarly, PLK4 regulates its own stability by phosphorylating a β-TrCP phosphodegron that limits centrosome overduplication68,69. Moreover, MAPKAP2 degradation modulates cell fate based on stress intensity and duration70. Our findings provide a molecular explanation for the earlier observation that cells treated with sub-inhibitory doses of ANS failed to activate JNK upon subsequent treatment with ANS, UV or sorbitol; notably, the same cells remained sensitive to other JNK agonists66. ZAK’s autoregulatory mechanism illustrates how a MAP3K can orchestrate a unified cell fate response through tolerance. Other MAP3Ks may use phosphodegrons to regulate their stability and moderate signaling, as the β-TrCP phosphodegron motif is also present in MEKK1, TAK1, and TAOK2.
Although DNA repair is crucial for responding to genotoxic stress20,71,72, early apoptosis in response to UV is primarily driven by ZAK-mediated signaling through the RSR (Figures 3 and S10). Furthermore, early checkpoint arrest following UV is primarily regulated by ZAK rather than ATR. While RSR kinases are activated ubiquitously in response to UV, we observed heterogeneous activation of the DDR across individual cells (Figures 3B and S10B). A parsimonious explanation is that RNA damage triggers widespread collisions across the transcriptome independent of cell cycle status, while DNA lesions may remain unnoticed until replication stalls in S phase, activating ATR18,20,73. Additionally, mRNAs may be more vulnerable to damage from UV and oxidizing agents74. Thus, in a proliferating cell population, ZAK functions as the immediate sentinel, influencing cell fate outcomes based on the extent of cytoplasmic RNA damage.
Clinically, RSR-induced apoptosis may be critical to circumvent carcinogenesis following UV exposure. This is exemplified by the unexpected occurrence of squamous cell carcinomas in about 22% of melanoma patients treated with vemurafenib, intended to suppress BRAF, due to off-target inhibition of ZAK, which suppresses JNK activity and apoptosis75. For specific cell types such as keratinocytes, ZAK-mediated tolerance could protect cells encountering persistent UV radiation from apoptosis, along with other pro-survival signals that elevate the local JNK-apoptosis threshold76,77. Recent studies highlighting the sensitivity of cancer models to translation-inhibiting drugs likely reflect ZAK-mediated apoptotic signaling effects, suggesting a role for ZAK in influencing treatment susceptibility78–80. Moving forward, it will be crucial to understand how apoptosis-triggering thresholds are established in different cell types with differing ZAK expression levels, degradation rates, and protein synthesis loads.
Limitations of the study
Our study poses questions about how GCN2 regulates mTOR activity under ribotoxic stress. While GCN2 upregulates ATF4 translation in response to amino acid deprivation (AAD), leading to Sestrin2 expression and subsequent mTORC1 repression81, the delayed increase in Sestrin2 levels following AAD diminishes its plausibility as the factor rapidly suppressing mTOR activity upon UV exposure. A recent study reported GCN2-mediated phosphorylation of FBXO22 reduces mTOR activity during AAD82. However, we found no GCN2 or UV dependency on phosphorylation of FBXO22 at the predicted site (Thr-127). Further investigation is needed to clarify how GCN2 inhibits mTOR during ribotoxic stress.
STAR Methods
RESOURCE AVAILABILITY
Lead Contact
Further information and requests for resources and reagents should be directed to and will be fulfilled by the Lead Contact Rachel Green (ragreen@jhmi.edu).
Materials Availability
Reagents generated in this study are available from the Lead Contact with a completed Materials Transfer Agreement.
Data and Code Availability
Raw mass spectrometry data associated with Tables S1–S4 have been deposited to the MassIVE repository and are publicly available as of the date of publication with the dataset identifier MSV000092521. HTML plots corresponding to various analyses are included as a Supp. Item in a ZIP file. The primary phosphoproteomics datasets generated during this study are publicly available online (https://ordureau-lab.shinyapps.io/Sinha-Shinyapp/) to examine the datasets at a gene-specific level.
The paper does not report original code.
Any additional information required to reanalyze the data reported in this paper is available from the lead contact upon request.
EXPERIMENTAL MODEL AND STUDY PARTICIPANT DETAILS
Plasmids and cloning
Unless otherwise stated, all oligonucleotides and primers used for cloning were synthesized by Integrated DNA Technologies (IDT). LentiCRISPRV2-Neo was a gift from Andrew Holland (Johns Hopkins University School of Medicine). CRISPR guide plasmids were generated by digesting lentiCRISPRV2-Neo with BsmBI (NEB) and ligating pairs of phosphorylated annealed oligos containing a given sgRNA sequence with appropriate overhangs. pLenti-PGK-Puro_DEST (w529–2) was a gift from Eric Campeau & Paul Kaufman (Addgene 19068; RRID: Addgene_19068)88. pMD2.G (Addgene 12259; RRID: Addgene_12259), pMDLg/pRRE (Addgene 12251; RRID: Addgene_12251), and pRSV-Rev (Addgene 12253; RRID: Addgene_12253) were gifts from Didier Trono89.
The following ZAKα (referred to as ZAK throughout) ORFs were sub-cloned into pLenti-PGK-Puro-DEST (w529–2): ZAK-WT, ZAK-K45M, ZAK-T161A-S165A, ZAK-Cluster 1 (S-A), ZAK-Cluster 2 (S-A), ZAK-Cluster 3 (S-A), ZAK-All Clusters (S-A), ZAK-Cluster 2 (S-D), mNeonGreen-ZAK-WT, mNeonGreen-ZAK-T161A-S165A, mNeonGreen-ZAK-Cluster 2 (S-A), mNeonGreen-ZAK-ΔSΔCTD. ZAK residues mutated in individual clusters are specified in Table S1; All Clusters refers to all residues defined in Clusters 1, 2, and 3. For brevity, these groups of residues will be referred to by their cluster names throughout this manuscript. Mutation of these serine/threonine residues to alanines or aspartic acid will be referred to S-A or S-D, respectively.
pLenti-PGK-Puro_ZAK-WT, containing the wildtype ZAK ORF, was generated using Gibson assembly of the pLenti-PGK-Puro-DEST backbone and an amplified ZAK ORF with appropriate Gibson overlaps. pLenti-PGK-Puro-ZAK single- or double-point mutants were generated using site-directed mutagenesis. To generate pLenti-PGK-Puro ZAK cluster phosphomutants (S-A) and phosphomimetics (S-D), ZAK gene fragments containing different phosphomutant and phosphomimetic cluster sites were synthesized by Twist Biosciences. These phosphomutant and phosphomimetic gene fragments were used in Gibson assembly with the pLenti-PGK-Puro_ZAK backbone to yield pLenti-PGK-Puro_ZAK cluster phosphomutant and phosphomimetic plasmids. pLenti-PGK-Puro_mNeonGreen-ZAK-WT was generated using Gibson assembly of the pLenti-PGK-Puro_ZAK-WT construct and an amplified mNeonGreen ORF with the appropriate Gibson overlaps. S-A point and cluster mutations of this construct were subsequently generated using the same cloning strategies as described above. These constructs were then used for lentivirus generation and subsequent transduction of MCF10a-ΔZAK cells as described later. pcDNA-DEST53–3x-FLAG-β-TrCP2 (FBXW11) and pcDNA-DEST53-3x-FLAG- β-TrCP1 (FBXW1A) were generated using Gibson assembly of the pcDNA-DEST53–3x-FLAG linearized vector backbone and amplified β-TrCP2 (FBXW11) and β-TrCP1 (FBXW1A) ORFs with appropriate Gibson overlaps.
Cell lines and maintenance
HaCaT (T0020001) parental cell lines were obtained from Addex Bio. HEK293FT (R70007) parental cell lines were obtained from Thermo Fisher. The MCF10a parental cell line was obtained from ATCC (CRL-10317). MCF10a-KTR reporter cell lines were generated as described later. After thawing, all cell lines were passaged at least twice before usage in any experiment. Unless otherwise stated, HEK293FT and HaCaT cells were cultured in DMEM (high glucose, pyruvate, L-glutamine; Thermo Fisher 11995073) supplemented with 10% FBS (Thermo Fisher A3160502). MCF10a cells were grown in DMEM/F12 (Invitrogen 11330–032) supplemented with 5% equine serum (Invitrogen 16050–122), 20 μg/l EGF (Peprotech AF-100–15), 0.5 g/l hydrocortisone (Sigma-Aldrich H-0888), 100 μg/l cholera toxin (Sigma-Aldrich C-8052), and 10 mg/l insulin (Sigma-Aldrich I0516). Unless otherwise stated, all cells were maintained in a 5% CO2 humidified incubator and passaged every 2–3 days. All cell lines were routinely tested for mycoplasma contamination during culturing.
Lentivirus production and transduction
For each lentiviral construct, 3 × 10^6 HEK293FT cells were seeded onto a 100 mm plate (Corning 430167). The next day, the medium was replaced 1 h prior to transfection. Following media change, each plate was transfected with 7.6 μg lentiviral transfer plasmid, 7.6 μg pMD2-G (Addgene 12259), 7.6 μg pMDLg/pRRE (Addgene 12251), and 3.8 μg pRSV-Rev (Addgene 12253) using Lipofectamine 2000 (Thermo Fisher 11668027) according to the manufacturer’s protocol. 48 h after transfection, the supernatant was collected, filtered through 0.45 micron SFCA syringe filter, and concentrated using Lenti-X concentrator (Takara Bio 631231) according to the manufacturer’s protocol. The concentrated lentivirus was aliquoted and used immediately or snap-frozen in LN2 before storage at −80°C.
On the day of infection, the cell line to be transduced was trypsinized and counted. For each infection, 1 × 10^6 cells were aliquoted into a 1.5 ml tube and mixed with concentrated lentivirus and 12.5 μg/ml polybrene (Sigma TR-1003-G). The virus-cell mixture was incubated at room temperature for 10 minutes before seeding the entire mixture onto a 100 mm plate containing growth media. 24 h later, plates were treated with the appropriate selection antibiotic and cultured under selection for ~3–5 days or until the uninfected control under selection showed no viable cells. Following selection, surviving cells were expanded and tested for protein expression by immunoblot analysis, live-cell imaging, and/or immunofluorescence prior to freezing.
Generation of cell lines
HaCaT cells, derived from adult human keratinocytes, are non-tumorigenic immortalized epithelial cells and are highly sensitive to UV, making them ideal for studying UV-dependent RSR and DDR processes. However, due to their genetic intractability and resistance to foreign DNA, ZAK and GCN2 knockouts were generated in MCF10a lines which we have previously utilized for studying the RSR17. A MCF10a cell line stably expressing four kinase translocation reporters (KTRs) (H2B-iRFP nuclear marker, ERK-KTR-mCerulean3, JNK-KTR-mRuby2, and p38-KTR-mClover) was generated in Wu et al. 202017. As described previously17, cells were lentivirally transduced with H2B-iRFP, ERK-KTR-mCerulean3, JNK-KTR-mRuby2, and p38-KTR-mClover45 and clonally expanded following antibiotic selection17. To generate a ΔZAK variant of this MCF10a-KTR line, cells were transduced with lentiCRISPRV2-Neo encoding guide RNA targeting exon 1 of the human ZAKα gene (target sequence: ATGGATATCACAGGACAAGG) and clonally expanded following antibiotic selection17.
To generate polyclonal MCF10a-ΔZAK lines complemented with exogenous ZAK constructs, pLenti-PGK-Puro vectors containing either ZAK-WT, ZAK-K45M, ZAK-T161A-S165A, ZAK-Cluster 1 (S-A), ZAK-Cluster 2 (S-A), ZAK-Cluster 3 (S-A), ZAK-All Clusters (S-A), or ZAK-Cluster 2 (S-D) were transduced into MCF10a-ΔZAK cells stably expressing H2B-iRFP, ERK-KTR-mCerulean3, JNK-KTR-mRuby2, and p38-KTR-mClover. Transduced cells were selected using 1 μg/ml puromycin (Invivogen ant-pr-1) as described above.
Experiments involving mNeonGreen-ZAK constructs (mNeonGreen-ZAK WT, mNeonGreen-ZAK T161A-S165A, mNeonGreen-ZAK Cluster 2 (S-A), or mNeonGreen-ZAK ΔSΔCTD) were performed in a MCF10a-KTR-ΔZAK cell line generated as described above but omitting p38-KTR-mClover to prevent spectral overlap between mNeonGreen-ZAK and p38-KTR-mClover.
The MCF10a-KTR-ΔGCN2 cell line was generated through the following protocol. A guide RNA sequence targeting exon 3 (target sequence: ACTGGCCAAGAAACACTGTG) of the human GCN2 gene was cloned into lentiCRISPRV2-Neo. This plasmid was transduced into MCF10a cells stably expressing H2B-iRFP, ERK-KTR-mCerulean3, JNK-KTR-mRuby2, and p38-KTR-mClover. Transduced cells were selected with 500 μg/ml G418 (Invivogen ant-gn-1) until an uninfected control plate under selection showed no viable cells (~ 4–5 days). Surviving cells were used to generate monoclonal cell populations using a limiting dilution method.
DHB-mVenus (CDK2 reporter)90 was obtained from Addgene (#126679) and mVenus was replaced with mTurquoise2. MCF10a parental cells were transduced with lentivirus containing this reporter as well as H2B-iRFP, selected with antibiotic, and flow-sorted to yield the MCF10a-CDK2 reporter (MCF10A (H2B-iRFP, DHB-mTurquoise2) cell line as described in McKenney et al., 202491. The Δp53 cell line (MCF10A (H2B-iRFP, DHB-mTurquoise2, Δp53)) was generated in McKenney et al., 202491.
Engineered cell lines were validated for knock-outs, expression, and activity using mass-spectrometry, live-cell imaging, immunoblotting, and immunofluorescence.
METHOD DETAILS
Treatments with elongation inhibitors and UV irradiation and cell lysis
Unless specified otherwise, cells were seeded the day prior to harvest at 3 − 3.5 × 10^5 cells per condition in individual wells of 6-well plates and allowed to grow for 24 h. At 24 h, cells were replenished with fresh media supplemented with 10% FBS. Approximately 1 h post-media change, cells were pre-treated (30 min-1 h unless noted otherwise) with DMSO (mock) or the respective RSR, ISR or DDR inhibitors as noted; three ZAK inhibitors (ZAKi) were used, Nilotinib46 (1 μM, 30 min), Vemurafenib46 (1 μM, 30 min), and PLX4720 (for long-term imaging, 5 μM, 1 h); for GCN2 (GCN2i, A-92, 2 μM, 30 min), for p38 (p38i, SB 203580, 1.4 μM, 30 min); for JNK (JNKi VIII, 16 μM, 30 min), for ATR (VE-821, 2.4 μM, 30 min); for PERK (PERKi, GSK2606414, 0.3 μM, 1 h). Following inhibitor pre-treatment (where applicable), the appropriate experimental treatment (UV/ANS) was applied to the cells before harvesting.
Anisomycin (ANS, Sigma A9789) stock solutions were prepared to 94.2 mM (25 mg/ml) in DMSO and frozen at −20°C. Ribosomal collisions were induced by adding ANS directly to the culture medium at a final concentration of 0.38 μM, gently swirling the plate, and returning the cells to 37°C for 15 minutes unless noted otherwise.
Approximately, 1–2 hours prior to UV treatment, cells were replenished with fresh media. For UV treatment, cells were irradiated using a UV Stratalinker® 2400 (Stratagene) at 500 J/m2 UV-C (unless specified otherwise) after removing the plate lid. The Stratalinker was configured in Energy mode for UV treatments, with a fluence or dose per unit area set at 500 J/m2. In this mode, the instrument irradiates the samples until a cumulative dose of 500 J/m2 is reached, requiring 13 seconds on a UV Stratalinker® 2400 (Stratagene). The assigned UV-dose was confirmed using an external UV-C radiometer and compared across two different instruments to ensure accurate calibration. UV fluence titration in HaCaT and MCF10a cells identified the optimal dose for maximal ZAK and GCN2 activation as 500 J/m2 measured 15 minutes post-UV treatment (Figures S1A–S1C). Two collision markers, eS10-Ub and EDF1 recruitment to polysomes, also showed optimal output at this fluence32,33,92,93 (Figures S1C–S1D). Unless specified otherwise, UV-irradiated cells were returned to 37°C and harvested after 15 min post-UV treatment. Due to technical constraints, all UV treatments were performed without the removal of media. Removal of media (even for brief periods) artifactually induced the activation of stress response pathways. For example, we noticed that rinsing untreated cells (3x) with PBS or removing media completely from wells prior to UV treatment basally induced eIF2α phosphorylation. This perturbation is likely a consequence of short-term starvation and/or ISR induction. We also noted that untreated cells, where media was exchanged to PBS or removed completely basally activated p38 phosphorylation. We note that UV penetration into liquids is not efficient, so the actual UV dose reaching cells in nutrient-rich media is likely considerably lower than 500 J/m2. To account for this reduced penetrance, we determined stimulus-response patterns of ZAK, p38, and JNK to UV-C treatment in cells kept in nutrient-rich media compared to those where media was removed prior to UV-C treatment. These data revealed that the presence of nutrient-rich media during UV exposure significantly increases the EC50 for ZAK, p38, and JNK phosphorylation, necessitating a higher UV dose. Phosphoproteomics, imaging-based apoptosis and KTR assays, long-term growth assays, and most biochemical experiments were performed in media lacking phenol red. In a few instances (Figures 6A, S1C, S1D and S12A), we used media containing phenol red (due to supply constraints or media unavailability). We have assessed the effects of UV on ZAK, p38, JNK, and eIF2α phosphorylation, as well as eS10 ubiquitylation, in media with or without phenol red; these data revealed comparable ubiquitylation and kinase activation patterns upon exposure to 50 J/m2 and 500 J/m2 UV-C, 15 min post-UV treatment. Our methodology was designed to optimize the UV fluence to trigger a robust ribotoxic stress response and maximize the activation of ZAK and GCN2, which serve as indirect markers of RNA damage. This approach was chosen over a direct evaluation of DNA damage in response to UV, which typically involves immunofluorescent staining to detect cyclobutane pyrimidine dimers. In summary, we selected our UV dose to address the reduced penetrance of UV in media while avoiding disruption to translational homeostasis. We landed on a dose of 500 J/m2 to achieve maximal ZAK activation 15 minutes after UV treatment (Figures S1A–S1C).
Tunicamycin (Cell Signaling 12819) treatment was performed at a final concentration of 2 μg/ml for 2 h.
For immunoblotting and Phos-tags, cells were lysed by aspirating media, immediately rinsed with 1 ml warm PBS (37°C, pH 7.4; Thermo Fisher) supplemented with 377 μM ANS to freeze ribosomes in situ, and lysed by adding 150 μl ice-cold lysis buffer (RIPA buffer (Thermo 89900) supplemented with 1x Halt EDTA-free protease and phosphatase inhibitor cocktail (Thermo 78445), 10 mM sodium phosphate dibasic (Na2HPO4.7H2O) (Millipore Sigma 71640), 10 mM β-glycerophosphate (Millipore Sigma G9422), 42.5 units/ml Benzonase (Millipore Sigma, E1014), 377 μM ANS (Millipore Sigma A9789), 1 mM TCEP (Gold-Bio, TCEP2) to each well. Plates were swirled gently to evenly distribute lysis buffer; cells were scraped from the plate using a cell scraper, gently pipetted to homogenize the cell lysate, and transferred to ice for 5–10 min to complete lysis. Lysates were clarified by brief centrifugation at 8000 × g (5–7 min, 4°C), and the clarified supernatant was transferred to a fresh tube on ice. The clarified supernatant was used immediately or flash frozen in liquid nitrogen and stored at −80°C.
Immunoblotting
Protein concentrations of clarified lysates were determined by BCA assay (Thermo 23225) according to the manufacturer’s instructions. Concentration-normalized SDS-PAGE samples were prepared by mixing lysates with 6X Laemmli loading buffer and boiling at 95°C for 10 minutes. Samples were loaded into 4–12% Criterion™ XT Bis-Tris polyacrylamide gels (Bio-Rad 3450125) and gel electrophoresis was performed in 1x MES running buffer (Bio-rad 1610789) (125 V; 1 h 35 min). Gels were transferred to PVDF membranes (Bio-Rad 1704273) using a Trans-Blot Turbo Transfer System (Bio-Rad). Membranes were blocked in 5% non-fat milk (Santa Cruz Biotechnology, sc-2325) resuspended in TBST (30 min – 1 h, 25°C) followed by overnight incubation with primary antibody in 5% non-fat milk in TBST at 4°C, followed by 4 × 10 min washes in TBST at 25°C, followed by incubation with the secondary antibody in 5% non-fat milk in TBST (1 h, 25°C), followed by 4 × 10 min washes in TBST. Primary and secondary antibodies were used at recommended concentrations (Key Resources Table) and all incubation steps were performed with gentle rocking. Blots were developed using SuperSignal West Pico PLUS or West Femto Maximum chemiluminescent substrates (Thermo 34580/34095) before imaging using a ChemiDoc imaging system (Bio-Rad).
KEY RESOURCES TABLE
| REAGENT or RESOURCE | SOURCE | IDENTIFIER |
|---|---|---|
| Antibodies | ||
| ZAK | Fortis Life Sciences | A301-993A; RRID:AB_1576612 |
| Phospho-p38 (Thr180/Tyr182) | Cell Signaling Technology | 9211; RRID:AB_331641 |
| p38 MAPK | Cell Signaling Technology | 9212; RRID:AB_330713 |
| Phospho-SAPK/JNK (Thr183/Tyr185) | Cell Signaling Technology | 4668;RRID:AB_823588 |
| JNK1 (2C6) | Cell Signaling Technology | 3708; RRID:AB_1904132 |
| Phospho-JNK1/JNK2 (Thr183/Tyr185) | Thermo Fisher Scientific | PA1-9594; RRID:AB_2140859 |
| RPS24 | Abcam | ab196652; RRID:AB_2714188 |
| RPS2 | Fortis Life Sciences | A303-794A; RRID:AB_11218192 |
| RPS10 | LSBio | LS-C335612 |
| Vinculin | Santa Cruz Biotechnologies | sc-73614; RRID:AB_1131294 |
| β-Actin (13E5) (HRP conjugate) | Cell Signaling Technology | 5125; RRID:AB_1903890 |
| Phospho-eIF2α (Ser 51) | Abcam | ab32157; RID:AB_732117 |
| eIF2α | Cell Signaling Technology | 9722; RRID:AB_2230924 |
| GCN2 | Cell Signaling Technology | 3302; RRID:AB_2277617 |
| Phospho-c-Jun (Ser63) II | Cell Signaling Technology | 9261; RRID:AB_2130162 |
| EDF1 | Abcam | ab174651; RRID:AB_2893192 |
| Phospho-Chk1 (Ser 345) | Cell Signaling Technology | 2341; RRID:AB_330023 |
| Phospho-Chk1 (Ser 345) | Cell Signaling Technology | 76784; RRID:AB_331212 |
| Chk1 | Cell Signaling Technology | 2360; RRID:AB_2080320 |
| Anti-Cyclobutane Pyrimidine Dimers (CPDs), Clone TDM-2 | Cosmo Bio USA | CAC-NM-DND-001; RRID:AB_1962813 |
| PCNA [PC10] | Abcam | ab29; RRID:AB_303394 |
| Phospho-H2A.X (Ser 139) | Millipore Sigma | 05-636; RRID:AB_309864 |
| H2A.X | Millipore Sigma | PLA0023; |
| PARP | Cell Signaling Technology | 9542; RRID:AB_2160739 |
| Phospho-4E-BP1 (Thr 70) | Cell Signaling Technology | 9455; RRID:AB_330949 |
| Phospho-p53 (Ser-15) | Cell Signaling Technology | 9284; RRID:AB_331464 |
| p53 (DO-7) | Santa Cruz Biotechnologies | sc-47698; RRID:AB_628083 |
| ANTI-FLAG® | Millipore Sigma | A8592; RRID:AB_439702 |
| Bacterial and virus strains | ||
| Not applicable | ||
| Biological Samples | ||
| Not applicable | ||
| Chemicals, peptides, and recombinant proteins | ||
| Nilotinib (AMN-107) | ApexBio | A8232 |
| PLX4720 | Selleck Chem | S1152 |
| Vemurafenib (PLX4032) | Selleck Chem | S1267 |
| SB203580 | Cell Signaling Technology | 5633 |
| JNK Inhibitor VIII | Selleck Chem | S7794 |
| JNK-IN-8 | Selleck Chem | S4901 |
| A-92 | Axon MedChem | 2720 |
| VE-821 | Selleck Chem | S8007 |
| LY2603618 | Selleck Chem | S2626 |
| KU-55933 | Selleck Chem | S1092 |
| MLN4924 | ApexBio | B1036 |
| Bortezomib | Cell Signaling Technology | 2204 |
| PR-619 | Life Sensors | SI9619 |
| GSK2606414 | Selleck Chem | S7307 |
| AEBSF | Gold Biotechnology | A-540 |
| TCEP | Gold Biotechnology | TCEP2 |
| Trypsin | Promega | V511C |
| Lys-C | Wako Chemicals | 129-02541 |
| Urea | Sigma | U5378 |
| Formic Acid (FA) | Sigma-Aldrich | 94318 |
| Trifluoroacetic acid (TFA) | Fisher Scientific | AA44630AE |
| Trichloroacetic acid (TCA) | Millipore Sigma | T9159 |
| EPPS | Sigma-Aldrich | E9502 |
| 2-Chloroacetamide | Sigma-Aldrich | C0267 |
| Iodoacetamide | Millipore Sigma | A3221 |
| NP-40 | Fisher Scientific | AAJ61055AP |
| NP-40 Alternative | Millipore Sigma | 492018 |
| HEPES | Gold Biotechnology | H-400 |
| NaCl | Fisher Scientific | BP358 |
| KOAc | Millipore Sigma | P1190 |
| Mg(OAc)2 | Sigma-Aldrich | M5661 |
| Glycerol | Fisher Scientific | G33-4 |
| L-Methionine | Sigma-Aldrich | M5308 |
| L-Cysteine | Sigma-Aldrich | C7352 |
| L-Glutamine | Thermo Fisher Scientific | 21051024 |
| Sodium deoxycholate | Gold Biotechnology | D-070-100 |
| Sodium dodecyl sulfate (SDS) | Research Products International | L22010 |
| Sodium pyrophosphate | Fisher Scientific | S390 |
| β-glycerophosphate | Sigma-Aldrich | G9422 |
| Sodium phosphate dibasic | Millipore Sigma | 71640 |
| Rapigest SF Surfactant | Glixx Laboratories | GLXC-07089 |
| Ammonium bicarbonate | Sigma-Aldrich | 09830-500G |
| MgCl2 | Fisher Scientific | AC223211000 |
| MnCl2 | Millipore Sigma | 244589 |
| TRIS base | Sigma-Aldrich | T1503 |
| Glycine | Sigma-Aldrich | G7126 |
| Sucrose | Sigma-Aldrich | S7903 |
| EDTA (0.5 M), pH 8.0, RNase-free | Thermo Fisher Scientific | AM9260G |
| Methanol | Fisher Scientific | A452-4 |
| Chloroform | Fisher Scientific | C298-500 |
| Acetonitrile | Fisher Scientific | A998-4 |
| Anisomycin | Sigma-Aldrich | A9789 |
| Emetine | Millipore Sigma | 324693 |
| Tunicamycin | Cell Signaling | 12819 |
| Dimethyl sulfoxide (DMSO) | Thermo Fisher Scientific | D12345 |
| Benzonase | Millipore Sigma | E1014 |
| TURBO DNase | Thermo Fisher | AM2239 |
| 4–12% Criterion™ XT Bis-Tris polyacrylamide gels | Bio-Rad | 3450125 |
| 20X XT MES Running Buffer | Bio-rad | 1610789 |
| Trans-Blot Turbo RTA Midi 0.2 μm PVDF Transfer Kit | Bio-Rad | 1704273 |
| Blotto, non-fat dry milk | Santa Cruz Biotech | sc-2325 |
| SuperSignal™ West Pico PLUS Chemiluminescent Substrate | Thermo Fisher Scientific | 34580 |
| SuperSignal™ West Femto Maximum Sensitivity Substrate | Thermo Fisher Scientific | 34095 |
| Phos-tag Acrylamide | Wako Fujifilm | AAL-107S1 |
| 12.5 % SuperSep™ Phos-tag™ SDS-PAGE gels | Wako Fujifilm | 195-17991 |
| EDTA-free pre-stained protein marker | Apex Bio | F4005 |
| Open-top polyclear centrifuge tubes (for SW41) | Seton Scientific | 7030 |
| Biocomp Piston Gradient Fractionator | Biocomp | |
| ChromoTek mNeonGreen-Trap Agarose beads | Proteintech | ntak |
| Anti-FLAG® M2 Magnetic Beads | Millipore Sigma | M8823 |
| Click-IT™ AHA (L-Azidohomoalanine) | Thermo Fisher Scientific | C10102 |
| Copper sulfate | Millipore Sigma | PHR1477 |
| Sodium ascorbate | Thermo Fisher Scientific | PHR1279 |
| TBTA | Click chemistry Tools | 1061 |
| Biotin-PEG4-Alkyne | Click chemistry Tools | TA105 |
| TAMRA-Alkyne | Thermo Fisher Scientific | T10183 |
| Pierce High Capacity Streptavidin Agarose | Thermo Fisher Scientific | 20357 |
| Ponceau S Staining solution | Thermo Fisher Scientific | A40000279 |
| Glass-bottom 96 well imaging plates | CellVis | D35-20-1.5-N |
| Fibronectin | EMD Millipore | FC010 |
| Esp3I (BsmBI) | Thermo Fisher Scientific | ER0451 |
| Gibson Assembly® Master Mix | New England Biolabs (NEB) | E2611S |
| DMEM (high glucose, pyruvate, L-glutamine) | Thermo Fisher Scientific | 11995073 |
| DMEM (high glucose, no glutamine, no phenol red) | Thermo Fisher Scientific | 31053036 |
| Sodium Pyruvate (100 mM) | Thermo Fisher Scientific | 11360070 |
| L-Glutamine | Thermo Fisher Scientific | 21051024 |
| Fetal Bovine Serum | Thermo Fisher Scientific | A3160502 |
| DMEM/F12 (HEPES) | Thermo Fisher Scientific | 11330-032 |
| DMEM/F12 (HEPES), no phenol red | Thermo Fisher Scientific | 11039021 |
| Equine serum | Thermo Fisher Scientific | 16050-122 |
| Animal-Free Recombinant Human EGF (Epidermal Growth Factor) | Peprotech | AF-100-15 |
| Hydrocortisone | Sigma-Aldrich | H0888 |
| Cholera toxin | Sigma-Aldrich | C8052 |
| Insulin | Sigma-Aldrich | I0516 |
| Puromycin | Invivogen | ant-pr-1 |
| G418 | Invivogen | ant-gn-1 |
| DMEM (No glutamine/cysteine/methonine - for AHA experiments) | Millipore Sigma | D0422 |
| GlutaMAX | Thermo Fisher Scientific | 35050061 |
| Lipofectamine 2000 | Thermo Fisher Scientific | 11668027 |
| Lenti-X concentrator | Takara Bio | 631231 |
| Polybrene | Sigma-Aldrich | TR-1003-G |
| ProLong™ Gold Antifade Mountant | Thermo Fisher Scientific | P36930 |
| Phosphate-buffered saline (PBS) pH 7.4 | Thermo Fisher Scientific | 10010049 |
| Critical Commercial Assays | ||
| Pierce™ High pH Reversed-Phase Peptide Fractionation Kit | Thermo Fisher Scientific | 84868 |
| Pierce™ BCA Protein Assay Kit | Thermo Fisher Scientific | 23227 |
| High-Select™ Fe-NTA Phosphopeptide Enrichment Kit | Thermo Fisher Scientific | A32992 |
| TMTpro 16plex Label Reagent | Thermo Fisher Scientific | A44520 |
| CellEvent Caspase-3/7 Green Detection Reagent | Thermo Fisher Scientific | C10723 |
| Bio-Rad Protein Assay Dye Reagent Concentrate | Bio-Rad | 5000006 |
| Pierce™ BCA Protein Assay Reagent A | Thermo Fisher Scientific | 23223 |
| Pierce™ BCA Protein Assay Reagent B | Thermo Fisher Scientific | 23224 |
| RIPA Buffer | Thermo Fisher Scientific | 89900 |
| Halt EDTA-free protease and phosphatase inhibitor cocktail | Thermo Fisher Scientific | 78445 |
| Qubit RNA HS (High Sensitivity) Assay kit | Thermo Fisher Scientific | Q32855 |
| Qubit RNA BR (Broad-Range) Assay kit | Thermo Fisher Scientific | Q10211 |
| RNase A, DNase and protease-free | Thermo Fisher Scientific | EN0531 |
| SUPERase·In™ RNase inhibitor | Thermo Fisher Scientific | AM2696 |
| Mycoplasma PCR Detection Kit | Abm | G238 |
| Deposited Data | ||
| Proteomics data related to Tables S1–S4 | MassIVE repository | MSV000092521 |
| Web interface for analyzing proteomics data (related to Tables S1–S4) | This study | https://ordureau-lab.shinyapps.io/Sinha-Shinyapp/ |
| Experimental Models: Cell Lines | ||
| HaCaT | Addex Bio | T0020001 |
| HEK293FT | Thermo Fisher Scientific | R70007 |
| HEK293T | ATCC | CRL-3216; RRID: CVCL_0063 |
| MCF10A | ATCC | CRL-10317, RRID: CVCL_0598 |
| MCF10A (H2B-iRFP, DHB-mTurquoise2) | McKenney et al., 2024 | N/A |
| MCF10A (H2B-iRFP, DHB-mTurquoise2, Δp53) | McKenney et al., 2024 | N/A |
| MCF10A (H2B-iRFP, ERK-KTR-mCerulean3, JNK KTR-mRuby2, p38 KTR-mClover) | Wu et al., 2020 | N/A |
| MCF10A (H2B-iRFP, ERK-KTR-mCerulean3, JNK KTR-mRuby2, p38 KTR-mClover, ΔZAK) | Wu et al., 2020 | N/A |
| MCF10A (H2B-iRFP, ERK-KTR-mCerulean3, JNK KTR-mRuby2, p38 KTR-mClover, ΔZAK, ZAKα WT reconstituted) | This paper | N/A |
| MCF10A (H2B-iRFP, ERK-KTR-mCerulean3, JNK KTR-mRuby2, p38 KTR-mClover, ΔZAK, ZAKα K45M reconstituted) | This paper | N/A |
| MCF10A (H2B-iRFP, ERK-KTR-mCerulean3, JNK KTR-mRuby2, p38 KTR-mClover, ΔZAK, ZAKα T161A-S165A reconstituted) | This paper | N/A |
| MCF10A (H2B-iRFP, ERK-KTR-mCerulean3, JNK KTR-mRuby2, p38 KTR-mClover, ΔZAK, ZAKα Cluster 1 (S-A) reconstituted) | This paper | N/A |
| MCF10A (H2B-iRFP, ERK-KTR-mCerulean3, JNK KTR-mRuby2, p38 KTR-mClover, ΔZAK, ZAKα Cluster 2 (S-A) reconstituted) | This paper | N/A |
| MCF10A (H2B-iRFP, ERK-KTR-mCerulean3, JNK KTR-mRuby2, p38 KTR-mClover, ΔZAK, ZAKα Cluster 3 (S-A) reconstituted) | This paper | N/A |
| MCF10A (H2B-iRFP, ERK-KTR-mCerulean3, JNK KTR-mRuby2, p38 KTR-mClover, ΔZAK, ZAKα All Clusters (S-A) reconstituted) | This paper | N/A |
| MCF10A (H2B-iRFP, ERK-KTR-mCerulean3, JNK KTR-mRuby2, p38 KTR-mClover, ΔZAK, ZAKα Cluster 2 S-D reconstituted) | This paper | N/A |
| MCF10A (H2B-iRFP, ERK-KTR-mCerulean3, JNK KTR-mRuby2, p38 KTR-mClover, ΔGCN2) | This paper | N/A |
| MCF10A (H2B-iRFP, ERK-KTR-mCerulean3, JNK KTR-mRuby2, ΔZAK, mNeonGreen-ZAKα WT reconstituted) | This paper | N/A |
| MCF10A (H2B-iRFP, ERK-KTR-mCerulean3, JNK KTR-mRuby2, ΔZAK, mNeonGreen-ZAKα T161A-S165A reconstituted) | This paper | N/A |
| MCF10A (H2B-iRFP, ERK-KTR-mCerulean3, JNK KTR-mRuby2, ΔZAK, mNeonGreen-ZAKα Cluster 2 (S-A) reconstituted) | This paper | N/A |
| MCF10A (H2B-iRFP, ERK-KTR-mCerulean3, JNK KTR-mRuby2, ΔZAK, mNeonGreen-ZAKα ΔS ΔCTD reconstituted) | This paper | N/A |
| Experimental Models: Organisms/Strains | ||
| Not applicable | ||
| Oligonucleotides | ||
| ACTGGCCAAGAAACACTGTG | This paper | GCN2 exon 3-targeting sgRNA |
| Recombinant DNA | ||
| pLenti-PGK-Puro-DEST (w529-2) | Campeau et al., 2009 | Addgene 19068 |
| pLenti-PGK-Puro_ZAK-WT | This paper | N/A |
| pLenti-PGK-Puro_ZAK-T161A-S165A | This paper | N/A |
| pLenti-PGK-Puro_ZAK-K45M | This paper | N/A |
| pLenti-PGK-Puro_ZAK-Cluster1-(S-A) (individual mutations listed in Table S1) | This paper | N/A |
| pLenti-PGK-Puro_ZAK-Cluster2-(S-A) (individual mutations listed in Table S1) | This paper | N/A |
| pLenti-PGK-Puro_ZAK-Cluster3-(S-A) (individual mutations listed in Table S1) | This paper | N/A |
| pLenti-PGK-Puro_ZAK-allClusters-(S-A) (i.e. Clusters 1 + 2 + 3 mutations as listed in Table S1) | This paper | N/A |
| pLenti-PGK-Puro_ZAK-Cluster2-S-D (individual mutations listed in Table S1) | This paper | N/A |
| pLenti-PGK-Puro_NeonGreen-ZAK-WT | This paper | N/A |
| pLenti-PGK-Puro_NeonGreen-ZAK-T161A-S165A | This paper | N/A |
| pLenti-PGK-Puro_NeonGreen-ZAK-Cluster2-(S-A) | This paper | N/A |
| pLenti-PGK-Puro_NeonGreen-ZAK-ΔSΔCTD | This paper | N/A |
| pcDNA-DEST53-3x-FLAG-FBXW11 | This paper | N/A |
| pcDNA-DEST53-3x-FLAG-FBXW1A | This paper | N/A |
| LentiCRISPRV2-Neo | provided by Andrew J. Holland (JHMI) | N/A |
| LentiCRISPRV2-Neo_sgGCN2 | This paper | N/A |
| pMD2-G | Dull et al., 1998 | Addgene 12259 |
| pMDLg/pRRE | Dull et al., 1998 | Addgene 12251 |
| pRSV-Rev | Dull et al., 1998 | Addgene 12253 |
| Software and Algorithms | ||
| Prism | GraphPad, v9 | https://www.graphpad.com/scientific-software/prism/ |
| Comet | Eng et al., 2012 | http://comet-ms.sourceforge.net/ |
| Perseus | Tyanova et al., 2016 | http://www.perseus-framework.org |
| PhosR | Kim et al., 2021 | https://pyanglab.github.io/PhosR/articles/PhosR.html |
| JMP | JMP Statistical Discovery v.17 | https://www.jmp.com |
| Kinase enrichment and prediction analysis | Johnson et al., 2023 | https://kinase-library.phosphosite.org/site |
| R | R Core Team | https://www.r-project.org/ |
| RStudio | Posit, PBC | https://posit.co |
| CellProfiler | Broad Institute, v4.1.3 | https://cellprofiler.org/ |
| Matlab | Mathworks, vR2021b | https://www.mathworks.com/products/matlab.html |
| MetaMorph | Molecular Devices, v7.10.5.476 | https://www.moleculardevices.com/products/cellular-imaging-systems/acquisition-and-analysis-software/metamorph-microscopy |
| Image J | Schneider et al., 2012 | https://imagej.nih.gov/ij/download.html |
| softWoRx 7.2.2 | Cytiva Life Sciences | |
| Other | ||
| Orbitrap Eclipse Tribrid Mass Spectrometer | ThermoFisher Scientific | FSN04-10000 |
| UltiMate 3000 RSLCnano | ThermoFisher Scientific | ULTIM3000RSLCNANO |
| Aeris 2.6 μm PEPTIDE XB-C18 100 Å 250 × 4.6 mm | Phenomenex | 00G-4505-E0 |
| kinetex EVO-c18 – 150 mm × 2.1 mm | Phenomenex | 00F-4725-AN |
| Sep-Pak tC18 1cc Vac Cartridge | Waters | WAT054960 |
| SOLA HRP SPE Cartridge, 10 mg | Thermo Fisher Scientific | 60109-001 |
| Empore™ SPE Disks C18 | 3M Bioanalytical Technology | 2215 |
| Deltavision Elite Cell Imaging system | GE Healthcare | |
| Stratalinker® 2400 UV Crosslinker | Stratagene | |
Phos-tag gels
For Phos-tag gel immunoblotting, cells were lysed and samples were prepared as described previously. For ZAK immunoblots, samples were resolved by 7 or 8 % SDS-PAGE supplemented with 10.7 μM Phos-tag acrylamide (Wako, AAL-107) and 21.3 μM MnCl2; for GCN2, samples were resolved by 6 % SDS-PAGE supplemented with 14.2 μM Phos-tag acrylamide (Wako, AAL-107) and 28.4 μM MnCl2; for p38 and eIF2α, samples were resolved by 12.5 % SuperSep™ Phos-tag™ SDS-PAGE gels (FujiFilm 195–17991) supplemented with 50 μM Phos-tag acrylamide and 100 μM ZnCl2. EDTA-free pre-stained protein markers were used (Apex Bio F4005), and gel electrophoresis was performed in 1x TRIS/glycine/SDS running buffer (125 V, for the desired time). Gels were washed twice (10 min per wash) in 1x transfer buffer (25 mM TRIS, 192 mM Glycine, 10% v/v methanol) supplemented with 1 mM EDTA to eliminate divalent cations (Mn2+/Zn2+), followed by two washes in 1x transfer buffer without EDTA. After washing, gels were transferred to PVDF membranes (Bio-Rad 1704273) using standard wet-tank transfer protocol in 1x transfer buffer (35 V, overnight, room temperature). Immunoblots were blocked, developed and imaged as described previously.
Polysome profiling
Sample preparation and cell lysis
For polysome profiling, cells were seeded two days prior to harvest at 1.5 − 2 × 10^6 cells per condition in 10 cm dishes and allowed to grow for 48 h. At 48 h, cells were replenished with fresh media supplemented with 10% FBS. Approximately 1 h post-media change, cells were irradiated using a UV Stratalinker® 2400 (Stratagene) at 500 J/m2 UV-C (unless specified otherwise) after removing the plate lid, returned to 37°C and harvested after at the indicated time points post-UV treatment. Cells were lysed by aspirating media, immediately rinsed with warm PBS (37°C, pH 7.4; Thermo Fisher) supplemented with 377 μM ANS to freeze ribosomes in situ, and lysed by adding 300 μl ice cold lysis buffer dropwise to the plate (lysis buffer: 50 mM HEPES pH 7.4, 100 mM KOAc, 15 mM Mg(OAc)2, 5% Glycerol, 0.25% (v/v) NP-40 Alternative (Millipore Sigma 492018) supplemented with 377 μM ANS, 1x Halt EDTA-free protease and phosphatase inhibitor cocktail (Thermo 78445), 10 mM sodium phosphate dibasic (Na2HPO4.7H2O) (Millipore Sigma), 10 mM β-glycerophosphate (Millipore Sigma), 1 mM TCEP (Gold-Bio) and 8 units/ml Turbo DNase (Thermo AM2239). Plates were swirled to distribute lysis buffer; cells were scraped from the plate using a cell scraper, gently pipetted to homogenize the cell lysate, and transferred to ice for 5–10 min to complete lysis. Lysates were clarified by brief centrifugation at 8000 × g (5–7 min, 4°C), and the clarified supernatant was transferred to a fresh tube on ice. Lysates were prepared fresh and used immediately for sucrose gradients to avoid artifacts associated with freezethawing.
RNase A treatment (when applicable)
RNA concentrations from clarified cell lysates were measured using Qubit RNA HS (High Sensitivity) Assay kit (Thermo Q32855) or Qubit RNA BR (Broad-Range) Assay kit (Thermo Q10211) with a Qubit Fluorometer. Lysates were treated with RNase A (Thermo EN0531) using the following condition – 0.5 μg RNase A was added to 15 μg RNA in a 300 μl reaction volume and shaken at 500 rpm (20 min, 25°C) on a table-top thermo-mixer (Eppendorf); the reaction was quenched by the addition of 200 units SUPERase•In™ RNase inhibitor (Thermo AM2696). RNase A digested lysates were layered on top of 10–35% sucrose gradients and processed as described below.
Sucrose Gradient Fractionation
Stock solutions of 10x gradient buffer (250 mM HEPES pH 7.4, 1M KOAc, 50 mM Mg(OAc)2) and 60% (w/v) sucrose in water were prepared, filter-sterilized through a 0.22 μm filter, and stored at room temperature. On the day of the experiment, gradients were prepared from two freshly-made sucrose buffers containing 1x gradient buffer supplemented with 1 mM TCEP, 360 μM emetine, 200 units SUPERase•In™ RNase inhibitor (Thermo AM2696), and sucrose to the appropriate concentration (10% and 50% (w/v) sucrose buffers for undigested samples, and 10% and 35% (w/v) sucrose buffers for RNase A-digested samples). To prepare gradients, 6 ml of 10% sucrose buffer was added to a SW41 ultracentrifuge polypropylene tube (Seton Scientific), after which 6 ml of 35% or 50% sucrose buffer was added to the bottom of the tube using a 10 ml syringe and cannula; 10–50% and 10–35% sucrose gradients prepared on a Biocomp Gradient Master. Gradients were stored at 4°C until use on the same day. Samples were normalized by measuring the RNA concentration using Qubit RNA HS (High Sensitivity) Assay kit (Thermo Q32855) or Qubit RNA BR (Broad-Range) Assay kit (Thermo Q10211) with a Qubit Fluorometer. Equal RNA load (~15–25 μg, depending on the experiment) was layered on top of each sucrose gradient; gradients were ultra-centrifuged in a Beckman SW41 swinging bucket rotor (40,000 rpm; 105 min). Gradients were fractionated and UV (A260) absorbance across 10–50% sucrose gradients was measured using a top-down Biocomp Piston Gradient Fractionator™ as per manufacturer’s instructions. For SDS-PAGE and immunoblotting, proteins from individual fractions were TCA-precipitated and stored at −20°C overnight. The following day, TCA-precipitated fractions were centrifuged at 20,000 × g (30 min, 4°C), the supernatant aspirated, pellets washed (x 3) in 500 μl acetone and centrifuged at 20,000 × g (10 min, 4°C), aspirating the supernatant after each wash. After the final wash step, pellets were vacuum-dried briefly (~ 2–3 min, 42°C) in a vacuum evaporator, resuspended in Laemmli buffer, pH neutralized with Tris-HCl pH 8.0, boiled (95°C, 5 min) and resolved by SDS-PAGE.
Proteomics
Cell lysis and protein digestion
Cells were seeded two days prior to harvest at 1.5 − 2 × 10^6 cells per condition in 10 cm dishes and allowed to grow for 48 h. At 48 h, cells were replenished with fresh media supplemented with 10% FBS. Approximately 1 h post-media change, cells were pre-treated (30 min, unless noted otherwise) with DMSO (mock) or the respective RSR, ISR or DDR inhibitors as described previously. Following inhibitor pre-treatment (where applicable), cells were irradiated using a UV Stratalinker® 2400 at 500 J/m2 UV-C (unless specified otherwise) after removing the plate lid. UV-irradiated cells were returned to 37°C and harvested at indicated time points. Cells were lysed by aspirating media, immediately rinsed (2x) with warm PBS (37°C, pH 7.4) supplemented with 377 μM ANS to freeze ribosomes in situ, and lysed by adding 250–300 μl ice-cold lysis buffer (RIPA buffer, supplemented with 1x Halt EDTA-free protease and phosphatase inhibitor cocktail, 10 mM sodium pyrophosphate, 10 mM β-glycerophosphate, 42.5 units/ml Benzonase, 377 μM ANS, 1 mM TCEP dropwise to the plate. Plates were swirled to distribute lysis buffer; cells were scraped from the plate using a cell scraper, gently pipetted to homogenize the cell lysate, and transferred to ice for 5–10 min to complete lysis. Lysates were clarified by brief centrifugation at 8000 × g (5–7 min, 4°C), and the clarified supernatant was transferred to a fresh tube on ice, flash-frozen in liquid nitrogen, and stored at −80°C. Protein concentrations were determined by Bradford assay. Protein extracts (3 mg (Figure S1F), 100 μg (Figures S5A, S6G, and S9A)) were subjected to disulfide bond reduction with 5 mM TCEP (10 min) and alkylation with 25 mM chloroacetamide (20 min). Methanol–chloroform precipitation was performed prior to protease digestion. In brief, four parts of neat methanol were added to each sample and vortexed, one part chloroform was added to the sample and vortexed, and finally, three parts water was added to the sample and vortexed. The sample was centrifuged at 8000 rpm for 5 min at room temperature and subsequently washed twice with 100% methanol. For Figure S1F, samples were resuspended in 100 mM EPPS pH 8.5 containing 6 M Urea and digested at 37°C for 2 h with Lys-C at a 200:1 protein-to-protease ratio. Samples were then diluted to 0.5 M Urea with 100 mM EPPS pH 8.5 solution, trypsin was added at a 100:1 protein-to-protease ratio, and the reaction was incubated for 6 h at 37 °C. The digestion efficiency of a small aliquot was tested. Samples were acidified with 0.1% Trifluoroacetic acid (TFA) final and subjected to C18 solid-phase extraction, prior to phospho-enrichment.
For Figure S5A, S6G, and S9A, samples were resuspended in 100 mM EPPS pH 8.5 containing 0.1% RapiGest and digested at 37°C for 6 h with trypsin at a 100:1 protein-to-protease ratio. The digestion efficiency of a small aliquot was tested. Samples were then subjected to TMTpro labeling.
Fe2+-NTA phosphopeptide enrichment
Phosphopeptides (Figure S1F) and TMTpro-labeled phosphopeptides (Figure S5A, S6G, and S9A) were enriched using Pierce High-Select Fe2+-NTA phosphopeptide enrichment kit following the manufacturer’s protocol. In brief, dried peptides were enriched for phosphopeptides and eluted into a tube containing 25 μl 10% formic acid (FA) to neutralize the pH of the elution buffer and dried down. The unbound peptides (flow-through) and washes were combined and saved for total proteome analysis.
Tandem mass tag labeling
Proline-based reporter isobaric Tandem Mass Tag (TMTpro) labeling of dried peptide samples resuspended in 100 mM EPPS pH 8.5, was carried out as follows. For total proteome analysis (100 μg peptide) and for phosphopeptides (Figure S1F, desalted, eluted peptides from phospho-enrichment step), TMTpro reagent was added to samples, along with acetonitrile to achieve a final acetonitrile concentration of approximately 30% (v/v). Following incubation at room temperature for 1 h, the labeling efficiency of a small aliquot was tested for each set, and the reaction was then quenched with hydroxylamine to a final concentration of 0.5% (v/v) for 15 min. The TMTpro-labeled samples were pooled together at a 1:1 ratio. The total proteome sample and phospho-proteome sample were vacuum centrifuged to near dryness and subjected to C18 solid-phase extraction (SPE).
Off-line basic pH reversed-phase (BPRP) fractionation.
For Phospho-peptides (Figures S5A, S6G, and S9A), dried TMTpro-labeled peptides were fractionated according to the manufacturer’s instructions using High pH reversed-phase peptide fractionation kit for a final 6 fractions and subjected to C18 StageTip desalting prior to MS analysis. Flow through containing non-phosphorylated peptides was subjected to C18 solid-phase extraction prior to fractionation for whole proteome analysis.
The dried TMTpro-labeled sample was resuspended in 100 μl of 10 mM NH4HCO3 pH 8.0 and fractionated using basic pH reverse phase HPLC94. Briefly, samples were off-line fractionated over a 90 min run, into 96 fractions by high pH reverse-phase HPLC (Agilent LC1260) through an: 1) aeris peptide xb-c18 column (Phenomenex; 250 mm × 3.6 mm) for total proteome, 2) kinetex EVO-c18 column (Phenomenex; 150 mm × 2.1 mm) for phospho-proteome (Figure S1F), with mobile phase A containing 5% acetonitrile and 10 mM NH4HCO3 in LC-MS grade H2O, and mobile phase B containing 90% acetonitrile and 10 mM NH4HCO3 in LC-MS grade H2O (both pH 8.0). The 96 resulting fractions were then pooled in a non-continuous manner into 24 fractions95. Fractions were vacuum centrifuged to near dryness. Each consolidated fraction was desalted via StageTip, dried again via vacuum centrifugation, and reconstituted in 5% acetonitrile, 1% formic acid for LC-MS/MS processing.
Total proteomics analysis using TMTpro.
Mass spectrometry data were collected using an Orbitrap Eclipse Tribrid mass spectrometer coupled to an UltiMate 3000 RSLCnano system liquid chromatography (LC) pump. Peptides were separated on a 100 μm inner diameter microcapillary column packed in-house with ~40 cm of HALO Peptide ES-C18 resin (2.7 μm, 160 Å, Advanced Materials Technology, Wilmington, DE) with a gradient consisting of 5%–21% (0–85 min), 21–28% (85–110 min) (acetonitrile, 0.1% FA) over a total 120 min run at ~500 nl/min. For analysis, we loaded 1/10 of each fraction onto the column. Each analysis used the Multi-Notch MS3-based TMT method96, to reduce ion interference compared to MS2 quantification97, combined with the FAIMS Pro Interface (using previously optimized 3 CV parameters for TMT multiplexed samples98 and combined with newly implemented Real-Time Search analysis software99,100. The scan sequence began with an MS1 spectrum (Orbitrap analysis; resolution 120,000 at 200 Th; mass range 400−1500 m/z; automatic gain control (AGC) target 4×10⁵; maximum injection time 50 ms). Precursors for MS2 analysis were selected using a cycle type of 1.25 sec/CV method (FAIMS CV=−40/−60/−80). MS2 analysis consisted of collision-induced dissociation (quadrupole ion trap analysis; Rapid scan rate; AGC 1.0×10⁴; isolation window 0.5 Th; normalized collision energy (NCE) 35; maximum injection time 35 ms). Monoisotopic peak assignment was used, and previously interrogated precursors were excluded using a dynamic window (90 s ±10 ppm). Following the acquisition of each MS2 spectrum, a synchronous-precursor-selection (SPS) API-MS3 scan was collected on the top 10 most intense ions b or y-ions matched by the online search algorithm in the associated MS2 spectrum99,100. MS3 precursors were fragmented by high energy collision-induced dissociation (HCD) and analyzed using the Orbitrap (NCE 45; AGC 2.5×10⁵; maximum injection time 200 ms, resolution was 50,000 at 200 Th). The closeout was set at two peptides per protein per fraction so that MS3s were no longer collected for proteins having two peptide-spectrum matches (PSMs) that passed the quality filters100.
Phosphoproteomics analysis using TMTpro
Mass spectrometry data were collected using an Orbitrap Eclipse Tribrid mass spectrometer coupled to an UltiMate 3000 RSLCnano system liquid chromatography (LC) pump. For Figure S1F, peptides were separated on a 50 cm μPAC column (PharmaFluidics, Ghent, Belgium) with a gradient of acetonitrile (0.1% FA) over a total 125 min run at ~250 nl/min. For Figures S5A, S6G, and S9A, peptides were separated on a 100 μm inner diameter microcapillary column packed in-house with ~40 cm of HALO Peptide ES-C18 resin (2.7 μm, 160 Å, Advanced Materials Technology, Wilmington, DE) with a gradient of acetonitrile (0.1% FA) over a total 120 min run at ~500 nl/min. For analysis, we loaded half of each fraction onto the column. Each analysis used the FAIMS Pro Interface (using previously optimized 3 CV parameters for TMTpro-labeled phosphopeptides101) to reduce ion interference. The scan sequence began with an MS1 spectrum (Orbitrap analysis; resolution 120,000 at 200 Th; mass range 400−1500 m/z; automatic gain control (AGC) target 4×10⁵; maximum injection time 50 ms). Precursors for MS2 analysis were selected using a cycle type of 1.25 sec/CV method (FAIMS CV=−40/−60/−80). MS2 analysis consisted of high energy collision-induced dissociation (HCD) (Orbitrap analysis; resolution 50,000 at 200 Th; isolation window 0.5 Th; normalized collision energy (NCE) 38; AGC 2×10⁵; maximum injection time 86 ms). Monoisotopic peak assignment was used, and previously interrogated precursors were excluded using a dynamic window (120 s ±10 ppm).
Data analysis
Mass spectra were converted to mzXML102 and processed using the open-source Comet search engine (2020.01 rev. 4) software pipeline103 with the Human Reference Proteome (2020–03 - SwissProt entries only) UniProt database with contaminants and reverse decoy sequences appended. Searches were performed using a 50 ppm precursor ion tolerance for analysis. For total proteomic analysis, the recommended product ion parameters for ion trap were used (1.0005 tolerance, 0.4 offset (mono masses), theoretical fragment ions = 1). For phosphoproteomics analysis, the recommended product ion parameters for high-resolution were used (0.02 tolerance, 0.0 offset (mono masses), theoretical fragment ions = 0). TMTpro tags on lysine residues and peptide N termini (+304.207 Da) and carbamidomethylation of cysteine residues (+57.021 Da) were set as static modifications, while oxidation of methionine residues (+15.995 Da) was set as a variable modification. For the phosphorylation dataset search, phosphorylation (+79.966 Da) on Serine, Threonine, or Tyrosine was set as additional variable modifications. Search results were first filtered to a 1% peptide FDR using linear discriminant analysis employing a target-decoy strategy and further filtered to obtain a protein level FDR of 1%104–106. Moreover, protein assembly was guided by principles of parsimony to produce the smallest set of proteins necessary to account for all observed peptides. For TMTpro-based reporter ion quantitation, we extracted the summed signal-to-noise (S:N) ratio for each TMTpro channel and found the closest matching centroid to the expected mass of the TMT reporter ion (integration tolerance of 0.003 Da). Reporter ion intensities were adjusted to correct for the isotopic impurities of the different TMTpro reagents according to manufacturer specifications. Proteins were quantified by summing reporter ion signal-to-noise measurements across all matching PSMs, yielding a “summed signal-to-noise” measurement. For total proteome, PSMs with poor quality, MS3 spectra with 8 or more TMTpro reporter ion channels missing, or isolation specificity less than 0.5, or with TMT reporter summed signal-to-noise ratio that were less than 160 or had no MS3 spectra were excluded from quantification. For phospho-proteome, PSMs with poor quality, MS3 spectra with 10 (Figure S1F), 12 (Figure S5A, S6G, and S9A) or more TMT reporter ion channels missing, or isolation specificity less than 0.8, or with TMT reporter summed signal-to-noise ratio that were less than 160 (Figure S1F), 120 (Figure S5A, S6G, and S9A) or had no MS3 spectra were excluded from quantification. Phosphorylation site localization was determined using the AScorePro algorithm107,108. AScore is a probability-based approach for high-throughput protein phosphorylation site localization. Specifically, a threshold of 13 corresponded to 95% confidence in site localization.
Protein or peptide quantification values were exported for further analysis in Microsoft Excel, GraphPad Prism, R109 in RStudio110, and Perseus111. Each reporter ion channel was summed across all quantified proteins and normalized, assuming equal protein loading of all samples. Phospho peptides were normalized to the protein abundance value (when available), and then normalization and PCA of the dataset were performed using PhosR package112. Hotelling’s t-squared statistic (T2) statistical analysis87 was performed using the timecourse R package113. K-means clustering and biplot were performed using JMP114.
Tables S1–S4 list all quantified proteins as well as the associated TMTpro reporter ratio to control channels used for quantitative analysis.
RPS10 di-ubiquitylated quantification and analysis.
An aliquot of whole proteome fraction from WT and ‘GCN2 cells (Figure S9A) was analyzed using a targeted-MS2 workflow using an Orbitrap Eclipse Tribrid mass spectrometer coupled to an UltiMate 3000 RSLCnano system liquid chromatography (LC) pump. Peptides were separated on a 100 μm inner diameter microcapillary column packed in-house with ~40 cm of HALO Peptide ES-C18 resin (2.7 μm, 160 Å, Advanced Materials Technology, Wilmington, DE) with a gradient of acetonitrile (0.1% FA) over a total 50 min run at ~500 nL/min. To analyze the RPS10 diGly modified TMTpro-labeled peptide, the FAIMS Pro Interface was utilized with a single predetermined optimal CV of −40. For the targeted window time, the scan sequence began with an MS1 spectrum (Orbitrap analysis; resolution 120,000 at 200 Th; mass range 1078–1278 m/z; automatic gain control (AGC) target 8×10⁵; maximum injection time 100 ms). Precursors for MS2 analysis were selected if matching the targeted mass (1178.3036, z=+3) with a ± 20 ppm mass tolerance. MS2 analysis consisted of high energy collision-induced dissociation (HCD) (Orbitrap analysis; resolution 50,000 at 200 Th; isolation window 0.5 Th; normalized collision energy (NCE) 38; AGC 2.5×10⁵; maximum injection time 400 ms). Data were searched using the open-source Comet search engine (2020.01 rev. 4) with the Human Reference Proteome (2022–03 - SwissProt entries only) UniProt database with contaminants and reverse decoy sequences appended. Precursor error tolerance was 50 ppm, and fragment error tolerance was 0.02 Da. Static modifications include Cysteine carbamidomethylation (+57.0215 Da) and TMTpro16 (+304.2071 Da) on Lysine side chains and peptide N-termini. A maximum of two GlyGly modification (+114.0429 Da) events were allowed as variable modification. Search results were first filtered to a 1% peptide FDR using linear discriminant analysis employing a target-decoy strategy and further filtered to obtain a protein level FDR 1%. TMTpro reporter ion signal was extracted by allowing a 0.003 Da mass tolerance, and signal-to-noise ratios were calculated for each channel. Spectrum annotation for the RPS10 diGly site (Figure S11G) was generated using IPSA115.
Serine/threonine kinase predictions
Kinase predictions were based on recently published experimental biochemical data of their substrate motifs42. In brief, synthetic peptide libraries, containing 198 peptide mixtures that explore amino acid preference up to 5 residues N-terminal and C-terminal to the phosphorylated Ser/Thr were utilized to determine the optimal substrate sequence specificity for recombinant Ser/Thr kinases. In total, 303 kinases were profiled. Their motifs were quantified into position-specific scoring matrices (PSSMs) and then applied computationally to score phosphorylation sites based on their surrounding amino acid sequences. These PSSMs were ranked against each site to identify the most favorable kinases.
The Kinase Library enrichment analysis
The phosphorylation sites detected in this study were scored by all the characterized kinase PSSMs (303 S/T kinases), and their ranks were determined42. For every non-duplicate, singly phosphorylated site, kinases that ranked within the top-15 out of the 303 S/T total kinases were considered as biochemically predicted kinases for their respective phosphorylation site. For assessing kinase motif enrichment, we compared the percentage of phosphorylation sites for which each kinase was predicted among the downregulated/upregulated phosphorylation sites (sites with |log2 fold change| greater than or equal 1 and with FDR less than or equal to 0.1), versus the percentage of biochemically favored phosphorylation sites for that kinase within the set of unregulated sites in this study (sites with |log2 fold change| less than 1 and with FDR greater than 0.1). Statistical significance was determined using a one-sided Fisher’s exact test, and the corresponding p-values were adjusted using the Benjamini-Hochberg procedure. Kinases that were significant (adjusted p-value 0.1) for both upregulated and downregulated analysis were excluded from downstream analysis. Then, for every kinase, the most significant enrichment side (upregulated or downregulated) was selected based on the adjusted p-value and presented in the scatterplot.
ZAK co-immunoprecipitation
MCF10a ΔZAK cells complemented with stably-expressing mNeonGreen-tagged ZAK were seeded at 2 × 10^6 cells per plate and allowed to grow for 48 h. At 48 h cells were replenished with fresh media. 1 h post media change, cells were treated with DMSO (mock, UT × 2) or a sub-inhibitory dose of ANS (0.38 μM, ANS × 2) to induce collisions and returned to 37°C for 45 min, after which cells were lysed by aspirating media, immediately rinsed with warm PBS (37°C, pH 7.4; Thermo Fisher) supplemented with 377 μM ANS to freeze ribosomes in situ, and lysed in the following lysis buffer (50 mM HEPES pH 7.4, 100 mM KOAc, 15 mM Mg(OAc)2, 5% Glycerol) supplemented with 0.25% NP-40 alternative, 377 μM ANS, 50 μM PR-619 (Life Sensors SI9619), 1x Halt EDTA-free protease and phosphatase inhibitor cocktail (Thermo 78445), 1 mM TCEP and 8 units/ml Turbo DNase (Thermo Fisher). Lysates were clarified as described previously, RNA concentration from clarified cell lysates were measured using Qubit RNA BR (Broad-Range) Assay kit (Thermo Q10211) with a Qubit Fluorometer and equal amounts of lysates for untreated (UT) and low dose ANS-treated samples were incubated with ChromoTek mNeonGreen-Trap Agarose beads (Proteintech ntak) as per manufacturer’s instructions for 1 h (at 4°C) with gentle rocking. Following incubation, the flow-through was removed and the beads were washed with lysis buffer supplemented with 0.05 % NP-40 alternative, 50 μM PR-619, 377 μM ANS (3 × 10 min, 4°C), followed by 3 × 10 min (4°C) washes with lysis buffer not containing glycerol or detergent. Proteins were eluted from the beads using 200 mM glycine pH 2.5, pH neutralized immediately and processed for MS.
Protein Digestion
Protein extracts were buffer exchanged using SP3 paramagnetic beads (GE Healthcare)116. Briefly, samples were brought up to 100 μl with 10 mM TEAB + 1% SDS and disulfide bonds reduced with 10 μl of 50 mM dithiothreitol for 1 h at 60°C. Samples were cooled to RT and pH adjusted to ~7.5, followed by alkylation with 10 μl of 100 mM iodoacetamide in the dark at RT for 15 minutes. Next, 100 μg (2 μl of 50 μg/μl) SP3 beads were added to the samples, followed by 120 μl 100% ethanol. Samples were incubated at RT with shaking for 5 minutes. Following protein binding, beads were washed with 180 μl 80% ethanol three times. Proteins were digested on-bead with trypsin (Pierce) at 37°C overnight (1 μg enzyme). Supernatant was removed from the beads and acidified by adding 5 μl of 1% formic acid prior to mass spectrometry analysis.
Liquid Chromatography and Mass Spectrometry
Peptides were analyzed by reverse-phase chromatography tandem mass spectrometry on a Neo Vanquish uHPLC interfaced with a Orbitrap Fusion Lumos mass spectrometer (Thermo Fisher). Peptides were separated using a 0%–100% acetonitrile in 0.1% formic acid gradient over 90 min at 300 nl/min. The 75 μm × 25 cm column (ESI Source Solutions) was packed in house with ReproSIL-Pur-120-C18-AQ (2.4μm, 120 Å bulk phase, Dr. Maisch). Survey scans of precursor ions were acquired in a 3 sec cycle time, from 350–1800 m/z at 120,000 resolution at 200 m/z, automatic gain control (AGC) of 4×10⁵, and an RF lens setting of 45% and internal mass calibration. Precursor ions were individually isolated within 1.5 m/z by data dependent acquisition with a 15s dynamic exclusion, and fragmented using an HCD activation with a collision energy of 30. Fragment ions were analyzed in the orbitrap at 30,000 resolution and AGC of 5×10⁴.
Data analyses
Raw data was processed and analyzed using the MaxQuant (2.1.3.0) software suite117. Default settings were used except that ‘Match between runs’ was turned on to transfer peptide identification from an LC-MS run, in which the peptide has been identified by MS/MS, to another LC-MS run, in which no MS/MS data for the same peptide was acquired or no peptide was assigned117. Search parameters were as follows: a maximum of two missed cleavages were allowed, cysteine carbamidomethylation was included as a fixed modification, and variable modifications included oxidation of methionine, protein N-terminal acetylation, deamidation of glutamine and asparagine, and phosphorylation on Serine, Threonine, and Tyrosine. Trypsin was used as the digestion enzyme, and the minimal peptide length was set to 7 amino acids. Searches were performed using a 20-ppm precursor ion tolerance for total protein level analysis. Database search was performed with Andromeda against Uniprot human database (UP000005640_9606.fasta; downloaded on 09/10/2018) with common serum contaminants and enzyme sequences. False discovery rate (FDR) was set to 1% at peptide spectrum match (PSM) and protein level. Minimum peptide count required for protein quantification was set to two. Protein groups were further analyzed using the Perseus111. Common contaminants, reverse proteins and proteins only identified by site were filtered out. LFQ values were transformed to log2 space and intensity distributions were checked to ensure that data was normally distributed.
ZAK degradation assays
MCF10a ΔZAK cells stably expressing different variants of ZAK were seeded the day prior to harvest and allowed to grow for 24 h. At 24 h, cells were replenished with fresh media supplemented with 10% FBS. Approximately 1 h post-media change, cells were pre-treated for 1 h with DMSO (mock), MLN4924 (2 μM, ApexBio B1036) or Bortezomib (0.5 μM, Cell Signaling 2204). Following inhibitor pre-treatment (where applicable), collisions were induced by UV-C treatment (500 J/m2) or by adding ANS to the culture medium at a sub-inhibitory concentration of 0.38 μM, gently swirling the plate, and returning the cells to 37°C for the indicated times. For immunoblotting, cells were lysed and samples were processed as described previously. To quantify immunoblots, ZAK protein levels were first normalized to the loading control (actin). Relative ZAK levels at individual time points post-ANS treatment were determined by normalizing to ZAK protein level at time 0 h. ZAK protein level (relative to time point 0 h) versus time (h) post-ANS treatment were fit to a one-phase exponential decay model (y = (y0 - plateau)*e−kt + plateau, where y0 is relative ZAK level at 0 h, plateau = relative ZAK levels at time = ∞, k = exponential decay constant, t = time) to estimate half-lives (t1/2).
β-TrCP2 (FBXW11) and β-TrCP1 (FBXW1A) co-immunoprecipitation
HEK293T cells were seeded at 2 × 10^6 cells per plate and allowed to grow for 24 h. At 24 h cells were transfected with 5 μg of pcDNA-DEST53–3x-FLAG-β-TrCP2(FBXW11) or pcDNA-DEST53–3x-FLAG-β-TrCP1(FBXW1A) and allowed to grow for 24 h. After 24 h cells were replenished with fresh media. 1 h post media change, cells were left untreated or treated with 500 J/m2 UV-C to induce collisions and returned to 37°C for 30 min, after which cells were lysed by aspirating media, immediately rinsed with warm PBS (37°C, pH 7.4; Thermo Fisher) supplemented with 377 μM ANS to freeze ribosomes in situ, and lysed in the following lysis buffer (50 mM HEPES pH 7.4, 100 mM KOAc, 15 mM Mg(OAc)2, 5% Glycerol) supplemented with 0.25% NP-40 alternative, 377 μM ANS, 50 μM PR-619 (Life Sensors SI9619), 1x Halt EDTA-free protease and phosphatase inhibitor cocktail (Thermo 78445), 1 mM TCEP and 8 units/ml Turbo DNase (Thermo Fisher). Lysates were clarified as described previously, RNA concentration from clarified cell lysates were measured using Qubit RNA BR (Broad-Range) Assay kit (Thermo Q10211) with a Qubit Fluorometer and equal amounts of lysates for untreated (UT) and UV-treated samples were incubated with Anti-FLAG® M2 Magnetic beads (Millipore Sigma M8823) as per manufacturer’s instructions for 1 h (at 4°C) with gentle rocking. Following incubation, the flow-through was removed and the beads were washed with lysis buffer supplemented with 0.05 % NP-40 alternative, 50 μM PR-619, 377 μM ANS (3 × 10 min, 4°C), followed by 3 × 10 min (4°C) washes with lysis buffer not containing glycerol or detergent. Proteins were eluted from the beads using 400 μg/ml 3x-FLAG-peptide and processed for immunoblotting as described previously.
AHA translatomics
AHA labeling protocol was adapted from An et al., 2020118. HaCaT cells (2 × 10^6) were plated onto 10 cm dishes 24 h before the experiment. Cells were conditioned in fresh media for 2 h on the day of the experiment, then starved for methionine in DMEM media (Sigma D0422, supplemented with 4.6 mM L-glutamine (Thermo 21051024), 0.6 mM L-cysteine (Sigma C7352), and 10% dialyzed FBS (Thermo A3382001) containing no methionine (-Met, 1 h), pulsed for 2 h in DMEM (-Met) media (as above) supplemented with 1 mM azidohomoalanine (AHA) (Thermo C10102) which is incorporated into newly-synthesized proteins in place in methionine, followed by AHA washout (1 h) by placing cells in DMEM media (as above) supplemented with excess (2 mM) methionine (Sigma M5308) (1 h). Cells were then treated (duplicates per sample per timepoint, Figure S12C) with DMSO (mock) or a sub-inhibitory dose of ANS (0.38 μM) to induce collisions, and harvested at specified time points by washing (2x) with 10 ml PBS supplemented with 377 μM ANS, followed by adding ice-cold lysis buffer (RIPA buffer (Thermo 89900), supplemented with 1x Halt EDTA-free protease and phosphatase inhibitor cocktail (Thermo 78445), 10 mM sodium phosphate dibasic (Na2HPO4.7H2O), 10 mM β-glycerophosphate, 42.5 units/ml Benzonase, 377 μM ANS, and 1 mM TCEP to each plate. Plates were swirled gently to evenly distribute lysis buffer, cells were scraped from the plate using a cell scraper, gently pipetted to homogenize the cell lysate, and transferred to ice for 5–10 min to complete lysis. Lysates were clarified by brief centrifugation at 14000 × g (8 min, 4°C) and the clarified supernatant was transferred to a fresh tube on ice. Protein concentrations of prepared lysates were determined by BCA assay (Thermo 23225) according to the manufacturer’s instructions. 500 μg of the lysate for each condition was reduced with 5 mM DTT (1 h, 56°C), cooled down to room temperature, alkylated with iodoacetamide (14 mM, 45 min, RT, protected from light), and quenched with DTT. ChCl3/MeOH precipitation was performed to remove residual unincorporated AHA from lysates and the white protein disk was resuspended in 2% SDS resuspension buffer (50 mM HEPES pH 7.2, 150 mM NaCl, 2.5 mM TCEP) using sonication. The resuspended lysate was reacted with click reagents (final concentration: 1 mM CuSO4, 1 mM sodium ascorbate, 100 μM TBTA, 1 % SDS, 100 μM biotin-PEG4-Alkyne (Click Chemistry, TA105), and the mixture incubated (2 h, room temperature) with gentle rocking. A parallel click reaction was carried out with TAMRA-Alkyne (Thermo T10183, 2 h, room temperature, protected from light) for in-gel fluorescence analysis. ChCl3/MeOH precipitation was performed to remove excess biotin-PEG4-Alkyne (or TAMRA-Alkyne), and the samples were resuspended in 200 μl 2% SDS, 2.5 mM TCEP buffer using sonication, followed by dilution with 600 μl RIPA buffer to adjust the final SDS concentration to 0.5%. 20 μl of Pierce High Capacity Streptavidin Agarose (Thermo 20357, capable of binding 2 mg of biotinylated sample) beads per sample (400 μl for 20 samples) was prepared by washing the beads with PBS (3x) and RIPA buffer (2x). 20 μl of prepared beads were incubated with resuspended lysate (O/N, room temperature), washed 3x with RIPA buffer, 3x with [50 mM HEPES, 1 M KCl, 0.1 M Na2CO3, 2 M urea] buffer, 2x with RIPA buffer, and eluted by boiling in SDS loading buffer (15 min, 95°C). The eluate was processed for immunoblotting (as described previously) or resolved by SDS-PAGE for Coomassie staining. Samples for in-gel fluorescence analysis were resolved by SDS-PAGE, and TMR signal was detected using a Typhoon imager (Molecular Dynamics). To quantify immunoblots, ZAK protein levels were first normalized to the loading control (Ponceau staining, Thermo A40000279). Relative ZAK levels at individual time points were determined by normalizing to ZAK protein level at time 0 h for each condition. ZAK protein level (relative to time point 0 h) versus time (h) post-ANS treatment were fit to a one-phase exponential decay model (y = (y0 - plateau)*e−kt + plateau, where y0 is relative ZAK level at 0 h, plateau = relative ZAK levels at time = ∞, k = exponential decay constant, t = time) to estimate half-lives (t1/2).
Fixed-cell immunofluorescence microscopy
For immunofluorescence analysis, MCF10a cells were grown on 12-mm glass coverslips. Cells were rinsed with PBS once and directly fixed in 100% MeOH at −20°C for 7 min. Cells were blocked in 2.5% FBS, 200 mM glycine, and 0.1% Triton X-100 in PBS for 1 h. Antibody incubations were conducted in the blocking solution for 1 h. DNA was stained with DAPI and cells were mounted in ProLong Gold Antifade (Invitrogen). Staining was performed with the following primary antibodies: phospho-JNK1/JNK2 (Thr183, Tyr185) (chicken; Invitrogen, PA1–9594; 1:200), phospho-Histone H2A.X (Ser139) (mouse; Millipore Sigma, 05–636, 1:1000), Phospho-Chk1 (Ser345) (rabbit; Cell Signaling, 76784, 1:400), CPD (mouse, Clone TDM-2, Cosmo Bio, 1:800), PCNA (mouse, Abcam, PC10, 1:800). For the detection of UV-induced photolesions, fixed cells were denatured using 2 M HCl for 10 minutes at 37°C, followed by rinsing with phosphate-buffered saline (PBS) to remove the HCl, prior to the blocking step. It is noteworthy that this denaturation step resulted in our inability to detect phospho-JNK1/JNK2 and phospho-CHEK1, a limitation that has been previously reported119. Immunofluorescence images were collected using a Deltavision Elite system (GE Healthcare) controlling a Scientific CMOS camera (pco.edge 5.5). Acquisition parameters were controlled by SoftWoRx suite (GE Healthcare). Images were collected at room temperature (25 °C) using an Olympus 60× 1.42 NA oil objective at 0.2-μm z-sections. Images were acquired using Applied Precision immersion oil (N = 1.516).
Live imaging setup and quantification
Imaging was performed as previously described120. Briefly, 1 − 3 × 10^4 cells were plated 48 h before imaging onto glass-bottom 96 well imaging plates (CellVis D35-20-1.5-N) coated with 10 mg/l fibronectin (EMD Millipore FC010). 24 h later, the media was exchanged for imaging media (phenol red-free DMEM/F12 with 1% Glutamax, 2.5% equine serum, and 20 ng/ml EGF). Cells were imaged on a Nikon Eclipse Ti-E inverted fluorescence microscope with an Andor Neo 5.5 or Hamamatsu sCMOS camera. Images were taken every 5–10 min, light intensity and exposure were minimized to limit phototoxicity. Nuclear identification was done with Python-based neural net segmentation as previously described121. KTR intensity ratios were calculated as median cytoplasmic fluorescence divided by median nuclear fluorescence. For quantification of mNeonGreen-ZAK expression levels, the median cytoplasmic intensity was used and the expression was normalized to the fluorescence at the start of imaging.
Cell fate assays
Quantification of S/G2 cell fates was done manually with the help of a custom Matlab122 script that identifies cells of interest for each condition and presents tracked movies of individual cells in a blinded and randomized order for annotation91. S/G2 cells were identified based on CDK2 activity (DHB-mTurqoise2 C/N fluorescence ratio > 1.1), and fates were determined using H2B-iRFP and the CDK2 reporter as described previously91. Mitosis was identified by chromatin condensation, nuclear envelope breakdown, and cell division. G2 arrest was identified by persistent CDK2 activity without mitosis as described previously91. Cell death was identified by nuclear fragmentation and cell lysis.
Automated cell death measurements were performed using the CellEvent™ Caspase-3/7 Green Detection Reagent (Thermo C10723). Following addition of stimulus, cells were incubated with 10 μM CellEvent™ Caspase Reagent. Changes in green fluorescence were measured, and a fluorescence threshold identified dying cells that cleaved the CellEvent™ Caspase-3/7 Reagent. Manual cell death measurements were performed using H2B-iRFP and KTR fluorescence. Cell death was identified by nuclear fragmentation and cell lysis and quantified as the total number of cell death events divided by the total number of cells present at the time of stimulus.
Long-term growth assays
To identify optimal assay conditions, various cell densities (250, 500, 1000 cells per well) and UV doses (250, 500, 1000, 1500 J/m2) were evaluated. The choice of 500 cells/well and UV dose of 1000 J/m2 was selected in order to visualize separation between treatments; here the increased depth of media in 96 wells (6.7 mm for 0.2 ml media) compared to 6 well dishes (2 mm for 2 ml media) and 10 cm plates (0.32 mm for 10 ml media) may have contributed to the decrease in UV penetrance thereby requiring a higher UV dose. MCF10a cells were seeded in 96-well plates (500 cells per well) and allowed to recover for 24 h. 1 h prior to 1000 J/m2 UV-C treatment, cells were pre-treated with the indicated chemical inhibitors. Cell confluency was measured post UV-C exposure using a CELLCYTE X™ imager (CYTENA) once every 24 h for the duration of 7 days. Proliferation curves were generated using cell confluency as a proxy for cell numbers. It is important to note that this growth assay setup primarily assesses overall cell confluency and thus has inherent limitations in discerning outcomes potentially influenced by the prevalence of highly proliferative clones.
QUANTIFICATION AND STATISTICAL ANALYSIS
General data analysis
Unless specified otherwise, all quantitative experiments included triplicate data points and were averaged with standard deviation (SD). The statistical tests employed are noted in the figure legends and relevant methods sections.
Phosphoproteomics and total proteomics
Details on data acquisition, quantification, and statistical analysis for phosphoproteomics, total proteomics, kinase enrichment analysis, RPS10-di-ubiquitylation, and ZAK co-immunoprecipitation are described above in the Proteomics and ZAK co-immunoprecipitation sections. Experiments were conducted in biological duplicate or triplicate as specified. Protein or peptide quantification values were exported for further analysis in Microsoft Excel, GraphPad Prism, R109 in RStudio110, and Perseus111 as indicated. For TMT analysis, each reporter ion channel was summed across all quantified proteins and normalized, assuming equal protein loading of all samples. Phosphopeptides were normalized to protein abundance value (when available), and then normalization and PCA of the dataset were performed using PhosR package112. Hotelling’s t-squared statistic (T2) statistical analysis was performed using the timecourse R package113. K-means clustering and biplot were performed using JMP114. Additional details can be found in the figure legends and relevant methods sections.
Immunoblot quantification
The intensity of protein bands and smears was quantified using ImageJ123. Quantification values were exported for further analysis in GraphPad Prism. Statistical details can be found in the figure legends and relevant methods sections.
Cell fate assays
Quantification of S/G2 cell fates was done manually with the help of a custom Matlab script91,122 as described above. For apoptosis assays, cell death was identified by nuclear fragmentation and cell lysis and quantified as the total number of cell death events divided by the total number of cells present at the time of stimulus. Subsequent analysis was performed using Matlab122. Statistical details can be found in the figure legends and relevant methods sections.
Long-term growth assays
Experiments were performed in biological triplicates. Cell confluency was measured post UV-C exposure using a CELLCYTE X™ imager (CYTENA) once every 24 h for the duration of 7–8 days as indicated. Quantification values were exported for further analysis in GraphPad Prism.
ADDITIONAL RESOURCES
The phosphoproteomics datasets can be accessed online to examine the data at a gene-specific level: (https://ordureau-lab.shinyapps.io/Sinha-Shinyapp/)
Supplementary Material
(A) Whole cell extracts from HaCaT and MCF10a cells treated with varying fluences of UV-C (J/m2) and harvested 15 minutes post-UV were analyzed by Phos-tag gels and immunoblotting for ZAK. (B) Quantification of fractional ZAK phosphorylation in response to UV as in (A). Fraction ZAK phosphorylated in HaCaT (blue) and MCF10a (orange) cells (ZAK-P, relative to untreated (0 J/m2 UV-C)) versus UV fluence (J/m2) were fit to a four-parameter dose-response curve to estimate the EC50 and Hill coefficient (nH). ZAK’s stimulus-response curves were steeply sigmoidal (Hill coefficient (nH) ~ 3.8 and 5 for HaCaT and MCF10a respectively). (C) Whole cell extracts from HaCaT cells treated with varying fluences of UV-C (J/m2) and harvested 15 minutes post-UV were analyzed by Phos-tag gels (for ZAK and GCN2) or SDS-PAGE and immunoblotted (IB) with the indicated antibodies. (D) 10–50% sucrose gradients from HaCaT cells left untreated (UT) or treated with 500 J/m2 UV-C and allowed to recover for 30 min post-UV treatment. Fractions analyzed by immunoblotting for EDF1. (E) MCF10a cells expressing H2B-iRFP were pretreated (1 h) with DMSO (mock) or ZAK inhibitor (PLX4720, 5 μM) before being treated with or without UV-C (500 J/m2) and live imaged. Mitosis counting was automated using H2B-iRFP, and the mitotic rate was calculated as a 2-hour sliding window average number of mitoses. (F) Schematic of TMTpro-based time-resolved phosphoproteomics and proteomics. HaCaT cells were left untreated (UT) or treated with 500 J/m2 UV-C and allowed to recover for 1, 5, 15, or 30 minutes. Four biological replicates were collected for the 1-minute time-point and three biological replicates were collected for UT samples and all other time points. As indicated, 16-plex TMTpro-based phosphoproteomics and proteomics were performed with biological replicates per condition (see Table S1). (G-J) Volcano plots (−log10[p-value] versus log2[ratio]) display the differences in protein abundance between cells retrieved at 1, 5, 15, and 30 minutes after UV-C treatment and the untreated (UT) sample (see panel F). Statistically, up- or down-regulated proteins were determined by a two-sided Welch’s t-test (adjusted to 1% FDR for multiple comparisons). Dotted lines delineate r1.5-fold change (x-axis) and 0.05 p-value (y-axis). non-significant (ns). We quantified 9647 proteins for total proteomics and compared their differential abundance relative to UT cells across the four time points. Only two proteins, NLRP3 and TTC28, were significantly upregulated (fold change > 1.5, p-value < 0.05) at 1, 15, and 30 minutes following UV-treatment. Additionally, we observed significant downregulation of several proteins 15–30 min post-UV treatment, including factors involved in regulating cell-cycle progression (CDC25A, CDC25B, MDM2, CCND1). Importantly, ~98% of the cellular proteome remained unperturbed during this post-UV time course. (Table S1, and HTML plots in Supp. Item). (K) Principal component analysis (PCA) of phosphoproteomics data obtained from 16-plex TMTpro-based analysis.
(A-B) Volcano plots (−log10[p-value] versus log2[ratio]) display differences in abundance of phosphosites assigned to protein kinases in HaCaT cells recovered for 5- and 30-min post-UV-C (500 J/m2) compared to untreated (UT) samples. Statistically, up- or down-regulated proteins were determined by a two-sided Welch’s t-test (adjusted to 1% FDR for multiple comparisons). Dotted lines delineate r1.5-fold change (x-axis) and 0.05 p-value (y-axis). non-significant (ns). Among protein kinases (n=2588 quantified sites), the most significantly upregulated sites in response to UV treatment were overrepresented on kinases involved in the RSR at both early (5 min) and late (30 min) time points (Table S1, and HTML plots in Supp. Item). (C-D) Same as in (A-B) except for phosphosites assigned to transcription factors (TFs). We observed robust phosphorylation on TFs that operate downstream of MAPKs (e.g., ATF2, ATF7, JUN, and JUND), on zinc-finger proteins (e.g., ZNF407, ZNF408, ZNF462, ZNF581, ZNF592, ZNF620, ZNF629, ZNF644, ZNF800), and general TFs (e.g., GTF2, HMGA1, NR3C1) all of which may induce transcriptional programs in response to UV. (E-F) Same as in (A-B) except for phosphosites assigned to ribosomal proteins. We captured UV-induced phosphorylation sites on several 40S ribosomal proteins (e.g., RPS2, RPS10, RPS20, RPS3, RPS26) that decorate the mRNA entry channel47,48, are proximal to the collided disome interface, or have previously been shown to be modified by E3 ubiquitin ligases32,33, suggesting that these sites may be phosphorylated by kinases that sense collisions. (G) Phosphosites (red dots) mapped to indicated ribosomal proteins (blue) overlaid on the structure of the human ribosome, shown in three orientations (PDB: 4UG0)85. (left) phosphosites decorating r-proteins at the mRNA entry channel on the 40S subunit. (middle and right) phosphosites on 60S and 40S r-proteins in two orientations; orange, helix 14 on 18S rRNA (nucleotides 460–480), previously mapped ZAK-binding site on ribosome16; green, E-site tRNA.
(A) Through k-means clustering analysis, we identified 14 distinct profiles of phosphosites in response to UV-stress using our time-resolved dataset. The number of phosphosites per cluster (n) is provided, and cluster means displayed in the bottom right panel (see Table S1). (B) Phosphosite-level PCA biplot obtained from time-resolved phosphoproteomics data displaying clockwise temporal pattern; color coding for each cluster as represented in panel A; circles drawn around cluster centers, with size proportional to count inside clusters. Proximal clusters on the biplot exhibited comparable trajectories (e.g., clusters 4, 9 and 11), antipodal clusters exhibited inverse trajectories (clusters 3 and 9), whereas orthogonal clusters exhibited uncorrelated trajectories (clusters 9 and 13). (C) Multivariate empirical Bayes analysis of time-resolved phosphoproteomics data from HaCaT cells. To understand the changes in the abundance of individual sites over a 30-minute time course, we performed a Hotelling T-squared distribution (T2) analysis86,87. The plot displays log10(time course T2 statistic) versus log2(ratio 30 min/UT). Each dot represents how the abundance of an individually quantified phosphosite changed during the 30-minute post-UV recovery period based on the 16 independent abundance measurements. The fourteen individual clusters from panel A are superimposed by color coding, enabling us to group similar clusters spatially. For example, clusters 9 and 11 represented sites that were dephosphorylated following UV treatment. In contrast, clusters 3 and 14 defined sites whose trajectories increased monotonically throughout the 30-minute period post-UV. Clusters centered between −1 and +1 on the x-axis and in the bottom half of the y-axis (clusters 1, 6, and 8) represented sites whose temporal trajectories were broadly unchanged following UV treatment. In contrast, cluster 13, located in the top-half of the y-axis, represented sites whose phosphorylation increased transiently between 5- and 15-min post-UV but returned to baseline by 30 minutes. Notably, this cluster contained phosphosites on factors associated with mTOR signaling (MTOR, RPTOR, RPS6KA1, RPS6KA3, EIF4B, TSC2), suggesting that mTOR signaling may be transiently upregulated in response to UV-induced elongation arrest but is restored to baseline within 30 minutes of UV exposure possibly through negative feedback (Table S1).
(A) Schematic depiction of the motif enrichment analysis pipeline42 to extract kinase-specific signatures from phosphoproteomics data in Figure S1F (see methods for details). (B-E) Kinases whose activities are significantly enriched or depleted in response to UV-C (500 J/m2) at 1, 5, 15, or 30-minutes post-UV are represented as volcano plots of −log10-transformed adjusted p-values versus log2-transformed frequency factors. Statistical significance was determined using one-sided exact Fisher’s test and p-values adjusted for multiple hypotheses using the Benjamini-Hochberg method. Statistically up- and down-regulated kinases are represented as orange and blue dots respectively (STAR methods for details; see Table S1, and animated HTML plot in Supp. Item). (F) Schematic depiction of kinase translocation reporter (KTR). MCF10a cells expressing JNK and p38 KTRs were treated with DMSO (mock), ANS (0.38 μM), or UV-C (500 J/m2). Scale bar = 10 μm. (G-H) MCF10a cells expressing JNK and p38 KTRs were pretreated (1 h) with DMSO (mock) or p38 inhibitor (SB 203580, 1.4 μM) before treatment with 500 J/m2 (panel G) or 1500 J/m2 (panel H) UV-C. Cells were live imaged every 30 seconds. Bold lines and shaded regions represent the median and 40th-60th percentiles, respectively.
(A) Schematic of TMT-based phosphoproteomics and proteomics. MCF10a WT and ΔZAK cells were mock-treated (DMSO) or pretreated (30 min) with a ZAK inhibitor (ZAKi, Nilotinib, 1 μM) and left untreated (UT) or treated with 500 J/m2 UV-C and allowed to recover for 15 minutes post-UV treatment. 16-plex TMTpro-based phosphoproteomics and proteomics was performed with two biological replicates per condition as indicated. (B) Volcano plot (−log10[p-value] versus log2[ratio]) displays the differences in the abundance of proteins in MCF10a cells lacking ZAK (ΔZAK) compared to parental wild-type (WT) cells. Statistically, up- or down-regulated proteins were determined by a two-sided Welch’s t-test (adjusted to 1% FDR for multiple comparisons). Dotted lines delineate r1.5-fold change (x-axis) and 0.05 p-value (y-axis). non-significant (ns). (Table S2, and HTML plots in Supp. Item). To account for changes in the total proteome in ΔZAK cells changes in phosphorylation were normalized to total protein levels (see Figure 2A; Table S2). (C) Principal component analysis (PCA) of phosphoproteomics data obtained from (A). (D) Phosphoproteome level correlation plot. The calculated correlation factors (Pearson (R) and R squared) and data fit are indicated. (HTML plots in Supp. Item) (E) Volcano plot (−log10[p-value] versus log2[ratio]) displays the differences in the abundance of phosphosites in response to UV-C between MCF10a ΔZAK cells pretreated (30 min) with ZAK inhibitor (ZAKi, Nilotinib, 1 μM) compared to ΔZAK (DMSO) mock-treated cells, as depicted in panel A. Statistically, up- or down-regulated phosphopeptides were determined by a two-sided Welch’s t-test (adjusted to 1% FDR for multiple comparisons). Dotted lines delineate a r1.5-fold change (x-axis) and a 0.05 p-value (y-axis). non-significant (ns). By comparing the effect of Nilotinib on UV-mediated changes in phosphosites in ΔZAK cells, we classified off-target effects from the inhibitor itself. This analysis revealed that Nilotinib specifically targets ZAK with only 60 additional sites affected in a ΔZAK background (Table S2, and HTML plots in Supp. Item).
(A) Nilotinib inhibits ZAK’s autophosphorylation activity with an IC50 of 0.1 μM in vivo. Phos-tag gel showing loss of UV-mediated (UV-C, 500 J/m2) ZAK autophosphorylation with increasing doses of Nilotinib. (bottom) Quantification of fractional ZAK phosphorylation (ZAK-P) in response to UV in HaCaT cells pre-treated for 30 minutes with indicated doses of Nilotinib. Fraction ZAK-P in response to UV versus Nilotinib (μM) were fit to a sigmoidal dose-response curve to estimate IC50. (B) Vemurafenib inhibits ZAK’s autophosphorylation activity with an IC50 of 0.1 μM in vivo. (C) A-92 inhibits GCN2’s autophosphorylation activity with an IC50 of 0.2 μM in vivo. (D) JNK inhibitor (JNKi) VIII inhibits JNK’s kinase activity with an IC50 of 1.6 μM in vivo. Immunoblot showing UV-C-mediated JUN (Ser-63) phosphorylation loss in cells pre-treated with increasing doses of JNKi VIII. Fraction JUN-P in response to UV-C versus JNKi VIII (μM) were fit to a sigmoidal dose-response curve to estimate IC50. (E) p38 inhibitor (p38i, SB 203580) inhibits p38’s kinase activity with an IC50 of 0.14 μM in vivo. Phos-tag gel showing loss of UV-C-mediated MSK2 phosphorylation with increasing doses of p38i. Fraction MSK2-P in response to UV-C versus p38i (μM) were fit to a sigmoidal dose-response curve to estimate IC50. (F) ATR inhibitor (ATR, VE-821) inhibits ATR’s kinase activity with an IC50 of 0.24 μM in vivo. Phos-tag gel showing loss of UV-C-mediated CHEK1 phosphorylation with increasing doses of ATRi. Fraction CHEK1-P in response to UV-C versus ATRi (μM) were fit to a sigmoidal dose-response curve to estimate IC50. (G) Schematic of TMTpro-based phosphoproteomics and proteomics in HaCaT cells. HaCaT cells were mock-treated (DMSO) or pretreated for 30 minutes with ZAKi (Nilotinib, 1 μM), p38i (SB 203580, 1.4 μM), JNKi (JNKi VIII, 16 μM), ZAKi (Vemurafenib, 1 μM), GCN2i (A-92, 2 μM) or ATRi (VE-821, 2.4 μM) and then left untreated (UT) or treated with 500 J/m2 UV-C (UV) and allowed to recover for 15 minutes post-UV treatment. 16-plex TMTpro-based phosphoproteomics and proteomics were performed with two biological replicates per condition as indicated (see Table S3). (H) Venn diagram showing overlap between statistically significant UV-mediated phosphorylation sites that are dependent on ZAKi (Nilotinib, Nil), p38i, JNKi, ZAKi (Vemurafenib, Vem), GCN2i (A-92), and ATRi (VE-821); number of significant phosphosites overlapping between pre-treatment regimes is indicated, with % overlap indicated in parenthesis (see Figure S7 and Table S3).
(A-B) Analysis of the phosphoproteomics experiment depicted in Figure S6G for ZAK kinase inhibitor. (A) Volcano plot (−log10[p-value] versus log2[ratio]) displays the differences in the abundance of phosphosites in response to UV-C (500 J/m2) treatment between HaCaT cells pretreated with a ZAK inhibitor (ZAKi, Nilotinib, 1 μM) compared to (DMSO) mock-treated cells, as depicted in Figure S6G. Statistically, up- or down-regulated phosphopeptides were determined by a two-sided Welch’s t-test (adjusted to 1% FDR for multiple comparisons). Dotted lines delineate a r1.5-fold change (x-axis) and a 0.05 p-value (y-axis). non-significant (ns). (B) Motif enrichment analysis of phosphoproteomics data presented in panel A. Kinases whose activities are up- or down-regulated (in orange and blue dots respectively) in response to UV-C (500 J/m2) in ZAKi compared to WT cells are represented in a volcano plot of log10-transformed adjusted p-values versus log2-transformed frequency factors. Statistical significance was determined using one-sided exact Fisher’s test and p-values adjusted for multiple hypotheses using the Benjamini-Hochberg method (see Table S3). (C-D) As in (A-B) but for HaCaT cells pretreated with p38i (SB 203580, 1.4 μM, 30 min pre-treatment) (E-F) As in (A-B) but for HaCaT cells pretreated with JNKi (JNKi VIII, 16 μM, 30 min pre-treatment) (G-H) As in (A-B) but for HaCaT cells pretreated with ATRi (VE-821, 2.4 μM, 30 min pre-treatment) (Table S3). For panels A, C, E, and G see HTML plots in Supp. Item.
(A) Phosphoproteome level correlation plot of the effect of p38i on UV response (y-axis) against the ZAKi (Nilotinib) effect on UV response (x-axis). The calculated correlation factors (Pearson (R) and R squared) and data fit are indicated. (B) Same as in (A) but for the JNKi effect on UV response (y-axis) against the ZAKi (Nilotinib) effect on the UV response (x-axis (C) Summary of notable targets regulated by p38 and JNK downstream of ZAK in response to UV-mediated ribotoxic stress. (D) Phosphoproteome level correlation plot of JNKi effect on ZAKi response to UV treatment (y-axis) versus p38i effect on ZAKi response to UV treatment (x-axis) (see text for details). (E) As in (A), but for the effect of ATRi on UV response (y-axis) against the ZAKi (Nilotinib) effect on UV response (x-axis). (F) As in (A), but for the effect of GCN2i on UV response (y-axis) against the ZAKi (Nil) effect on UV response (x-axis) (see Table S3, and HTML plots in Supp. Item).
(A) Schematic of TMTpro-based phosphoproteomics and proteomics. MCF10a WT and ΔGCN2 cells were mock-treated (DMSO) or pretreated (30 min) with a GCN2 inhibitor (GCN2i, A-92, 2 μM) and left untreated (UT) or treated with UV-C and allowed to recover for 15 minutes post-UV treatment. As indicated, 16-plex TMTpro-based phosphoproteomics and proteomics were performed with two biological replicates per condition. (B) Volcano plot of (−log10[p-value] versus log2[ratio]) displays the differences in the abundance of proteins in MCF10a cells lacking GCN2 (ΔGCN2) compared to parental wild-type (WT) cells. Statistically, up- or down-regulated proteins were determined by a two-sided Welch’s t-test (adjusted to 1% FDR for multiple comparisons). Dotted lines delineate a r1.5-fold change (x-axis) and a 0.05 p-value (y-axis). non-significant (ns). (see Table S2, and HTML plots in Supp. Item). To account for changes in the total proteome in ΔGCN2 cells changes in phosphorylation were normalized to total protein levels (see Figure 2E; Table S2). (C) Principal component analysis (PCA) of phosphoproteomics data obtained from 16-plex TMTpro-based analysis as described in (A). (D) Whole cell extracts of MCF10a WT and ΔGCN2 cells pretreated (1 h) with DMSO (mock) or PERK inhibitor (PERKi, GSK2606414, 0.3 μM) followed by treatment with DMSO (UT, mock-untreated), UV-C (500 J/m2, 15 min recovery post-UV), or tunicamycin (TM, 2 μg/ml, 2 h treatment) were analyzed by Phos-tag gels (for p38 and eIF2α) or SDS-PAGE and immunoblotted (IB) with the indicated antibodies (n=2). Although the kinase-enrichment analysis predicted downregulation of GCN2/PERK activity, the analysis itself was unable to discriminate between the activities of the closely-related eIF2α kinases GCN2 and PERK in ΔGCN2 or GCN2i MCF10a cells responding to ribotoxic stress (see Figure 2G and Figure S9F). Pretreatment of cells with a PERK inhibitor (PERKi) did not affect eIF2α phosphorylation (eIF2α-P) in response to UV, whereas deletion of GCN2 led to complete loss of eIF2α-P (compare lanes 5–8). Conversely, deletion of GCN2 did not affect eIF2α-P in cells treated with tunicamycin to induce ER stress, whereas PERKi led to complete loss of eIF2α-P (compare lanes 9–12). These data clarified that GCN2 regulates the increase in eIF2α-P in cells responding to UV-mediated ribotoxic stress. (E) Volcano plot (−log10[p-value] versus log2[ratio]) displays the differences in the abundance of phosphosites in response to UV-C treatment between MCF10a cells pretreated with a GCN2 inhibitor (GCN2i) compared to (DMSO) mock-treated cells, as depicted in panel A. Statistically, up- or down-regulated phosphopeptides were determined by a two-sided Welch’s t-test (adjusted to 1% FDR for multiple comparisons). Dotted lines delineate a r1.5-fold change (x-axis) and a 0.05 p-value (y-axis). non-significant (ns) (see Table S2, and HTML plots in Supp. Item). (F) Motif enrichment analysis of phosphoproteomics data presented in panel E. Kinases whose activities are up- or down-regulated (orange and blue dots respectively) in response to UV-C in GCN2i compared to WT MCF10a cells are represented in a volcano plot of log10-transformed adjusted p-values versus log2-transformed frequency factors. Statistical significance was determined using one-sided exact Fisher’s test and p-values adjusted for multiple hypotheses using the Benjamini-Hochberg method (Table S2, and HTML plots in Supp. Item). (G) Phosphoproteome level correlation plot in MCF10a cells of the effect of GCN2i (compared to WT cells) on the UV response (y-axis) against the GCN2 knock-out (ΔGCN2) effect (compared to WT cells) on the UV response (x-axis). The calculated correlation factors (Pearson (R) and R squared) and data fit are indicated. (HTML plot in Supp. Item). (H) Volcano plot (−log10[p-value] versus log2[ratio]) displays the differences in the abundance of phosphosites in response to UV-C treatment between ΔGCN2 MCF10a cells pretreated with a GCN2 inhibitor (GCN2i) compared to ΔGCN2 cells (DMSO) mock-treated, as depicted in (A). Statistically, up- or down-regulated phosphopeptides were determined by a two-sided Welch’s t-test (adjusted to 1% FDR for multiple comparisons). Dotted lines delineate a r1.5-fold change (x-axis) and a 0.05 p-value (y-axis). non-significant (ns). By comparing the effect of GCN2i on UV-mediated changes in phosphorylation in ΔGCN2 cells, we identified 275 additional phosphosites that were significantly downregulated in the ΔGCN2 background, and are likely to be off-target effects of the GCN2 inhibitor (Table S2, and HTML plot in Supp. Item).
(A-B) Fixed immunofluorescence images of untreated (UT) or UV-C treated (500 J/m2) MCF10a WT cells harvested at indicated time points post-UV-C treatment. For the detection of UV-C-induced photolesions (in panel A), fixed cells were denatured using 2 M HCl for 10 minutes at 37°C, followed by rinsing with phosphate-buffered saline (PBS) to remove the HCl, prior to the blocking step (STAR methods for details). Scale bar = 10 μm. (C) MCF10a cells expressing H2B-iRFP were pretreated with DMSO, ZAK inhibitor (ZAKi, PLX4720, 5 μM), or ATR inhibitor (ATRi, VE-821, 2.5 μM), before being treated with or without UV-C (500 J/m2) and live imaged. Mitosis counting was done manually using H2B-iRFP, and the mitotic rate was calculated as the percent of cells that undergo mitosis during the first 3 hours following UV or mock. (D-E) MCF10a WT and ΔZAK cells were treated with 500 J/m2 UV-C. Cumulative cell death was measured with a fluorescent Caspase 3/7 dye up to 12 h (D) or 24 h (E). WT data shown in panels D-E are the same as WT-DMSO shown in Figures 3E and 3F, respectively. Two-sided T-test.
(A) Volcano plot of log2-transformed fold-change in the abundance of proteins from MCF10a ΔGCN2 (UT, DMSO) compared to WT (UT, DMSO) cells, dataset from Figure S9A. 60S and 40S r-proteins are colored in orange and blue respectively (see Table S2). (B) Hierarchical clustering of r-proteins from MCF10a WT and ΔGCN2 cells under basal conditions (DMSO, UT). Columns, scaled TMTpro mean relative abundance (R. A.) for MCF10a WT-UT-DMSO and ΔGCN2-UT-DMSO; rows, r-proteins (see Table S2). (C) Whole-cell extracts from MCF10a WT and ΔGCN2 cells under basal conditions (UT, DMSO) were analyzed by SDS-PAGE and immunoblotted (IB) with the indicated antibodies. (D) Violin plots of log2-transformed fold-change in the abundance of lysosomal (n=60) and ribosomal (n=75) proteins from MCF10a ΔGCN2 (UT, DMSO) compared to WT (UT, DMSO) cells. Dataset from Figure S9A. (see Table S2). (E) 10–35% sucrose gradients of RNase A-digested lysates of untreated (UT) or UV-C (500 J/m2) treated HaCaT WT (DMSO, mock pre-treatment) and GCN2i (A-92, 2 μM, 30 min pre-treatment) cells, harvested 15 minutes post-UV treatment. (F) Whole-cell extracts from MCF10a WT and ΔGCN2 cells pretreated (30 min) with DMSO (mock) or GCN2i (A-92, 2 μM) and left untreated (0 J/m2) or treated with UV-C (500 J/m2) and harvested 15 minutes post-UV were analyzed by SDS-PAGE and immunoblotted with the indicated antibodies. (G) MS/MS spectrum annotation of quantified eS10 peptide modified with K-GG at both K138 and K139 positions. The peptide sequence (top) is marked with the locations of matched fragment ions, the annotated mass spectrum (middle), and visualization of mass error in parts-per-million for all matched fragment ions (bottom). (H) Quantification of scaled TMTpro relative abundance (n = 5 independent peptide quantification) of the doubly modified diGly eS10-K138/139 peptide from MCF10a WT and ΔGCN2 cells treated or not with UV-C (500 J/m2) and harvested 15 minutes post-UV treatment. (I-J) MCF10a WT and ΔGCN2 cells were untreated (panel I) or treated with UV-C (1500 J/m2, panel J) and live imaged for 12 hours after. JNK activity was quantified with the JNK KTR. Bold lines and shaded regions represent the median and interquartile range, respectively. (K-L) MCF10a WT and ΔGCN2 cells were treated as in panels I-J respectively but pretreated (1 h) with or without ZAK inhibitor (PLX4720, 5 μM) or JNK inhibitor (JNKi VIII, 2.5 μM). Cell death was measured with a fluorescent Caspase 3/7 dye. Two-sided t-test. (M) MCF10a WT and ΔGCN2 cells were treated with UV-C (500 J/m2) and live imaged for 12 hours after. p38 activity was quantified with the p38 KTR. Bold lines and shaded regions represent the median and interquartile range, respectively.
(A) Immunoprecipitation (IP) of 3x-FLAG-tagged β-TrCP1 (FBXW1A) and β-TrCP2 (FBXW11) transiently expressed in HEK293T cells either untreated or treated with UV-C (500 J/m2) and allowed to recover for 30 min post-UV treatment prior to harvest. Whole cell extracts (Input, 1%) and elutions from IPs (10%) were analyzed by Phos-tag gels (for ZAK) or SDS-PAGE and immunoblotted (IB) with the indicated antibodies (n=2) (B) 10–50% sucrose gradients of lysates of MCF10a ΔZAK cells complemented with wild-type (WT) or cluster 2 (S-D) phosphomimetic of ZAK left untreated (UT) or treated with UV-C (500 J/m2) and allowed to recover for 30 min post-UV. Fractions were analyzed by immunoblotting for ZAK. (C) Whole cell extracts from MCF10a ΔZAK cells complemented with WT, kinase-dead (T161A-S165A), and cluster 2 (S-A) variants of ZAK were treated with UV-C (500 J/m2) to induce collisions, harvested at indicated time points, and analyzed by immunoblotting for ZAK and actin. (D) AHA-based translatomics to determine degradation of ZAK in response to ribosomal collisions. (top) Schematic of AHA-based translatomics (see methods). HaCaT cells were conditioned in fresh media for 2 hours on the day of the experiment, then starved for methionine (-Met, 1 h) in media containing no Met, pulsed for 2 hours in -Met media supplemented with azidohomoalanine (AHA) which is metabolically incorporated into newly-synthesized proteins in place in methionine, followed by AHA washout by placing cells in media containing excess methionine (1 h). Following this 1 h recovery period, cells were treated with DMSO (mock) or a sub-inhibitory dose of ANS (0.38 μM) to induce collisions. At specific time points post-treatment lysates were extracted, the azide-group in newly-synthesized proteins were functionalized with biotin-alkyne through click chemistry, purified with streptavidin resin, and immunoblotted for ZAK (bottom left panel, top). (bottom left panel, middle) Half of the AHA-labeled samples were functionalized with TAMRA-alkyne (instead of biotin-alkyne) for in-gel fluorescence analysis. (bottom left panel, bottom) Coomassie-staining of sample lanes following in-gel fluorescence analysis; (bottom right panel) Quantification of AHA-labeled ZAK, isolated using streptavidin resin after biotin-alkyne click chemistry. Data points, mean ± SD (n=2). ZAK protein levels (relative to time point 0 h) for UT and low-dose ANS treatment were fit to a one-phase exponential decay model to estimate half-lives (t1/2). (E-G) MCF10a ΔZAK cells were complemented with WT (panel E), kinase-dead (T161A-S165A) (panel F), or cluster 2 (S-A) phosphomutant (panel G) variants of ZAK with an N-terminal mNeonGreen tag. Cells were pretreated (1 h) with DMSO (mock), MLN4924 (1 μM), or bortezomib (0.5 μM) followed by treatment with a sub-inhibitory dose of ANS (0.38 μM) to induce collisions and live imaged. mNeonGreen-ZAK fluorescence levels were measured and normalized to the fluorescence before treatment. Bold lines and shaded regions represent the median and 40th-60th percentiles, respectively. (H) Domain organization of ZAK-WT and ZAK-ΔS670−713ΔCTD774−800 annotated as in Figure 5A (also see text for details); orange, β-TrCP phosphodegron motif (656DSGFSS661). (I-J) MCF10a ΔZAK cells expressing JNK KTR were complemented with ZAK-ΔS670−713ΔCTD774−800 with an N-terminal mNeonGreen tag. Cells were treated with DMSO (mock) or a sub-inhibitory dose of ANS (0.38 μM) to induce collisions and live imaged. JNK activity was measured with the JNK KTR (panel I, median and interquartile range are shown). mNeonGreen-ZAK fluorescence levels were measured and normalized to the fluorescence before treatment (panel J, bold lines and shaded regions represent the median and 40th-60th percentiles, respectively).
(A-B) MCF10a ΔZAK cells expressing JNK and p38 KTRs were complemented with indicated ZAK derivates and treated with DMSO (mock) during live imaging. Median p38 (panel A) and JNK (panel B) activities shown for each cell line. (C-E) MCF10a ΔZAK cells complemented with WT (panel C), cluster 2 (S-A) (panel D), or kinase-dead (T161A-S165A, panel E) ZAK variants were treated with ANS (0.094 μM) during live imaging. Representative images of the JNK KTR and H2B-iRFP are shown at 5 minutes before, 1 minute after, and 480 minutes after ANS treatment. Scale bar = 10 μm. (F) MCF10a ΔZAK cells complemented with WT, cluster 2 (S-A), or kinase-dead (T161A-S165A) ZAK variants were treated with ANS (0.188 μM) and live imaged for 15 hours. Cell death was manually quantified as described in supplemental methods. One-way ANOVA with Tukey-Kramer post-hoc test. (G) Proliferation curves of MCF10a ΔZAK cells complemented with WT or cluster 2 (S-A) ZAK variants pre-treated with DMSO or ANS (0.38 μM) for 19 hours. Cells were then washed and allowed to recover. Cell confluency was measured post ANS exposure using a CELLCYTE X™ imager (CYTENA) once every 24 h for the duration of 8 days. (H-I) MCF10a ΔZAK cells complemented with WT or cluster 2 (S-A) ZAK variants were treated with DMSO (mock, panel H) or ANS (0.38 μM, panel I) and live imaged for 19 hours. Median JNK activities are shown for each cell line.
HTML plots that correspond to the various analyses performed in this study. Related to Figures 1–2, Figures S1–S2, Figures S4–S5, and Figures S7–S9.
Table S1: Temporal analysis of global phosphoproteome and proteome of HaCaT cells following UV-C exposure. Related to Figure 1 and Figures S1–S4.
Table S2: Global phosphoproteome and proteome analysis of MCF10a WT, ΔZAK, ZAKi, ΔGCN2, and GCN2i cells following UV-C exposure. Related to Figure 2, Figure S5, and Figure S9.
Table S3: Global phosphoproteome and proteome analysis of HaCaT cells pre-treated with various kinase inhibitors following UV-C exposure. Related to Figure 2, Figures S6G–S6H, and Figures S7–S8.
Table S4: Immunoprecipitation (IP) and mass-spectrometry of mNeonGreen-tagged ZAK from MCF10a ΔZAK cells. Related to Figure 5E.
Highlights.
Immediate-early response to UV is dominated by ribosome-mediated signaling
UV-induced apoptosis is mediated by ZAK, not the DNA damage response pathway
GCN2 regulates ZAK-mediated apoptosis by limiting ribosome collisions
ZAK degradation limits apoptosis by rendering cells tolerant to ribotoxic stress
Acknowledgments
We thank Heeseon An and Moonjung Jung for thoughtful discussions; Allen Buskirk, Colin Wu, Joshua Black, Marco Catipovic, James Saba, and Vienna Huso for critical reading; Andrew Holland for pLentiCRISPRV2-Neo; Lauren DeVine and Robert Cole for mass-spec support (NIH/NCATS grant, ULI TR003098). Graphical abstract was created in part using BioRender (https://biorender.com/).
Declaration of interests
R.G. is a member of the scientific advisory board (SAB) of Alltrna, Initial Therapeutics, and Arrakis Pharmaceuticals, consults for Vertex Pharmaceuticals, Brystol-Myers Squibb (Celgene), Monta Rosa Therapeutics, and Flagship Pioneering, and served on the SAB at Moderna. A.O. received consulting fees from Nine Square Therapeutics Co. L.C.C. is founder and member of the board of directors of Agios Pharmaceuticals; is founder and receives support from Petra Pharmaceuticals; is listed as inventor on a patent (WO2019232403A1, Weill Cornell Medicine); is co-founder and shareholder in Faeth Therapeutics; has equity in and consults for Cell Signaling Technologies, Volastra, Larkspur and 1 Base Pharmaceuticals; and consults for Loxo-Lilly. T.M.Y. is a co-founder of DeStroke. J.L.J received consulting fees from Scorpion Therapeutics and Volastra Therapeutics. R.G., S.R., N.K.S, and C.M. are listed as inventors on a patent application that is being prepared and will be filed prior to publication.
Funding information
Work was supported by Howard Hughes Medical Institute (HHMI) to R.G., NIH R37GM059425 to R.G., NIH 1R35GM133499 to S.R., NSF Career (MCB-1844994) to S.R., Jane Coffin Childs Memorial Fund for Medical Research Fellowship and NIGMS 1K99GM146031-01A1 to N.K.S., Sloan Kettering Institute startup funds, Pew Charitable Trusts, and MSKCC Support Grant (P30CA008748) to A.O., and Basic Science Research Program (National Research Foundation of Korea; Ministry of Education; 2021R1A6A3A14038416) to K.H.N.
Footnotes
Publisher's Disclaimer: This is a PDF file of an unedited manuscript that has been accepted for publication. As a service to our customers we are providing this early version of the manuscript. The manuscript will undergo copyediting, typesetting, and review of the resulting proof before it is published in its final form. Please note that during the production process errors may be discovered which could affect the content, and all legal disclaimers that apply to the journal pertain.
Data and code availability
Raw mass spectrometry data associated with Tables S1–S4 have been deposited to the MassIVE repository and are publicly available as of the date of publication with the dataset identifier MSV000092521. HTML plots are included as a Supp. Item in a ZIP file. The phosphoproteomics datasets are publicly available online (https://ordureau-lab.shinyapps.io/Sinha-Shinyapp/) to examine the data at a gene-specific level.
The paper does not report original code.
Additional information to reanalyze the data is available from the lead contact upon request.
References
- 1.Galluzzi L, Yamazaki T, and Kroemer G (2018). Linking cellular stress responses to systemic homeostasis. Nat Rev Mol Cell Biol 19, 731–745. 10.1038/s41580-018-0068-0. [DOI] [PubMed] [Google Scholar]
- 2.Arthur JSC, and Ley SC (2013). Mitogen-activated protein kinases in innate immunity. Nat Rev Immunol 13, 679–692. 10.1038/nri3495. [DOI] [PubMed] [Google Scholar]
- 3.Canovas B, and Nebreda AR (2021). Diversity and versatility of p38 kinase signalling in health and disease. Nat Rev Mol Cell Biol 22, 346–366. 10.1038/s41580-020-00322-w. [DOI] [PMC free article] [PubMed] [Google Scholar]
- 4.de Nadal E, and Posas F (2015). Osmostress-induced gene expression--a model to understand how stress-activated protein kinases (SAPKs) regulate transcription. FEBS J 282, 3275–3285. 10.1111/febs.13323. [DOI] [PMC free article] [PubMed] [Google Scholar]
- 5.Himanen SV, and Sistonen L (2019). New insights into transcriptional reprogramming during cellular stress. J Cell Sci 132, jcs238402. 10.1242/jcs.238402. [DOI] [PubMed] [Google Scholar]
- 6.Vihervaara A, Duarte FM, and Lis JT (2018). Molecular mechanisms driving transcriptional stress responses. Nat Rev Genet 19, 385–397. 10.1038/s41576-018-0001-6. [DOI] [PMC free article] [PubMed] [Google Scholar]
- 7.Galluzzi L, Bravo-San Pedro JM, Kepp O, and Kroemer G (2016). Regulated cell death and adaptive stress responses. Cell Mol Life Sci 73, 2405–2410. 10.1007/s00018-016-2209-y. [DOI] [PMC free article] [PubMed] [Google Scholar]
- 8.Iordanov MS, Pribnow D, Magun JL, Dinh TH, Pearson JA, and Magun BE (1998). Ultraviolet radiation triggers the ribotoxic stress response in mammalian cells. J. Biol. Chem 273, 15794–15803. 10.1074/jbc.273.25.15794. [DOI] [PubMed] [Google Scholar]
- 9.Iordanov MS, Pribnow D, Magun JL, Dinh T-H, Pearson JA, Chen SL-Y, and Magun BE (1997). Ribotoxic Stress Response: Activation of the Stress-Activated Protein Kinase JNK1 by Inhibitors of the Peptidyl Transferase Reaction and by Sequence-Specific RNA Damage to the α-Sarcin/Ricin Loop in the 28S rRNA. Mol. Cell. Biol 17, 9. [DOI] [PMC free article] [PubMed] [Google Scholar]
- 10.Sonenberg N, and Hinnebusch AG (2009). Regulation of Translation Initiation in Eukaryotes: Mechanisms and Biological Targets. Cell 136, 731–745. 10.1016/j.cell.2009.01.042. [DOI] [PMC free article] [PubMed] [Google Scholar]
- 11.D’Orazio KN, and Green R (2021). Ribosome states signal RNA quality control. Molecular Cell 81, 1372–1383. 10.1016/j.molcel.2021.02.022. [DOI] [PMC free article] [PubMed] [Google Scholar]
- 12.Wurtmann EJ, and Wolin SL (2009). RNA under attack: Cellular handling of RNA damage. Critical Reviews in Biochemistry and Molecular Biology 44, 34–49. 10.1080/10409230802594043. [DOI] [PMC free article] [PubMed] [Google Scholar]
- 13.Simms CL, Yan LL, and Zaher HS (2017). Ribosome Collision Is Critical for Quality Control during No-Go Decay. Molecular Cell 68, 361–373.e5. 10.1016/j.molcel.2017.08.019. [DOI] [PMC free article] [PubMed] [Google Scholar]
- 14.Inada T (2020). Quality controls induced by aberrant translation. Nucleic acids research 48, 1084–1096. 10.1093/nar/gkz1201. [DOI] [PMC free article] [PubMed] [Google Scholar]
- 15.Stoneley M, Harvey RF, Mulroney TE, Mordue R, Jukes-Jones R, Cain K, Lilley KS, Sawarkar R, and Willis AE (2022). Unresolved stalled ribosome complexes restrict cell-cycle progression after genotoxic stress. Mol Cell 82, 1557–1572.e7. 10.1016/j.molcel.2022.01.019. [DOI] [PMC free article] [PubMed] [Google Scholar]
- 16.Vind AC, Snieckute G, Blasius M, Tiedje C, Krogh N, Bekker-Jensen DB, Andersen KL, Nordgaard C, Tollenaere MAX, Lund AH, et al. (2020). ZAKα Recognizes Stalled Ribosomes through Partially Redundant Sensor Domains. Mol. Cell 10.1016/j.molcel.2020.03.021. [DOI] [PubMed] [Google Scholar]
- 17.Wu CC-C, Peterson A, Zinshteyn B, Regot S, and Green R (2020). Ribosome Collisions Trigger General Stress Responses to Regulate Cell Fate. Cell, S0092867420306930. 10.1016/j.cell.2020.06.006. [DOI] [PMC free article] [PubMed] [Google Scholar]
- 18.Maréchal A, and Zou L (2013). DNA damage sensing by the ATM and ATR kinases. Cold Spring Harb Perspect Biol 5, a012716. 10.1101/cshperspect.a012716. [DOI] [PMC free article] [PubMed] [Google Scholar]
- 19.Zhou BB, and Elledge SJ (2000). The DNA damage response: putting checkpoints in perspective. Nature 408, 433–439. 10.1038/35044005. [DOI] [PubMed] [Google Scholar]
- 20.Saldivar JC, Cortez D, and Cimprich KA (2017). The essential kinase ATR: ensuring faithful duplication of a challenging genome. Nat Rev Mol Cell Biol 18, 622–636. 10.1038/nrm.2017.67. [DOI] [PMC free article] [PubMed] [Google Scholar]
- 21.Zou L, and Elledge SJ (2003). Sensing DNA damage through ATRIP recognition of RPA-ssDNA complexes. Science 300, 1542–1548. 10.1126/science.1083430. [DOI] [PubMed] [Google Scholar]
- 22.Byun TS, Pacek M, Yee M, Walter JC, and Cimprich KA (2005). Functional uncoupling of MCM helicase and DNA polymerase activities activates the ATR-dependent checkpoint. Genes Dev. 19, 1040–1052. 10.1101/gad.1301205. [DOI] [PMC free article] [PubMed] [Google Scholar]
- 23.Hafner A, Bulyk ML, Jambhekar A, and Lahav G (2019). The multiple mechanisms that regulate p53 activity and cell fate. Nat Rev Mol Cell Biol 20, 199–210. 10.1038/s41580-019-0110-x. [DOI] [PubMed] [Google Scholar]
- 24.Aubrey BJ, Kelly GL, Janic A, Herold MJ, and Strasser A (2018). How does p53 induce apoptosis and how does this relate to p53-mediated tumour suppression? Cell Death Differ 25, 104–113. 10.1038/cdd.2017.169. [DOI] [PMC free article] [PubMed] [Google Scholar]
- 25.Yan LL, Simms CL, McLoughlin F, Vierstra RD, and Zaher HS (2019). Oxidation and alkylation stresses activate ribosome-quality control. Nat Commun 10, 5611. 10.1038/s41467-019-13579-3. [DOI] [PMC free article] [PubMed] [Google Scholar]
- 26.Jandhyala DM, Ahluwalia A, Obrig T, and Thorpe CM (2008). ZAK: a MAP3Kinase that transduces Shiga toxin- and ricin-induced proinflammatory cytokine expression. Cell Microbiol 10, 1468–1477. 10.1111/j.1462-5822.2008.01139.x. [DOI] [PubMed] [Google Scholar]
- 27.Sauter KAD, Magun EA, Iordanov MS, and Magun BE (2010). ZAK is required for doxorubicin, a novel ribotoxic stressor, to induce SAPK activation and apoptosis in HaCaT cells. Cancer Biology & Therapy 10, 258–266. 10.4161/cbt.10.3.12367. [DOI] [PMC free article] [PubMed] [Google Scholar]
- 28.Wang X, Mader MM, Toth JE, Yu X, Jin N, Campbell RM, Smallwood JK, Christe ME, Chatterjee A, Goodson T, et al. (2005). Complete Inhibition of Anisomycin and UV Radiation but Not Cytokine Induced JNK and p38 Activation by an Aryl-substituted Dihydropyrrolopyrazole Quinoline and Mixed Lineage Kinase 7 Small Interfering RNA. Journal of Biological Chemistry 280, 19298–19305. 10.1074/jbc.M413059200. [DOI] [PubMed] [Google Scholar]
- 29.Deng J, Harding HP, Raught B, Gingras A-C, Berlanga JJ, Scheuner D, Kaufman RJ, Ron D, and Sonenberg N (2002). Activation of GCN2 in UV-Irradiated Cells Inhibits Translation. Current Biology 12, 1279–1286. 10.1016/S0960-9822(02)01037-0. [DOI] [PubMed] [Google Scholar]
- 30.Yan LL, and Zaher HS (2021). Ribosome quality control antagonizes the activation of the integrated stress response on colliding ribosomes. Molecular Cell 81, 614–628.e4. 10.1016/j.molcel.2020.11.033. [DOI] [PMC free article] [PubMed] [Google Scholar]
- 31.Boukamp P, Petrussevska RT, Breitkreutz D, Hornung J, Markham A, and Fusenig NE (1988). Normal keratinization in a spontaneously immortalized aneuploid human keratinocyte cell line. The Journal of Cell Biology 106, 761–771. 10.1083/jcb.106.3.761. [DOI] [PMC free article] [PubMed] [Google Scholar]
- 32.Juszkiewicz S, and Hegde RS (2017). Initiation of Quality Control during Poly(A) Translation Requires Site-Specific Ribosome Ubiquitination. Molecular Cell 65, 743–750.e4. 10.1016/j.molcel.2016.11.039. [DOI] [PMC free article] [PubMed] [Google Scholar]
- 33.Sundaramoorthy E, Leonard M, Mak R, Liao J, Fulzele A, and Bennett EJ (2017). ZNF598 and RACK1 Regulate Mammalian Ribosome-Associated Quality Control Function by Mediating Regulatory 40S Ribosomal Ubiquitylation. Molecular Cell 65, 751–760.e4. 10.1016/j.molcel.2016.12.026. [DOI] [PMC free article] [PubMed] [Google Scholar]
- 34.Wolin SL, and Walter P (1988). Ribosome pausing and stacking during translation of a eukaryotic mRNA. The EMBO Journal 7, 3559–3569. 10.1002/j.1460-2075.1988.tb03233.x. [DOI] [PMC free article] [PubMed] [Google Scholar]
- 35.Liu Q, Guntuku S, Cui XS, Matsuoka S, Cortez D, Tamai K, Luo G, Carattini-Rivera S, DeMayo F, Bradley A, et al. (2000). Chk1 is an essential kinase that is regulated by Atr and required for the G(2)/M DNA damage checkpoint. Genes Dev 14, 1448–1459. [PMC free article] [PubMed] [Google Scholar]
- 36.Marti TM, Hefner E, Feeney L, Natale V, and Cleaver JE (2006). H2AX phosphorylation within the G1 phase after UV irradiation depends on nucleotide excision repair and not DNA double-strand breaks. Proc. Natl. Acad. Sci. U.S.A 103, 9891–9896. 10.1073/pnas.0603779103. [DOI] [PMC free article] [PubMed] [Google Scholar]
- 37.Dunkern TR, Fritz G, and Kaina B (2001). Ultraviolet light-induced DNA damage triggers apoptosis in nucleotide excision repair-deficient cells via Bcl-2 decline and caspase-3/−8 activation. Oncogene 20, 6026–6038. 10.1038/sj.onc.1204754. [DOI] [PubMed] [Google Scholar]
- 38.Nordgaard C, Tollenaere MAX, Val AMD, Bekker-Jensen DB, Blasius M, Olsen JV, and Bekker-Jensen S (2021). Regulation of the Golgi Apparatus by p38 and JNK Kinases during Cellular Stress Responses. IJMS 22, 9595. 10.3390/ijms22179595. [DOI] [PMC free article] [PubMed] [Google Scholar]
- 39.Davis RJ (2000). Signal Transduction by the JNK Group of MAP Kinases. Cell 103, 239–252. 10.1016/S0092-8674(00)00116-1. [DOI] [PubMed] [Google Scholar]
- 40.Stewart GS, Wang B, Bignell CR, Taylor AMR, and Elledge SJ (2003). MDC1 is a mediator of the mammalian DNA damage checkpoint. Nature 421, 961–966. 10.1038/nature01446. [DOI] [PubMed] [Google Scholar]
- 41.Sugasawa K, Ng JM, Masutani C, Iwai S, van der Spek PJ, Eker AP, Hanaoka F, Bootsma D, and Hoeijmakers JH (1998). Xeroderma pigmentosum group C protein complex is the initiator of global genome nucleotide excision repair. Mol Cell 2, 223–232. 10.1016/s1097-2765(00)80132-x. [DOI] [PubMed] [Google Scholar]
- 42.Johnson JL, Yaron TM, Huntsman EM, Kerelsky A, Song J, Regev A, Lin T-Y, Liberatore K, Cizin DM, Cohen BM, et al. (2023). An atlas of substrate specificities for the human serine/threonine kinome. Nature 613, 759–766. 10.1038/s41586-022-05575-3. [DOI] [PMC free article] [PubMed] [Google Scholar]
- 43.Cargnello M, and Roux PP (2011). Activation and Function of the MAPKs and Their Substrates, the MAPK-Activated Protein Kinases. Microbiol Mol Biol Rev 75, 50–83. 10.1128/MMBR.00031-10. [DOI] [PMC free article] [PubMed] [Google Scholar]
- 44.Kudo T, Jeknić S, Macklin DN, Akhter S, Hughey JJ, Regot S, and Covert MW (2018). Live-cell measurements of kinase activity in single cells using translocation reporters. Nat Protoc 13, 155–169. 10.1038/nprot.2017.128. [DOI] [PubMed] [Google Scholar]
- 45.Regot S, Hughey JJ, Bajar BT, Carrasco S, and Covert MW (2014). High-Sensitivity Measurements of Multiple Kinase Activities in Live Single Cells. Cell 157, 1724–1734. 10.1016/j.cell.2014.04.039. [DOI] [PMC free article] [PubMed] [Google Scholar]
- 46.Mathea S, Abdul Azeez KR, Salah E, Tallant C, Wolfreys F, Konietzny R, Fischer R, Lou HJ, Brennan PE, Schnapp G, et al. (2016). Structure of the Human Protein Kinase ZAK in Complex with Vemurafenib. ACS Chem. Biol 11, 1595–1602. 10.1021/acschembio.6b00043. [DOI] [PMC free article] [PubMed] [Google Scholar]
- 47.Ikeuchi K, Tesina P, Matsuo Y, Sugiyama T, Cheng J, Saeki Y, Tanaka K, Becker T, Beckmann R, and Inada T (2019). Collided ribosomes form a unique structural interface to induce Hel2-driven quality control pathways. The EMBO Journal 38, 1–21. 10.15252/embj.2018100276. [DOI] [PMC free article] [PubMed] [Google Scholar]
- 48.Juszkiewicz S, Chandrasekaran V, Lin Z, Kraatz S, Ramakrishnan V, and Hegde RS (2018). ZNF598 Is a Quality Control Sensor of Collided Ribosomes. Molecular Cell 72, 469–481.e7. 10.1016/j.molcel.2018.08.037. [DOI] [PMC free article] [PubMed] [Google Scholar]
- 49.Li F, Kozono D, Deraska P, Branigan T, Dunn C, Zheng X-F, Parmar K, Nguyen H, DeCaprio J, Shapiro GI, et al. (2020). CHK1 Inhibitor Blocks Phosphorylation of FAM122A and Promotes Replication Stress. Molecular Cell 80, 410–422.e6. 10.1016/j.molcel.2020.10.008. [DOI] [PMC free article] [PubMed] [Google Scholar]
- 50.Dokládal L, Stumpe M, Pillet B, Hu Z, Garcia Osuna GM, Kressler D, Dengjel J, and De Virgilio C (2021). Global phosphoproteomics pinpoints uncharted Gcn2-mediated mechanisms of translational control. Molecular Cell 81, 1879–1889.e6. 10.1016/j.molcel.2021.02.037. [DOI] [PubMed] [Google Scholar]
- 51.Wang X, and Proud CG (2006). The mTOR Pathway in the Control of Protein Synthesis. Physiology 21, 362–369. 10.1152/physiol.00024.2006. [DOI] [PubMed] [Google Scholar]
- 52.Prevo R, Fokas E, Reaper PM, Charlton PA, Pollard JR, McKenna WG, Muschel RJ, and Brunner TB (2012). The novel ATR inhibitor VE-821 increases sensitivity of pancreatic cancer cells to radiation and chemotherapy. Cancer Biology & Therapy 13, 1072–1081. 10.4161/cbt.21093. [DOI] [PMC free article] [PubMed] [Google Scholar]
- 53.Celis JE, and Celis A (1985). Cell cycle-dependent variations in the distribution of the nuclear protein cyclin proliferating cell nuclear antigen in cultured cells: subdivision of S phase. Proc. Natl. Acad. Sci. U.S.A 82, 3262–3266. 10.1073/pnas.82.10.3262. [DOI] [PMC free article] [PubMed] [Google Scholar]
- 54.Humbert C, Santisteban MS, Usson Y, and Robert-Nicoud M (1992). Intranuclear co-location of newly replicated DNA and PCNA by simultaneous immunofluorescent labelling and confocal microscopy in MCF-7 cells. Journal of Cell Science 103, 97–103. 10.1242/jcs.103.1.97. [DOI] [PubMed] [Google Scholar]
- 55.De Klein A, Muijtjens M, Van Os R, Verhoeven Y, Smit B, Carr AM, Lehmann AR, and Hoeijmakers JHJ (2000). Targeted disruption of the cell-cycle checkpoint gene ATR leads to early embryonic lethality in mice. Current Biology 10, 479–482. 10.1016/S0960-9822(00)00447-4. [DOI] [PubMed] [Google Scholar]
- 56.Brown EJ, and Baltimore D (2000). ATR disruption leads to chromosomal fragmentation and early embryonic lethality. Genes Dev. 14, 397–402. 10.1101/gad.14.4.397. [DOI] [PMC free article] [PubMed] [Google Scholar]
- 57.Thoreen CC, Chantranupong L, Keys HR, Wang T, Gray NS, and Sabatini DM (2012). A unifying model for mTORC1-mediated regulation of mRNA translation. Nature 485, 109–113. 10.1038/nature11083. [DOI] [PMC free article] [PubMed] [Google Scholar]
- 58.Ambrosino C, Mace G, Galban S, Fritsch C, Vintersten K, Black E, Gorospe M, and Nebreda AR (2003). Negative Feedback Regulation of MKK6 mRNA Stability by p38α Mitogen-Activated Protein Kinase. Mol Cell Biol 23, 370–381. 10.1128/MCB.23.1.370-381.2003. [DOI] [PMC free article] [PubMed] [Google Scholar]
- 59.Takekawa M, Adachi M, Nakahata A, Nakayama I, Itoh F, Tsukuda H, Taya Y, and Imai K (2000). p53-inducible Wip1 phosphatase mediates a negative feedback regulation of p38 MAPK-p53 signaling in response to UV radiation. The EMBO Journal 19, 6517–6526. 10.1093/emboj/19.23.6517. [DOI] [PMC free article] [PubMed] [Google Scholar]
- 60.Tomida T, Takekawa M, and Saito H (2015). Oscillation of p38 activity controls efficient pro-inflammatory gene expression. Nat Commun 6, 8350. 10.1038/ncomms9350. [DOI] [PMC free article] [PubMed] [Google Scholar]
- 61.Harper JW, and Schulman BA (2021). Cullin-RING Ubiquitin Ligase Regulatory Circuits: A Quarter Century Beyond the F-Box Hypothesis. Annu. Rev. Biochem 90, 403–429. 10.1146/annurev-biochem-090120-013613. [DOI] [PMC free article] [PubMed] [Google Scholar]
- 62.Kondo Y, Ognjenović J, Banerjee S, Karandur D, Merk A, Kulhanek K, Wong K, Roose JP, Subramaniam S, and Kuriyan J (2019). Cryo-EM structure of a dimeric B-Raf:14-3-3 complex reveals asymmetry in the active sites of B-Raf kinases. Science 366, 109–115. 10.1126/science.aay0543. [DOI] [PMC free article] [PubMed] [Google Scholar]
- 63.Yaffe MB, Rittinger K, Volinia S, Caron PR, Aitken A, Leffers H, Gamblin SJ, Smerdon SJ, and Cantley LC (1997). The Structural Basis for 14-3-3:Phosphopeptide Binding Specificity. Cell 91, 961–971. 10.1016/S0092-8674(00)80487-0. [DOI] [PubMed] [Google Scholar]
- 64.Pochopien AA, Beckert B, Kasvandik S, Berninghausen O, Beckmann R, Tenson T, and Wilson DN (2021). Structure of Gcn1 bound to stalled and colliding 80S ribosomes. Proc. Natl. Acad. Sci. U.S.A 118, e2022756118. 10.1073/pnas.2022756118. [DOI] [PMC free article] [PubMed] [Google Scholar]
- 65.Soucy TA, Smith PG, Milhollen MA, Berger AJ, Gavin JM, Adhikari S, Brownell JE, Burke KE, Cardin DP, Critchley S, et al. (2009). An inhibitor of NEDD8-activating enzyme as a new approach to treat cancer. Nature 458, 732–736. 10.1038/nature07884. [DOI] [PubMed] [Google Scholar]
- 66.Hazzalin CA, Le Panse R, Cano E, and Mahadevan LC (1998). Anisomycin Selectively Desensitizes Signalling Components Involved in Stress Kinase Activation and fos and jun Induction. Molecular and Cellular Biology 18, 1844–1854. 10.1128/MCB.18.4.1844. [DOI] [PMC free article] [PubMed] [Google Scholar]
- 67.DeFelice MM, Clark HR, Hughey JJ, Maayan I, Kudo T, Gutschow MV, Covert MW, and Regot S (2019). NF-κB signaling dynamics is controlled by a dose-sensing autoregulatory loop. Sci. Signal 12, eaau3568. 10.1126/scisignal.aau3568. [DOI] [PMC free article] [PubMed] [Google Scholar]
- 68.Holland AJ, Fachinetti D, Zhu Q, Bauer M, Verma IM, Nigg EA, and Cleveland DW (2012). The autoregulated instability of Polo-like kinase 4 limits centrosome duplication to once per cell cycle. Genes Dev. 26, 2684–2689. 10.1101/gad.207027.112. [DOI] [PMC free article] [PubMed] [Google Scholar]
- 69.Holland AJ, Lan W, Niessen S, Hoover H, and Cleveland DW (2010). Polo-like kinase 4 kinase activity limits centrosome overduplication by autoregulating its own stability. Journal of Cell Biology 188, 191–198. 10.1083/jcb.200911102. [DOI] [PMC free article] [PubMed] [Google Scholar]
- 70.Gutierrez-Prat N, Cubillos-Rojas M, Cánovas B, Kuzmanic A, Gupta J, Igea A, Llonch E, Gaestel M, and Nebreda AR (2021). MK2 degradation as a sensor of signal intensity that controls stress-induced cell fate. Proc Natl Acad Sci U S A 118, e2024562118. 10.1073/pnas.2024562118. [DOI] [PMC free article] [PubMed] [Google Scholar]
- 71.O’Driscoll M, Ruiz-Perez VL, Woods CG, Jeggo PA, and Goodship JA (2003). A splicing mutation affecting expression of ataxia–telangiectasia and Rad3–related protein (ATR) results in Seckel syndrome. Nat Genet 33, 497–501. 10.1038/ng1129. [DOI] [PubMed] [Google Scholar]
- 72.Olivieri M, Cho T, Álvarez-Quilón A, Li K, Schellenberg MJ, Zimmermann M, Hustedt N, Rossi SE, Adam S, Melo H, et al. (2020). A Genetic Map of the Response to DNA Damage in Human Cells. Cell 182, 481–496.e21. 10.1016/j.cell.2020.05.040. [DOI] [PMC free article] [PubMed] [Google Scholar]
- 73.Saldivar JC, Hamperl S, Bocek MJ, Chung M, Bass TE, Cisneros-Soberanis F, Samejima K, Xie L, Paulson JR, Earnshaw WC, et al. (2018). An intrinsic S/G2 checkpoint enforced by ATR. Science 361, 806–810. 10.1126/science.aap9346. [DOI] [PMC free article] [PubMed] [Google Scholar]
- 74.Yan LL, and Zaher HS (2019). How do cells cope with RNA damage and its consequences? J. Biol. Chem 294, 15158–15171. 10.1074/jbc.REV119.006513. [DOI] [PMC free article] [PubMed] [Google Scholar]
- 75.Vin H, Ojeda SS, Ching G, Leung ML, Chitsazzadeh V, Dwyer DW, Adelmann CH, Restrepo M, Richards KN, Stewart LR, et al. (2013). BRAF inhibitors suppress apoptosis through off-target inhibition of JNK signaling. eLife 2, e00969. 10.7554/eLife.00969. [DOI] [PMC free article] [PubMed] [Google Scholar]
- 76.Gagliardi PA, Dobrzyński M, Jacques M-A, Dessauges C, Ender P, Blum Y, Hughes RM, Cohen AR, and Pertz O (2021). Collective ERK/Akt activity waves orchestrate epithelial homeostasis by driving apoptosis-induced survival. Developmental Cell 56, 1712–1726.e6. 10.1016/j.devcel.2021.05.007. [DOI] [PubMed] [Google Scholar]
- 77.Hiratsuka T, Fujita Y, Naoki H, Aoki K, Kamioka Y, and Matsuda M (2015). Intercellular propagation of extracellular signal-regulated kinase activation revealed by in vivo imaging of mouse skin. eLife 4, e05178. 10.7554/eLife.05178. [DOI] [PMC free article] [PubMed] [Google Scholar]
- 78.Surka C, Jin L, Mbong N, Lu C-C, Jang IS, Rychak E, Mendy D, Clayton T, Tindall E, Hsu C, et al. (2021). CC-90009, a novel cereblon E3 ligase modulator, targets acute myeloid leukemia blasts and leukemia stem cells. Blood 137, 661–677. 10.1182/blood.2020008676. [DOI] [PMC free article] [PubMed] [Google Scholar]
- 79.Sellar RS, Sperling AS, Słabicki M, Gasser JA, McConkey ME, Donovan KA, Mageed N, Adams DN, Zou C, Miller PG, et al. (2022). Degradation of GSPT1 causes TP53-independent cell death in leukemia while sparing normal hematopoietic stem cells. Journal of Clinical Investigation 132, e153514. 10.1172/JCI153514. [DOI] [PMC free article] [PubMed] [Google Scholar]
- 80.Chang Y, Keramatnia F, Ghate PS, Nishiguchi G, Gao Q, Iacobucci I, Yang L, Chepyala D, Mishra A, High AA, et al. (2023). The orally bioavailable GSPT1/2 degrader SJ6986 exhibits in vivo efficacy in acute lymphoblastic leukemia. Blood 142, 629–642. 10.1182/blood.2022017813. [DOI] [PMC free article] [PubMed] [Google Scholar]
- 81.Ye J, Palm W, Peng M, King B, Lindsten T, Li MO, Koumenis C, and Thompson CB (2015). GCN2 sustains mTORC1 suppression upon amino acid deprivation by inducing Sestrin2. Genes Dev. 29, 2331–2336. 10.1101/gad.269324.115. [DOI] [PMC free article] [PubMed] [Google Scholar]
- 82.Ge M-K, Zhang C, Zhang N, He P, Cai H-Y, Li S, Wu S, Chu X-L, Zhang Y-X, Ma H-M, et al. (2023). The tRNA-GCN2-FBXO22-axis-mediated mTOR ubiquitination senses amino acid insufficiency. Cell Metabolism 35, 2216–2230.e8. 10.1016/j.cmet.2023.10.016. [DOI] [PubMed] [Google Scholar]
- 83.Hahn AT, Jones JT, and Meyer T (2009). Quantitative analysis of cell cycle phase durations and PC12 differentiation using fluorescent biosensors. Cell Cycle 8, 1044–1052. 10.4161/cc.8.7.8042. [DOI] [PMC free article] [PubMed] [Google Scholar]
- 84.Spencer SL, Cappell SD, Tsai F-C, Overton KW, Wang CL, and Meyer T (2013). The proliferation-quiescence decision is controlled by a bifurcation in CDK2 activity at mitotic exit. Cell 155, 369–383. 10.1016/j.cell.2013.08.062. [DOI] [PMC free article] [PubMed] [Google Scholar]
- 85.Khatter H, Myasnikov AG, Natchiar SK, and Klaholz BP (2015). Structure of the human 80S ribosome. Nature 520, 640–645. 10.1038/nature14427. [DOI] [PubMed] [Google Scholar]
- 86.Tai YC, and Speed TP (2006). A Multivariate Empirical Bayes Statistic for Replicated Microarray Time Course Data. The Annals of Statistics 34, 2387–2412. [Google Scholar]
- 87.Hotelling H (1931). The Generalization of Student’s Ratio. 54–65. Ann. Math. Stat 2, 360–378. [Google Scholar]
- 88.Campeau E, Ruhl VE, Rodier F, Smith CL, Rahmberg BL, Fuss JO, Campisi J, Yaswen P, Cooper PK, and Kaufman PD (2009). A versatile viral system for expression and depletion of proteins in mammalian cells. PLoS One 4, e6529. 10.1371/journal.pone.0006529. [DOI] [PMC free article] [PubMed] [Google Scholar]
- 89.Dull T, Zufferey R, Kelly M, Mandel RJ, Nguyen M, Trono D, and Naldini L (1998). A third-generation lentivirus vector with a conditional packaging system. J Virol 72, 8463–8471. 10.1128/JVI.72.11.8463-8471.1998. [DOI] [PMC free article] [PubMed] [Google Scholar]
- 90.Yang HW, Cappell SD, Jaimovich A, Liu C, Chung M, Daigh LH, Pack LR, Fan Y, Regot S, Covert M, et al. (2020). Stress-mediated exit to quiescence restricted by increasing persistence in CDK4/6 activation. Elife 9, e44571. 10.7554/eLife.44571. [DOI] [PMC free article] [PubMed] [Google Scholar]
- 91.McKenney C, Lendner Y, Guerrero Zuniga A, Sinha N, Veresko B, Aikin TJ, and Regot S (2024). CDK4/6 activity is required during G2 arrest to prevent stress-induced endoreplication. Science 384, eadi2421. 10.1126/science.adi2421. [DOI] [PMC free article] [PubMed] [Google Scholar]
- 92.Juszkiewicz S, Slodkowicz G, Lin Z, Freire-Pritchett P, Peak-Chew S-Y, and Hegde RS (2020). Ribosome collisions trigger cis-acting feedback inhibition of translation initiation. Elife 9, e60038. 10.7554/eLife.60038. [DOI] [PMC free article] [PubMed] [Google Scholar]
- 93.Sinha NK, Ordureau A, Best K, Saba JA, Zinshteyn B, Sundaramoorthy E, Fulzele A, Garshott DM, Denk T, Thoms M, et al. (2020). EDF1 coordinates cellular responses to ribosome collisions. eLife 9, e58828. 10.7554/eLife.58828. [DOI] [PMC free article] [PubMed] [Google Scholar]
- 94.Wang Y, Yang F, Gritsenko MA, Wang Y, Clauss T, Liu T, Shen Y, Monroe ME, Lopez-Ferrer D, Reno T, et al. (2011). Reversed-phase chromatography with multiple fraction concatenation strategy for proteome profiling of human MCF10A cells. Proteomics 11, 2019–2026. 10.1002/pmic.201000722. [DOI] [PMC free article] [PubMed] [Google Scholar]
- 95.Paulo JA, O’Connell JD, Everley RA, O’Brien J, Gygi MA, and Gygi SP (2016). Quantitative mass spectrometry-based multiplexing compares the abundance of 5000 S. cerevisiae proteins across 10 carbon sources. J Proteomics 148, 85–93. 10.1016/j.jprot.2016.07.005. [DOI] [PMC free article] [PubMed] [Google Scholar]
- 96.McAlister GC, Nusinow DP, Jedrychowski MP, Wühr M, Huttlin EL, Erickson BK, Rad R, Haas W, and Gygi SP (2014). MultiNotch MS3 enables accurate, sensitive, and multiplexed detection of differential expression across cancer cell line proteomes. Anal. Chem 86, 7150–7158. 10.1021/ac502040v. [DOI] [PMC free article] [PubMed] [Google Scholar]
- 97.Paulo JA, O’Connell JD, and Gygi SP (2016). A Triple Knockout (TKO) Proteomics Standard for Diagnosing Ion Interference in Isobaric Labeling Experiments. J Am Soc Mass Spectrom 27, 1620–1625. 10.1007/s13361-016-1434-9. [DOI] [PMC free article] [PubMed] [Google Scholar]
- 98.Schweppe DK, Prasad S, Belford MW, Navarrete-Perea J, Bailey DJ, Huguet R, Jedrychowski MP, Rad R, McAlister G, Abbatiello SE, et al. (2019). Characterization and Optimization of Multiplexed Quantitative Analyses Using High-Field Asymmetric-Waveform Ion Mobility Mass Spectrometry. Anal. Chem 91, 4010–4016. 10.1021/acs.analchem.8b05399. [DOI] [PMC free article] [PubMed] [Google Scholar]
- 99.Erickson BK, Mintseris J, Schweppe DK, Navarrete-Perea J, Erickson AR, Nusinow DP, Paulo JA, and Gygi SP (2019). Active Instrument Engagement Combined with a Real-Time Database Search for Improved Performance of Sample Multiplexing Workflows. J. Proteome Res 18, 1299–1306. 10.1021/acs.jproteome.8b00899. [DOI] [PMC free article] [PubMed] [Google Scholar]
- 100.Schweppe DK, Eng JK, Yu Q, Bailey D, Rad R, Navarrete-Perea J, Huttlin EL, Erickson BK, Paulo JA, and Gygi SP (2020). Full-Featured, Real-Time Database Searching Platform Enables Fast and Accurate Multiplexed Quantitative Proteomics. J. Proteome Res 19, 2026–2034. 10.1021/acs.jproteome.9b00860. [DOI] [PMC free article] [PubMed] [Google Scholar]
- 101.Schweppe DK, Rusin SF, Gygi SP, and Paulo JA (2020). Optimized Workflow for Multiplexed Phosphorylation Analysis of TMT-Labeled Peptides Using High-Field Asymmetric Waveform Ion Mobility Spectrometry. J Proteome Res 19, 554–560. 10.1021/acs.jproteome.9b00759. [DOI] [PMC free article] [PubMed] [Google Scholar]
- 102.Rad R, Li J, Mintseris J, O’Connell J, Gygi SP, and Schweppe DK (2021). Improved Monoisotopic Mass Estimation for Deeper Proteome Coverage. J Proteome Res 20, 591–598. 10.1021/acs.jproteome.0c00563. [DOI] [PMC free article] [PubMed] [Google Scholar]
- 103.Eng JK, Jahan TA, and Hoopmann MR (2013). Comet: an open-source MS/MS sequence database search tool. Proteomics 13, 22–24. 10.1002/pmic.201200439. [DOI] [PubMed] [Google Scholar]
- 104.Elias JE, and Gygi SP (2007). Target-decoy search strategy for increased confidence in large-scale protein identifications by mass spectrometry. Nat Methods 4, 207–214. 10.1038/nmeth1019. [DOI] [PubMed] [Google Scholar]
- 105.Huttlin EL, Jedrychowski MP, Elias JE, Goswami T, Rad R, Beausoleil SA, Villén J, Haas W, Sowa ME, and Gygi SP (2010). A tissue-specific atlas of mouse protein phosphorylation and expression. Cell 143, 1174–1189. 10.1016/j.cell.2010.12.001. [DOI] [PMC free article] [PubMed] [Google Scholar]
- 106.Savitski MM, Wilhelm M, Hahne H, Kuster B, and Bantscheff M (2015). A Scalable Approach for Protein False Discovery Rate Estimation in Large Proteomic Data Sets. Mol. Cell Proteomics 14, 2394–2404. 10.1074/mcp.M114.046995. [DOI] [PMC free article] [PubMed] [Google Scholar]
- 107.Beausoleil SA, Villén J, Gerber SA, Rush J, and Gygi SP (2006). A probability-based approach for high-throughput protein phosphorylation analysis and site localization. Nat Biotechnol 24, 1285–1292. 10.1038/nbt1240. [DOI] [PubMed] [Google Scholar]
- 108.Gassaway BM, Li J, Rad R, Mintseris J, Mohler K, Levy T, Aguiar M, Beausoleil SA, Paulo JA, Rinehart J, et al. (2022). A multi-purpose, regenerable, proteome-scale, human phosphoserine resource for phosphoproteomics. Nat Methods. 10.1038/s41592-022-01638-5. [DOI] [PMC free article] [PubMed] [Google Scholar]
- 109.R: The R Project for Statistical Computing. https://www.r-project.org/.
- 110.RStudio Team (2020). RStudio: Integrated Development for R. RStudio, PBC, Boston, MA: URL http://www.rstudio.com/. [Google Scholar]
- 111.Tyanova S, Temu T, Sinitcyn P, Carlson A, Hein MY, Geiger T, Mann M, and Cox J (2016). The Perseus computational platform for comprehensive analysis of (prote)omics data. Nat. Methods 13, 731–740. 10.1038/nmeth.3901. [DOI] [PubMed] [Google Scholar]
- 112.Kim HJ, Kim T, Hoffman NJ, Xiao D, James DE, Humphrey SJ, and Yang P (2021). PhosR enables processing and functional analysis of phosphoproteomic data. Cell Rep 34, 108771. 10.1016/j.celrep.2021.108771. [DOI] [PubMed] [Google Scholar]
- 113.Tai YC (2023). timecourse: Statistical Analysis for Developmental Microarray Time Course Data. Version 1.72.0 (Bioconductor version: Release (3.17)). 10.18129/B9.bioc.timecourse 10.18129/B9.bioc.timecourse. [DOI] [Google Scholar]
- 114.JMP Statistical Software. https://www.jmp.com/en_us/home.html.
- 115.Brademan DR, Riley NM, Kwiecien NW, and Coon JJ (2019). Interactive Peptide Spectral Annotator: A Versatile Web-based Tool for Proteomic Applications. Mol. Cell Proteomics 18, S193–S201. 10.1074/mcp.TIR118.001209. [DOI] [PMC free article] [PubMed] [Google Scholar]
- 116.Hughes CS, Moggridge S, Müller T, Sorensen PH, Morin GB, and Krijgsveld J (2019). Single-pot, solid-phase-enhanced sample preparation for proteomics experiments. Nat Protoc 14, 68–85. 10.1038/s41596-018-0082-x. [DOI] [PubMed] [Google Scholar]
- 117.Tyanova S, Temu T, and Cox J (2016). The MaxQuant computational platform for mass spectrometry-based shotgun proteomics. Nature Protocols 11, 2301–2319. 10.1038/nprot.2016.136. [DOI] [PubMed] [Google Scholar]
- 118.An H, Ordureau A, Körner M, Paulo JA, and Harper JW (2020). Systematic quantitative analysis of ribosome inventory during nutrient stress. Nature 583, 303–309. 10.1038/s41586-020-2446-y. [DOI] [PMC free article] [PubMed] [Google Scholar]
- 119.Hung K-F, Sidorova JM, Nghiem P, and Kawasumi M (2020). The 6–4 photoproduct is the trigger of UV-induced replication blockage and ATR activation. Proc. Natl. Acad. Sci. U.S.A 117, 12806–12816. 10.1073/pnas.1917196117. [DOI] [PMC free article] [PubMed] [Google Scholar]
- 120.Aikin TJ, Peterson AF, Pokrass MJ, Clark HR, and Regot S (2020). MAPK activity dynamics regulate non-cell autonomous effects of oncogene expression. eLife 9, e60541. 10.7554/eLife.60541. [DOI] [PMC free article] [PubMed] [Google Scholar]
- 121.Clark HR, McKenney C, Livingston NM, Gershman A, Sajjan S, Chan IS, Ewald AJ, Timp W, Wu B, Singh A, et al. (2021). Epigenetically regulated digital signaling defines epithelial innate immunity at the tissue level. Nat Commun 12, 1836. 10.1038/s41467-021-22070-x. [DOI] [PMC free article] [PubMed] [Google Scholar]
- 122.MATLAB. https://www.mathworks.com/products/matlab.html.
- 123.Schneider CA, Rasband WS, and Eliceiri KW (2012). NIH Image to ImageJ: 25 years of image analysis. Nat Methods 9, 671–675. 10.1038/nmeth.2089. [DOI] [PMC free article] [PubMed] [Google Scholar]
Associated Data
This section collects any data citations, data availability statements, or supplementary materials included in this article.
Supplementary Materials
(A) Whole cell extracts from HaCaT and MCF10a cells treated with varying fluences of UV-C (J/m2) and harvested 15 minutes post-UV were analyzed by Phos-tag gels and immunoblotting for ZAK. (B) Quantification of fractional ZAK phosphorylation in response to UV as in (A). Fraction ZAK phosphorylated in HaCaT (blue) and MCF10a (orange) cells (ZAK-P, relative to untreated (0 J/m2 UV-C)) versus UV fluence (J/m2) were fit to a four-parameter dose-response curve to estimate the EC50 and Hill coefficient (nH). ZAK’s stimulus-response curves were steeply sigmoidal (Hill coefficient (nH) ~ 3.8 and 5 for HaCaT and MCF10a respectively). (C) Whole cell extracts from HaCaT cells treated with varying fluences of UV-C (J/m2) and harvested 15 minutes post-UV were analyzed by Phos-tag gels (for ZAK and GCN2) or SDS-PAGE and immunoblotted (IB) with the indicated antibodies. (D) 10–50% sucrose gradients from HaCaT cells left untreated (UT) or treated with 500 J/m2 UV-C and allowed to recover for 30 min post-UV treatment. Fractions analyzed by immunoblotting for EDF1. (E) MCF10a cells expressing H2B-iRFP were pretreated (1 h) with DMSO (mock) or ZAK inhibitor (PLX4720, 5 μM) before being treated with or without UV-C (500 J/m2) and live imaged. Mitosis counting was automated using H2B-iRFP, and the mitotic rate was calculated as a 2-hour sliding window average number of mitoses. (F) Schematic of TMTpro-based time-resolved phosphoproteomics and proteomics. HaCaT cells were left untreated (UT) or treated with 500 J/m2 UV-C and allowed to recover for 1, 5, 15, or 30 minutes. Four biological replicates were collected for the 1-minute time-point and three biological replicates were collected for UT samples and all other time points. As indicated, 16-plex TMTpro-based phosphoproteomics and proteomics were performed with biological replicates per condition (see Table S1). (G-J) Volcano plots (−log10[p-value] versus log2[ratio]) display the differences in protein abundance between cells retrieved at 1, 5, 15, and 30 minutes after UV-C treatment and the untreated (UT) sample (see panel F). Statistically, up- or down-regulated proteins were determined by a two-sided Welch’s t-test (adjusted to 1% FDR for multiple comparisons). Dotted lines delineate r1.5-fold change (x-axis) and 0.05 p-value (y-axis). non-significant (ns). We quantified 9647 proteins for total proteomics and compared their differential abundance relative to UT cells across the four time points. Only two proteins, NLRP3 and TTC28, were significantly upregulated (fold change > 1.5, p-value < 0.05) at 1, 15, and 30 minutes following UV-treatment. Additionally, we observed significant downregulation of several proteins 15–30 min post-UV treatment, including factors involved in regulating cell-cycle progression (CDC25A, CDC25B, MDM2, CCND1). Importantly, ~98% of the cellular proteome remained unperturbed during this post-UV time course. (Table S1, and HTML plots in Supp. Item). (K) Principal component analysis (PCA) of phosphoproteomics data obtained from 16-plex TMTpro-based analysis.
(A-B) Volcano plots (−log10[p-value] versus log2[ratio]) display differences in abundance of phosphosites assigned to protein kinases in HaCaT cells recovered for 5- and 30-min post-UV-C (500 J/m2) compared to untreated (UT) samples. Statistically, up- or down-regulated proteins were determined by a two-sided Welch’s t-test (adjusted to 1% FDR for multiple comparisons). Dotted lines delineate r1.5-fold change (x-axis) and 0.05 p-value (y-axis). non-significant (ns). Among protein kinases (n=2588 quantified sites), the most significantly upregulated sites in response to UV treatment were overrepresented on kinases involved in the RSR at both early (5 min) and late (30 min) time points (Table S1, and HTML plots in Supp. Item). (C-D) Same as in (A-B) except for phosphosites assigned to transcription factors (TFs). We observed robust phosphorylation on TFs that operate downstream of MAPKs (e.g., ATF2, ATF7, JUN, and JUND), on zinc-finger proteins (e.g., ZNF407, ZNF408, ZNF462, ZNF581, ZNF592, ZNF620, ZNF629, ZNF644, ZNF800), and general TFs (e.g., GTF2, HMGA1, NR3C1) all of which may induce transcriptional programs in response to UV. (E-F) Same as in (A-B) except for phosphosites assigned to ribosomal proteins. We captured UV-induced phosphorylation sites on several 40S ribosomal proteins (e.g., RPS2, RPS10, RPS20, RPS3, RPS26) that decorate the mRNA entry channel47,48, are proximal to the collided disome interface, or have previously been shown to be modified by E3 ubiquitin ligases32,33, suggesting that these sites may be phosphorylated by kinases that sense collisions. (G) Phosphosites (red dots) mapped to indicated ribosomal proteins (blue) overlaid on the structure of the human ribosome, shown in three orientations (PDB: 4UG0)85. (left) phosphosites decorating r-proteins at the mRNA entry channel on the 40S subunit. (middle and right) phosphosites on 60S and 40S r-proteins in two orientations; orange, helix 14 on 18S rRNA (nucleotides 460–480), previously mapped ZAK-binding site on ribosome16; green, E-site tRNA.
(A) Through k-means clustering analysis, we identified 14 distinct profiles of phosphosites in response to UV-stress using our time-resolved dataset. The number of phosphosites per cluster (n) is provided, and cluster means displayed in the bottom right panel (see Table S1). (B) Phosphosite-level PCA biplot obtained from time-resolved phosphoproteomics data displaying clockwise temporal pattern; color coding for each cluster as represented in panel A; circles drawn around cluster centers, with size proportional to count inside clusters. Proximal clusters on the biplot exhibited comparable trajectories (e.g., clusters 4, 9 and 11), antipodal clusters exhibited inverse trajectories (clusters 3 and 9), whereas orthogonal clusters exhibited uncorrelated trajectories (clusters 9 and 13). (C) Multivariate empirical Bayes analysis of time-resolved phosphoproteomics data from HaCaT cells. To understand the changes in the abundance of individual sites over a 30-minute time course, we performed a Hotelling T-squared distribution (T2) analysis86,87. The plot displays log10(time course T2 statistic) versus log2(ratio 30 min/UT). Each dot represents how the abundance of an individually quantified phosphosite changed during the 30-minute post-UV recovery period based on the 16 independent abundance measurements. The fourteen individual clusters from panel A are superimposed by color coding, enabling us to group similar clusters spatially. For example, clusters 9 and 11 represented sites that were dephosphorylated following UV treatment. In contrast, clusters 3 and 14 defined sites whose trajectories increased monotonically throughout the 30-minute period post-UV. Clusters centered between −1 and +1 on the x-axis and in the bottom half of the y-axis (clusters 1, 6, and 8) represented sites whose temporal trajectories were broadly unchanged following UV treatment. In contrast, cluster 13, located in the top-half of the y-axis, represented sites whose phosphorylation increased transiently between 5- and 15-min post-UV but returned to baseline by 30 minutes. Notably, this cluster contained phosphosites on factors associated with mTOR signaling (MTOR, RPTOR, RPS6KA1, RPS6KA3, EIF4B, TSC2), suggesting that mTOR signaling may be transiently upregulated in response to UV-induced elongation arrest but is restored to baseline within 30 minutes of UV exposure possibly through negative feedback (Table S1).
(A) Schematic depiction of the motif enrichment analysis pipeline42 to extract kinase-specific signatures from phosphoproteomics data in Figure S1F (see methods for details). (B-E) Kinases whose activities are significantly enriched or depleted in response to UV-C (500 J/m2) at 1, 5, 15, or 30-minutes post-UV are represented as volcano plots of −log10-transformed adjusted p-values versus log2-transformed frequency factors. Statistical significance was determined using one-sided exact Fisher’s test and p-values adjusted for multiple hypotheses using the Benjamini-Hochberg method. Statistically up- and down-regulated kinases are represented as orange and blue dots respectively (STAR methods for details; see Table S1, and animated HTML plot in Supp. Item). (F) Schematic depiction of kinase translocation reporter (KTR). MCF10a cells expressing JNK and p38 KTRs were treated with DMSO (mock), ANS (0.38 μM), or UV-C (500 J/m2). Scale bar = 10 μm. (G-H) MCF10a cells expressing JNK and p38 KTRs were pretreated (1 h) with DMSO (mock) or p38 inhibitor (SB 203580, 1.4 μM) before treatment with 500 J/m2 (panel G) or 1500 J/m2 (panel H) UV-C. Cells were live imaged every 30 seconds. Bold lines and shaded regions represent the median and 40th-60th percentiles, respectively.
(A) Schematic of TMT-based phosphoproteomics and proteomics. MCF10a WT and ΔZAK cells were mock-treated (DMSO) or pretreated (30 min) with a ZAK inhibitor (ZAKi, Nilotinib, 1 μM) and left untreated (UT) or treated with 500 J/m2 UV-C and allowed to recover for 15 minutes post-UV treatment. 16-plex TMTpro-based phosphoproteomics and proteomics was performed with two biological replicates per condition as indicated. (B) Volcano plot (−log10[p-value] versus log2[ratio]) displays the differences in the abundance of proteins in MCF10a cells lacking ZAK (ΔZAK) compared to parental wild-type (WT) cells. Statistically, up- or down-regulated proteins were determined by a two-sided Welch’s t-test (adjusted to 1% FDR for multiple comparisons). Dotted lines delineate r1.5-fold change (x-axis) and 0.05 p-value (y-axis). non-significant (ns). (Table S2, and HTML plots in Supp. Item). To account for changes in the total proteome in ΔZAK cells changes in phosphorylation were normalized to total protein levels (see Figure 2A; Table S2). (C) Principal component analysis (PCA) of phosphoproteomics data obtained from (A). (D) Phosphoproteome level correlation plot. The calculated correlation factors (Pearson (R) and R squared) and data fit are indicated. (HTML plots in Supp. Item) (E) Volcano plot (−log10[p-value] versus log2[ratio]) displays the differences in the abundance of phosphosites in response to UV-C between MCF10a ΔZAK cells pretreated (30 min) with ZAK inhibitor (ZAKi, Nilotinib, 1 μM) compared to ΔZAK (DMSO) mock-treated cells, as depicted in panel A. Statistically, up- or down-regulated phosphopeptides were determined by a two-sided Welch’s t-test (adjusted to 1% FDR for multiple comparisons). Dotted lines delineate a r1.5-fold change (x-axis) and a 0.05 p-value (y-axis). non-significant (ns). By comparing the effect of Nilotinib on UV-mediated changes in phosphosites in ΔZAK cells, we classified off-target effects from the inhibitor itself. This analysis revealed that Nilotinib specifically targets ZAK with only 60 additional sites affected in a ΔZAK background (Table S2, and HTML plots in Supp. Item).
(A) Nilotinib inhibits ZAK’s autophosphorylation activity with an IC50 of 0.1 μM in vivo. Phos-tag gel showing loss of UV-mediated (UV-C, 500 J/m2) ZAK autophosphorylation with increasing doses of Nilotinib. (bottom) Quantification of fractional ZAK phosphorylation (ZAK-P) in response to UV in HaCaT cells pre-treated for 30 minutes with indicated doses of Nilotinib. Fraction ZAK-P in response to UV versus Nilotinib (μM) were fit to a sigmoidal dose-response curve to estimate IC50. (B) Vemurafenib inhibits ZAK’s autophosphorylation activity with an IC50 of 0.1 μM in vivo. (C) A-92 inhibits GCN2’s autophosphorylation activity with an IC50 of 0.2 μM in vivo. (D) JNK inhibitor (JNKi) VIII inhibits JNK’s kinase activity with an IC50 of 1.6 μM in vivo. Immunoblot showing UV-C-mediated JUN (Ser-63) phosphorylation loss in cells pre-treated with increasing doses of JNKi VIII. Fraction JUN-P in response to UV-C versus JNKi VIII (μM) were fit to a sigmoidal dose-response curve to estimate IC50. (E) p38 inhibitor (p38i, SB 203580) inhibits p38’s kinase activity with an IC50 of 0.14 μM in vivo. Phos-tag gel showing loss of UV-C-mediated MSK2 phosphorylation with increasing doses of p38i. Fraction MSK2-P in response to UV-C versus p38i (μM) were fit to a sigmoidal dose-response curve to estimate IC50. (F) ATR inhibitor (ATR, VE-821) inhibits ATR’s kinase activity with an IC50 of 0.24 μM in vivo. Phos-tag gel showing loss of UV-C-mediated CHEK1 phosphorylation with increasing doses of ATRi. Fraction CHEK1-P in response to UV-C versus ATRi (μM) were fit to a sigmoidal dose-response curve to estimate IC50. (G) Schematic of TMTpro-based phosphoproteomics and proteomics in HaCaT cells. HaCaT cells were mock-treated (DMSO) or pretreated for 30 minutes with ZAKi (Nilotinib, 1 μM), p38i (SB 203580, 1.4 μM), JNKi (JNKi VIII, 16 μM), ZAKi (Vemurafenib, 1 μM), GCN2i (A-92, 2 μM) or ATRi (VE-821, 2.4 μM) and then left untreated (UT) or treated with 500 J/m2 UV-C (UV) and allowed to recover for 15 minutes post-UV treatment. 16-plex TMTpro-based phosphoproteomics and proteomics were performed with two biological replicates per condition as indicated (see Table S3). (H) Venn diagram showing overlap between statistically significant UV-mediated phosphorylation sites that are dependent on ZAKi (Nilotinib, Nil), p38i, JNKi, ZAKi (Vemurafenib, Vem), GCN2i (A-92), and ATRi (VE-821); number of significant phosphosites overlapping between pre-treatment regimes is indicated, with % overlap indicated in parenthesis (see Figure S7 and Table S3).
(A-B) Analysis of the phosphoproteomics experiment depicted in Figure S6G for ZAK kinase inhibitor. (A) Volcano plot (−log10[p-value] versus log2[ratio]) displays the differences in the abundance of phosphosites in response to UV-C (500 J/m2) treatment between HaCaT cells pretreated with a ZAK inhibitor (ZAKi, Nilotinib, 1 μM) compared to (DMSO) mock-treated cells, as depicted in Figure S6G. Statistically, up- or down-regulated phosphopeptides were determined by a two-sided Welch’s t-test (adjusted to 1% FDR for multiple comparisons). Dotted lines delineate a r1.5-fold change (x-axis) and a 0.05 p-value (y-axis). non-significant (ns). (B) Motif enrichment analysis of phosphoproteomics data presented in panel A. Kinases whose activities are up- or down-regulated (in orange and blue dots respectively) in response to UV-C (500 J/m2) in ZAKi compared to WT cells are represented in a volcano plot of log10-transformed adjusted p-values versus log2-transformed frequency factors. Statistical significance was determined using one-sided exact Fisher’s test and p-values adjusted for multiple hypotheses using the Benjamini-Hochberg method (see Table S3). (C-D) As in (A-B) but for HaCaT cells pretreated with p38i (SB 203580, 1.4 μM, 30 min pre-treatment) (E-F) As in (A-B) but for HaCaT cells pretreated with JNKi (JNKi VIII, 16 μM, 30 min pre-treatment) (G-H) As in (A-B) but for HaCaT cells pretreated with ATRi (VE-821, 2.4 μM, 30 min pre-treatment) (Table S3). For panels A, C, E, and G see HTML plots in Supp. Item.
(A) Phosphoproteome level correlation plot of the effect of p38i on UV response (y-axis) against the ZAKi (Nilotinib) effect on UV response (x-axis). The calculated correlation factors (Pearson (R) and R squared) and data fit are indicated. (B) Same as in (A) but for the JNKi effect on UV response (y-axis) against the ZAKi (Nilotinib) effect on the UV response (x-axis (C) Summary of notable targets regulated by p38 and JNK downstream of ZAK in response to UV-mediated ribotoxic stress. (D) Phosphoproteome level correlation plot of JNKi effect on ZAKi response to UV treatment (y-axis) versus p38i effect on ZAKi response to UV treatment (x-axis) (see text for details). (E) As in (A), but for the effect of ATRi on UV response (y-axis) against the ZAKi (Nilotinib) effect on UV response (x-axis). (F) As in (A), but for the effect of GCN2i on UV response (y-axis) against the ZAKi (Nil) effect on UV response (x-axis) (see Table S3, and HTML plots in Supp. Item).
(A) Schematic of TMTpro-based phosphoproteomics and proteomics. MCF10a WT and ΔGCN2 cells were mock-treated (DMSO) or pretreated (30 min) with a GCN2 inhibitor (GCN2i, A-92, 2 μM) and left untreated (UT) or treated with UV-C and allowed to recover for 15 minutes post-UV treatment. As indicated, 16-plex TMTpro-based phosphoproteomics and proteomics were performed with two biological replicates per condition. (B) Volcano plot of (−log10[p-value] versus log2[ratio]) displays the differences in the abundance of proteins in MCF10a cells lacking GCN2 (ΔGCN2) compared to parental wild-type (WT) cells. Statistically, up- or down-regulated proteins were determined by a two-sided Welch’s t-test (adjusted to 1% FDR for multiple comparisons). Dotted lines delineate a r1.5-fold change (x-axis) and a 0.05 p-value (y-axis). non-significant (ns). (see Table S2, and HTML plots in Supp. Item). To account for changes in the total proteome in ΔGCN2 cells changes in phosphorylation were normalized to total protein levels (see Figure 2E; Table S2). (C) Principal component analysis (PCA) of phosphoproteomics data obtained from 16-plex TMTpro-based analysis as described in (A). (D) Whole cell extracts of MCF10a WT and ΔGCN2 cells pretreated (1 h) with DMSO (mock) or PERK inhibitor (PERKi, GSK2606414, 0.3 μM) followed by treatment with DMSO (UT, mock-untreated), UV-C (500 J/m2, 15 min recovery post-UV), or tunicamycin (TM, 2 μg/ml, 2 h treatment) were analyzed by Phos-tag gels (for p38 and eIF2α) or SDS-PAGE and immunoblotted (IB) with the indicated antibodies (n=2). Although the kinase-enrichment analysis predicted downregulation of GCN2/PERK activity, the analysis itself was unable to discriminate between the activities of the closely-related eIF2α kinases GCN2 and PERK in ΔGCN2 or GCN2i MCF10a cells responding to ribotoxic stress (see Figure 2G and Figure S9F). Pretreatment of cells with a PERK inhibitor (PERKi) did not affect eIF2α phosphorylation (eIF2α-P) in response to UV, whereas deletion of GCN2 led to complete loss of eIF2α-P (compare lanes 5–8). Conversely, deletion of GCN2 did not affect eIF2α-P in cells treated with tunicamycin to induce ER stress, whereas PERKi led to complete loss of eIF2α-P (compare lanes 9–12). These data clarified that GCN2 regulates the increase in eIF2α-P in cells responding to UV-mediated ribotoxic stress. (E) Volcano plot (−log10[p-value] versus log2[ratio]) displays the differences in the abundance of phosphosites in response to UV-C treatment between MCF10a cells pretreated with a GCN2 inhibitor (GCN2i) compared to (DMSO) mock-treated cells, as depicted in panel A. Statistically, up- or down-regulated phosphopeptides were determined by a two-sided Welch’s t-test (adjusted to 1% FDR for multiple comparisons). Dotted lines delineate a r1.5-fold change (x-axis) and a 0.05 p-value (y-axis). non-significant (ns) (see Table S2, and HTML plots in Supp. Item). (F) Motif enrichment analysis of phosphoproteomics data presented in panel E. Kinases whose activities are up- or down-regulated (orange and blue dots respectively) in response to UV-C in GCN2i compared to WT MCF10a cells are represented in a volcano plot of log10-transformed adjusted p-values versus log2-transformed frequency factors. Statistical significance was determined using one-sided exact Fisher’s test and p-values adjusted for multiple hypotheses using the Benjamini-Hochberg method (Table S2, and HTML plots in Supp. Item). (G) Phosphoproteome level correlation plot in MCF10a cells of the effect of GCN2i (compared to WT cells) on the UV response (y-axis) against the GCN2 knock-out (ΔGCN2) effect (compared to WT cells) on the UV response (x-axis). The calculated correlation factors (Pearson (R) and R squared) and data fit are indicated. (HTML plot in Supp. Item). (H) Volcano plot (−log10[p-value] versus log2[ratio]) displays the differences in the abundance of phosphosites in response to UV-C treatment between ΔGCN2 MCF10a cells pretreated with a GCN2 inhibitor (GCN2i) compared to ΔGCN2 cells (DMSO) mock-treated, as depicted in (A). Statistically, up- or down-regulated phosphopeptides were determined by a two-sided Welch’s t-test (adjusted to 1% FDR for multiple comparisons). Dotted lines delineate a r1.5-fold change (x-axis) and a 0.05 p-value (y-axis). non-significant (ns). By comparing the effect of GCN2i on UV-mediated changes in phosphorylation in ΔGCN2 cells, we identified 275 additional phosphosites that were significantly downregulated in the ΔGCN2 background, and are likely to be off-target effects of the GCN2 inhibitor (Table S2, and HTML plot in Supp. Item).
(A-B) Fixed immunofluorescence images of untreated (UT) or UV-C treated (500 J/m2) MCF10a WT cells harvested at indicated time points post-UV-C treatment. For the detection of UV-C-induced photolesions (in panel A), fixed cells were denatured using 2 M HCl for 10 minutes at 37°C, followed by rinsing with phosphate-buffered saline (PBS) to remove the HCl, prior to the blocking step (STAR methods for details). Scale bar = 10 μm. (C) MCF10a cells expressing H2B-iRFP were pretreated with DMSO, ZAK inhibitor (ZAKi, PLX4720, 5 μM), or ATR inhibitor (ATRi, VE-821, 2.5 μM), before being treated with or without UV-C (500 J/m2) and live imaged. Mitosis counting was done manually using H2B-iRFP, and the mitotic rate was calculated as the percent of cells that undergo mitosis during the first 3 hours following UV or mock. (D-E) MCF10a WT and ΔZAK cells were treated with 500 J/m2 UV-C. Cumulative cell death was measured with a fluorescent Caspase 3/7 dye up to 12 h (D) or 24 h (E). WT data shown in panels D-E are the same as WT-DMSO shown in Figures 3E and 3F, respectively. Two-sided T-test.
(A) Volcano plot of log2-transformed fold-change in the abundance of proteins from MCF10a ΔGCN2 (UT, DMSO) compared to WT (UT, DMSO) cells, dataset from Figure S9A. 60S and 40S r-proteins are colored in orange and blue respectively (see Table S2). (B) Hierarchical clustering of r-proteins from MCF10a WT and ΔGCN2 cells under basal conditions (DMSO, UT). Columns, scaled TMTpro mean relative abundance (R. A.) for MCF10a WT-UT-DMSO and ΔGCN2-UT-DMSO; rows, r-proteins (see Table S2). (C) Whole-cell extracts from MCF10a WT and ΔGCN2 cells under basal conditions (UT, DMSO) were analyzed by SDS-PAGE and immunoblotted (IB) with the indicated antibodies. (D) Violin plots of log2-transformed fold-change in the abundance of lysosomal (n=60) and ribosomal (n=75) proteins from MCF10a ΔGCN2 (UT, DMSO) compared to WT (UT, DMSO) cells. Dataset from Figure S9A. (see Table S2). (E) 10–35% sucrose gradients of RNase A-digested lysates of untreated (UT) or UV-C (500 J/m2) treated HaCaT WT (DMSO, mock pre-treatment) and GCN2i (A-92, 2 μM, 30 min pre-treatment) cells, harvested 15 minutes post-UV treatment. (F) Whole-cell extracts from MCF10a WT and ΔGCN2 cells pretreated (30 min) with DMSO (mock) or GCN2i (A-92, 2 μM) and left untreated (0 J/m2) or treated with UV-C (500 J/m2) and harvested 15 minutes post-UV were analyzed by SDS-PAGE and immunoblotted with the indicated antibodies. (G) MS/MS spectrum annotation of quantified eS10 peptide modified with K-GG at both K138 and K139 positions. The peptide sequence (top) is marked with the locations of matched fragment ions, the annotated mass spectrum (middle), and visualization of mass error in parts-per-million for all matched fragment ions (bottom). (H) Quantification of scaled TMTpro relative abundance (n = 5 independent peptide quantification) of the doubly modified diGly eS10-K138/139 peptide from MCF10a WT and ΔGCN2 cells treated or not with UV-C (500 J/m2) and harvested 15 minutes post-UV treatment. (I-J) MCF10a WT and ΔGCN2 cells were untreated (panel I) or treated with UV-C (1500 J/m2, panel J) and live imaged for 12 hours after. JNK activity was quantified with the JNK KTR. Bold lines and shaded regions represent the median and interquartile range, respectively. (K-L) MCF10a WT and ΔGCN2 cells were treated as in panels I-J respectively but pretreated (1 h) with or without ZAK inhibitor (PLX4720, 5 μM) or JNK inhibitor (JNKi VIII, 2.5 μM). Cell death was measured with a fluorescent Caspase 3/7 dye. Two-sided t-test. (M) MCF10a WT and ΔGCN2 cells were treated with UV-C (500 J/m2) and live imaged for 12 hours after. p38 activity was quantified with the p38 KTR. Bold lines and shaded regions represent the median and interquartile range, respectively.
(A) Immunoprecipitation (IP) of 3x-FLAG-tagged β-TrCP1 (FBXW1A) and β-TrCP2 (FBXW11) transiently expressed in HEK293T cells either untreated or treated with UV-C (500 J/m2) and allowed to recover for 30 min post-UV treatment prior to harvest. Whole cell extracts (Input, 1%) and elutions from IPs (10%) were analyzed by Phos-tag gels (for ZAK) or SDS-PAGE and immunoblotted (IB) with the indicated antibodies (n=2) (B) 10–50% sucrose gradients of lysates of MCF10a ΔZAK cells complemented with wild-type (WT) or cluster 2 (S-D) phosphomimetic of ZAK left untreated (UT) or treated with UV-C (500 J/m2) and allowed to recover for 30 min post-UV. Fractions were analyzed by immunoblotting for ZAK. (C) Whole cell extracts from MCF10a ΔZAK cells complemented with WT, kinase-dead (T161A-S165A), and cluster 2 (S-A) variants of ZAK were treated with UV-C (500 J/m2) to induce collisions, harvested at indicated time points, and analyzed by immunoblotting for ZAK and actin. (D) AHA-based translatomics to determine degradation of ZAK in response to ribosomal collisions. (top) Schematic of AHA-based translatomics (see methods). HaCaT cells were conditioned in fresh media for 2 hours on the day of the experiment, then starved for methionine (-Met, 1 h) in media containing no Met, pulsed for 2 hours in -Met media supplemented with azidohomoalanine (AHA) which is metabolically incorporated into newly-synthesized proteins in place in methionine, followed by AHA washout by placing cells in media containing excess methionine (1 h). Following this 1 h recovery period, cells were treated with DMSO (mock) or a sub-inhibitory dose of ANS (0.38 μM) to induce collisions. At specific time points post-treatment lysates were extracted, the azide-group in newly-synthesized proteins were functionalized with biotin-alkyne through click chemistry, purified with streptavidin resin, and immunoblotted for ZAK (bottom left panel, top). (bottom left panel, middle) Half of the AHA-labeled samples were functionalized with TAMRA-alkyne (instead of biotin-alkyne) for in-gel fluorescence analysis. (bottom left panel, bottom) Coomassie-staining of sample lanes following in-gel fluorescence analysis; (bottom right panel) Quantification of AHA-labeled ZAK, isolated using streptavidin resin after biotin-alkyne click chemistry. Data points, mean ± SD (n=2). ZAK protein levels (relative to time point 0 h) for UT and low-dose ANS treatment were fit to a one-phase exponential decay model to estimate half-lives (t1/2). (E-G) MCF10a ΔZAK cells were complemented with WT (panel E), kinase-dead (T161A-S165A) (panel F), or cluster 2 (S-A) phosphomutant (panel G) variants of ZAK with an N-terminal mNeonGreen tag. Cells were pretreated (1 h) with DMSO (mock), MLN4924 (1 μM), or bortezomib (0.5 μM) followed by treatment with a sub-inhibitory dose of ANS (0.38 μM) to induce collisions and live imaged. mNeonGreen-ZAK fluorescence levels were measured and normalized to the fluorescence before treatment. Bold lines and shaded regions represent the median and 40th-60th percentiles, respectively. (H) Domain organization of ZAK-WT and ZAK-ΔS670−713ΔCTD774−800 annotated as in Figure 5A (also see text for details); orange, β-TrCP phosphodegron motif (656DSGFSS661). (I-J) MCF10a ΔZAK cells expressing JNK KTR were complemented with ZAK-ΔS670−713ΔCTD774−800 with an N-terminal mNeonGreen tag. Cells were treated with DMSO (mock) or a sub-inhibitory dose of ANS (0.38 μM) to induce collisions and live imaged. JNK activity was measured with the JNK KTR (panel I, median and interquartile range are shown). mNeonGreen-ZAK fluorescence levels were measured and normalized to the fluorescence before treatment (panel J, bold lines and shaded regions represent the median and 40th-60th percentiles, respectively).
(A-B) MCF10a ΔZAK cells expressing JNK and p38 KTRs were complemented with indicated ZAK derivates and treated with DMSO (mock) during live imaging. Median p38 (panel A) and JNK (panel B) activities shown for each cell line. (C-E) MCF10a ΔZAK cells complemented with WT (panel C), cluster 2 (S-A) (panel D), or kinase-dead (T161A-S165A, panel E) ZAK variants were treated with ANS (0.094 μM) during live imaging. Representative images of the JNK KTR and H2B-iRFP are shown at 5 minutes before, 1 minute after, and 480 minutes after ANS treatment. Scale bar = 10 μm. (F) MCF10a ΔZAK cells complemented with WT, cluster 2 (S-A), or kinase-dead (T161A-S165A) ZAK variants were treated with ANS (0.188 μM) and live imaged for 15 hours. Cell death was manually quantified as described in supplemental methods. One-way ANOVA with Tukey-Kramer post-hoc test. (G) Proliferation curves of MCF10a ΔZAK cells complemented with WT or cluster 2 (S-A) ZAK variants pre-treated with DMSO or ANS (0.38 μM) for 19 hours. Cells were then washed and allowed to recover. Cell confluency was measured post ANS exposure using a CELLCYTE X™ imager (CYTENA) once every 24 h for the duration of 8 days. (H-I) MCF10a ΔZAK cells complemented with WT or cluster 2 (S-A) ZAK variants were treated with DMSO (mock, panel H) or ANS (0.38 μM, panel I) and live imaged for 19 hours. Median JNK activities are shown for each cell line.
HTML plots that correspond to the various analyses performed in this study. Related to Figures 1–2, Figures S1–S2, Figures S4–S5, and Figures S7–S9.
Table S1: Temporal analysis of global phosphoproteome and proteome of HaCaT cells following UV-C exposure. Related to Figure 1 and Figures S1–S4.
Table S2: Global phosphoproteome and proteome analysis of MCF10a WT, ΔZAK, ZAKi, ΔGCN2, and GCN2i cells following UV-C exposure. Related to Figure 2, Figure S5, and Figure S9.
Table S3: Global phosphoproteome and proteome analysis of HaCaT cells pre-treated with various kinase inhibitors following UV-C exposure. Related to Figure 2, Figures S6G–S6H, and Figures S7–S8.
Table S4: Immunoprecipitation (IP) and mass-spectrometry of mNeonGreen-tagged ZAK from MCF10a ΔZAK cells. Related to Figure 5E.
Data Availability Statement
Raw mass spectrometry data associated with Tables S1–S4 have been deposited to the MassIVE repository and are publicly available as of the date of publication with the dataset identifier MSV000092521. HTML plots corresponding to various analyses are included as a Supp. Item in a ZIP file. The primary phosphoproteomics datasets generated during this study are publicly available online (https://ordureau-lab.shinyapps.io/Sinha-Shinyapp/) to examine the datasets at a gene-specific level.
The paper does not report original code.
Any additional information required to reanalyze the data reported in this paper is available from the lead contact upon request.
Raw mass spectrometry data associated with Tables S1–S4 have been deposited to the MassIVE repository and are publicly available as of the date of publication with the dataset identifier MSV000092521. HTML plots are included as a Supp. Item in a ZIP file. The phosphoproteomics datasets are publicly available online (https://ordureau-lab.shinyapps.io/Sinha-Shinyapp/) to examine the data at a gene-specific level.
The paper does not report original code.
Additional information to reanalyze the data is available from the lead contact upon request.