

Abstract
INTRODUCTION
Frontotemporal lobar degeneration (FTLD) encompasses behavioral variant frontotemporal dementia (bvFTD), progressive supranuclear palsy, corticobasal syndrome/degeneration, and primary progressive aphasias (PPAs). We cross‐validated fluid biomarkers and neuroimaging.
METHODS
Seven fluid biomarkers from cerebrospinal fluid and serum were related to atrophy in 428 participants including these FTLD subtypes, logopenic variant PPA (lvPPA), Alzheimer's disease (AD), and healthy subjects. Atrophy was assessed by structural magnetic resonance imaging and atlas‐based volumetry.
RESULTS
FTLD subtypes, lvPPA, and AD showed specific profiles for neurofilament light chain, phosphorylated heavy chain, tau, phospho‐tau, amyloid beta1‐42 from serum/cerebrospinal fluid, and brain atrophy. Neurofilaments related to regional atrophy in bvFTD, whereas progranulin was associated with atrophy in semantic variant PPA. Ubiquitin showed no effects.
DISCUSSION
Results specify biomarker and atrophy patterns in FTLD and AD supporting differential diagnosis. They identify neurofilaments and progranulin in interaction with structural imaging as promising candidates for monitoring disease progression and therapy.
Highlights
Study cross‐validated neuroimaging and fluid biomarkers in dementia.
Five kinds of frontotemporal lobar degeneration and two variants of Alzheimer's disease.
Study identifies disease‐specific fluid biomarker and atrophy profiles.
Fluid biomarkers and atrophy interact in a disease‐specific way.
Neurofilaments and progranulin are proposed as biomarkers for diagnosis and therapy.
Keywords: amyloid, atrophy, fluid biomarkers, frontotemporal dementia, frontotemporal lobar degeneration, magnetic resonance imaging, neurofilaments, phospho‐tau, progranulin, tau, ubiquitin
1. BACKGROUND
Frontotemporal lobar degeneration (FTLD) represents the second most common form of early‐onset dementia, 1 following Alzheimer's disease (AD). 2 FTLD clinically comprises a behavioral presentation, namely, a behavioral variant frontotemporal dementia (bvFTD) 3 and a language presentation, referred to as primary progressive aphasia (PPA). The latter is further subdivided into non‐fluent agrammatic variant PPA (nfvPPA), semantic variant PPA (svPPA), and logopenic variant PPA (lvPPA), where the latter syndrome is related mainly to AD. 4 Apart from these syndromes, the atypical parkinsonian syndromes, progressive supranuclear palsy (PSP) and corticobasal syndrome (CBS), are also subsumed under the FTLD spectrum. For these syndromes, disease‐specific imaging patterns have been included in diagnostic algorithms to increase validity. 5 Combining neuroimaging and fluid biomarkers might further increase diagnostic validity, shedding light on the molecular pathology of FTLD subtypes, also in contrast to other neurodegenerative diseases like AD, and pave the way for etiology‐specific treatments.
While several fluid biomarkers from cerebrospinal fluid (CSF) have been established in the diagnosis of AD, no fluid biomarkers (subsequently referred to simply as biomarkers) exist for the differential diagnosis of FTLD subtypes. Such biomarkers would ideally be combined with clinical and imaging evaluation to augment diagnostic and treatment decisions. 6 , 7 Here we investigated seven biomarkers, namely, neurofilament light chain (NfL), phosphorylated neurofilament heavy chain (pNfH), total tau (referred to as tau), phosphorylated tau (ptau), amyloid beta1‐42 (abbreviated as Aβ), progranulin, and ubiquitin. These markers were measured in the CSF, mirroring potential pathologic states of the brain. Additionally, serum levels of NfL and progranulin were obtained. Investigating different biomarkers could advance the understanding of the complex neuropathological mechanisms underlying FTLD.
Neurofilaments are intermediate filaments of mature neurons that are elevated in AD and FTLD due to axonal injury and neurodegeneration. 8 , 9 , 10 Recent studies have suggested NfL as a promising biomarker candidate, 11 , 12 , 13 where NfL and pNfH from blood can discriminate between PPA subtypes. 14 CSF and blood serum NfL are potential markers for disease staging in bvFTD. 15 , 16 Serum NfL correlated with frontal brain atrophy. 17 Based on these reports, we hypothesized that neurofilaments, especially NfL, are elevated in neurodegeneration in association with atrophy.
In addition to neurofilaments, established biomarkers for AD, namely, tau, ptau, and Aβ, were investigated to compare levels between AD and FTLD cohorts. Tau aggregation in particular plays a role in AD, but also in tauopathies, that is, CBS and PSP. 18 It is known that tau, ptau, and Aβ levels can discriminate AD from other neurodegenerative diseases such as FTLD 19 and PPA syndromes, where lvPPA often shows an AD‐like CSF profile, as opposed to svPPA or nfvPPA. 20 , 21 In this study, we measured total tau and ptau levels in the CSF and hypothesized higher levels of these proteins in AD and lvPPA compared to FTLD subtypes. PSP and CBS, in particular most commonly associated with corticobasal degeneration, are regarded as tauopathies, 22 but changes in tau and ptau are controversial. 23 , 24
In AD, Aβ forms fibrils in brain plaques, 25 whereas CSF Aß is decreased. 26 We hypothesized that its most toxic 42 amino acid isoform 27 would decrease in CSF in AD and lvPPA compared to bvFTD and the other PPA types. 28 Progranulin might mediate FTLD by loss‐of‐function mutations, constituting a target for genetic disease. 29 Mutations impair progranulin function and neuronal survival. 30 We hypothesized reduced CSF and serum progranulin in FTLD but elevated levels in AD.
Our project focuses on characterizing disease‐specific patterns of fluid biomarkers and atrophy in FTLD subtypes compared to AD, its variant lvPPA, and healthy controls. Our most important aim was to cross‐validate disease‐related imaging data, here structural magnetic resonance imaging (MRI) analyzed by atlas‐based volumetry, with fluid biomarkers from serum and/or CSF as surrogate markers for histopathological disease processes.
Based on the literature, we hypothesize a significant relationship between fluid biomarkers, especially neurofilaments (NfL), and imaging data indicating neurodegeneration and atrophy in particular in bvFTD, in addition to a discriminating power of NfL and pNfH between PPA subtypes. Moreover, we hypothesize elevated tau, ptau, and decreased Aß in AD and its variant lvPPA, if compared with FTLD, namely, the other PPA syndromes and bvFTD. Finally, we hypothesize reduced progranulin in FTLD but elevated levels in AD.
RESEARCH IN CONTEXT
Systematic review: The authors cross‐validated neuroimaging and fluid biomarkers in five subtypes of frontotemporal lobar degeneration (FTLD), Alzheimer's disease (AD), and its logopenic variant in 428 participants to gain insights into related neuropathology and to identify diagnostic and prognostic markers.
Interpretation: The authors identified disease‐specific fluid biomarker profiles for neurofilaments, tau, phospho‐tau, amyloid beta 1‐42 from serum/cerebrospinal fluid, and brain atrophy in FTLD and AD. Neurofilaments related specifically to regional atrophy in behavioral variant frontotemporal dementia, whereas progranulin was associated with atrophy in semantic variant primary progressive aphasia. Ubiquitin did not show effects. Here, neurofilaments and progranulin are proposed as biomarkers for diagnosis and therapy.
Future directions: This article proposes a framework for understanding how fluid biomarkers and atrophy patterns support differential diagnosis in FTLD and AD. Future studies will elaborate how these biomarker profiles can monitor disease progression and therapy in longitudinal study designs, at best in interaction with histopathological post mortem validation.
2. METHODS
2.1. Study population
The 428 participants included healthy controls (n = 33) and patients with AD (63), lvPPA (28), bvFTD (128), nfvPPA (57), svPPA (44), CBS (26), and PSP (49). Diagnosis was based on internationally established criteria. Participants were examined between April 2011 and June 2018 within the FTLD Consortium study. 31 Twelve centers contributed data (Table S1). Data for the first visit of patients were used to perform cross‐sectional analyses. Each participant passed through comprehensive clinical and neuropsychological tests, as well as CSF and blood sampling and MRI. CSF was obtained by lumbar puncture. The FTLD Consortium study applies strict standard operating procedures (SOP) to guarantee data reliability.
Of the 428 participants, 337 (79%) were genetically tested by exome sequencing and repeat primed polymerase chain reaction for a repeat expansion in chromosome 9 open reading frame 72 (C9orf72). Of the 337 genetically tested participants, 42 (12%) carried a pathogenic or likely pathogenic variant (see also Wagner et al. 32 ). Healthy participants did not show disease‐causing variants. For detailed genetic information, please refer to Tables S2–S4. Statistical analyses did not show group differences for the genetic diagnoses in our study population, that is, C9orf72, progranulin (GRN), microtubule‐associated protein tau (MAPT), TAR DNA binding protein (TARDBP), TANK‐binding kinase 1 (TBK1), and presenilin. One might conclude that genetic differences had no relevant impact on our results.
The study was conducted following the Declaration of Helsinki 33 and approved by the local ethics committees of all centers involved (University of Ulm #39/11, March 8, 2011; University of Leipzig 137‐11‐18042011, September 22, 2011). Participants gave written informed consent.
2.2. Neuropsychological assessment
Severity of impairment was assessed with the Mini‐Mental State Examination (MMSE 34 ), the Clinical Dementia Rating (CDR) scale, 35 and a modified version, the FTLD‐modified CDR (FTLD‐CDR), covering additionally domains specific to FTLD, that is, behavior and language. 36 , 37
2.3. Biomarker measurements
All patients underwent standardized laboratory examinations. All biomarker assays are established, and detailed protocols were published elsewhere. 14 , 38 , 39 Serum was extracted from blood, centrifuged, divided into aliquots, and stored within 2 h at −80C° until analysis. CSF samples, taken by lumbar puncture, were processed similarly. Seven biomarkers were measured in CSF (NfL, pNfH, tau, ptau, Aβ1‐42, progranulin, ubiquitin) and serum (NfL, progranulin). Commercially available enzyme‐linked immunosorbent assays (ELISA) were used to measure NfL CSF (IBL, Hamburg, Germany), pNfH (Biovendor, Heidelberg, Germany), and tau and ptau (both Fujirebio, Hannover, Germany), following the manufacturers’ instructions. 14 Serum NfL (Quanterix, Lexington, MA, USA) was measured with different versions of single molecule array (SIMOA) assays. To ensure consistent measures, normalized levels across assays were calculated. Progranulin from the CSF and serum (Adipogen Inc., Seoul, Korea) was measured using ELISA. 38 Ubiquitin in CSF was determined by an in‐house method using liquid chromatography‐multiple reaction monitoring mass spectrometry (LC‐MS/MS). 39 In the present study, serum NfL was the only marker measured in healthy controls.
2.4. Magnetic resonance imaging
Structural T1‐weighted MRI was based on SOPs (field strengths 1.5 or 3.0 T, spatial resolution 1 × 1 × 1 mm, scanner types: see Table S1). Scanner performance was validated with regular phantom‐based monitoring at each site. MRI scans were analyzed using a well‐established atlas‐based volumetry (ABV) approach. 40 , 41 ABV is an objective and completely automated volumetric analysis method using the Statistical Parametric Mapping 12 software (SPM12, Wellcome Trust Centre for Neuroimaging, London, UK; www.fil.ion.ucl.ac.uk/spm) on MATLAB (R2019b, The MathWorks Inc., Natick, MA, USA). In what follows, the essential steps of the pipeline are explained (for details see Huppertz et al. 40 , 41 ). Individual MRI scans were segmented into gray matter (GM), white matter (WM), and CSF by the unified segmentation approach implemented in SPM12. 42 Thereafter, images were spatially normalized to the Montreal Neurological Institute 152 space (MNI152 43 , 44 ) by a diffeomorphic anatomic registration through exponentiated Lie algebra algorithm (DARTEL 45 ). To preserve the amount of signal from the native images and therefore compensate for the effect of spatial normalization, normalized images were modulated. As a result, the modulated images contained the absolute amount of signal or volume of each tissue class. 46
Brain volumes were obtained by voxel‐by‐voxel multiplication and following integration of spatially normalized and modulated GM, WM, and CSF images using predefined masks in the same standard space. Cortical GM and WM masks were derived from the Laboratory of NeuroImaging (LONI) Probabilistic Brain Atlas (LPBA40 47 ). Subcortical structures were derived from the Harvard‐Oxford Atlas (HOA 48 , 49 , 50 , 51 ). If LPBA40 regions overlapped with the HOA, HOA areas were used. In total, 114 areas were integrated into statistical analyses (Table S5). The volumes were corrected for individual total intracranial volume (ICV) and normalized to an approximate average ICV of healthy adults (1400 mL) for comparison reasons. 16
2.5. Statistical analysis
Statistical analysis was performed in R version 3.6.1 (R Core Team 2015) using a significance level of α = 0.05 and Bonferroni correction for all tests. Prior to statistical analysis, assumptions for parametric hypothesis testing were assessed. As most data did not fulfill these assumptions, non‐parametric tests were used for all analyses. Outliers in biomarker data, defined as a deviation of more than three standard deviations (SDs) from the mean, were excluded before analysis, as suggested previously 52 (for an overview of excluded data, see Table S6).
2.5.1. Descriptive statistics of study cohort
Differences in demographic characteristics and neuropsychological scores between cohorts were examined by Kruskal‐Wallis test and post hoc pairwise Dunn's tests in case of significance. χ2 testing was used to assess gender differences among cohorts.
2.5.2. Group differences in biomarker levels and brain volumes
Differences between groups for biomarkers and brain volume data were assessed while correcting for age using analysis of covariance (ANCOVA) on permuted data, since most of the ANCOVA assumptions were not met. Permutation testing was done using the permuco package in R. 53 The dependent variable was permuted 1 × 10⁵ times to build the test statistic, and the covariate was centered. The p value is given as the proportion of the values of the F statistic, resulting under permutation, that are equal to or more extreme than the observed F value. To assess biomarker level differences among all groups, permuted tests were performed for each biomarker followed by, in the case of a significant outcome, post hoc pairwise comparisons using the same test. For brain volume data, pairwise comparisons were performed, calculating a permutation test for each patient group versus healthy participants for each of the 114 brain areas included. For comparison of total brain volume (GM + WM), GM and WM between patient cohorts, the age‐corrected permutation ANCOVA was used as well. In addition to permutation p values and F statistics, effect sizes were calculated using age‐adjusted Hedge's g.
2.5.3. Correlation analyses
Spearman rank correlation coefficients were calculated to infer the degree and direction of correlation between age and biomarkers as well as age and regional brain volumes. To assess the relation between biomarker concentrations for each patient cohort, to infer the relation between biomarkers and brain volumes as well as to check for correlations between total brain/GM/WM volumes and biomarkers in a pooled patient cohort, we performed partial Spearman correlation, correcting for age.
2.6. Data visualization
Significant results of volumetric group comparisons and correlation analyses were visualized using Mango Software (Multi‐image Analysis graphical user interface, version 4.1, Research Imaging Institute, UTHSCSA). Each brain area was color coded using either Hedge's g or Spearman's ρ. Results were plotted onto a sample brain from the Functional Magnetic Resonance Imaging of the Brain (FMRIB) Software Library (FSL, Oxford Centre for Functional MRI of the Brain, University of Oxford, UK, version 5.0.11, MNI152 T1 1 mm.nii 54 ). To visualize the cerebellar GM, a human cerebellar atlas was used, 55 as distributed in FSL (MNIflirt version).
2.7. Statement on diversity, equity, and inclusion (DEI)
Gender was analyzed as a demographic variable (see below). There were no significant differences between groups. Regarding ethnicity, the majority of participants were of European origin. Accordingly, no specific analyses could be conducted for ethnic background, or for gender due to the relatively small group sizes.
3. RESULTS
3.1. Demographic characteristics
Demographic and neuropsychological characteristics are shown in Table 1. There was no significant effect of gender. Although there was a small significant gender difference across all cohorts, this effect was not replicated in the single group comparisons. The bvFTD cohort was younger in age compared to all other cohorts, except svPPA. svPPA patients were younger compared to lvPPA, nfvPPA, and PSP (p < .05). Disease duration did not differ between patient cohorts.
TABLE 1.
Demographic and neuropsychological characteristics.
| Parameter | Healthy | AD | lvPPA | bvFTD | nfvPPA | svPPA | PSP | CBS | Sig. |
|---|---|---|---|---|---|---|---|---|---|
| n | 33 | 63 | 28 | 128 | 57 | 44 | 49 | 26 | |
| Gender (female/male) | 11/22 | 37/26 | 14/14 | 44/84 | 29/28 | 19/25 | 26/23 | 14/12 | * a |
| Age in years | 66.1 ± 10.9 | 65.6 ± 9.3 | 68.2 ± 5.3 | 61.1 ± 8.7 | 68.1 ± 8.6 | 61.9 ± 7.6 | 67.9 ± 7.7 | 67.5 ± 6.6 | **** b |
| Disease duration in years | – | 3.2 ± 3.0(6) | 4.0 ± 4.0(1) | 3.5 ± 4.1(4) | 2.0 ± 1.6(1) | 3.1 ± 3.2(4) | 3.0 ± 2.0(3) | 3.4 ± 2.6(1) | Ns |
| MMSE | 29.0 ± 0.9(0) | 21.2 ± 5.7(2) | 21.8 ± 5.9(0) | 24.6 ± 5.1(9) | 23.9 ± 5.7(3) | 21.9 ± 6.6(3) | 25.5 ± 3.7(3) | 23.4 ± 5.2(4) | **** b |
| CDR | 0.1 ± 0.2(8) | 5.5 ± 3.1(11) | 2.7 ± 2.8(4) | 5.5 ± 3.9(6) | 2.1 ± 2.3(6) | 3.2 ± 2.4(4) | 4.3 ± 3.9(12) | 4.4 ± 3.3(5) | **** b |
| FTLD‐CDR | 0.1 ± 0.3(8) | 6.7 ± 4.0(12) | 4.8 ± 3.5(4) | 7.7 ± 5.0(6) | 4.3 ± 3.0(6) | 5.4 ± 3.1(4) | 5.7 ± 4.7(13) | 5.5 ± 3.7(5) | **** b |
Note: Mean ± standard deviation with missing values in brackets.
Significances: ns not significant; * p < .05; **** p < .0001.
Abbreviations: AD, Alzheimer's disease; bvFTD, behavioral variant frontotemporal dementia; CBS, corticobasal syndrome; CDR, clinical dementia rating; FTLD‐CDR, frontotemporal lobar degeneration‐modified CDR; lvPPA, logopenic variant primary progressive aphasia; MMSE, mini‐mental state examination; n, number of participants; nfvPPA, non‐fluent variant primary progressive aphasia; PSP, progressive supranuclear palsy; SD, standard deviation; Sig, significant group differences; svPPA, semantic variant primary progressive aphasia.
Pearson's chi‐squared test.
Bonferroni adjusted Kruskal‐Wallis test.
As expected, MMSE, CDR, and FTLD‐CDR scores differed between cohorts with generally higher MMSE and lower CDR and FTLD‐CDR scores in controls than in the disease groups (p < .0001). For MMSE, AD showed lower scores than bvFTD, nfvPPA, and PSP (p < .05). AD or bvFTD had higher CDR scores compared with PPA cohorts (p < .05). For FTLD‐CDR, nfvPPA had lower scores than AD, bvFTD, and PSP (p < .05).
3.2. Impact of age and interaction between biomarkers
To detect any potential confounders, we checked for the impact of age and investigated the interaction between biomarkers. Age negatively correlated with volume in several brain regions when pooling all patient cohorts (Table S7) and positively correlated with serum NfL (p < .001, p = .24), pNfH (p < .0001, p = .40), and ubiquitin (p < .001, p = .29). There were no significant correlations for the remaining biomarkers with age. Accordingly, age was included as confounding variable in all further analyses. A few fluid biomarkers correlated positively with other biomarkers as shown in Figure S1. Correlation analyses revealed only a small amount of statistically significant interactions between the several fluid biomarkers as these biomarkers represent different pathways. Note that results were corrected for multiple comparisons and age due to expected general age‐related effects.
3.3. Fluid biomarker levels in patients and controls
Mean CSF and serum biomarker levels are shown in Figure 1 (for means and SD see Table S8). Across all cohorts, differences were detected for serum NfL (F7,300 = 10.09), for CSF NfL (F6,222 = 5.95), pNfH (F6,272 = 5.61), tau (F6,268 = 12.56), and ptau (F6,270 = 11.89), as well as Aβ (F6,274 = 13.07; p < .001). For progranulin (serum and CSF) and ubiquitin, no differences were found.
FIGURE 1.
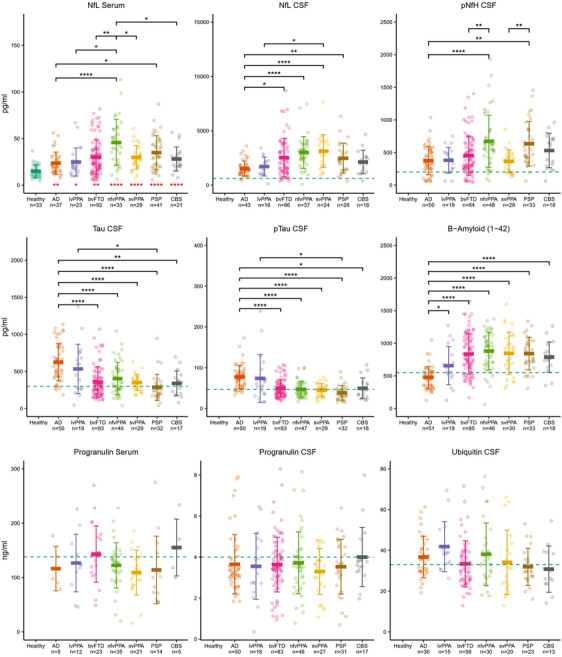
Fluid biomarker concentrations in healthy participants and AD, bvFTD, nfvPPA, svPPA, lvPPA, PSP, and CBS. Red asterisks denote significant differences between serum NfL levels of patients and healthy participants. Black bars and asterisks show significant differences of biomarker levels between patient cohorts. Significances: *p < .05; **p < .01; ***p < .001; ****p < .0001. Means ± standard deviation. Blue dashed lines indicate thresholds for pathological values provided by the central laboratory. AD, Alzheimer's disease; bvFTD, behavioral variant frontotemporal dementia; CBS, corticobasal syndrome; CSF, cerebrospinal fluid; lvPPA, logopenic variant primary progressive aphasia; n, number of available participants for the respective measure; nfvPPA, non‐fluent variant primary progressive aphasia; PSP, progressive supranuclear palsy; svPPA, semantic variant primary progressive aphasia.
As shown in Figure 1, serum NfL was elevated in all disease cohorts compared with healthy participants. Serum NfL was higher in nfvPPA and PSP than in AD, and higher in nfvPPA compared to all other cohorts except PSP. CSF NfL was highest for svPPA and nfvPPA, followed by bvFTD. AD had lower CSF NfL than bvFTD, nfvPPA, svPPA, and PSP, and lvPPA lower than svPPA. CSF pNfH was higher in nfvPPA than AD/bvFTD and higher in PSP than AD and svPPA. CSF tau and ptau were higher in AD than in all other cohorts except lvPPA, and higher in lvPPA than PSP. CSF Aβ was lower in AD compared to all other cohorts. Note that, as expected, tau and ptau were above the reference threshold in AD and lvPPA and for Aβ below this threshold in AD. Complete test statistics can be found in Table S9.
3.4. Brain volume differences in patients versus healthy controls
We compared volumetric brain differences between patients and healthy controls as shown in Figure 2. Table S10 shows mean brain volumes and SDs, and Table S11 through Table S17 contain complete test statistics. The AD cohort showed widespread volume reductions with strongest atrophy in the hippocampus and amygdala, the insula, the middle frontal, and middle and inferior temporal gyrus. In bvFTD, volume was reduced mainly in frontotemporal regions – most pronounced in the insulae – as well as superior, middle, inferior frontal, orbitofrontal gyrus, and superior and middle temporal gyrus and nucleus accumbens.
FIGURE 2.

Brain volume differences between patients and controls. Bonferroni corrected results of permutation ANCOVA with age as covariate, testing for volume differences between each patient cohort, AD, lvPPA, bvFTD, nfvPPA, svPPA, PSP, CBS, and healthy controls, separately for all anatomical structures. Only significantly differing areas indicating atrophy are displayed with color coding illustrating effect strength in terms of Hedge's g. Yellow and white colors represent a strong effect and red a weaker effect. Note that the range of effect strengths varies between cohorts. N denotes the number of participants. Significance: p < .05. Left side is left. AD, Alzheimer's disease; bvFTD, behavioral variant frontotemporal dementia; CBS, corticobasal syndrome; lvPPA, logopenic variant primary progressive aphasia; nfvPPA, non‐fluent variant primary progressive aphasia; PSP, progressive supranuclear palsy; svPPA, semantic variant primary progressive aphasia.
Aphasia syndromes showed mainly left hemispheric alterations, where lvPPA was characterized by volume reductions in left orbitofrontal, supramarginal, angular, superior, middle, and inferior temporal gyrus, as well as both insulae. nfvPPA affected frontal structures, that is, superior, middle, inferior frontal as well as lateral orbitofrontal gyrus, and left middle temporal gyrus. Among all diseases, strongest volume reductions were detected in svPPA, again with a left hemispheric focus. Changes were centered in the insulae, left temporal regions, hippocampus, amygdala, and nucleus accumbens.
In CBS, volumes were reduced in frontoparietotemporal regions and strongest in frontal regions and postcentral (and precentral) gyrus. Furthermore, the right putamen and nucleus accumbens were involved. PSP showed reduced volumes in insulae, superior, middle, inferior, and lateral orbitofrontal structures, precentral, postcentral, and superior parietal and fusiform gyrus, cerebellum, and brainstem. Additionally, subcortical areas were affected, that is, amygdala, caudate nucleus, putamen, nucleus accumbens, pallidum, and thalamus. Only for PSP was a reverse effect detected, that is, reduced WM of left lingual gyrus and right cuneus in healthy subjects compared to PSP.
3.5. Brain volume differences between patient cohorts
Another analysis checked whether total brain volumes and, accordingly, overall atrophy differed systematically between disease cohorts to control for such a potential bias. Total brain volume and total WM and GM volumes between patient cohorts were compared with ANCOVA measures with age correction as described earlier. The analysis, shown in Figure 3, revealed comparable volumes between disease cohorts without significant differences.
FIGURE 3.

Whole brain, as well as total gray and white matter volumes in healthy participants and AD, bvFTD, nfvPPA, svPPA, lvPPA, PSP, and CBS. Means ± standard deviation. Total brain volume refers to gray and white matter volumes without cerebrospinal fluid. AD, Alzheimer's disease; bvFTD, behavioral variant frontotemporal dementia; CBS, corticobasal syndrome; lvPPA, logopenic variant primary progressive aphasia; n, number of available participants for respective measure; nfvPPA, non‐fluent variant primary progressive aphasia; PSP, progressive supranuclear palsy; svPPA, semantic variant primary progressive aphasia.
3.6. Relation of biomarker levels to brain volumes
Figure 4 illustrates the relationship between biomarker levels and brain volumes for the several neurodegenerative diseases (correlation coefficients in green) and the overlap (blue) with disease‐related regional atrophy (Hedge's g effect sizes in red).
FIGURE 4.

Correlations between fluid biomarkers and brain volumetry. Significant results of partial Spearman correlation between biomarkers and brain volumes, separately for each patient cohort (respective left panel). Significant volume differences between patient cohorts and healthy controls indicating atrophy (respective middle panel). Overlap between correlation and atrophy results (respective right panel). Results are Bonferroni corrected and displayed with color coding indicating effect strength in terms of Spearman's ρ in green and Hedge's g in red; overlap is indicated by blue. Bright yellow or white color represents a strong effect, green/red a weaker effect. Note that the range of effect strengths varies between cohorts. Significance level p < .05. Left side is left. AD, Alzheimer's disease; bvFTD, behavioral variant frontotemporal dementia; CSF, cerebrospinal fluid; NfL, neurofilament light chain; pNfH, phosphorylated neurofilament heavy chain; PSP, progressive supranuclear palsy; svPPA, semantic variant primary progressive aphasia.
In AD, CSF NfL was negatively correlated with the left fusiform gyrus’ GM, which was also reduced in volume as compared to controls. Aβ was negatively related to the left gyrus rectus’ WM, which was not atrophic in group comparison.
The strongest effects were detected for bvFTD, here for the correlation between brain volumes and NfL from the CSF and serum and CSF pNfH. CSF NfL was negatively related to the GM of several regions, including the right insula and superior frontal, middle, and lateral orbitofrontal gyrus, and to volumes of both caudate nuclei and right putamen. All these structures had reduced volumes in comparison to controls. Similarly, serum NfL was negatively correlated with right insula and several frontal regions, such as GM of superior, middle, inferior frontal, middle and lateral orbitofrontal gyri, and right gyrus rectus. The same holds true for WM of these areas, except gyrus rectus. Further negative correlations were found for the GM of the right middle temporal gyrus and the WM of the right cingulate gyrus and serum NfL. Additionally, several subcortical volumes were negatively related to serum NfL, that is, caudate nuclei, putamina, and nuclei accumbens. The areas correlating with serum NfL had reduced volumes in comparison to controls, except for the WM of bilateral superior, left middle and bilateral inferior frontal, middle orbitofrontal and left lateral orbitofrontal gyrus, and right cingulate gyrus. In bvFTD, CSF pNfH was negatively related to right pallidum, without regional volume reduction compared to healthy controls.
In svPPA, a positive correlation between CSF progranulin and left putamen was found, overlapping with disease‐related atrophy. In PSP, serum NfL correlated negatively with the WM of the left middle orbitofrontal gyrus without overlap with atrophy.
All other correlations were not significant. For nfvPPA, lvPPA, and CBS, no significant correlations between any biomarker and brain volumes were found.
We conducted additional analyses to examine whether any of the biomarkers correlated with total brain, total WM, or GM volume across all disease cohorts. Figure 5 depicts the detected significant relationships for serum NfL and total brain and WM volume, as well as for CSF NfL and total brain volume across the whole cohort.
FIGURE 5.

Partial Spearman correlations between whole brain and white matter volumes and NfL (serum and cerebrospinal fluid) concentrations across all disease groups. Total brain volume refers to gray and white matter volumes without cerebrospinal fluid. Rho is the age‐corrected correlation coefficient Spearman's ρ, Significance level p < .05. For disease‐specific results in bvFTD and AD, see Table S18. AD, Alzheimer's disease; bvFTD, behavioral variant frontotemporal dementia; CBS, corticobasal syndrome; CSF, cerebrospinal fluid; lvPPA, logopenic variant primary progressive aphasia; N, number of available participants for the respective measure; NfL, neurofilament light chain; nfvPPA, non‐fluent variant primary progressive aphasia; PSP, progressive supranuclear palsy; svPPA, semantic variant primary progressive aphasia.
Investigating this relationship in single‐disease groups replicated a strong correlation between CSF/serum NfL and the aforementioned brain volumes in bvFTD and a weaker one in AD. Of note, all other biomarkers, except total brain/WM volume and pNfH in bvFTD, did not show such an association (Table S18).
4. DISCUSSION
In this combined biomarker study, we characterized the disease specificity of biomarker levels from CSF and blood serum and identified disease‐related brain atrophy. To explore multimodal patterns of biomarkers and atrophy across the dementia spectrum, we included seven diseases, that is, AD, its variant lvPPA, and FTLD subtypes bvFTD, nfvPPA, svPPA, PSP, CBS, and seven different fluid biomarkers. Finally, we identified disease‐specific correlations between fluid biomarkers and brain volumes in AD and FTLD subtypes. In what follows, we will discuss results in detail. We start with the last issue, which is of utmost interest.
4.1. Fluid biomarkers, that is, neurofilaments in bvFTD and progranulin in svPPA, show disease‐specific correlation with imaging patterns
Biomarker levels correlated with atrophy in AD, bvFTD, svPPA, and PSP. The most notable results were obtained for NfL and disease‐related atrophy in bvFTD. Frontotemporal regions, caudate nuclei, and right putamen correlated with CSF NfL, consistent with regional atrophy in bvFTD compared to controls (for GM and WM). This relationship was supported by results for serum. Serum NfL correlated with frontal and subcortical areas affected also by disease‐related atrophy, again for GM and WM. In contrast, results for CSF pNfH seemed to be unspecific. This biomarker was related to the right pallidum only, which was not atrophic in bvFTD. Our findings suggest that the correlation between NfL from CSF and serum with disease‐related regional atrophy is specific for bvFTD.
Correlations between NfL and brain volume could only be detected inconsistently in two other diseases. In AD, CSF NfL correlated with volume of the left fusiform gyrus (GM), overlapping with atrophy. Serum NfL was associated with WM volume of left middle orbitofrontal gyrus in PSP, not coinciding with disease‐related atrophy. These additional findings for AD and PSP could point to NfL rather being a measure of general atrophy than independently serving as a disease‐specific histopathological surrogate marker for bvFTD. To check these assumptions, we compared volumes of the whole brain, WM, and GM between the several disease groups in our cohort. Comparable volumes between patient cohorts indicate comparable overall atrophy. Further correlation analyses in a pooled patient cohort showed significant relations between serum NfL and total brain and WM volumes as well as between CSF NfL and total brain volume. Subsequent analogous analyses on the group level showed strong correlations in bvFTD but weaker in AD. Of note, variances of GM volume were not different across groups. bvFTD also did not show the highest levels in serum or CSF NfL compared with other diseases, excluding a statistical power bias.
Summarizing our findings for NfL, bvFTD is characterized by a specific association between this fluid biomarker and regional atrophy. In accordance with our findings, NfL has been previously associated with WM abnormalities. 56 , 57 In our study, the largest correlations were present between serum NfL levels and WM volumes in frontal and subcortical regions, which highlights the potential of CSF and serum NfL as clinically valuable biomarkers for FTLD and especially for bvFTD. Remarkably, other studies identified NfL from serum 14 , 16 or CSF 11 as potential markers of disease severity and progression in FTLD. 12 , 13
Apart from the volumetric correlations found with neurofilaments, Aβ correlated with left gyrus rectus (WM) in AD, but not reflecting atrophy. CSF progranulin levels were positively related to left putamen in svPPA, overlapping with atrophy. As subjects with progranulin (GRN) mutations develop a TAR DNA‐binding protein 43 (TDP‐43) pathology, 58 one might assume, conversely, that patients with sporadic FTLD and TDP‐43 pathology might have reduced progranulin levels. As patients with svPPA do mainly have TDP‐43 aggregates, this finding might support our assumption. The correlation between progranulin levels and brain volume was only detected for CSF, most likely related to the fact that the intrathecal fraction of progranulin in CSF is between 80 and 90%. Although blood levels of progranulin are generally higher, values are confounded by progranulin expression in other organs apart from the brain. 38 On a more basic view, we expected this correlation between atrophy and regional brain volume because progranulin levels were reduced in neurodegeneration due to reduced neuronal survival. 30 Hence, atrophy is related to lower progranulin levels. Progranulin is a potential target for therapeutic approaches because of its underlying genetic loss‐of‐function mutation. 29 Our finding might support progranulin as a therapeutic marker in svPPA with genetic etiology, where enhancing progranulin's function is a strategy. For nfvPPA, lvPPA, and CBS, none of the biomarkers correlated significantly with regional brain volumes.
In summary, our results suggest that neurofilaments, in particular NfL in serum and CSF, and progranulin might serve as biomarkers for atrophy in bvFTD or svPPA, respectively, which could aid monitoring disease progression and therapy efficacy in upcoming clinical trials. Notably, with serum NfL lumbar puncture is avoided. Future studies should investigate disease progress and predictive power by monitoring biomarker and brain volume in a longitudinal design.
4.2. Fluid biomarker patterns discriminate FTLD subtypes and AD variants
So far, no specific neurochemical fluid biomarkers for FTLD and its subtypes have been found to exist. In this work, we assessed differences in seven biomarkers between FTLD subgroups, AD, and controls. Overall, we detected significant differences between diagnostic groups for serum and CSF NfL and pNfH, as well as for tau, ptau, and Aβ.
Serum NfL was generally elevated compared to controls. NfL, in serum and CSF, was highest for nfvPPA, followed by svPPA, PSP, and bvFTD and, in comparison, lower in AD and lvPPA in agreement with previous studies reporting increased serum NfL in PPA compared to controls and higher levels in nfvPPA and svPPA than in lvPPA. 14 , 17 Steinacker et al. 16 also reported that NfL could discriminate between bvFTD and controls or AD. Other research results indicate higher pNfH levels in nfvPPA compared to svPPA and lvPPA. 14 This trend is also found in the present study, although pNfH was significantly higher in nfvPPA than in bvFTD and, similarly, in PSP compared to svPPA. As higher levels of neurofilaments are known to reflect increased neuronal death, 8 , 9 it can be assumed that nfvPPA, svPPA, PSP, and bvFTD, in contrast to AD or lvPPA, show different neurodegenerative processes.
As found in previous studies, 19 , 20 , 21 the core markers of AD, namely, tau, ptau, and Aβ, discriminate AD and histopathologically linked lvPPA from FTLD subtypes. This was observed in the present data as well, since AD and lvPPA showed similar tau, ptau, and Aβ CSF profiles, which in turn differed from the profiles of FTLD cohorts.
Progranulin and ubiquitin levels did not differ between patient cohorts, implying limited application in distinguishing FTLD subtypes at least for cross‐sectional studies without follow‐up measurements. In two other studies, ubiquitin levels were higher in AD compared to FTLD spectrum, but this could not be replicated for the single FTLD subtypes. 39 , 59 In our study, ubiquitin was highest in lvPPA, followed by AD and nfvPPA, as illustrated in Figure 1 on a non‐significant level.
In sum, NfL from serum or CSF, and pNfH, tau, ptau, and Aβ from CSF discriminate between FTLD subtypes, AD, and healthy subjects. However, fluid biomarker levels show great variation across cohorts, which might hamper their diagnostic and discriminative value.
4.3. Atrophy patterns are specific in FTLD subtypes and AD variants
We found specific brain atrophy in all diseases compared to healthy controls, consistent with hypotheses and the literature. In AD, atrophy was pronounced bilaterally in the insulae, GM of middle frontal, middle temporal, and inferior temporal lobe, hippocampus, and amygdala. 60 , 61 , 62 LvPPA showed predominantly left hemispheric atrophy, especially in frontal, parietal, and temporal regions. 63 , 64 , 65
As hypothesized, 66 , 67 bvFTD showed symmetric atrophy in insulae, frontal regions, and subcortical structures, such as caudate nuclei and putamen. In line with Whitwell et al., 68 temporal regions were atrophic. In nfvPPA, atrophy was found in frontal (and temporal) structures, with left hemispheric dominance 63 , 66 and reflecting speech‐related areas. The strongest overall atrophy was found in svPPA, with an emphasis on the temporal lobe and the left side. 63 , 69 , 70 , 71 , 72
Concerning the atypical parkinsonian disorder PSP, it was expected that atrophy would be found in the brainstem and cerebellum as well as in frontal and subcortical areas, 73 , 74 , 75 which was confirmed in the present cohort. In CBS, more pronounced atrophy was found in the left hemisphere, affecting frontoparietotemporal regions, putamen, and nucleus accumbens. 76 , 77 , 78 Taken together, FTLD subtypes and AD variants affected specific brain regions, confirming the diagnosis in our patient cohorts.
4.4. Limitations of the study
Differential diagnosis was confirmed by several biomarkers with disease‐typical patterns in atrophy (MRI) and by surrogate biomarkers for histopathology from CSF. However, post mortem neuropathological characterization was available only for individual patients. Future studies will have to incorporate post mortem pathologically confirmed disease. Second, numbers of involved subjects differed between the several cohorts. We included all available datasets to guarantee high statistical power. One might argue that the strongest effects in bvFTD for correlation between imaging and fluid biomarkers were simply achieved due to the fact that they comprised the highest patient numbers. One might object that such significant findings were also detected in much smaller cohorts, that is, svPPA and PSP, which still contained remarkable numbers of subjects. Moreover, we designed our statistical approaches to be rather robust against differences in subject numbers by applying non‐parametric approaches and Hedge's g as an effect size measure controlling for differences in cohort sizes.
Although we already related atrophy patterns to nine different parameters, that is, seven biomarkers from CSF and two from serum, larger panels containing more proteins or even proteomic approaches are a desideratum for the future studies. Such panels will contain more potentially relevant proteins for dementia prediction even a decade before onset, such as glial fibrillary acidic protein (GFAP) or growth differentiation factor 15 (GDF15), besides NfL, or they might even enable data‐driven proteomic approaches. 79 , 80
4.5. Conclusion
This project analyzed patterns of fluid biomarkers and brain atrophy in a large cohort that included FTLD syndromes, AD, and healthy controls. The study revealed disease‐specific biomarker profiles for neurofilaments, AD‐specific fluid biomarkers, and brain atrophy. Neurofilaments were related to regional brain atrophy in bvFTD, and – to a much lesser degree – in AD. Progranulin was associated with brain volumes in svPPA. Our results provide insights into biomarker and atrophy patterns in FTLD and AD, supporting differential diagnosis. They identify neurofilaments and progranulin in interaction with structural imaging as promising candidates to monitor disease progression and therapy.
CONFLICT OF INTEREST STATEMENT
The authors declare no potential competing interests. Author disclosures are available in the supporting information.
CONSENT STATEMENT
All subjects provided informed consent.
Supporting information
Supporting Information
Supporting Information
ACKNOWLEDGMENTS
The authors thank all participants and the team of the FTLD Consortium, who made this study possible. This study was supported by grants from the German Research Foundation (SCHR 774/5‐1 to MLS), the German Federal Ministry of Education and Research (Project FTLDc 01GI1007A), the EU Joint Program‐Neurodegenerative Disease Research (JPND) network: Genfi‐Prox and Moodmarker, and the eHealthSax Initiative of the Sächsische Aufbaubank (Project TelDem). Accordingly, this study was co‐financed with tax revenue based on the budget approved by the Saxon state parliament. M.P. was supported by the International Max Planck Research School on Neuroscience of Communication: Function, Structure, and Plasticity (IMPRS NeuroCom) by the Max Planck Society and, along with L.H., by the Predoc Award Program of the University of Leipzig.
Open access funding enabled and organized by Projekt DEAL.
Hüper L, Steinacker P, Polyakova M, et al. Neurofilaments and progranulin are related to atrophy in frontotemporal lobar degeneration – A transdiagnostic study cross‐validating atrophy and fluid biomarkers. Alzheimer's Dement. 2024;20:4461–4475. 10.1002/alz.13863
Lea Hüper and Petra Steinacker, shared first authorship / Markus Otto and Matthias L. Schroeter, shared senior authorship.
REFERENCES
- 1. Ratnavalli E, Brayne C, Dawson K, Hodges JR. The prevalence of frontotemporal dementia. Neurology. 2002;58(11):1615‐1621. doi: 10.1212/wnl.58.11.1615 [DOI] [PubMed] [Google Scholar]
- 2. Blennow K, de Leon MJ, Zetterberg H. Alzheimer's disease. Lancet (London, England). 2006;368(9533):387‐403. [DOI] [PubMed] [Google Scholar]
- 3. Rascovsky K, Hodges JR, Knopman D, et al. Sensitivity of revised diagnostic criteria for the behavioural variant of frontotemporal dementia. Brain. 2011;134(9):2456‐2477. [DOI] [PMC free article] [PubMed] [Google Scholar]
- 4. Gorno‐Tempini ML, Hillis AE, Weintraub S, et al. Classification of primary progressive aphasia and its variants. Neurology. 2011;76(11):1006‐1014. [DOI] [PMC free article] [PubMed] [Google Scholar]
- 5. Association AP. Diagnostic and statistical manual of mental disorders (DSM‐5®). 5 ed. American Psychiatric Publishing; 2013. [Google Scholar]
- 6. Grossman M. Biomarkers in the primary progressive aphasias. Aphasiology. 2014;28(8‐9):922‐940. [DOI] [PMC free article] [PubMed] [Google Scholar]
- 7. Meeter LH, Kaat LD, Rohrer JD, Van Swieten JC. Imaging and fluid biomarkers in frontotemporal dementia. Nat Rev Neurol. 2017;13(7):406. [DOI] [PubMed] [Google Scholar]
- 8. Skillbäck T, Farahmand B, Bartlett JW, et al. CSF neurofilament light differs in neurodegenerative diseases and predicts severity and survival. Neurology. 2014;83(21):1945‐1953. [DOI] [PubMed] [Google Scholar]
- 9. Zetterberg H, Skillbäck T, Mattsson N, et al. Association of cerebrospinal fluid neurofilament light concentration with Alzheimer disease progression. JAMA Neurol. 2016;73(1):60‐67. [DOI] [PMC free article] [PubMed] [Google Scholar]
- 10. Alcolea D, Vilaplana E, Suárez‐Calvet M, et al. CSF sAPPß, YKL‐40, and neurofilament light in frontotemporal lobar degeneration. Neurology. 2017;89(2):178‐188. [DOI] [PubMed] [Google Scholar]
- 11. Zerr I, Schmitz M, Karch A, et al. Cerebrospinal fluid neurofilament light levels in neurodegenerative dementia: evaluation of diagnostic accuracy in the differential diagnosis of prion diseases. Alzheimer Dement. 2018;14(6):751‐763. [DOI] [PubMed] [Google Scholar]
- 12. Verde F, Otto M, Silani V. Neurofilament light chain as biomarker for amyotrophic lateral sclerosis and frontotemporal dementia. Front Neurosci. 2021;15:679199. doi: 10.3389/fnins.2021.679199 [DOI] [PMC free article] [PubMed] [Google Scholar]
- 13. Wang SY, Chen W, Xu W, et al. Neurofilament light chain in cerebrospinal fluid and blood as a biomarker for neurodegenerative diseases: a systematic review and meta‐analysis. J Alzheimer's Dis. 2019;72(4):1353‐1361. doi: 10.3233/JAD-190615 [DOI] [PubMed] [Google Scholar]
- 14. Steinacker P, Semler E, Anderl‐Straub S, et al. Neurofilament as a blood marker for diagnosis and monitoring of primary progressive aphasias. Neurology. 2017;88(10):961‐969. [DOI] [PubMed] [Google Scholar]
- 15. Scherling CS, Hall T, Berisha F, et al. Cerebrospinal fluid neurofilament concentration reflects disease severity in frontotemporal degeneration. Ann Neurol. 2014;75(1):116‐126. [DOI] [PMC free article] [PubMed] [Google Scholar]
- 16. Steinacker P, Anderl‐Straub S, Diehl‐Schmid J, et al. Serum neurofilament light chain in behavioral variant frontotemporal dementia. Neurology. 2018;91(15):e1390‐e1401. [DOI] [PubMed] [Google Scholar]
- 17. Rohrer JD, Woollacott IOC, Dick KM, et al. Serum neurofilament light chain protein is a measure of disease intensity in frontotemporal dementia. Neurology. 2016;87(13):1329‐1336. [DOI] [PMC free article] [PubMed] [Google Scholar]
- 18. Buée L, Bussière T, Buée‐Scherrer V, Delacourte A, Hof PR. Tau protein isoforms, phosphorylation and role in neurodegenerative disorders. Brain Res Rev. 2000;33(1):95‐130. [DOI] [PubMed] [Google Scholar]
- 19. Rivero‐Santana A, Ferreira D, Perestelo‐Perez L, et al. Cerebrospinal fluid biomarkers for the differential diagnosis between Alzheimer's disease and frontotemporal lobar degeneration: systematic review, HSROC analysis, and confounding factors. J Alzheimer's Dis. 2017;55(2):625‐644. [DOI] [PubMed] [Google Scholar]
- 20. Santangelo R, Coppi E, Ferrari L, et al. Cerebrospinal fluid biomarkers can play a pivotal role in the diagnostic work up of primary progressive aphasia. J Alzheimer's Dis. 2015;43(4):1429‐1440. [DOI] [PubMed] [Google Scholar]
- 21. Paraskevas GP, Kasselimis D, Kourtidou E, et al. Cerebrospinal fluid biomarkers as a diagnostic tool of the underlying pathology of primary progressive aphasia. J Alzheimer's Dis. 2017;55(4):1453‐1461. [DOI] [PubMed] [Google Scholar]
- 22. Spillantini MG, Goedert M. Tau pathology and neurodegeneration. Lancet Neurol. 2013;12(6):609‐622. [DOI] [PubMed] [Google Scholar]
- 23. Aerts MB, Esselink RAJ, Bloem BR, Verbeek MM. Cerebrospinal fluid tau and phosphorylated tau protein are elevated in corticobasal syndrome. Mov Disord. 2011;26(1):169‐173. [DOI] [PubMed] [Google Scholar]
- 24. Itoh N, Arai H, Urakami K, et al. Large‐scale, multicenter study of cerebrospinal fluid tau protein phosphorylated at serine 199 for the antemortem diagnosis of Alzheimer's disease. Ann Neurol. 2001;50(2):150‐156. [DOI] [PubMed] [Google Scholar]
- 25. Dobson CM. Protein folding and misfolding. Nature. 2003;426(6968):884‐890. [DOI] [PubMed] [Google Scholar]
- 26. Motter R, Vigo‐Pelfrey C, Kholodenko D, et al. Reduction of ß‐amyloid peptide42 in the cerebrospinal fluid of patients with Alzheimer's disease. Ann Neurol. 1995;38(4):643‐648. [DOI] [PubMed] [Google Scholar]
- 27. Selkoe DJ. Cell biology of protein misfolding: the examples of Alzheimer's and Parkinson's diseases. Nat Cell Biol. 2004;6(11):1054‐1061. [DOI] [PubMed] [Google Scholar]
- 28. Bibl M, Mollenhauer B, Lewczuk P, et al. Cerebrospinal fluid tau, p‐tau 181 and amyloid‐ß38/40/42 in frontotemporal dementias and primary progressive aphasias. Dement Geriatr Cogn Disord. 2011;31(1):37‐44. [DOI] [PubMed] [Google Scholar]
- 29. Baker M, Mackenzie IR, Pickering‐Brown SM, et al. Mutations in progranulin cause tau‐negative frontotemporal dementia linked to chromosome 17. Nature. 2006;442(7105):916‐919. [DOI] [PubMed] [Google Scholar]
- 30. Van Damme P, Van Hoecke A, Lambrechts D, et al. Progranulin functions as a neurotrophic factor to regulate neurite outgrowth and enhance neuronal survival. J Cell Biol. 2008;181(1):37‐41. [DOI] [PMC free article] [PubMed] [Google Scholar]
- 31. Otto M, Ludolph AC, Landwehrmeyer B, et al. Konsortium zur Erforschung der frontotemporalen Lobärdegeneration. Nervenarzt. 2011;82(8):1002. [DOI] [PubMed] [Google Scholar]
- 32. Wagner M, Lorenz G, Volk AE, et al. Clinico‐genetic findings in 509 frontotemporal dementia patients. Mol Psychiatry. 2021;26(10):5824‐5832. [DOI] [PMC free article] [PubMed] [Google Scholar]
- 33. Association WM. Declaration of Helsinki: ethical principles for medical research involving human subjects. JAMA. 2013;310(20):2191‐2194. [DOI] [PubMed] [Google Scholar]
- 34. Folstein MF, Folstein SE, McHugh PR. “Mini‐mental state”: a practical method for grading the cognitive state of patients for the clinician. J Psychiatr Res. 1975;12(3):189‐198. [DOI] [PubMed] [Google Scholar]
- 35. Morris JC. The Clinical Dementia Rating (CDR): current version and scoring rules. Neurology. 1993;43:2412‐2414. [DOI] [PubMed] [Google Scholar]
- 36. Knopman DS, Kramer JH, Boeve BF, et al. Development of methodology for conducting clinical trials in frontotemporal lobar degeneration. Brain. 2008;131(11):2957‐2968. [DOI] [PMC free article] [PubMed] [Google Scholar]
- 37. Knopman DS, Weintraub S, Pankratz VS. Language and behavior domains enhance the value of the clinical dementia rating scale. Alzheimer Dement. 2011;7(3):293‐299. [DOI] [PMC free article] [PubMed] [Google Scholar]
- 38. Feneberg E, Steinacker P, Volk AE, et al. Progranulin as a candidate biomarker for therapeutic trial in patients with ALS and FTLD. J Neural Transm. 2016;123(3):289‐296. [DOI] [PubMed] [Google Scholar]
- 39. Oeckl P, Steinacker P, von Arnim CAF, et al. Intact protein analysis of ubiquitin in cerebrospinal fluid by multiple reaction monitoring reveals differences in Alzheimer's disease and frontotemporal lobar degeneration. J Proteome Res. 2014;13(11):4518‐4525. [DOI] [PubMed] [Google Scholar]
- 40. Huppertz H‐J, Kröll‐Seger J, Klöppel S, Ganz RE, Kassubek J. Intra‐and interscanner variability of automated voxel‐based volumetry based on a 3D probabilistic atlas of human cerebral structures. Neuroimage. 2010;49(3):2216‐2224. [DOI] [PubMed] [Google Scholar]
- 41. Huppertz H‐J, Möller L, Südmeyer M, et al. Differentiation of neurodegenerative parkinsonian syndromes by volumetric magnetic resonance imaging analysis and support vector machine classification. Mov Disord. 2016;31(10):1506‐1517. [DOI] [PubMed] [Google Scholar]
- 42. Ashburner J, Friston KJ. Unified segmentation. Neuroimage. 2005;26(3):839‐851. [DOI] [PubMed] [Google Scholar]
- 43. Mazziotta JC, Toga AW, Evans A, Fox P, Lancaster J. A probabilistic atlas of the human brain: theory and rationale for its development. Neuroimage. 1995;2(2):89‐101. [DOI] [PubMed] [Google Scholar]
- 44. Mazziotta J, Toga A, Evans A, et al. A probabilistic atlas and reference system for the human brain: international Consortium for Brain Mapping (ICBM). Philos Trans R Soc Lond B Biol Sci. 2001;356(1412):1293‐1322. [DOI] [PMC free article] [PubMed] [Google Scholar]
- 45. Ashburner J. A fast diffeomorphic image registration algorithm. Neuroimage. 2007;38(1):95‐113. [DOI] [PubMed] [Google Scholar]
- 46. Ashburner J, Barnes G, Chen C, et al. SPM12 manual. Wellcome Trust Centre for Neuroimaging. 2014. [Google Scholar]
- 47. Shattuck DW, Mirza M, Adisetiyo V, et al. Construction of a 3D probabilistic atlas of human cortical structures. Neuroimage. 2008;39(3):1064‐1080. [DOI] [PMC free article] [PubMed] [Google Scholar]
- 48. Makris N, Goldstein JM, Kennedy D, et al. Decreased volume of left and total anterior insular lobule in schizophrenia. Schizophr Res. 2006;83(2‐3):155‐171. [DOI] [PubMed] [Google Scholar]
- 49. Frazier JA, Chiu S, Breeze JL, et al. Structural brain magnetic resonance imaging of limbic and thalamic volumes in pediatric bipolar disorder. Am J Psychiatry. 2005;162(7):1256‐1265. [DOI] [PubMed] [Google Scholar]
- 50. Desikan RS, Ségonne F, Fischl B, et al. An automated labeling system for subdividing the human cerebral cortex on MRI scans into gyral based regions of interest. Neuroimage. 2006;31(3):968‐980. [DOI] [PubMed] [Google Scholar]
- 51. Goldstein JM, Seidman LJ, Makris N, et al. Hypothalamic abnormalities in schizophrenia: sex effects and genetic vulnerability. Biol Psychiatry. 2007;61(8):935‐945. [DOI] [PubMed] [Google Scholar]
- 52. Meeter LH, Dopper EG, Jiskoot LC, et al. Neurofilament light chain: a biomarker for genetic frontotemporal dementia. Ann Clin Transl Neurol. 2016;3(8):623‐636. [DOI] [PMC free article] [PubMed] [Google Scholar]
- 53. Permutation Tests for Regression . ANOVA and Comparison of Signals: The permuco Package. 2018. https://CRAN.R‐project.org/package=permuco
- 54. Smith SM, Jenkinson M, Woolrich MW, et al. Advances in functional and structural MR image analysis and implementation as FSL. Neuroimage. 2004;23:S208‐S219. [DOI] [PubMed] [Google Scholar]
- 55. Diedrichsen J, Balsters JH, Flavell J, Cussans E, Ramnani N. A probabilistic MR atlas of the human cerebellum. Neuroimage. 2009;46(1):39‐46. [DOI] [PubMed] [Google Scholar]
- 56. Sjögren M, Blomberg M, Jonsson M, et al. Neurofilament protein in cerebrospinal fluid: a marker of white matter changes. J Neurosci Res. 2001;66(3):510‐516. [DOI] [PubMed] [Google Scholar]
- 57. Jonsson M, Zetterberg H, Van Straaten E, et al. Cerebrospinal fluid biomarkers of white matter lesions—cross‐sectional results from the LADIS study. Eur J Neurol. 2010;17(3):377‐382. [DOI] [PubMed] [Google Scholar]
- 58. Cairns NJ, Neumann M, Bigio EH, et al. TDP‐43 in familial and sporadic frontotemporal lobar degeneration with ubiquitin inclusions. Am J Pathol. 2007;171(1):227‐240. [DOI] [PMC free article] [PubMed] [Google Scholar]
- 59. Abu‐Rumeileh S, Oeckl P, Baiardi S, et al. CSF ubiquitin levels are higher in Alzheimer's disease than in frontotemporal dementia and reflect the molecular subtype in prion disease. Biomolecules. 2020;10(4):497. doi: 10.3390/biom10040497 [DOI] [PMC free article] [PubMed] [Google Scholar]
- 60. Callen DJA, Black SE, Gao F, Caldwell CB, Szalai JP. Beyond the hippocampus: mRI volumetry confirms widespread limbic atrophy in AD. Neurology. 2001;57(9):1669‐1674. [DOI] [PubMed] [Google Scholar]
- 61. Chan D, Fox NC, Jenkins R, Scahill RI, Crum WR, Rossor MN. Rates of global and regional cerebral atrophy in AD and frontotemporal dementia. Neurology. 2001;57(10):1756‐1763. [DOI] [PubMed] [Google Scholar]
- 62. Schroeter ML, Stein T, Maslowski N, Neumann J. Neural correlates of Alzheimer's disease and mild cognitive impairment: a systematic and quantitative meta‐analysis involving 1351 patients. Neuroimage. 2009;47(4):1196‐1206. [DOI] [PMC free article] [PubMed] [Google Scholar]
- 63. Bisenius S, Neumann J, Schroeter ML. Validating new diagnostic imaging criteria for primary progressive aphasia via anatomical likelihood estimation meta‐analyses. Eur J Neurol. 2016;23(4):704‐712. [DOI] [PubMed] [Google Scholar]
- 64. Gorno‐Tempini ML, Brambati SM, Ginex V, et al. The logopenic/phonological variant of primary progressive aphasia. Neurology. 2008;71(16):1227‐1234. [DOI] [PMC free article] [PubMed] [Google Scholar]
- 65. Rohrer JD, Ridgway GR, Crutch SJ, et al. Progressive logopenic/phonological aphasia: erosion of the language network. Neuroimage. 2010;49(1):984‐993. [DOI] [PMC free article] [PubMed] [Google Scholar]
- 66. Schroeter ML, Raczka K, Neumann J, Von Cramon DY. Towards a nosology for frontotemporal lobar degenerations—a meta‐analysis involving 267 subjects. Neuroimage. 2007;36(3):497‐510. [DOI] [PubMed] [Google Scholar]
- 67. Schroeter ML, Laird AR, Chwiesko C, et al. Conceptualizing neuropsychiatric diseases with multimodal data‐driven meta‐analyses — The case of behavioral variant frontotemporal dementia. Cortex. 2014;57:22‐37. [DOI] [PMC free article] [PubMed] [Google Scholar]
- 68. Whitwell JL, Przybelski SA, Weigand SD, et al. Distinct anatomical subtypes of the behavioural variant of frontotemporal dementia: a cluster analysis study. Brain. 2009;132(11):2932‐2946. [DOI] [PMC free article] [PubMed] [Google Scholar]
- 69. Hodges JR, Patterson K. Semantic dementia: a unique clinicopathological syndrome. Lancet Neurol. 2007;6(11):1004‐1014. [DOI] [PubMed] [Google Scholar]
- 70. Davies RR, Graham KS, Xuereb JH, Williams GB, Hodges JR. The human perirhinal cortex and semantic memory. Eur J Neurosci. 2004;20(9):2441‐2446. [DOI] [PubMed] [Google Scholar]
- 71. Davies RR, Scahill VL, Graham A, Williams GB, Graham KS, Hodges JR. Development of an MRI rating scale for multiple brain regions: comparison with volumetrics and with voxel‐based morphometry. Neuroradiology. 2009;51(8):491‐503. [DOI] [PubMed] [Google Scholar]
- 72. Lombardi J, Mayer B, Semler E, et al. Quantifying progression in primary progressive aphasia with structural neuroimaging. Alzheimers Dement. 2021;17(10):1595‐1609. doi: 10.1002/alz.12323 [DOI] [PubMed] [Google Scholar]
- 73. Albrecht F, Bisenius S, Neumann J, Whitwell J, Schroeter ML. Atrophy in midbrain & cerebral/cerebellar pedunculi is characteristic for progressive supranuclear palsy — A double‐validation whole‐brain meta‐analysis. Neuroimage Clin. 2019;22:101722. doi: 10.1016/j.nicl.2019.101722 [DOI] [PMC free article] [PubMed] [Google Scholar]
- 74. Stezin A, Lenka A, Jhunjhunwala K, Saini J, Pal PK. Advanced structural neuroimaging in progressive supranuclear palsy: where do we stand? Parkinsonism Relat Disord. 2017;36:19‐32. [DOI] [PubMed] [Google Scholar]
- 75. Whitwell JL, Höglinger GU, Antonini A, et al. Radiological biomarkers for diagnosis in PSP: where are we and where do we need to be? Mov Disord. 2017;32(7):955‐971. [DOI] [PMC free article] [PubMed] [Google Scholar]
- 76. Albrecht F, Bisenius S, Morales Schaack R, Neumann J, Schroeter ML. Disentangling the neural correlates of corticobasal syndrome and corticobasal degeneration with systematic and quantitative ALE meta‐analyses. NPJ Parkinsons Dis. 2017;3:12. doi: 10.1038/s41531-017-0012-6 [DOI] [PMC free article] [PubMed] [Google Scholar]
- 77. Gibb WRG, Luthert PJ, Marsden CD. Corticobasal Degeneration. Brain. 1989;112(5):1171‐1192. [DOI] [PubMed] [Google Scholar]
- 78. Seeley WW, Crawford RK, Zhou J, Miller BL, Greicius MD. Neurodegenerative diseases target large‐scale human brain networks. Neuron. 2009;62(1):42‐52. [DOI] [PMC free article] [PubMed] [Google Scholar]
- 79. Guo Y, You J, Zhang Y, et al. Plasma proteomic profiles predict future dementia in healthy adults. Nat Aging. 2024:1‐14. [DOI] [PubMed] [Google Scholar]
- 80. Tijms BM, Vromen EM, Mjaavatten O, et al. Cerebrospinal fluid proteomics in patients with Alzheimer's disease reveals five molecular subtypes with distinct genetic risk profiles. Nat Aging. 2024:1‐15. [DOI] [PMC free article] [PubMed] [Google Scholar]
Associated Data
This section collects any data citations, data availability statements, or supplementary materials included in this article.
Supplementary Materials
Supporting Information
Supporting Information