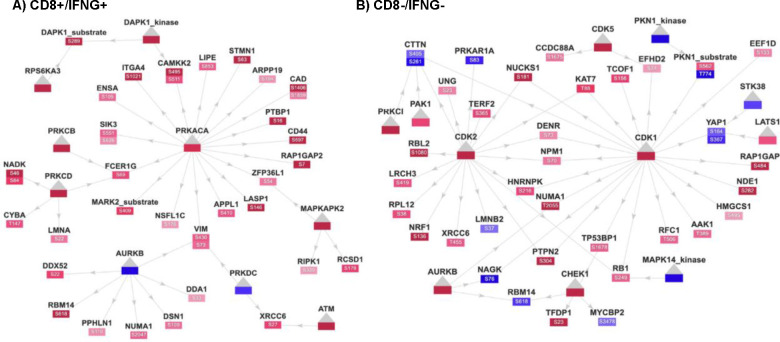
Figure 5. Snapshots of interactive 2D network visualizations for CPTAC pan-cancer immune subtypes.
Kinases, and their specific altered phosphosites, their phosphorylation levels and positions in each altered substrate are clearly shown A) CD8+/IFNG+ network. Visualization clearly depicts upregulation in the global abundance of the kinase PRKACA (center) and the phospho-abundance of its substrates in red; B) CD8−/IFNG− subnetwork. The global proteomic expression of cell-cycle kinases such as CDK1 and the phospho-abundance of its substrates are upregulated in red.

