

Abstract
In Alzheimer’s disease, soluble Aβ oligomers are believed to play important roles in the disease pathogenesis, and their levels correlate with cognitive impairment. We have previously shown that Aβ oligomers can be categorized into multiple structural classes based on their reactivity with conformation-dependent antibodies. In this study, we analyzed the structures of Aβ40 oligomers belonging to two of these classes: fibrillar and prefibrillar oligomers. We found that fibrillar oligomers were similar in structure to fibrils but were less stable towards denaturation while prefibrillar oligomers were found to be partially disordered. These results are consistent with previously proposed structures for both oligomer classes while providing additional structural information.
Keywords: Amyloid beta, Protein aggregation, Oligomers, Alzheimer’s disease
Graphical Abstract
1. Introduction
Misfolding and aggregation of polypeptides and proteins is a central pathological and biochemical event shared by many neurodegenerative maladies such as Alzheimer’s, Parkinson’s and other diseases [1,2]. Oligomeric forms of Aβ peptides are highly neurotoxic, are believed to play an important causal role in the AD pathogenesis and their levels correlate strongly with AD progression [3,4]. Amyloid oligomers have also been shown to play an important role in the cell to cell transmission of AD pathology due to their ability to penetrate cellular membranes [5–7]. Structural information about amyloid oligomers is important for better understanding of their pathological roles in the disease and for development of therapeutic agents that block oligomers from propagating from cell to cell by preventing their entry into cells, dissociate their toxic secondary structures, or by inhibiting further polymerization with endogenous soluble Aβ [8,9]. Such experimental studies have been difficult due to structural instability of oligomers. We have previously shown that reactivity with conformation-dependent antibodies can separate of Aβ into structural classes [10–12] that may play different pathological roles in AD.
Here we examined two of these classes: fibrillar oligomers (FOs) and prefibrillar oligomers (PFOs). Aβ40 FOs are small aggregates that have a high β-sheet content and are structurally similar to fibrils with some disruptions in the β-sheet stacking [13,14]. In a proposed structure of PFOs residues 1–25 were disordered while residues 26–40 formed an antiparallel β-barrel [15]. The tendency of the C-terminal half of Aβ to form β-barrels was confirmed recently [16] using a combination of ion mobility mass spectrometry and molecular modeling. To gain further insight into the structural differences between PFOs, FOs and fibrils, we examined their secondary structures using Raman, FTIR and CD spectroscopy and monitored both their site-specific and global stability towards denaturation. We found that FOs are structurally similar to fibrils although less stable while PFOs are much less ordered. These results provide experimental data to support previously proposed structural models for FOs [14] and PFOs [15,16].
2. Experimental procedures
Peptide synthesis-
Side chain protected Fmoc amino acids, Fmoc-PAL-PEG-polystyrene support and TBTU were obtained from Applied Biosystems. DIEA, DTT, thioanisole, ethanedithiol and anisole were obtained from Sigma and TFA from Advanced Chem Tech. Automatic synthesis was performed by the batch-wise method on a CS336X (CS Bio), employing Fmoc/t-Butyl tactics. These consisted of TBTU/DIEA as coupling reagent for 1 h and 2% piperidine, 2% DBU in DMF as deprotection reagent for 7 min. Cleavage of the peptide from the resin and deprotection of the amino acid side chains was achieved in TFA: thioanisole: ethanedithiol: anisole = 90:5:3:2 at 23 °C for 6 h. This was followed by removal of the exhausted resin by filtration and precipitation of the peptide in cold ether. The precipitate was allowed to settle overnight at −20 °C and then washed 3× with cold ether and dried under vacuum. Preparative RP HPLC was performed on a Waters system (Model 510) with a Vydac C4 (214TP1022) column and a flow rate of 8 ml/min. Crude peptide was loaded after treatment with DTT and eluted by gradient (5–95% B, 60 min) with 0.1% TFA/H2O and 0.1% TFA/acetonitrile. The center cut from the preparative run was frozen in liquid nitrogen immediately upon collection and lyophilized.
Labeling of Aβ40 with Acrylodan−
A typical labeling reaction consisted of mixing the Aβ40 cysteine mutant (1 mg/ml in DMSO, 30 μl) with 8 M GdnHCl (80 μl), sodium phosphate buffer (0.5 M, pH 7.5, 10 μl), and acrylodan (5 mM in DMSO, 25 μl) and incubation for 4 h at 23 °C. The labeled peptide was purified by gel filtration using PD-10 column (GE, Piscataway, NJ) eluted with 10% formic acid. Peptide concentration was determined by the BCA assay.
Aβ Preparations-
FOs were prepared by first dissolving Aβ40 (0.3 mg) in HFIP at a concentration of 420 μM for 25 min at room temperature. Then the peptide solution was diluted into ddH2O to a final concentration of 70 μM. The solution was stirred at 500 rpm with a stir bar for 1–2 days at 23 °C in an Eppendorf tube with perforated cap. PFOs were prepared by dissolving Aβ40 (0.3 mg) in 0.1 M NaOH (30 μl), incubating for 30 min at 25 °C, adding 10 mM sodium phosphate (pH 7.5, 750 μl, 0.02% sodium azide) and incubated at 25 °C for 4 days and at 4 °C for additional 3–6 days [17]. Fibrils were prepared in a similar manner except 10 mM HEPES (pH 7.4, 750 μl, 100 mM NaCl, 0.02% sodium azide) was used for dilution and the resulting solution was stirred with a stir bar for 9–10 days in the 1.6 ml Eppendorf tube at 23 °C at 500 rpm.
Western Blot-
Samples containing ~4.5 μg of Aβ40 were dissolved in SDS treatment buffer and subjected to electrophoresis using 4–20% Tris-HCl (Bio-Rad) gels. Proteins were electrophoretically transferred onto nitrocellulose membranes and developed with conformation-specific antibodies (A11: 1:2000, OC: 1:10,000) [14]. The blots were developed with the WestPico ECL chemiluminescence kit from Pierce and visualized using a digital camera [18].
Electron Microscopy-
10 μl aliquots of Aβ monomers, PFOs, FOs, and fibrils were adsorbed onto 200 mesh formvar/carbon-coated nickel grids for 5 min. The grids were then stained with 2% uranyl acetate for 2 min and washed with water. The samples were analyzed with a Phillips CM-20 microscope operated at 80 kV.
FTIR-
FTIR spectra were measured with a Bruker Equinox 55 FTIR instrument (Bruker Optics, Billerica, MA) equipped with a DTGS detector. Sample solutions were deposited on the calcium fluoride glass and allowed to dry. 512 scans at 2 cm−1 resolution were collected for each sample under constant purging with nitrogen and corrected for water vapor and background.
CD-
Far-UV CD spectra were measured using a JASCO J-815 spectropolarimeter at room temperature. A solution of protein aggregates (0.1 mg/ml) was placed into 0.1 cm pathlength cell, and the CD spectra were acquired with 20 nm/min scan speed at 0.2 nm step size under constant purging with nitrogen. Four spectra were accumulated and averaged for each sample.
Raman spectroscopy-
197 nm laser beam was focused into a spinning Suprasil NMR tube containing 100 μL of sample solution and a Teflon stirring bead [19]. Raman scattering was dispersed and recorded using a homebuilt double monochromator coupled with a liquid-nitrogen-cooled CCD camera (Roper Scientific). The acquired Raman spectra were analyzed using GRAMS/AI software (Thermo). Spectral contributions of water and quartz were quantitatively subtracted.
Determination of the Site-specific Conformational Stability−
To determine the site-specific conformational stability, the fibrils or oligomers produced from mixtures of WT Aβ40 and acrylodan-labeled Cys-Aβ40 variants in 9:1 ratio were diluted to a final Aβ concentration of 7 μM and incubated for 1 h in solutions containing different concentrations of GdnSCN (0–3.5 M) in 10 mM sodium phosphate buffer, pH 7.5, at 23 °C. Three emission spectra from 400 to 560 nm were recorded and averaged for each sample in 0.3-cm rectangular cuvettes with excitation at 360 nm using a Fluoromax-4 fluorometer (Jobin Yvon) with excitation slit at 8 nm and emission slit at 4 nm. The measurements were performed at least in duplicate for each sample and repeated with at least one more independently prepared sample.
Determination of Global Stability−
Aβ40 aggregates (5 μl, 0.3 mg/ml) were suspended in sodium phosphate buffer (30 μl, 10 mM, pH 7.5) containing different concentrations of GdnSCN. The solution was incubated for 1 h at 23 °C and then diluted to 150 μl with 6 M GdnSCN and sodium phosphate buffer (10 mM, pH 7.5) to adjust the final concentration of GdnSCN to 0.25 M. Fluorescence emission spectra were recorded in triplicate in the presence of 10 μM ThT (λex 442 nm, λem 420–520 nm) or Sypro Orange (λex 470 nm, λem 540–640 nm). Excitation and emission slits were at 4 nm. The measurements were performed at least in duplicate for each sample and repeated with at least one more independently prepared sample.
3. Results
Formation of acrylodan-labeled Aβ aggregates.
Aβ40 variants containing cysteine residues at thirteen different positions (D7C, E11C, H14C, Q15C, K16C, F20C, G25C, N27C, I31C, I32C, L34C, M35C, V40C) were synthesized and labeled with acrylodan [20]. Most of these cysteine variants have been used previously for EPR studies of Aβ fibril structure and form fibrils like wild type Aβ [21]. Fibrils and oligomers were formed from a mixture of labeled and wild type Aβ40 peptides in 1:9 ratio. Depending on the type of aggregate and the position of the label, incorporation of the labeled peptide into these aggregates was indicated by the shift in acrylodan fluorescence emission upon aggregation from 540 nm to 420–500 nm (Fig. 3). Furthermore, fibrils prepared from a mixture of unlabeled and labeled peptide (Aβ40-Acr20) and purified by centrifugation (1 h, 18,000 rpm) showed much higher fluorescence than the remaining supernatant indicating that at least 80% of fluorescent peptide has incorporated into fibrils (Fig. 1A). The identity of oligomers formed from a mixture of acrylodan-labeled and wild type Aβ40 peptides in 1:9 ratio was additionally confirmed by Western blots (Fig. 1B). Morphology of aggregates was confirmed by transmission electron microscopy (Fig. 1 C–E) and is similar to that reported earlier [14,22].
Fig. 3. Guanidine-dependent denaturation of Aβ40 fibrils and oligomers.

GdnSCN-dependent denaturation of Aβ40 fibrils (A–C), FOs (D–F) and PFOs (G–I) monitored by fluorescence of acrylodan labels.
Fig. 1. Aβ40 aggregates and incorporation of acrylodan-labeled peptide.

(A) Acrylodan-labeled Aβ40 incorporates into amyloid fibrils. Amyloid fibrils prepared from 90% unlabeled Aβ40 and 10% Aβ40-Acr20 were collected by centrifugation (18,000 rpm, 1 h). Fluorescence spectroscopy of acrylodan indicated that Aβ40-Acr20 was present primarily in the fibril fraction. (B) Incorporation of 10% of acrylodan-labeled Aβ40 does not disrupt the structure of Aβ40 oligomers as indicated by Western blots. FOs labeled at positions 15 and 35 were detected with OC antibody and PFOs labeled in positions 25 and 35 were detected with A11 antibody. (C–E) Morphology of Aβ40 fibrils (C), FOs (D) and PFOs (E) determined by electron microscopy.
Denaturation of Aβ40 oligomers and fibrils with GdnSCN.
Acrylodan has often been used to characterize the polarity of protein environment due to its large Stokes shift [20,23,24]. We measured the guanidinium thiocyanate (GdnSCN)-induced denaturation curves of Aβ40 fibrils, FOs and PFOs formed from a mixture of acrylodan-labeled and wild type Aβ40 peptides in 1:9 ratio using acrylodan fluorescence (Fig. 3). Two parameters were obtained from these denaturation curves: acrylodan emission wavelength in the absence of denaturant (proportional to polarity of the environment) and C1/2 (concentration of the denaturant corresponding to the midpoint of the denaturation curve). We also examined the denaturation of unlabeled fibrils and FOs using fluorescence of thioflavin T and Sypro Orange as readouts. Thioflavin T (ThT) is a well-known amyloid-specific fluorescent dye [25]. Sypro Orange is a fluorescent dye that binds to exposed hydrophobic areas of proteins [26,27].
Denaturation curves for Aβ40 fibrils (Fig. 3A–C) were mostly sigmoidal indicating cooperative denaturation. Stokes shift of acrylodan fluorescence was typical for the protein interior (average λem 461 ± 7 nm) [20] decreasing somewhat towards the C-terminus of the peptide indicating a more hydrophobic environment there (Fig. 2A). Denaturation of fibrils occurred at the average C1/2 value of 1.2 ± 0.1 M (Fig. 2B). Denaturation of unlabeled Aβ40 fibrils followed by ThT and Sypro Orange fluorescence resulted in C1/2 values of 1.3 ± 0.03 M for ThT and 1.4 ± 0.06 M for Sypro Orange (Fig. 2C). These values are similar to the one observed for denaturation of Aβ40-Acr20 fibrils followed by acrylodan fluorescence (Fig. 2C). This is a strong indication that site-specific denaturation at the most stable position of Aβ fibrils occurs simultaneously with disaggregation of fibrils.
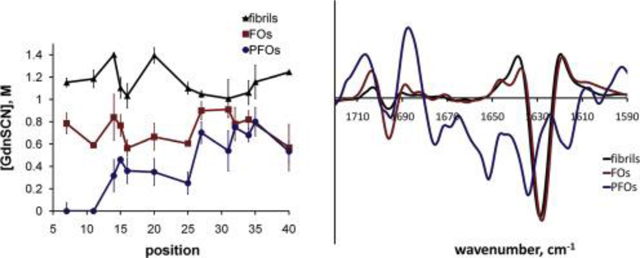
Fig. 2. Hydrophobicity and conformational stability of Aβ40 fibrils and oligomers.

(A) Hydrophobicity of the environment of Aβ40 fibrils (red), FOs (black) and PFOs (blue) was determined by monitoring the emission wavelength of acrylodan labels introduced at 13 positions along the Aβ sequence. (B) Conformational stability of Aβ40 fibrils (red), FOs (black) and PFOs (blue) was determined by following the C1/2 values for GdnSCN-mediated denaturation of acrylodan labels introduced at 13 positions along the Aβ sequence. (C) Denaturation of Aβ40 fibrils detected by fluorescence of thioflavin T (green), Sypro Orange (black) and acrylodan labels at positions 14 (blue) and 20 (red). (D) Denaturation of Aβ40 FOs detected by fluorescence of Sypro Orange (blue) and acrylodan labels at positions 14 (red) and 32 (black). (For interpretation of the references to colour in this figure legend, the reader is referred to the web version of this article.)
Acrylodan fluorophores in Aβ40 FOs were in a less hydrophobic environment as compared to fibrils (average λem 468 ± 9 nm) and denatured at much lower concentration of GdnSCN with average C1/2 value of 0.7 ± 0.1 M (Figs. 2A–B). Stokes shift of acrylodan fluorescence decreased from N-terminus to C-terminus while C1/2 values for their GdnSCN-dependent denaturation remained essentially unchanged throughout the sequence (Fig. 2A). Denaturation of unlabeled FOs monitored by the fluorescence of Sypro Orange resulted in the C1/2 value of 0.7 ± 0.1 M, similar to the values for most individual residues (Fig. 2D). This is an indication that site-specific denaturation of FOs occurs simultaneously with their disaggregation and global unfolding. Denaturation of FOs was a cooperative process judging from mostly sigmoidal denaturation curves (Fig. 3D–F).
Fluorescence spectra of acrylodan residues of PFOs at positions 7 and 11 remained unchanged after conversion to PFOs, indicating that N-terminus of Aβ remains disordered in these oligomers. Acrylodan labels at positions 14–25 denatured at 0.3–0.5 M GdnSCN with steady increase in C1/2 values to 0.6–0.8 M towards the C-terminus of the peptide (Fig. 2B). Estimating C1/2 values for PFO denaturation proved unreliable as the shape of denaturation curves suggested that this process is non-cooperative (Fig. 3G–I). Environment of acrylodan in PFOs was very hydrophobic (λem around 420–450 nm) throughout most of Aβ sequence except for residues 20 and 25 (Fig. 2A and 3G–I).
Secondary structure of Aβ oligomers and fibrils.
FOs and fibrils had very similar FTIR spectra that suggests similar β-sheet rich structures (Fig. 4A–B) [14]. FTIR spectra of PFOs, however, were significantly different. In addition to a maximum at 1634 cm−1 corresponding to β-sheets, they contained additional peaks indicating the presence of random coils (1650 cm−1) and β-turns (1675 cm−1). Additionally, hydrogen bonding in β-sheets of PFOs appeared weaker than in fibrils or FOs as indicated by the position of the band at 1634 cm−1 compared to 1628 cm−1 for fibrils and FOs (Fig. 4A–B) [28]. CD spectroscopy confirmed these observations. While CD spectra of fibrillar oligomers were typical for β-sheet rich proteins with a minimum at 218 nm, CD spectra of PFOs had a minimum at 204 nm indicating a higher proportion of random coils (Fig. 4C).
Fig. 4. Secondary structure of Aβ40 fibrils and oligomers was determined by FTIR, CD and Raman spectroscopy.

(A) FTIR spectra of Aβ40 fibrils (black), FOs (red) and PFOs (blue). (B) Second derivatives of FTIR spectra. (C) CD spectra of Aβ40 FOs (black) and PFOs (red). (D) DUVRR spectra of Aβ40 fibrils (blue), FOs (red) and PFOs (black). (For interpretation of the references to colour in this figure legend, the reader is referred to the web version of this article.)
Deep UV resonance Raman spectroscopy (DUVRR) is a powerful tool for structural characterization of aggregated proteins and peptides [29]. The sensitivity of the amide chromophore Raman signature to Ψ dihedral angle makes this technique uniquely capable of differentiating between globular and fibrillar β-sheet conformations and between parallel and antiparallel β-sheets [19,30]. The DUVRR spectrum of PFOs (Fig. 4D) had a broad amide I band with a peak centered at 1668 cm−1 and relatively intense Cα-H band, which indicates that PFOs have a predominantly disordered structure [31]. In contrast, amide I band in the spectrum of FOs was sharper and more intense with a maximum at 1673 cm−1. The intensity of Cα-H band also increased significantly. These data indicate that FOs have a significant contribution of β-sheet to their structure. The intensities of amide III and Cα-H bending bands as well as phenylalanine and tyrosine peaks increase gradually from the spectra of PFOs, FOs to the spectrum of fibrils, most likely due to tighter packing of phenylalanine and tyrosine residues into hydrophobic core [32].
4. Discussion
Despite the important role of amyloid oligomers in many neurodegenerative diseases, very limited structural information about them is available due to their high heterogeneity and low kinetic stability. However, several structural models of amyloid oligomers have been proposed, some of them based on high-resolution x-ray crystallography or NMR data [15,33,34]. We have previously proposed a classification of Aβ and other amyloid oligomers into structural classes based on their reactivity with conformation dependent antibodies [12]. Here we examined in detail the secondary structure, hydrophobicity and conformational stability of Aβ40 FOs, PFOs and fibrils.
We found that both fibrils and FOs have an extensive stable core as indicated by their resistance to GdnSCN-mediated denaturation. This core is β-sheet rich as seen from FTIR, CD and Raman spectra. Its stability is significantly higher in fibrils as indicated by their higher C1/2 values in GdnSCN-dependent denaturation. The results are fully consistent with known structures of Aβ40 fibrils [35,36] and an earlier hypothesis [13,14] that FOs are structurally similar to fibrils.
Our data shows significant structural similarities between fibrils and FOs although not with PFOs. Hydrophobicity and denaturation profiles suggest that in PFOs, at least the first eleven N-terminal residues are exposed to solvent and unstructured. Acrylodan environment in the rest of the peptide was highly hydrophobic (λem 420–450 nm). CD, FTIR and Raman spectra show that PFOs do not contain a high proportion of β-sheets and appear to be disordered to a significant extent. Denaturation of PFOs proceeded at low concentrations of GdnSCN with low cooperativity indicating weak intermolecular interactions. All these observations are consistent with the proposed structure of PFOs where N-terminal half of the peptide is disordered while the C-terminal half forms an antiparallel β-barrel [15,16]. The structural differences between the oligomer classes observed here may provide insight to their differential pathological roles in AD and may be applicable to other amyloidogenic peptides and proteins.
Acknowledgements
We thank Drs. Janos K. Lanyi, Andrei K. Dioumaev and Stephen White (University of California Irvine School of Medicine, Department of Physiology and Biophysics) and Dr. Enrico Gratton (University of California Irvine, Department of Biomedical Engineering) for the use of equipment and Dr. Vincent Raussens (Universite Libre de Bruxelles, Brussels, Belgium) for helpful suggestions. This work has been supported by grants from the NIH (AG00538 and AG033069 to CGG, AG033719 to IKL) and the Larry L. Hillblom Foundation (to CGG).
Abbreviations:
- ThT
thioflavin T
- FOs
fibrillar oligomers
- PFOs
prefibrillar oligomers
- Aβ40
amyloid beta peptide 1–40
Footnotes
Transparency document
Transparency document related to this article can be found online at http://dx.doi.org/10.1016/j.bbrc.2016.06.122.
References
- [1].Verma M, Vats A, Taneja V, Toxic species in amyloid disorders: oligomers or mature fibrils, Ann. Indian Acad. Neurol. 18 (2015) 138–145. [DOI] [PMC free article] [PubMed] [Google Scholar]
- [2].Breydo L, Uversky VN, Structural, morphological, and functional diversity of amyloid oligomers, FEBS Lett. 589 (2015) 2640–2648. [DOI] [PubMed] [Google Scholar]
- [3].Larson ME, Lesne SE, Soluble Abeta oligomer production and toxicity, J. Neurochem. 120 (Suppl 1) (2012) 125–139. [DOI] [PMC free article] [PubMed] [Google Scholar]
- [4].Kayed R, Head E, Thompson JL, McIntire TM, Milton SC, Cotman CW, Glabe CG, Common structure of soluble amyloid oligomers implies common mechanism of pathogenesis, Science 300 (2003) 486–489. [DOI] [PubMed] [Google Scholar]
- [5].Wu JW, Herman M, Liu L, Simoes S, Acker CM, Figueroa H, Steinberg JI, Margittai M, Kayed R, Zurzolo C, Di Paolo G, Duff KE, Small misfolded Tau species are internalized via bulk endocytosis and anterogradely and retrogradely transported in neurons, J. Biol. Chem. 288 (2013) 1856–1870. [DOI] [PMC free article] [PubMed] [Google Scholar]
- [6].Gerson JE, Kayed R, Formation and propagation of tau oligomeric seeds, Front. Neurol. 4 (2013) 93. [DOI] [PMC free article] [PubMed] [Google Scholar]
- [7].Kumar A, Pate KM, Moss MA, Dean DN, Rangachari V, Self-propagative replication of Abeta oligomers suggests potential transmissibility in Alzheimer disease, PLoS One 9 (2014) e111492. [DOI] [PMC free article] [PubMed] [Google Scholar]
- [8].Salahuddin P, Fatima MT, Abdelhameed AS, Nusrat S, Khan RH, Structure of amyloid oligomers and their mechanisms of toxicities: targeting amyloid oligomers using novel therapeutic approaches, Eur. J. Med. Chem. 114 (2016) 41–58. [DOI] [PubMed] [Google Scholar]
- [9].Nagel-Steger L, Owen MC, Strodel B, An account of amyloid oligomers: facts and figures obtained from experiments and simulations, Chembiochem 17 (2016) 657–676. [DOI] [PubMed] [Google Scholar]
- [10].Kayed R, Head E, Sarsoza F, Saing T, Cotman CW, Necula M, Margol L, Wu J, Breydo L, Thompson JL, Rasool S, Gurlo T, Butler P, Glabe CG, Fibril specific, conformation dependent antibodies recognize a generic epitope common to amyloid fibrils and fibrillar oligomers that is absent in prefibrillar oligomers, Mol. Neurodegener. 2 (2007) 18. [DOI] [PMC free article] [PubMed] [Google Scholar]
- [11].Kayed R, Pensalfini A, Margol L, Sokolov Y, Sarsoza F, Head E, Hall J, Glabe C, Annular protofibrils are a structurally and functionally distinct type of amyloid oligomer, J. Biol. Chem. 284 (2009) 4230–4237. [DOI] [PMC free article] [PubMed] [Google Scholar]
- [12].Glabe CG, Structural classification of toxic amyloid oligomers, J. Biol. Chem. 283 (2008) 29639–29643. [DOI] [PMC free article] [PubMed] [Google Scholar]
- [13].Ma B, Nussinov R, Polymorphic C-terminal beta-sheet interactions determine the formation of fibril or amyloid beta-derived diffusible ligand-like globulomer for the alzheimer A{beta}42 dodecamer, J. Biol. Chem. 285 (2010) 37102–37110. [DOI] [PMC free article] [PubMed] [Google Scholar]
- [14].Wu JW, Breydo L, Isas JM, Lee J, Kuznetsov YG, Langen R, Glabe C, Fibrillar oligomers nucleate the oligomerization of monomeric amyloid {beta} but do not seed fibril formation, J. Biol. Chem. 285 (2010) 6071–6079. [DOI] [PMC free article] [PubMed] [Google Scholar]
- [15].Laganowsky A, Liu C, Sawaya MR, Whitelegge JP, Park J, Zhao M, Pensalfini A, Soriaga AB, Landau M, Teng PK, Cascio D, Glabe C, Eisenberg D, Atomic view of a toxic amyloid small oligomer, Science 335 (2012) 1228–1231. [DOI] [PMC free article] [PubMed] [Google Scholar]
- [16].Do TD, LaPointe NE, Nelson R, Krotee P, Hayden EY, Ulrich B, Quan S, Feinstein SC, Teplow DB, Eisenberg D, Shea JE, Bowers MT, Amyloid beta-protein C-terminal fragments: formation of cylindrins and beta-barrels, J. Am. Chem. Soc. 138 (2016) 549–557. [DOI] [PMC free article] [PubMed] [Google Scholar]
- [17].Necula M, Kayed R, Milton S, Glabe CG, Small molecule inhibitors of aggregation indicate that amyloid beta oligomerization and fibrillization pathways are independent and distinct, J. Biol. Chem. 282 (2007) 10311–10324. [DOI] [PubMed] [Google Scholar]
- [18].Khoury MK, Parker I, Aswad DW, Acquisition of chemiluminescent signals from immunoblots with a digital single-lens reflex camera, Anal. Biochem. 397 (2010) 129–131. [DOI] [PMC free article] [PubMed] [Google Scholar]
- [19].Lednev IK, Ermolenkov VV, He W, Xu M, Deep-UV Raman spectrometer tunable between 193 and 205 nm for structural characterization of proteins, Anal. Bioanal. Chem. 381 (2005) 431–437. [DOI] [PubMed] [Google Scholar]
- [20].Prendergast FG, Meyer M, Carlson GL, Iida S, Potter JD, Synthesis, spectral properties, and use of 6-acryloyl-2-dimethylaminonaphthalene (Acrylodan), J. Biol. Chem. 258 (1983) 7541–7544. [PubMed] [Google Scholar]
- [21].Torok M, Milton S, Kayed R, Wu P, McIntire T, Glabe CG, Langen R, Structural and dynamic features of Alzheimer’s Abeta peptide in amyloid fibrils studied by site-directed spin labeling, J. Biol. Chem. 277 (2002) 40810–40815. [DOI] [PubMed] [Google Scholar]
- [22].Kayed R, Canto I, Breydo L, Rasool S, Lukacsovich T, Wu J, Albay R 3rd, Pensalfini A, Yeung S, Head E, Marsh JL, Glabe C, Conformation dependent monoclonal antibodies distinguish different replicating strains or conformers of prefibrillar Abeta oligomers, Mol. Neurodegener. 5 (2010) 57. [DOI] [PMC free article] [PubMed] [Google Scholar]
- [23].Krishnan R, Lindquist SL, Structural insights into a yeast prion illuminate nucleation and strain diversity, Nature 435 (2005) 765–772. [DOI] [PMC free article] [PubMed] [Google Scholar]
- [24].Sun Y, Breydo L, Makarava N, Yang Q, Bocharova OV, Baskakov IV, Site-specific conformational studies of prion protein (PrP) amyloid fibrils revealed two cooperative folding domains within amyloid structure, J. Biol. Chem. 282 (2007) 9090–9097. [DOI] [PubMed] [Google Scholar]
- [25].Reinke AA, Gestwicki JE, Insight into amyloid structure using chemical probes, Chem. Biol. Drug Des. 77 (2011) 399–411. [DOI] [PMC free article] [PubMed] [Google Scholar]
- [26].Steinberg TH, Haugland RP, Singer VL, Applications of SYPRO orange and SYPRO red protein gel stains, Anal. Biochem. 239 (1996) 238–245. [DOI] [PubMed] [Google Scholar]
- [27].He F, Phan DH, Hogan S, Bailey R, Becker GW, Narhi LO, Razinkov VI, Detection of IgG Aggregation by a high throughput method based on extrinsic fluorescence, J. Pharm. Sci. 99 (2010) 2598–2608. [DOI] [PubMed] [Google Scholar]
- [28].Shivu B, Seshadri S, Li J, Oberg KA, Uversky VN, Fink AL, Distinct ss-sheet structure in protein aggregates determined by ATR-FTIR spectroscopy, Biochemistry 52 (2013) 5176–5183. [DOI] [PubMed] [Google Scholar]
- [29].Kurouski D, Van Duyne RP, Lednev IK, Exploring the structure and formation mechanism of amyloid fibrils by Raman spectroscopy: a review, Analyst 140 (2015) 4967–4980. [DOI] [PubMed] [Google Scholar]
- [30].Xu M, Shashilov V, Lednev IK, Probing the cross-beta core structure of amyloid fibrils by hydrogen-deuterium exchange deep ultraviolet resonance raman spectroscopy, J. Am. Chem. Soc. 129 (2007) 11002–11003. [DOI] [PubMed] [Google Scholar]
- [31].Ahmed Z, Asher SA, UV resonance Raman investigation of a 310-helical peptide reveals a rough energy landscape, Biochemistry 45 (2006) 9068–9073. [DOI] [PubMed] [Google Scholar]
- [32].Hildebrandt PG, Copeland RA, Spiro TG, Otlewski J, Laskowski M Jr., F.G. Prendergast, Tyrosine hydrogen-bonding and environmental effects in proteins probed by ultraviolet resonance Raman spectroscopy, Biochemistry 27 (1988) 5426–5433. [DOI] [PubMed] [Google Scholar]
- [33].Tay WM, Huang D, Rosenberry TL, Paravastu AK, The Alzheimer’s Amyloid-beta(1–42) peptide forms off-pathway oligomers and fibrils that are distinguished structurally by intermolecular organization,, J. Mol. Biol. 425 (2013) 2494–2508. [DOI] [PMC free article] [PubMed] [Google Scholar]
- [34].Ahmed M, Davis J, Aucoin D, Sato T, Ahuja S, Aimoto S, Elliott JI, Van Nostrand WE, Smith SO, Structural conversion of neurotoxic amyloid-beta(1–42) oligomers to fibrils, Nat. Struct. Mol. Biol. 17 (2010) 561–567. [DOI] [PMC free article] [PubMed] [Google Scholar]
- [35].Paravastu AK, Leapman RD, Yau WM, Tycko R, Molecular structural basis for polymorphism in Alzheimer’s beta-amyloid fibrils, Proc. Natl. Acad. Sci. U. S. A. 105 (2008) 18349–18354. [DOI] [PMC free article] [PubMed] [Google Scholar]
- [36].Petkova AT, Yau WM, Tycko R, Experimental constraints on quaternary structure in Alzheimer’s beta-amyloid fibrils, Biochemistry 45 (2006) 498–512. [DOI] [PMC free article] [PubMed] [Google Scholar]