Abstract
Despite substantial progress, causal variants are identified only for a minority of familial Parkinson’s disease (PD) cases, leaving high-risk pathogenic variants unidentified1,2. To identify such variants, we uniformly processed exome sequencing data of 2,184 index familial PD cases and 69,775 controls. Exome-wide analyses converged on RAB32 as a novel PD gene identifying c.213C > G/p.S71R as a high-risk variant presenting in ~0.7% of familial PD cases while observed in only 0.004% of controls (odds ratio of 65.5). This variant was confirmed in all cases via Sanger sequencing and segregated with PD in three families. RAB32 encodes a small GTPase known to interact with LRRK2 (refs. 3,4). Functional analyses showed that RAB32 S71R increases LRRK2 kinase activity, as indicated by increased autophosphorylation of LRRK2 S1292. Here our results implicate mutant RAB32 in a key pathological mechanism in PD—LRRK2 kinase activity5–7—and thus provide novel insights into the mechanistic connections between RAB family biology, LRRK2 and PD risk.
Subject terms: Genome-wide association studies, Parkinson's disease, Genomics
Analysis of exome sequencing data identifies a missense variant in RAB32 associated with high risk of familial Parkinson’s disease. Functional studies show that this risk variant increases LRRK2 kinase activity.
Main
Approximately 10–15% of patients with Parkinson’s disease (PD) are classified as ‘familial cases’, a designation conventionally restricted to patients known to have a first degree relative also affected by the disorder8,9. The identification of causal rare variants in familial PD has contributed enormously to our current understanding of the disease, ultimately yielding drug targets, biomarkers and key insights into disease mechanisms1,10–12. Currently, seven genes have been classified as definitely associated with familial PD2,13. The discovery of these familial PD genes has been achieved through various family-based study designs, including linkage analysis, homozygosity mapping and segregation filtering1,10,12. However, in many cases, conventional family-based study designs are insufficient to identify causal variants due to a combination of genetic heterogeneity across families, reduced penetrance and limited sample size within families. Rare variant association testing methods, such as gene burden analysis, provide an alternative strategy for discovering rare genetic risk factors14. Instead of leveraging familial structure, these methods leverage case–control differences in cumulative rare variant frequencies. This approach has recently been used to study rare genetic variation in idiopathic PD15, but thus far, targeted analyses of familial PD cases have not been performed. In previous work, we demonstrated substantial power gains for disease gene discovery in amyotrophic lateral sclerosis by restricting rare variant association testing to familial cases and controls16–18. The rationale of selecting familial cases is to increase sensitivity by enriching for patients carrying rare variants of large effect. In this Letter, we apply this strategy to familial PD, conducting to our knowledge the largest genetic analysis of familial PD so far.
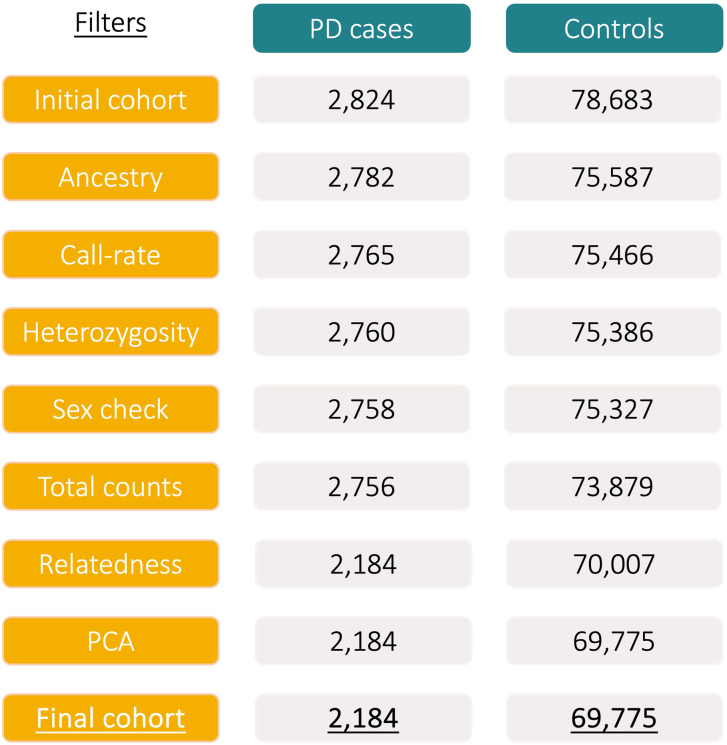
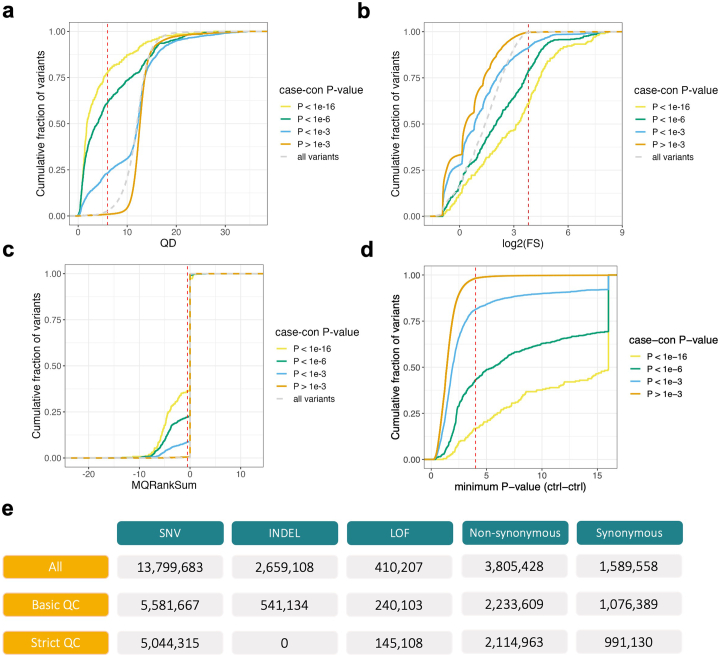
We combined sequencing data from 16 cohorts, including both whole-exome and whole-genome sequencing (WGS) data, comprising a total of 2,824 individuals with familial PD and 78,683 controls. We uniformly processed all sequence data, including alignment to the Genome Reference Consortium human build 38 (GRCh38) reference genome and joint variant calling19. We retained individuals of predominantly European ancestry who met quality control criteria (2,756 cases and 73,879 controls) and then retained unrelated individuals, resulting in an association cohort consisting of 2,184 index familial PD cases (one affected individual per family) and 69,775 controls (Extended Data Figs. 1–3). Within this cohort, we identified 5,044,315 variants that passed strict quality control, out of which 2,114,963 were predicted to be nonsynonymous (Extended Data Fig. 4).
Extended Data Fig. 1. Overview of the sample quality control (QC) steps leading to the final cohort of 2,184 individuals with PD and 69,775 controls.
For each filter, the number of samples retained after applying the filter is shown. First, samples of broad European ancestry were retained, then samples were excluded in case of low call rate (<0.9), outlying heterozygosity rate (F < − 0.1 or F > 0.1), genetically predicted sex that did not match reported sex, a deviant number of SNVs, INDELs, singletons or outlying Ti/Tv or SNV/INDEL ratio, ≤2nd degree relatedness (one of each pair is kept) or outlying values on the first five principal components.
Extended Data Fig. 3. Principal components analysis of final analysis cohort consisting of 2,184 individuals with PD and 69,775 controls.
a, Principal component 1 and 2. b, Principal component 3 and 4.
Extended Data Fig. 4. Variant quality control.
a–d, Calibration of quality score thresholds for variants that pass basic quality control (VQSR-pass, per-supercohort call-rate > 0.9, HWE equilibrium P-value in controls > 0.0001). Plots show the cumulative fraction of variants split by case-control P-value (two-tailed; Firth’s logistic regression). Thresholds were set at inflection points so that the majority of variants were retained while excluding a high proportion of variants strongly associated with case-control status. The following thresholds were applied: QD ≥ 6, MQRankSum ≥ −0.5, FS ≤ 14, and control-control minimum P-value ≥ 0.0001 (two-tailed; Firth’s logistic regression). e, Overview of variant QC steps. The first row shows the total number of called variants, the second row shows the number of variants passing basic QC, and the third row shows the number of variants passing strict QC. The strict QC variant filters were used in all analyses presented in this manuscript.
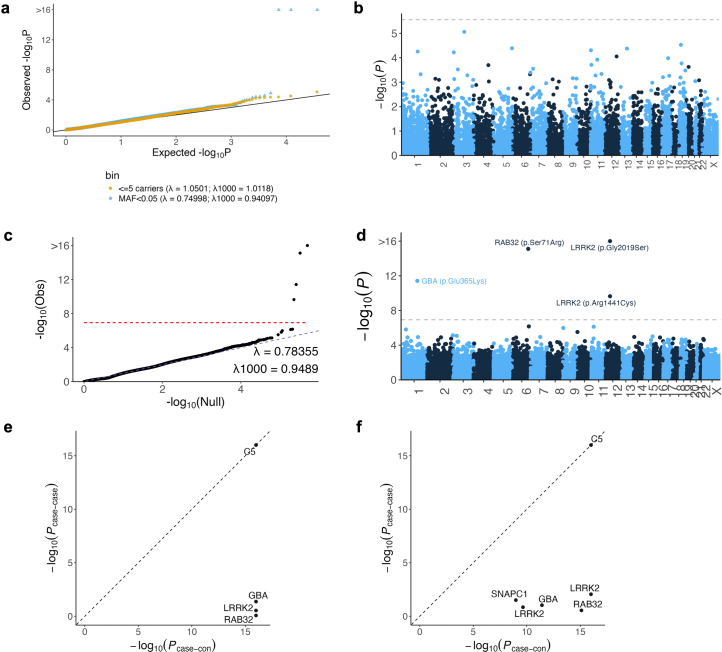
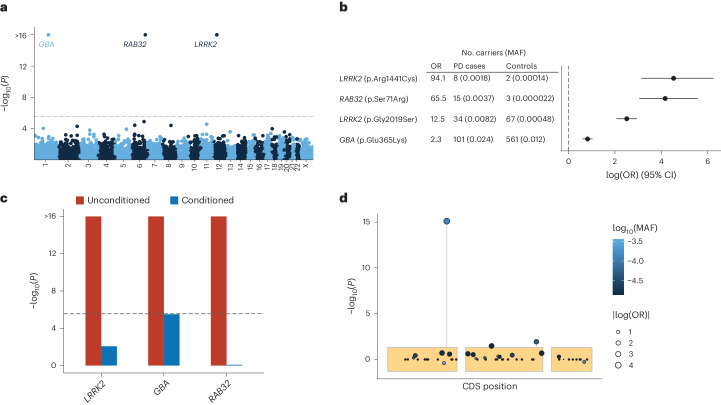
To identify genes associated with familial PD, we performed gene-based analyses for both low-frequency (minor allele frequency (MAF) <0.05) and ultrarare (≤5 carriers) nonsynonymous variants using an omnibus test that combines burden, sequencing kernel association test (SKAT) and the aggregated Cauchy association variant test (ACAT-V) (Methods)20–22. No significant disease associations were observed within the ultrarare variant category (Extended Data Fig. 5a,b); however, analyses of low-frequency variants (MAF <0.05) revealed disease associations for LRRK2, GBA and RAB32 at exome-wide significance (P < 2.7 × 10⁻⁶; Fig. 1a and Supplementary Data 1). Concurrently, we conducted exome-wide single-variant analyses, identifying four exome-wide significant variants in LRRK2, GBA and RAB32 (Fig. 1b, Extended Data Fig. 5c,d and Supplementary Data 2). Among the four significant variants, three had been previously implicated in PD, including c.1093G > A/p.E365K in GBA; c.6055G > A/p.G2019S and c.4321C > T/p.R1441C in LRRK2 (test statistics for all known PD variants are provided in Supplementary Data 2). The fourth variant, a c.213C > G/p.S71R variant of RAB32 (odds ratio of 65.5, P = 7.8 × 10⁻¹⁶), represented a novel discovery. We observed no evidence of genomic inflation in any of the analyses performed (gene λ1,000 = 0.94, single variant λ1,000 = 0.95; Extended Data Fig. 5). Of note, two additional genes (SNAPC1 and C5) were initially flagged as potential exome-wide significant associations but were then confirmed as technical artifacts in subsequent validation analyses (Methods, Supplementary Tables 1 and 2, Extended Data Fig. 5e,f, and Supplementary Figs. 1 and 2).
Extended Data Fig. 5. Rare variant analyses.
a, Quantile-quantile (qq) plot of observed gene two-tailed −log10 (P-values) versus expected two-tailed −log10 (P-values) under the null model. Gene-based associations of low-frequency (MAF < 0.05) variants were estimated using the ACAT omnibus test including Firth’s logistic regression, SKAT and ACAT-V. Gene-based associations of ultra-rare variants (≤5 carriers) were estimated using Firth’s logistic regression. b, Gene-based analysis of ultra-rare (≤5 carriers) non-synonymous variants. The y-axis shows the gene-based associations (two-tailed −log10(P-value)) plotted against genomic coordinates on the x-axis (GRCh38). The dashed line indicates exome-wide significance (P = 2.74 × 10⁻⁶). c, Quantile-quantile (qq) plot of observed single variant two-tailed −log10 (P-values) versus expected two-tailed −log10 (P-values) under the null model. The red dotted line indicates the exome-wide significance threshold (P = 1.17 × 10⁻⁷). λ indicates the observed genomic inflation factor, λ1000 indicates the genomic inflation factor for an equivalent study of 1,000 cases and 1,000 controls. d, The y-axis shows the single variant associations estimated using Firth’s logistic regression (two-tailed −log10(P-value)) plotted against genomic coordinates on the x-axis (GRCh38). The dashed line indicates the exome-wide significance threshold (P = 1.17 × 10⁻⁷). e,f, Significant genes and single variants were screened for technical biases arising from different sequencing centers by testing for an association with sequencing center (n = 1,048 and n = 1,136) among PD cases. The y-axis shows the two-tailed −log10 (P-values) from this case-case analysis compared to the two-tailed −log10 (P-values) from the case-control analysis. Genes and single variants were excluded if Pcase-case ≤ Pcase-con. In both gene-based (e) and single-variant analyses (f), technical bias was observed in the C5 gene. This was caused by one variant (C5; c.3127 C > A), of which all 44 carriers were sequenced in the same sequencing center.
Fig. 1. Rare nonsynonymous gene-based and single-variant analyses in 2,184 PD cases and 69,775 controls identify RAB32, LRRK2 and GBA.
a, The y axis shows the gene-based associations from the ACAT omnibus test including Firth’s logistic regression, SKAT and ACAT-V (two-tailed −log10(P value)) plotted against genomic coordinates on the x axis (GRCh38). The dashed line indicates the exome-wide significance threshold (P = 2.7 × 10⁻⁶). b, Estimated odds ratios (OR) (log transformed, x axis) and 95% confidence intervals (CI) of the exome-wide significant single variants obtained from Firth’s logistic regression. c, Conditional analyses (MAF <0.05) of significant genes using the ACAT omnibus test including Firth’s logistic regression, SKAT and ACAT-V (two-tailed). In red are the unconditioned gene associations and in blue are the conditioned gene associations, adjusted for the significant single variants within the respective gene (p.E365K in GBA, p.G2019S and p.R1441C in LRRK2, and p.S71R in RAB32). d, Single-variant associations in RAB32 estimated using Firth’s logistic regression (y axis; two-tailed −log10(P value)), plotted against coding sequence positions (CDS; x axis).
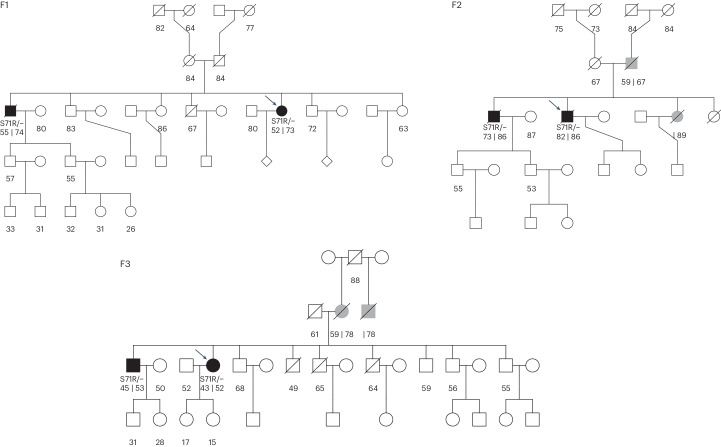
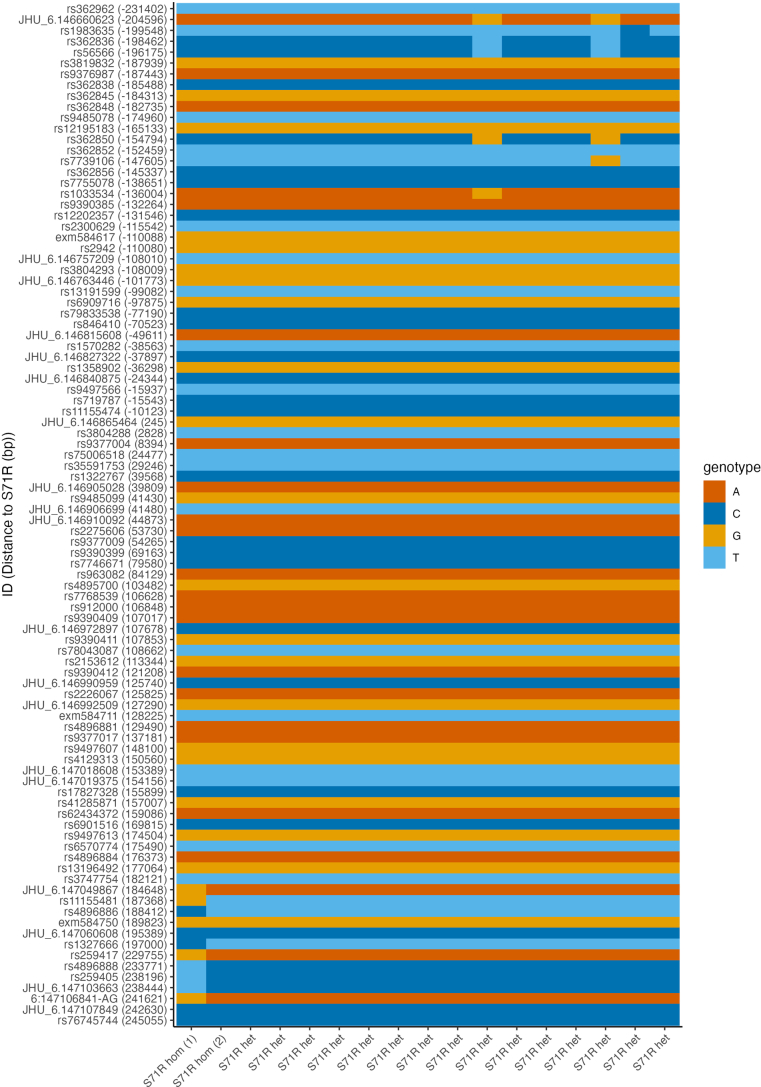
Both the gene-based and single-variant analyses converged on RAB32 as a novel PD gene. Conditional analysis revealed that the observed RAB32 gene association was due to the p.S71R variant (Pconditional = 0.83; Fig. 1b–d), whereas conditional analyses for LRRK2 and GBA confirmed that known residual associations from additional disease relevant rare variants were detectable within the dataset (Fig. 1c; GBA, Pconditional = 3.1 × 10⁻⁶ and LRRK2, Pconditional = 8.7 × 10⁻³). Among 2,184 index PD cases, we identified one homozygous carrier and 15 heterozygous carriers of the RAB32 p.S71R variant (MAFcase of 0.0037), while only three (heterozygous) variant carriers were identified among the 69,775 controls (MAFctrl of 0.000022). The MAF observed in the control group is similar to that reported in 44,329 non-neurological European ancestry individuals in the gnomAD (v2.1.1) reference database (MAFgnomAD of 0.000023), confirming that the variant is very rare in the general population23. For three PD cases carrying the p.S71R variant, exome sequencing data were available for one of their affected siblings, and the variant segregated with the disease in all three families (Fig. 2 and Extended Data Fig. 6). Thus, in total, we identified 18 PD cases carrying the p.S71R variant, of which 17 were heterozygous carriers and one was a homozygous carrier (no evidence for inbreeding, F = −0.004). Sanger sequencing confirmed the presence of the variant in all 18 PD cases (Supplementary Table 1 and Supplementary Fig. 1). Haplotype analysis indicated that carriers shared a ~300-kb haplotype surrounding the p.S71R variant (Extended Data Fig. 7). Evaluation of other known PD variants revealed the co-occurrence of p.S71R in two carriers with GBA risk variants (c.1093G > A/p.E365K and c.1223C > T/p.T408M) (Extended Data Table 1).
Fig. 2. Pedigrees of families with multiple sequenced individuals.
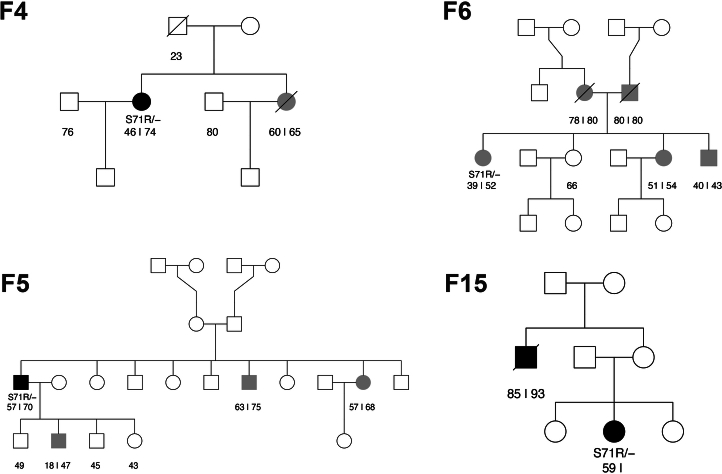
Unaffected family members are indicated by white symbols, affected family members with verified PD are indicated by black symbols and family members with nonverified or reported PD are indicated by gray symbols. For individuals with PD, the age of onset is displayed at the left and age at death or last follow-up is displayed on the right (separated by ‘|’). For nonaffected individuals, the age at death or last follow-up is displayed. Probands are indicated by arrows. Pedigrees for which only the proband was sequenced are presented in Extended Data Fig. 6.
Extended Data Fig. 6. Pedigrees of families with one sequenced individual.
Unaffected family members are indicated by white symbols, affected family members with verified PD are indicated by black symbols, family members with non-verified or reported PD are indicated by grey symbols. For individuals with PD, age of onset is displayed at the left and age at death or last follow-up is displayed on the right (separated by a ‘|’). For non-affected individuals, the age at death or last follow-up is displayed.
Extended Data Fig. 7. Shared haplotype for RAB32 p.S71R.
The figure shows the shared haplotype in a ± 250-kb window surrounding the p.S71R variant based on common markers on the Infinium Global Diversity Array-8 (available for 16 out of 18 p.S71R carriers). The y-axis shows SNP IDs with the distance to the p.S71R variant in parentheses, and the x-axis shows the p.S71R genotype (both alleles are shown for the homozygous carrier). The minimal common region extends from -131,546 bp downstream to 182,121 bp upstream of the p.S71R variant.
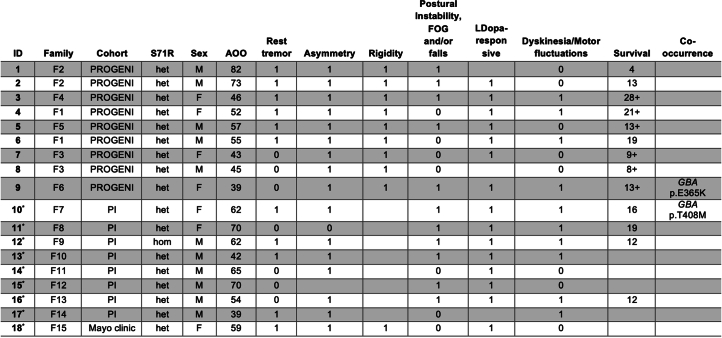
Extended Data Table 1.
Clinical characteristics for carriers of the RAB32 p.S71R variant
Individuals for which detailed case reports are available are indicated by an asterisk (Supplementary Note). ‘1’ indicates that the symptom is present, ‘0’ indicates the symptom was not present, blank indicates unknown. A ‘+’ in the Survival field indicates that the individual was alive at last follow-up. Abbreviations: PI, Parkinson Institute; AOO, age of onset; FOG, freezing of gait.
We identified an additional four carriers among 3,380 PD cases (0.12%) in the publicly available Accelerating Medicines Partnership program for PD WGS data (https://www.amp-pd.org/), of which two were familial PD cases (out of 900; 0.22%), one was a sporadic PD case and family history was not available for the fourth case.
Carriers of the RAB32 p.S71R variant had a mean age of onset of 56 years (s.d. 13; range, 39–82 years), which did not significantly differ from noncarriers (Extended Data Fig. 8 and Extended Data Table 1). The variant was observed in 11 males and 7 females, reflecting the overall sex ratio of patients in this study (~60% male). All p.S71R carriers evaluated for L-dopa response were confirmed as L-dopa responsive (15 evaluated and 3 not evaluated) and for the majority (10 out of 18), dyskinesia and/or motor fluctuations were reported. For all but one of the carriers, asymmetry was reported (16 out of 17), and the majority presented with rest tremors (11 out of 18). Moreover, postural instability, freezing of gait and/or falls were common symptoms among carriers reported in 11 out of 18 patients. Detailed case reports were available for nine patients (Supplementary Note). Among them, seven out of nine patients reported nonmotor symptoms, including, among others, hyposmia, autonomic dysfunction, sleep problems and depression. Notably, two patients had a medical history of Hashimoto’s thyroiditis. The case report of the homozygous carrier shows that the clinical presentation did not notably differ from that of heterozygote carriers. He had late-onset (61 years), L-dopa-responsive PD characterized by a right resting tremor and micrographia with motor fluctuations and dyskinesia emerging 9 years after onset. The patient passed away 12 years after the onset, with falls and mild cognitive impairment appearing 10 and 11 years after onset, respectively.
Extended Data Fig. 8. Age of onset (AOO) distribution of RAB32 p.S71R carriers versus RAB32 wild-type patients.
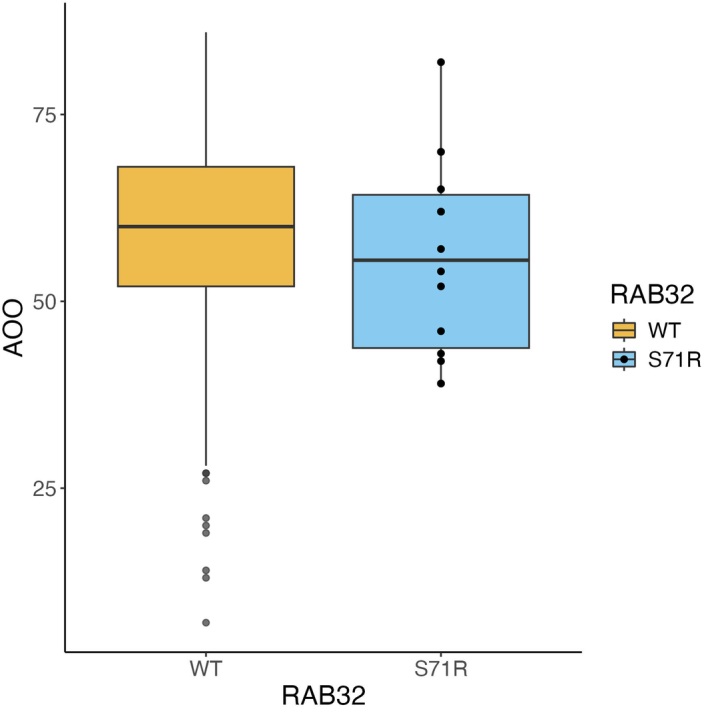
Age at onset was known for 1,414 unrelated individuals. The box edges represent the interquartile range (75th and 25th percentile) with the horizontal line indicating the median. The whiskers extend to 1.5 times the IQR from the box edges. Individual data points beyond the ends of the whiskers are shown for RAB32 wild-type (WT); all individual data points are shown for RAB32 S71R. No statistically significant difference was observed in a linear regression adjusting for cohort (b = −2.7 years, two-tailed P = 0.38).
RAB32 belongs to the RAB family of small GTPases, which is composed of 70 members that play key roles in regulating intracellular vesicular transport24. Various members of the RAB family are known to be either substrates or regulators of the key PD protein LRRK2 (refs. 24–26). Most pathogenic LRRK2 variants increase kinase activity, in turn resulting in increased phosphorylation of several RAB family members25,27,28. Interestingly, while there is no evidence supporting phosphorylation of RAB32 by LRRK2, RAB32 has been shown to interact with LRRK2 through the N-terminal Armadillo domain of LRRK2, and may regulate its subcellular localization3,4. Moreover, overexpression of RAB29, a member of the RAB32 subfamily, has been shown to activate LRRK2, recruiting it to the trans-Golgi network and increasing its kinase activity26.
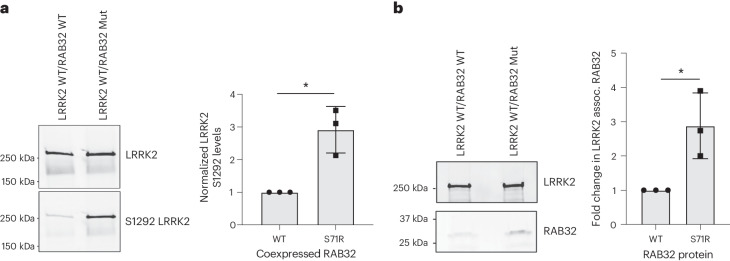
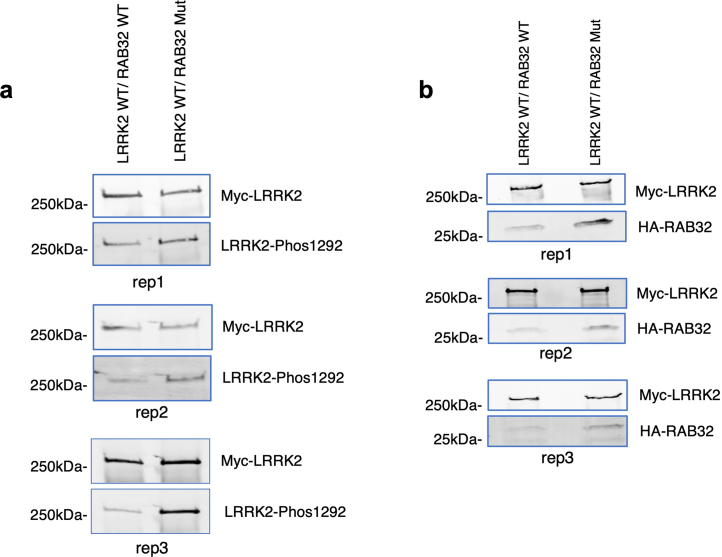
Given the established interaction between LRRK2 and RAB32, along with the closely related RAB29 functioning as a LRRK2 activator, we hypothesized that RAB32 S71R results in increased LRRK2 activation. To this end, we performed cotransfections in HEK293 cells, introducing Myc-LRRK2 wild type (WT) alongside either HA-RAB32 WT or HA-RAB32 S71R. Autophosphorylation of S1292 provides a known in vivo readout of LRRK2 kinase activity, as well as a biomarker for the development of parkinsonian phenotypes in patients carrying LRRK2 mutations27,29,30. As anticipated, we observed a significant increase in LRRK2 S1292 phosphorylation levels in cells expressing mutant RAB32 versus WT RAB32 (approximately threefold increase, P = 0.02; Fig. 3a and Extended Data Fig. 9). In keeping with this, we also observed a threefold increase in the interaction between LRRK2 and RAB32 through coimmunoprecipitation and western blotting (P = 0.034; Fig. 3b and Extended Data Fig. 9). Finally, previous phosphoproteomic analysis indicated that Ser71 constitutes the only known phosphorylation site on the RAB32 protein (Fig. 4)31. The S71R variant probably interferes with this phosphorylation event, and this may provide an explanation for why the S71R variant alone was found to exhibit a robust association with PD risk. Taken together, these results support a model where the S71R variant selectively impacts the functioning of RAB32 in a manner that increases its interaction with LRRK2 and, through this, increases LRRK2 activity.
Fig. 3. RAB32 S71R triggers increased LRRK2 kinase activity.
Western blot analyses of cotransfections in HEK293 cells, where Myc-LRRK2 WT was introduced alongside either HA-RAB32 WT or HA-RAB32 S71R. The bar plots show mean ± s.d. a, LRRK2 S1292 phosphorylation; n = 3 biological replicates are shown (two-tailed one-sample t-test, P = 0.02; Extended Data Fig. 9). b, LRRK2 and RAB32 coimmunoprecipitation; n = 3 biological replicates are shown (two-tailed one-sample t-test, P = 0.034; Extended Data Fig. 9). *P < 0.05. Full-length blots are provided as source data. Mut, mutant.
Extended Data Fig. 9. Western blots for all biological replicates.
a,b, Western blots for all three biological replicates of LRRK2 S1292 phosphorylation (a) and LRRK2 and RAB32 co-immunoprecipitation (b). Full-length blots are provided as Source Data.
Fig. 4. Three-dimensional protein structure of RAB32 highlighting the phosphorylation site at Ser71.
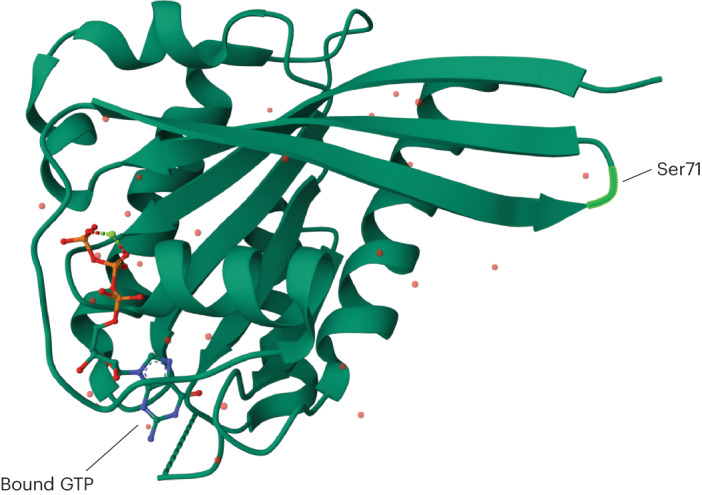
Crystal structure of uncomplexed Rab32 in the active GTP-bound state at 2.13 Å resolution4,34.
In conclusion, we present, to our knowledge, the largest genetic association study of familial PD so far, identifying p.S71R in RAB32 as a novel risk variant and substantiating that the toxicity of this variant is most probably mediated through enhancement of LRRK2 activity. Importantly, substantial evidence points toward increased LRRK2 kinase activity as the primary pathological mechanism in LRRK2 PD and, to some extent, idiopathic PD, and consequently, reduction of LRRK2 activity has emerged as a major therapeutic focus5–7. Future research is needed to determine the mechanism through which RAB32 S71R increases LRRK2 activity. Of particular interest is the possibility that RAB32 S71R leads to tetramerization of LRRK2, similar to RAB2932, which was shown to increase LRRK2 autophosphorylation in contrast to WT RAB32. Our study underscores that, as with prior work in amyotrophic lateral sclerosis16–18, the combination of familial case ascertainment and a sizable control cohort enables the identification of low-frequency variants that were previously limited to detection by linkage analyses. This is evidenced first and foremost by the discovery of RAB32 p.S71R, but also by the recovery of known ultrarare PD variants that had not previously been detectable in genome-wide case–control analyses (LRRK2 p.R1441C, MAFctrl 0.000014, P = 2.27 × 10⁻¹⁰). Interestingly, our findings are corroborated by a recent study33, which discovered that RAB32 p.S71R segregates with PD in three families, not overlapping with our study. Consistent with our results, this parallel study demonstrates that RAB32 S71R enhances LRRK2 autophosphorylation, as well as RAB10 phosphorylation. This independent study provides complementary evidence that validates our findings, thus firmly establishing RAB32 p.S71R as a causal factor in familial PD. Finally, the identification of RAB32 as a familial PD gene provides new insight into the important mechanistic connections between RAB family biology, LRRK2 and PD risk.
Methods
Cohorts
We received approval for this study from the institutional review boards of the participating centers, and written informed consent was obtained from all patients (consent for research). Informed consent was obtained for the publication of individual case reports. The discovery cohort included 2,824 patients with PD and 78,683 controls, totaling 81,507 study participants, of which 10,270 were subjected to WGS and 71,237 to whole-exome sequencing (WXS). One thousand six hundred familial PD cases were from the PROGENI study, which recruited multiplex PD families primarily through a living affected sibling pair. Subsequently, ascertainment was loosened to include PD probands having a positive family history of PD in a first-degree relative, who was not required to be part of the study. All individuals completed an in-person evaluation that included parts II and III of the Unified Parkinson Disease Rating Scale (Lang and Fahn 1989) and a diagnostic checklist that implemented the UK PD Brain Bank inclusion and exclusion criteria. Responses on the diagnostic checklist were then used to classify study subjects as having verified PD or nonverified PD. A total of 783 familial PD cases were recruited at the Mayo clinic, patients were included who fulfilled the clinical diagnostic criteria of PD35. A total of 441 familial PD cases were from the Parkinson Institute Biobank; diagnosis of PD was made according to the UK Brain Bank criteria35. Control cohorts included 7,323 samples from the National Heart, Lung, and Blood Institute Trans-Omics for Precision Medicine research program36; 49,981 samples from the UK Biobank37; 2,805 samples from Project MinE38; 342 samples from the New York Genome Center’s amyotrophic lateral sclerosis (ALS) consortium and 18,232 samples from database of Genotypes and Phenotypes (included studies and accession number are listed in the ‘Data availability’ section)39.
Sequencing
All raw sequencing data was aligned to the GRCh38 reference genome using Burrow–Wheeler aligner maximal exact match (BWA–MEM; v.2.2.1)40 according to the pipeline described by Regier et al.41 (implementation can be found at GitHub42 and Zenodo43). Joint genotyping was performed using a uniform pipeline according to the Genome Analysis Toolkit (GATK) best practices (v. 4.2.6.1)19. Genotype calls with a quality score <20 were set to missing, variant calls supported by uninformative reads were excluded and multiallelic variants were split into biallelic variants. Male genotypes in nonpseudoautosomal regions on chromosome X were coded as 0 or 1 (according to 0 or 1 allele copies).
Variant annotation
Variants were annotated using snpEff44, dbscSNV45 and Ensembl Release 105 gene models46. Variants were classified as loss-of-function when predicted by snpEff to have a high impact (including nonsense mutations, splice acceptor/donors and frameshift mutations) or predicted as potentially splice altering by dbscSNV (‘ada’ or ‘rf’ score >0.7). Variants were classified as having moderate impact when predicted as such by snpEff (including missense mutations and inframe deletions). For each gene, the impact of a variant was determined by its most severe consequence across protein-coding transcripts.
Sample quality control
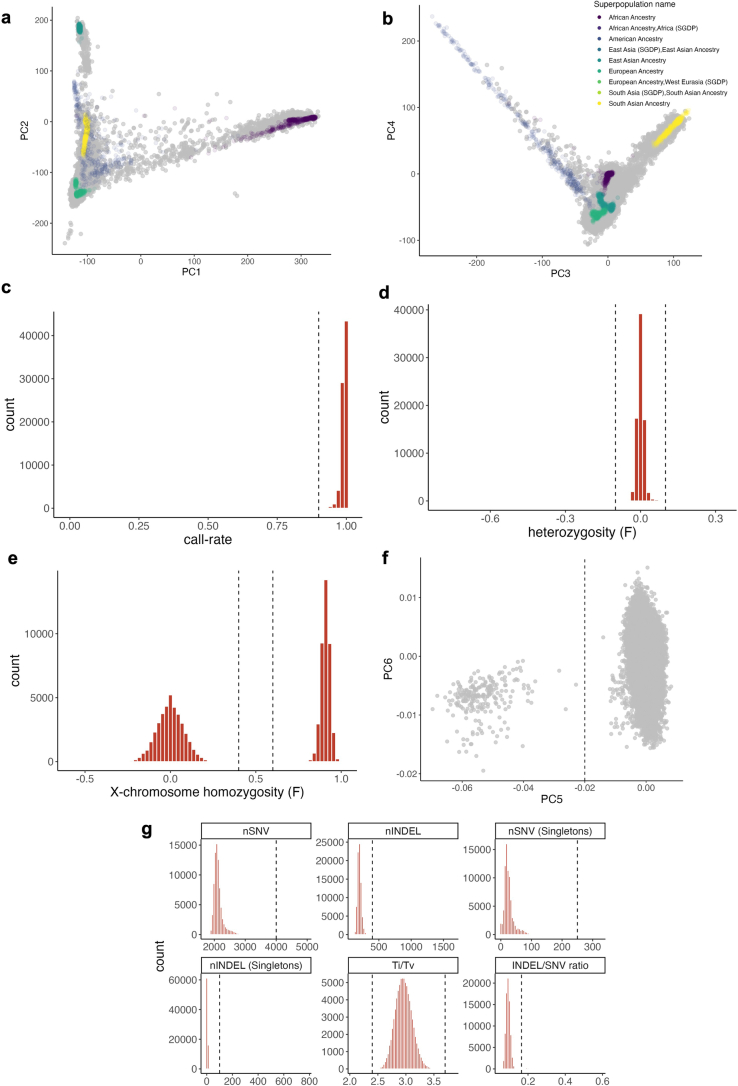
Ancestry was estimated by projecting all samples on a reference ancestry space comprising 1000 Genomes samples using the LASER software (v2.04)47. We retained individuals of predominantly European ancestry (Extended Data Figs. 1 and 2). We then excluded samples with low genotype call rates (<0.9), discordant sex or deviating heterozygosity (F < −0.1 or F > 0.1). These metrics were calculated in a set of autosomal variants meeting the following criteria: call rate >0.9 in each supercohort (WGS, WXSUKB and WXSother), MAF >0.01, and for sex inference, heterozygosity, relatedness and principal component analysis (PCA) variants were additionally filtered on the basis of Hardy–Weinberg equilibrium (P < 0.001) and pruned if in linkage disequilibrium (r2 < 0.5, window size of 50, step 5; additionally, high linkage disequilibrium regions were excluded before PCA48). We then excluded samples based on a high exome-wide number of single-nucleotide variants (SNVs), insertions/deletions (INDELs), singletons, high INDEL/SNV ratio or deviating Ti/Tv ratio (thresholds listed in Extended Data Fig. 2). Sample duplicates and relatives up to and including the second degree were identified using the KING software49. An unrelated sample set was generated by first excluding samples with five or more relations, followed by iteratively excluding individuals with the highest number of relations, resolving ties by prioritizing (in order) PD over controls and WGS over WXS samples. PCA was performed on the unrelated sample set using fastPCA as implemented in PLINK2 (ref. 50). A distinct cluster was identified on the fourth and fifth principal component, consisting of an Amish population, which was excluded since the cluster contained only controls (Extended Data Fig. 2).
Extended Data Fig. 2. Sample QC.
a,b, Projection of all samples onto PCA coordinates of a reference ancestry space comprising 1000 Genomes samples. Grey dots indicate the 81,507 samples included in this study. Colored dots indicate the 1000 Genomes samples, colored by superpopulation label, onto which the study samples were projected. c, Sample call-rate distribution. Samples with a call-rate < 0.9 were excluded. d, Heterozygosity. Samples with F < − 0.1 or F > 0.1 were excluded. e, X-chromosome homozygosity. Samples with ambiguous sex (0.4 < F < 0.6) or where genetically predicted sex did not match reported sex were excluded (F < 0.4 = female; F > 0.6 = male). f, Principal component analysis (PCA). A distinct cluster was identified on the fifth principal component, samples with PC5 < −0.02 were excluded. g, Total variant count distributions. Samples were excluded if nSNV > 4000, nINDEL > 400, nSNV (Singletons) > 250, nINDEL (Singletons) > 100, Ti/Tv ratio < 2.4 or > 3.7 or INDEL/SNV ratio > 0.165.
Variant quality control
First, GATK variant quality score recalibration (VQSR) was applied to all variants using the training data and annotations as recommended by the GATK best practices19. Variants were excluded if they did not pass variant quality score recalibration, their genotyping rate was <0.9 in any of the supercohorts (WGS, WXSUKB and WXSother) or if they did not pass the Hardy–Weinberg equilibrium test in control subjects (P < 0.0001). We then additionally excluded variants with subpar quality scores, variants located in regions showing signs of batch effects and we retained only SNVs. Potential batch effects were identified by testing whether variant minor allele counts were associated with cohort membership within control subjects. Firth’s logistic regression was used to perform these control–control analyses, adjusting for sex and four principal components. This procedure was repeated for each cohort (that is, number 1 represents individual in respective cohort, number 0 represents otherwise). In total, 16 control versus control cohort comparisons were tested (including all WGS controls versus all WXS controls). The minimum P value across these analyses was used as a metric to identify variants associating with probable batch effects. The stringency of various standard variant quality control filters was then increased to eliminate variants exhibiting batch associated calling bias while maintaining maximal sensitivity for unbiased variant calls (Extended Data Fig. 4). In total 5,044,315 variants passed quality control, including 2,114,963 nonsynonymous variants (Extended Data Fig. 4).
Single-variant analyses
Single-variant analyses were performed for all nonsynonymous variants with MAF <0.05 and a minor allele count of at least five (425,827 variants). For each variant, we tested for an association between PD status and minor allele count using Firth’s logistic regression adjusting for sex, the first ten principal components and the total number of rare synonymous variants in each individual20. All tests were two sided and Bonferroni correction was employed to correct for multiple testing. Significant single-variant associations were screened for potential technical biases arising from different sequencing centers among cases by using the same procedure employed in the control–control analyses. Variants where Pcase–case < Pcase–control were flagged as being potentially driven by technical variation (Extended Data Fig. 5). In addition, we performed Sanger sequencing to validate novel identified variants (see ‘Sanger sequencing’ section). Haplotypes were inferred using Beagle (v.5.4) in single-nucleotide polymorphism (SNP) array data (Infinium Global Diversity Array-8)51.
Gene-based analyses
Gene-based rare variant analyses were performed for 18,242 protein-coding genes, including either low frequency (MAF <0.05) or ultrarare (≤5 carriers) nonsynonymous variants (loss-of-function or moderate impact). For ultrarare variants, we performed burden tests by testing for an association between PD status and the aggregate effect of minor alleles observed per sample per gene. For low-frequency variants (MAF <0.05), we additionally performed SKAT and ACAT-V tests22,52. To account for the unbalanced case–control ratio, burden tests were performed using Firth’s logistic regression20, the robust version of SKAT was employed21 and we adapted ACAT-V so that Firth’s logistic regression is used to perform the burden and single-variant tests that underlie ACAT-V53. Test statistics across the three statistical tests were combined using ACAT, which is designed to combine potentially correlated test statistics22. In each of the tests, we included sex, the first ten principal components and the total number of qualifying synonymous variants in each individual as covariates. Tests were retained when there were at least five variant carriers across the gene.
We performed conditional analyses to assess to what extent gene-based associations were driven by significant variants identified in the single-variant analysis. Conditional gene-based analyses were performed as described above, excluding and adjusting for the significant single variants within the respective gene.
Sanger sequencing
Sanger sequencing of RAB32 exon 1 and SNAPC1 c.1073-2A > T was performed using touchdown PCR (30 cycles with annealing temperature starting at 65 °C and decreasing 0.5 °C per cycle, followed by 15 cycles with an annealing temperature of 65 °C) using primers generated with M13 tails. Amplification was performed using AmpliTaqGold 360 Master mix (Thermo Fisher Scientific, 4398876). Patient DNA samples were provided after extraction from whole blood. PCR products were visualized on a 2% agarose gel using gel electrophoresis and subsequently purified by incubation with Exonuclease I (New England Biolabs, M0293L) and shrimp alkaline phosphatase (Sigma-Aldrich, GEE70092X). Following purification, all PCR products were sequenced at the MGH Massachusetts General Hospital DNA Core Facility. Sequence analysis was performed using the PHRED/PHRAP/Consed software suite (http://www.phrap.org/) and variations in the sequences were identified with the Polyphred v6.15 software54. The PCR and sequencing primers are listed in Supplementary Tables 1 and 2. Primer set 1a in Supplementary Table 1 is for one sample (sample 17 in Extended Data Table 1) that has a primer sitting on top of the common SNP, rs41285869. New primers were designed to avoid this common SNP as a false homozygous variant was visualized as compared with the exome sequencing results.
Immunoprecipitation
Immortalized cell culture
HEK293 cells (ATCC) were maintained at 37 °C with 5% CO2 in Dulbecco’s modified Eagle medium (Invitrogen) supplemented with 10% (vol/vol) heat inactivated fetal bovine serum (MediaTech), 2 mM l-glutamine (Gibco) and 1% (vol/vol) penicillin and streptomycin solution (Gibco).
Plasmids used for this study
The 2xMyc-LRRK2 WT plasmid was acquired from Addgene (number 25361) and confirmed via whole plasmid sequencing at Massachusetts General Hospital. The HA-RAB32 constructs, WT and S71R, were made and sequenced by Genescript. All constructs were prepped with a Maxi prep kit (Qiagen) following the manufacturer’s instructions.
Immunoprecipitation and western blot
HEK293 cells were transfected with Lipofectamine 2000 (Invitrogen) according to the manufacturer’s instructions using a DNA:Lipo ratio of 3 μg:6 μl per well of a six-well plate. For cotransfections, the DNA amount was divided at a 2:1 ratio for LRRK2 WT:RAB32 constructs. A total of 48 h posttransfection, the lysates were collected in denaturing hypotonic lysis buffer55 and protein concentration determined by Pierce BCA Protein Assay (Thermo Fisher). The 1× PBS + 0.1% Tween 20 washed Myc–antibody conjugated magnetic beads were combined with lysate in a 1 μl:5 μg ratio before rotating the immunoprecipitation overnight at 4 °C. The beads were washed with denaturing wash buffer55 before protein elution by boiling in 2× loading sample buffer (Boston Bioproducts). Approximately 50% of the eluate from each condition was run on a 4–20% gradient gel (Bio-Rad) and transferred to a polyvinylidene difluoride membrane (Bio-Rad) on the high molecular weight setting of a Trans-blot Turbo system (Bio-Rad). The membranes were processed as described previously56. Primary antibodies were used as follows: 1:2,000 for rabbit anti-HA (DSHB, catalog number anti-HA rRb-IgG), 1:1,000 mouse anti-Myc (BioLegend, catalog number 626802) and 1:300 Phos-LRRK2 S1292 (Abcam, catalog number 203181). Blots were visualized with an Odyssey Infrared Imager (LiCor, model 9120).
Reporting summary
Further information on research design is available in the Nature Portfolio Reporting Summary linked to this article.
Online content
Any methods, additional references, Nature Portfolio reporting summaries, source data, extended data, supplementary information, acknowledgements, peer review information; details of author contributions and competing interests; and statements of data and code availability are available at 10.1038/s41588-024-01787-7.
Supplementary information
Supplementary Tables 1 and 2, Figs. 1 and 2, and Note.
Summary statistics for all gene-based association analyses.
Summary statistics for all single variant analyses.
Source data
Uncropped western blots.
Uncropped western blots.
Acknowledgements
We acknowledge S. Goldwurm for his contributions to this work. This research has been conducted using the UK Biobank Resource under application number 48361. Grants from National Institutes of Health (NIH)/National Institute of Neurological Disorders and Stroke (NINDS) R01NS096740 and R56NS082349 to J.E.L. and T.M.F. Grant from NIH/NINDS: R61NS130604 was given to J.E.L. and from NIH/NINDS: R01NS037167 was given to T.M.F. K.K. is supported by grants from the Dutch Research Council (grant no. ZonMW-VIDI 91719350) and the ALS Foundation Netherlands. All New York Genome Center ALS Consortium activities are supported by the ALS Association (ALSA, 19-SI-459) and the Tow Foundation. The Target ALS Human Postmortem Tissue Core, New York Genome Center for Genomics of Neurodegenerative Disease, Amyotrophic Lateral Sclerosis Association and Tow Foundation. Z.K.W. is partially supported by the NIH/National Institute on Aging and NIH/NINDS (1U19AG063911, FAIN: U19AG063911), Mayo Clinic Center for Regenerative Medicine, the gifts from the Donald G. and Jodi P. Heeringa Family, the Haworth Family Professorship in Neurodegenerative Diseases fund, The Albertson Parkinson’s Research Foundation and PPND Family Foundation. O.A.R. is supported in part by NIH (P50-NS072187; R01-NS078086; U54-NS100693; U54-NS110435), DOD (W81XWH-17-1-0249), The Michael J. Fox Foundation, The Little Family Foundation, T. Turner and family, the Mayo Clinic Foundation, and the Center for Individualized Medicine. This study was supported by the generous contribution of the ‘Fondazione Grigioni per il Morbo di Parkinson’, Milan (Italy), a charitable association linked to AIP (the ‘Italian Association of Parkinsonians’; http://www.parkinson.it/fondazione-grigioni.html). The ‘Fondazione Grigioni per il Morbo di Parkinson’ paid part of lab expenses and the salary of L.S. DNA samples belong to the ‘Parkinson Institute Biobank’, member of the Telethon Network of Genetic Biobanks (http://biobanknetwork.telethon.it). This project has received funding from the European Research Council under the European Union’s Horizon 2020 Research and Innovation programme (grant agreement no. 772376–EScORIAL). Data from the New York Genome Center ALS consortium were used. All consortium members are listed in the Supplementary Note.
Extended data
Author contributions
Experiments and data analysis were performed by P.J.H., D.L., P.J.K., D.M.B., T.M.F., K.P.K. and J.E.L. Sample ascertainment and data generation was carried out by P.J.H., D.L., P.J.K., D.M.B., B.J.K., M.K., S., C.H., L.S., R.A., S.B., A.I.S.-B., Z.K.W., R.J.U., I.U.I., G.P., N.T., O.A.R., J.H.V., T.M.F., K.P.K. and J.E.L. Writing of the paper was performed by P.J.H., D.L., T.M.F., K.P.K. and J.E.L. Study supervision was carried out by T.M.F., K.P.K. and J.E.L. All authors have seen and approved the paper.
Peer review
Peer review information
Nature Genetics thanks Roy Alcalay, Henry Houlden and the other, anonymous, reviewer(s) for their contribution to the peer review of this work.
Data availability
Exome sequencing data from the case-cohort is available under dbGaP study phs001004 or are available via the corresponding author subject to the data sharing terms of the respective cohorts. Project MinE data are available upon request (https://www.projectmine.com/research/data-sharing/). dbGAP datasets used are available under the following accession numbers: Alzheimer’s Disease Sequencing Project (ADSP) (phs000572), Autism Sequencing Consortium (ASC) (phs000298), Sweden-Schizophrenia Population-Based Case–Control Exome Sequencing (phs000473), Inflammatory Bowel Disease Exome Sequencing Study (phs001076), Myocardial Infarction Genetics Exome Sequencing Consortium: Ottawa Heart Study (phs000806), Myocardial Infarction Genetics Exome Sequencing Consortium: Malmo Diet and Cancer Study (phs001101), Myocardial Infarction Genetics Exome Sequencing Consortium: University of Leicester (phs001000), Myocardial Infarction Genetics Exome Sequencing Consortium: Italian Atherosclerosis Thrombosis and Vascular Biology (phs000814), NHLBI GO-ESP: Women’s Health Initiative Exome Sequencing Project (WHI)—WHISP (phs000281), Building on GWAS for NHLBI diseases: the US CHARGE Consortium (CHARGE-S)—CHS (phs000667), Building on GWAS for NHLBI Diseases: the US CHARGE Consortium (CHARGE-S)—ARIC (phs000668), Building on GWAS for NHLBI diseases: the US CHARGE Consortium (CHARGE-S)—FHS (phs000651), NHLBI GO-ESP Family Studies: Idiopathic Bronchiectasis (phs000518), NHLBI GO-ESP: Family Studies (Hematological Cancers) (phs000632), NHLBI GO-ESP: Family Studies (familial atrial fibrillation) (phs000362), NHLBI GO-ESP: Heart Cohorts Exome Sequencing Project (ARIC) (phs000398), NHLBI GO-ESP: Heart Cohorts Exome Sequencing Project (CHS) (phs000400), NHLBI GO-ESP: Heart Cohorts Exome Sequencing Project (FHS) (phs000401), NHLBI GO-ESP: Lung Cohorts Exome Sequencing Project (asthma) (phs000422), NHLBI GO-ESP: Lung Cohorts Exome Sequencing Project (COPDGene) (phs000296), GO-ESP: Family Studies (thoracic aortic aneurysms leading to acute aortic dissections) (phs000347), NHLBI TOPMed: Genomic Activities such as Whole Genome Sequencing and Related Phenotypes in the Framingham Heart Study (phs000974), NHLBI TOPMed: Genetics of Cardiometabolic Health in the Amish (phs000956), NHLBI TOPMed: Genetic Epidemiology of COPD (COPDGene) (phs000951), NHLBI TOPMed: The Vanderbilt Atrial Fibrillation Registry (VU_AF) (phs001032), NHLBI TOPMed: Cleveland Clinic Atrial Fibrillation (CCAF) Study (phs001189), NHLBI TOPMed: Partners HealthCare Biobank (phs001024), NHLBI TOPMed—NHGRI CCDG: Massachusetts General Hospital (MGH) Atrial Fibrillation Study (phs001062), NHLBI TOPMed: Novel Risk Factors for the Development of Atrial Fibrillation in Women (phs001040), NHLBI TOPMed—NHGRI CCDG: The Vanderbilt AF Ablation Registry (phs000997), NHLBI TOPMed: Heart and Vascular Health Study (HVH) (phs000993), NHLBI TOPMed—NHGRI CCDG: Atherosclerosis Risk in Communities (ARIC) (phs001211), NHLBI TOPMed: The Genetics and Epidemiology of Asthma in Barbados (phs001143), NHLBI TOPMed: Women’s Health Initiative (WHI) (phs001237), NHLBI TOPMed: Whole Genome Sequencing of Venous Thromboembolism (WGS of VTE) (phs001402), and NHLBI TOPMed: Trans-Omics for Precision Medicine (TOPMed) Whole Genome Sequencing Project—Cardiovascular Health Study (phs001368). Additional data used include: GATK hg38 resource bundle (https://console.cloud.google.com/storage/browser/genomics-public-data/resources/broad/hg38/v0/), BWA–MEM GRCh38 reference genome (run ‘bwa.kit/run-gen-ref hs38DH’ from https://github.com/lh3/bwa/tree/master/bwakit), 1000 Genomes phase 3 (ftp://ftp-trace.ncbi.nih.gov/1000genomes/ftp/release/20110521), Ensembl v.105 (https://ftp.ensembl.org/pub/release-105/gtf/homo_sapiens/Homo_sapiens.GRCh38.105.gtf.gz), gnomAD v.2.1.1 (non-neuro) (https://gnomad.broadinstitute.org/variant/6-146865220-C-G?dataset=gnomad_r2_1_non_neuro), and Accelerating Medicines Partnership (AMP) program for PD (https://amp-pd.org/). Source data are provided with this paper.
Code availability
All raw sequencing data were aligned to the GRCh38 reference genome using BWA–MEM (v.2.2.1) according to the pipeline described by Regier et al. (implementation can be found via GitHub at https://github.com/maarten-k/realignment (ref. 42) and via Zenodo at 10.5281/zenodo.10963076 (ref. 43). Joint genotyping was performed using a uniform pipeline according to the GATK best practices (v. 4.2.6.1). Handling and filtering of VCF files was performed using VCFtools (v. 0.1.16), BCFtools (v. 1.9) and PLINK (v. 1.90b6.21). Ancestry was estimated using LASER (v.2.04). Variants were annotated using Ensembl (GRCh38.105), snpEff (v.5.1d) and dbNSFP (v. 4.3a). Sample and variant quality control was performed using PLINK (v. 1.90b6.21) and RVAT (v. 0.2.0), while sample relatedness was inferred using KING (v. 2.2.7). All downstream analyses were performed using custom R code (performed in R 3.6.3) that we made available in the RVAT R package (v. 0.2.0) available via GitHub at https://github.com/kennalab/rvat (ref. 53) and via Zenodo at 10.5281/zenodo.10973472 (ref. 57). Other R packages used either as dependencies of RVAT or in other analyses and visualizations are ggplot2 (v. 3.4.2), ggrepel (v. 0.9.1), dplyr (v. 1.0.7), readr (v. 2.1.1), stringr (v. 1.4.0), tidyr (v. 1.1.4), magrittr (v. 2.0.1), kinship2 (v. 1.9.6), logistf (v. 1.25.0), SKAT (v. 2.2.5), SummarizedExperiment (v. 1.16.1), S4Vectors (v. 0.24.4), GenomicRanges (v. 1.38.0), IRanges (v. 2.20.2), libraDBI (v. 1.1.3) and RSQLite (v. 2.3.1). Sequence analysis for Sanger sequencing was performed using the v.29.0 PHRED/PHRAP/Consed software suite (http://www.phrap.org/) and variations in the sequences were identified via the Polyphred v6.15 software at http://droog.gs.washington.edu/polyphred/) (ref. 54).
Competing interests
Z.K.W. serves as principal investigator (PI) or co-PI on Biohaven Pharmaceuticals, Inc. (BHV4157-206) and Vigil Neuroscience, Inc. (VGL101-01.002, VGL101-01.201, positron emission tomography tracer development protocol, Csf1r biomarker and repository project, and ultrahigh field magnetic resonance imaging in the diagnosis and management of CSF1R-related adult-onset leukoencephalopathy with axonal spheroids and pigmented glia) projects/grants. He serves as co-PI of the Mayo Clinic APDA Center for Advanced Research and as an external advisory board member for the Vigil Neuroscience, Inc., and as a consultant on neurodegenerative medical research for Eli Lilli and Company. J.H.V. reports to have sponsored research agreements with Biogen and Astra Zeneca. J.E.L. is a consultant for Illios Therapeutics, WCG Clinical and Biogen. The other authors declare no competing interests.
Footnotes
Publisher’s note Springer Nature remains neutral with regard to jurisdictional claims in published maps and institutional affiliations.
These authors contributed equally: Paul J. Hop, Dongbing Lai.
These authors jointly supervised this work: Tatiana M. Foroud, Kevin P. Kenna, John E. Landers.
A list of authors and their affiliations appears at the end of the paper.
A full list of members and their affiliations appears in the Supplementary Information.
Extended data
is available for this paper at 10.1038/s41588-024-01787-7.
Supplementary information
The online version contains supplementary material available at 10.1038/s41588-024-01787-7.
References
- 1.Blauwendraat C, Nalls MA, Singleton AB. The genetic architecture of Parkinson’s disease. Lancet Neurol. 2020;19:170–178. doi: 10.1016/S1474-4422(19)30287-X. [DOI] [PMC free article] [PubMed] [Google Scholar]
- 2.Rehm HL, et al. ClinGen—the clinical genome resource. N. Engl. J. Med. 2015;372:2235–2242. doi: 10.1056/NEJMsr1406261. [DOI] [PMC free article] [PubMed] [Google Scholar]
- 3.Waschbüsch D, et al. LRRK2 transport is regulated by its novel interacting partner Rab32. PLoS ONE. 2014;9:e111632. doi: 10.1371/journal.pone.0111632. [DOI] [PMC free article] [PubMed] [Google Scholar]
- 4.McGrath E, Waschbüsch D, Baker BM, Khan AR. LRRK2 binds to the Rab32 subfamily in a GTP-dependent manner via its armadillo domain. Small GTPases. 2021;12:133–146. doi: 10.1080/21541248.2019.1666623. [DOI] [PMC free article] [PubMed] [Google Scholar]
- 5.Berwick DC, Heaton GR, Azeggagh S, Harvey K. LRRK2 biology from structure to dysfunction: research progresses, but the themes remain the same. Mol. Neurodegener. 2019;14:49. doi: 10.1186/s13024-019-0344-2. [DOI] [PMC free article] [PubMed] [Google Scholar]
- 6.Tolosa E, Vila M, Klein C, Rascol O. LRRK2 in Parkinson disease: challenges of clinical trials. Nat. Rev. Neurol. 2020;16:97–107. doi: 10.1038/s41582-019-0301-2. [DOI] [PubMed] [Google Scholar]
- 7.Taymans J-M, et al. Perspective on the current state of the LRRK2 field. NPJ Park. Dis. 2023;9:104. doi: 10.1038/s41531-023-00544-7. [DOI] [PMC free article] [PubMed] [Google Scholar]
- 8.Shino MY, et al. Familial aggregation of Parkinson’s disease in a multiethnic community-based case-control study. Mov. Disord. 2010;25:2587–2594. doi: 10.1002/mds.23361. [DOI] [PMC free article] [PubMed] [Google Scholar]
- 9.Farlow JL, et al. Whole-exome sequencing in familial Parkinson disease. JAMA Neurol. 2016;73:68. doi: 10.1001/jamaneurol.2015.3266. [DOI] [PMC free article] [PubMed] [Google Scholar]
- 10.Hernandez DG, Reed X, Singleton AB. Genetics in Parkinson disease: Mendelian versus non-Mendelian inheritance. J. Neurochem. 2016;139:59–74. doi: 10.1111/jnc.13593. [DOI] [PMC free article] [PubMed] [Google Scholar]
- 11.Jankovic J, Tan EK. Parkinson’s disease: etiopathogenesis and treatment. J. Neurol. Neurosurg. Psychiatry. 2020;91:795–808. doi: 10.1136/jnnp-2019-322338. [DOI] [PubMed] [Google Scholar]
- 12.Bandres-Ciga S, Diez-Fairen M, Kim JJ, Singleton AB. Genetics of Parkinson’s disease: an introspection of its journey towards precision medicine. Neurobiol. Dis. 2020;137:104782. doi: 10.1016/j.nbd.2020.104782. [DOI] [PMC free article] [PubMed] [Google Scholar]
- 13.Parkinson’s disease gene curation expert panel. ClinGenhttps://clinicalgenome.org/affiliation/40079/ (2024).
- 14.Povysil G, et al. Rare-variant collapsing analyses for complex traits: guidelines and applications. Nat. Rev. Genet. 2019;20:747–759. doi: 10.1038/s41576-019-0177-4. [DOI] [PubMed] [Google Scholar]
- 15.Makarious MB, et al. Large-scale rare variant burden testing in Parkinson’s disease. Brain. 2023;146:4622–4632. doi: 10.1093/brain/awad214. [DOI] [PMC free article] [PubMed] [Google Scholar]
- 16.Smith BN, et al. Exome-wide rare variant analysis identifies TUBA4A mutations associated with familial ALS. Neuron. 2014;84:324–331. doi: 10.1016/j.neuron.2014.09.027. [DOI] [PMC free article] [PubMed] [Google Scholar]
- 17.Kenna KP, et al. NEK1 variants confer susceptibility to amyotrophic lateral sclerosis. Nat. Genet. 2016;48:1037–1042. doi: 10.1038/ng.3626. [DOI] [PMC free article] [PubMed] [Google Scholar]
- 18.Nicolas A, et al. Genome-wide analyses identify KIF5A as a novel ALS gene. Neuron. 2018;97:1268–1283. doi: 10.1016/j.neuron.2018.02.027. [DOI] [PMC free article] [PubMed] [Google Scholar]
- 19.Van der Auwera, G. D. & O’Connor, B. D. Genomics in the Cloud: Using Docker, GATK, and WDL in Terra (O’Reilly Media, Inc., 2020).
- 20.Firth D. Bias reduction of maximum likelihood estimates. Biometrika. 1993;80:27–38. [Google Scholar]
- 21.Zhao Z, et al. UK Biobank whole-exome sequence binary phenome analysis with robust region-based rare-variant test. Am. J. Hum. Genet. 2020;106:3–12. doi: 10.1016/j.ajhg.2019.11.012. [DOI] [PMC free article] [PubMed] [Google Scholar]
- 22.Liu Y, et al. ACAT: a fast and powerful P value combination method for rare-variant analysis in sequencing studies. Am. J. Hum. Genet. 2019;104:410–421. doi: 10.1016/j.ajhg.2019.01.002. [DOI] [PMC free article] [PubMed] [Google Scholar]
- 23.Genome Aggregation Database Consortium et al. The mutational constraint spectrum quantified from variation in 141,456 humans. Nature. 2020;581:434–443. doi: 10.1038/s41586-020-2308-7. [DOI] [PMC free article] [PubMed] [Google Scholar]
- 24.Lara Ordóñez AJ, Fasiczka R, Naaldijk Y, Hilfiker S. Rab GTPases in Parkinson’s disease: a primer. Essays Biochem. 2021;65:961–974. doi: 10.1042/EBC20210016. [DOI] [PMC free article] [PubMed] [Google Scholar]
- 25.Steger M, et al. Systematic proteomic analysis of LRRK2-mediated Rab GTPase phosphorylation establishes a connection to ciliogenesis. eLife. 2017;6:e31012. doi: 10.7554/eLife.31012. [DOI] [PMC free article] [PubMed] [Google Scholar]
- 26.Purlyte E, et al. Rab29 activation of the Parkinson’s disease-associated LRRK2 kinase. EMBO J. 2018;37:1–18. doi: 10.15252/embj.201798099. [DOI] [PMC free article] [PubMed] [Google Scholar]
- 27.Di Maio R, et al. LRRK2 activation in idiopathic Parkinson’s disease. Sci. Transl. Med. 2018;10:eaar5429. doi: 10.1126/scitranslmed.aar5429. [DOI] [PMC free article] [PubMed] [Google Scholar]
- 28.Kalogeropulou AF, et al. Impact of 100 LRRK2 variants linked to Parkinson’s disease on kinase activity and microtubule binding. Biochem. J. 2022;479:1759–1783. doi: 10.1042/BCJ20220161. [DOI] [PMC free article] [PubMed] [Google Scholar]
- 29.Sheng Z, et al. Ser1292 autophosphorylation is an indicator of LRRK2 kinase activity and contributes to the cellular effects of PD mutations. Sci. Transl. Med. 2012;4:164ra161. doi: 10.1126/scitranslmed.3004485. [DOI] [PubMed] [Google Scholar]
- 30.Fraser KB, et al. Ser(P)-1292 LRRK2 in urinary exosomes is elevated in idiopathic Parkinson’s disease. Mov. Disord. 2016;31:1543–1550. doi: 10.1002/mds.26686. [DOI] [PMC free article] [PubMed] [Google Scholar]
- 31.Zhou H, et al. Toward a comprehensive characterization of a human cancer cell phosphoproteome. J. Proteome Res. 2013;12:260–271. doi: 10.1021/pr300630k. [DOI] [PubMed] [Google Scholar]
- 32.Zhu H, et al. Rab29-dependent asymmetrical activation of leucine-rich repeat kinase 2. Science. 2023;382:1404–1411. doi: 10.1126/science.adi9926. [DOI] [PMC free article] [PubMed] [Google Scholar]
- 33.Gustavsson, E. K. et al. RAB32 Ser71Arg in autosomal dominant Parkinson’s disease: linkage, association, and functional analyses. Lancet Neurol.23, 603–614 (2024). [DOI] [PMC free article] [PubMed]
- 34.Khan, A. R., Kecman, T. PDB entry - 6FF8. Crystal structure of uncomplexed Rab32 in the active GTP-bound state at 2.13 angstrom resolution. Protein Data Bank10.2210/pdb6ff8/pdb (2024).
- 35.Hughes AJ, Daniel SE, Kilford L, Lees AJ. Accuracy of clinical diagnosis of idiopathic Parkinson’s disease: a clinico-pathological study of 100 cases. J. Neurol. Neurosurg. Psychiatry. 1992;55:181–184. doi: 10.1136/jnnp.55.3.181. [DOI] [PMC free article] [PubMed] [Google Scholar]
- 36.Taliun D, et al. Sequencing of 53,831 diverse genomes from the NHLBI TOPMed program. Nature. 2021;590:290–299. doi: 10.1038/s41586-021-03205-y. [DOI] [PMC free article] [PubMed] [Google Scholar]
- 37.Sudlow C, et al. UK Biobank: an open access resource for identifying the causes of a wide range of complex diseases of middle and old age. PLoS Med. 2015;12:e1001779. doi: 10.1371/journal.pmed.1001779. [DOI] [PMC free article] [PubMed] [Google Scholar]
- 38.Project MinE ALS Sequencing Consortium. Project MinE: study design and pilot analyses of a large-scale whole-genome sequencing study in amyotrophic lateral sclerosis. Eur. J. Hum. Genet. 2018;26:1537–1546. doi: 10.1038/s41431-018-0177-4. [DOI] [PMC free article] [PubMed] [Google Scholar]
- 39.Tryka KA, et al. NCBI’s database of genotypes and phenotypes: dbGaP. Nucleic Acids Res. 2014;42:D975–D979. doi: 10.1093/nar/gkt1211. [DOI] [PMC free article] [PubMed] [Google Scholar]
- 40.Li H, Durbin R. Fast and accurate short read alignment with Burrows–Wheeler transform. Bioinformatics. 2009;25:1754–1760. doi: 10.1093/bioinformatics/btp324. [DOI] [PMC free article] [PubMed] [Google Scholar]
- 41.Regier AA, et al. Functional equivalence of genome sequencing analysis pipelines enables harmonized variant calling across human genetics projects. Nat. Commun. 2018;9:4038. doi: 10.1038/s41467-018-06159-4. [DOI] [PMC free article] [PubMed] [Google Scholar]
- 42.realignment. GitHubhttps://github.com/maarten-k/realignment (2023).
- 43.Kooyman, M. maarten-k/realignment: pipeline for exome and WGS(DF3) pipeline. Zenodo10.5281/zenodo.10963076 (2024).
- 44.Cingolani P, et al. A program for annotating and predicting the effects of single nucleotide polymorphisms, SnpEff: SNPs in the genome of Drosophila melanogaster strain w1118; iso-2; iso-3. Fly. 2012;6:80–92. doi: 10.4161/fly.19695. [DOI] [PMC free article] [PubMed] [Google Scholar]
- 45.Jian X, Boerwinkle E, Liu X. In silico prediction of splice-altering single nucleotide variants in the human genome. Nucleic Acids Res. 2014;42:13534–13544. doi: 10.1093/nar/gku1206. [DOI] [PMC free article] [PubMed] [Google Scholar]
- 46.Zerbino DR, et al. Ensembl 2018. Nucleic Acids Res. 2018;46:D754–D761. doi: 10.1093/nar/gkx1098. [DOI] [PMC free article] [PubMed] [Google Scholar]
- 47.Wang C, Zhan X, Liang L, Abecasis GR, Lin X. Improved ancestry estimation for both genotyping and sequencing data using projection procrustes analysis and genotype imputation. Am. J. Hum. Genet. 2015;96:926–937. doi: 10.1016/j.ajhg.2015.04.018. [DOI] [PMC free article] [PubMed] [Google Scholar]
- 48.Anderson CA, et al. Data quality control in genetic case–control association studies. Nat. Protoc. 2010;5:1564–1573. doi: 10.1038/nprot.2010.116. [DOI] [PMC free article] [PubMed] [Google Scholar]
- 49.Manichaikul A, et al. Robust relationship inference in genome-wide association studies. Bioinformatics. 2010;26:2867–2873. doi: 10.1093/bioinformatics/btq559. [DOI] [PMC free article] [PubMed] [Google Scholar]
- 50.Galinsky KJ, et al. Fast principal component analysis reveals convergent evolution of ADH1B in Europe and East Asia. Am. J. Hum. Genet. 2016;98:456–472. doi: 10.1016/j.ajhg.2015.12.022. [DOI] [PMC free article] [PubMed] [Google Scholar]
- 51.Browning BL, Tian X, Zhou Y, Browning SR. Fast two-stage phasing of large-scale sequence data. Am. J. Hum. Genet. 2021;108:1880–1890. doi: 10.1016/j.ajhg.2021.08.005. [DOI] [PMC free article] [PubMed] [Google Scholar]
- 52.Wu MC, et al. Rare-variant association testing for sequencing data with the sequence kernel association test. Am. J. Hum. Genet. 2011;89:82–93. doi: 10.1016/j.ajhg.2011.05.029. [DOI] [PMC free article] [PubMed] [Google Scholar]
- 53.Hop, P. J. & Kenna, K. P. RVAT: rare variant association toolkit. GitHubhttps://github.com/kennalab/rvat (2024).
- 54.Nickerson DA, Tobe VO, Taylor SL. PolyPhred: automating the detection and genotyping of single nucleotide substitutions using fluorescence-based resequencing. Nucleic Acids Res. 1997;25:2745–2751. doi: 10.1093/nar/25.14.2745. [DOI] [PMC free article] [PubMed] [Google Scholar]
- 55.Singh G, Ricci EP, Moore MJ. RIPiT-seq: a high-throughput approach for footprinting RNA:protein complexes. Methods. 2014;65:320–332. doi: 10.1016/j.ymeth.2013.09.013. [DOI] [PMC free article] [PubMed] [Google Scholar]
- 56.Baron DM, et al. ALS-associated KIF5A mutations abolish autoinhibition resulting in a toxic gain of function. Cell Rep. 2022;39:110598. doi: 10.1016/j.celrep.2022.110598. [DOI] [PMC free article] [PubMed] [Google Scholar]
- 57.KennaLab/rvat: v.2.09. Zenodo10.5281/zenodo.10973472 (2024).
Associated Data
This section collects any data citations, data availability statements, or supplementary materials included in this article.
Supplementary Materials
Supplementary Tables 1 and 2, Figs. 1 and 2, and Note.
Summary statistics for all gene-based association analyses.
Summary statistics for all single variant analyses.
Uncropped western blots.
Uncropped western blots.
Data Availability Statement
Exome sequencing data from the case-cohort is available under dbGaP study phs001004 or are available via the corresponding author subject to the data sharing terms of the respective cohorts. Project MinE data are available upon request (https://www.projectmine.com/research/data-sharing/). dbGAP datasets used are available under the following accession numbers: Alzheimer’s Disease Sequencing Project (ADSP) (phs000572), Autism Sequencing Consortium (ASC) (phs000298), Sweden-Schizophrenia Population-Based Case–Control Exome Sequencing (phs000473), Inflammatory Bowel Disease Exome Sequencing Study (phs001076), Myocardial Infarction Genetics Exome Sequencing Consortium: Ottawa Heart Study (phs000806), Myocardial Infarction Genetics Exome Sequencing Consortium: Malmo Diet and Cancer Study (phs001101), Myocardial Infarction Genetics Exome Sequencing Consortium: University of Leicester (phs001000), Myocardial Infarction Genetics Exome Sequencing Consortium: Italian Atherosclerosis Thrombosis and Vascular Biology (phs000814), NHLBI GO-ESP: Women’s Health Initiative Exome Sequencing Project (WHI)—WHISP (phs000281), Building on GWAS for NHLBI diseases: the US CHARGE Consortium (CHARGE-S)—CHS (phs000667), Building on GWAS for NHLBI Diseases: the US CHARGE Consortium (CHARGE-S)—ARIC (phs000668), Building on GWAS for NHLBI diseases: the US CHARGE Consortium (CHARGE-S)—FHS (phs000651), NHLBI GO-ESP Family Studies: Idiopathic Bronchiectasis (phs000518), NHLBI GO-ESP: Family Studies (Hematological Cancers) (phs000632), NHLBI GO-ESP: Family Studies (familial atrial fibrillation) (phs000362), NHLBI GO-ESP: Heart Cohorts Exome Sequencing Project (ARIC) (phs000398), NHLBI GO-ESP: Heart Cohorts Exome Sequencing Project (CHS) (phs000400), NHLBI GO-ESP: Heart Cohorts Exome Sequencing Project (FHS) (phs000401), NHLBI GO-ESP: Lung Cohorts Exome Sequencing Project (asthma) (phs000422), NHLBI GO-ESP: Lung Cohorts Exome Sequencing Project (COPDGene) (phs000296), GO-ESP: Family Studies (thoracic aortic aneurysms leading to acute aortic dissections) (phs000347), NHLBI TOPMed: Genomic Activities such as Whole Genome Sequencing and Related Phenotypes in the Framingham Heart Study (phs000974), NHLBI TOPMed: Genetics of Cardiometabolic Health in the Amish (phs000956), NHLBI TOPMed: Genetic Epidemiology of COPD (COPDGene) (phs000951), NHLBI TOPMed: The Vanderbilt Atrial Fibrillation Registry (VU_AF) (phs001032), NHLBI TOPMed: Cleveland Clinic Atrial Fibrillation (CCAF) Study (phs001189), NHLBI TOPMed: Partners HealthCare Biobank (phs001024), NHLBI TOPMed—NHGRI CCDG: Massachusetts General Hospital (MGH) Atrial Fibrillation Study (phs001062), NHLBI TOPMed: Novel Risk Factors for the Development of Atrial Fibrillation in Women (phs001040), NHLBI TOPMed—NHGRI CCDG: The Vanderbilt AF Ablation Registry (phs000997), NHLBI TOPMed: Heart and Vascular Health Study (HVH) (phs000993), NHLBI TOPMed—NHGRI CCDG: Atherosclerosis Risk in Communities (ARIC) (phs001211), NHLBI TOPMed: The Genetics and Epidemiology of Asthma in Barbados (phs001143), NHLBI TOPMed: Women’s Health Initiative (WHI) (phs001237), NHLBI TOPMed: Whole Genome Sequencing of Venous Thromboembolism (WGS of VTE) (phs001402), and NHLBI TOPMed: Trans-Omics for Precision Medicine (TOPMed) Whole Genome Sequencing Project—Cardiovascular Health Study (phs001368). Additional data used include: GATK hg38 resource bundle (https://console.cloud.google.com/storage/browser/genomics-public-data/resources/broad/hg38/v0/), BWA–MEM GRCh38 reference genome (run ‘bwa.kit/run-gen-ref hs38DH’ from https://github.com/lh3/bwa/tree/master/bwakit), 1000 Genomes phase 3 (ftp://ftp-trace.ncbi.nih.gov/1000genomes/ftp/release/20110521), Ensembl v.105 (https://ftp.ensembl.org/pub/release-105/gtf/homo_sapiens/Homo_sapiens.GRCh38.105.gtf.gz), gnomAD v.2.1.1 (non-neuro) (https://gnomad.broadinstitute.org/variant/6-146865220-C-G?dataset=gnomad_r2_1_non_neuro), and Accelerating Medicines Partnership (AMP) program for PD (https://amp-pd.org/). Source data are provided with this paper.
All raw sequencing data were aligned to the GRCh38 reference genome using BWA–MEM (v.2.2.1) according to the pipeline described by Regier et al. (implementation can be found via GitHub at https://github.com/maarten-k/realignment (ref. 42) and via Zenodo at 10.5281/zenodo.10963076 (ref. 43). Joint genotyping was performed using a uniform pipeline according to the GATK best practices (v. 4.2.6.1). Handling and filtering of VCF files was performed using VCFtools (v. 0.1.16), BCFtools (v. 1.9) and PLINK (v. 1.90b6.21). Ancestry was estimated using LASER (v.2.04). Variants were annotated using Ensembl (GRCh38.105), snpEff (v.5.1d) and dbNSFP (v. 4.3a). Sample and variant quality control was performed using PLINK (v. 1.90b6.21) and RVAT (v. 0.2.0), while sample relatedness was inferred using KING (v. 2.2.7). All downstream analyses were performed using custom R code (performed in R 3.6.3) that we made available in the RVAT R package (v. 0.2.0) available via GitHub at https://github.com/kennalab/rvat (ref. 53) and via Zenodo at 10.5281/zenodo.10973472 (ref. 57). Other R packages used either as dependencies of RVAT or in other analyses and visualizations are ggplot2 (v. 3.4.2), ggrepel (v. 0.9.1), dplyr (v. 1.0.7), readr (v. 2.1.1), stringr (v. 1.4.0), tidyr (v. 1.1.4), magrittr (v. 2.0.1), kinship2 (v. 1.9.6), logistf (v. 1.25.0), SKAT (v. 2.2.5), SummarizedExperiment (v. 1.16.1), S4Vectors (v. 0.24.4), GenomicRanges (v. 1.38.0), IRanges (v. 2.20.2), libraDBI (v. 1.1.3) and RSQLite (v. 2.3.1). Sequence analysis for Sanger sequencing was performed using the v.29.0 PHRED/PHRAP/Consed software suite (http://www.phrap.org/) and variations in the sequences were identified via the Polyphred v6.15 software at http://droog.gs.washington.edu/polyphred/) (ref. 54).


