

Abstract
Objective
To investigate primary care practice ownership and specialist‐use patterns for commercially insured children with disabilities.
Data Sources and Study Setting
A national commercial claims database and the Health Systems and Provider Database from 2012 to 2016 are the data sources for this study.
Study Design
This cross‐sectional, descriptive study examines: (1) the most visited type of pediatric primary care physician and practice (independent or system‐owned); (2) pediatric and non‐pediatric specialist‐use patterns; and (3) how practice ownership relates to specialist‐use patterns.
Data Collection/Extraction Methods
This study identifies 133,749 person‐years of commercially insured children with disabilities aged 0–18 years with at least 24 months of continuous insurance coverage by linking a national commercial claims data set with the Health Systems and Provider Database and applying the validated Children with Disabilities Algorithm.
Principal Findings
Three‐quarters (75.9%) of children with disabilities received their pediatric primary care in independent practices. Nearly two thirds (59.6%) used at least one specialist with 45.1% using nonpediatric specialists, 28.8% using pediatric ones, and 17.0% using both. Specialist‐use patterns varied by both child age and specialist type. Children with disabilities in independent practices were as likely to see a specialist as those in system‐owned ones: 57.1% (95% confidence interval [95% CI] 56.7%–57.4%) versus 57.3% (95% CI 56.6%–58.0%), respectively (p = 0.635). The percent using two or more types of specialists was 46.1% (95% CI 45.4%–46.7%) in independent practices, comparable to that in systems 47.1% (95% CI 46.2%–48.0%) (p = 0.054). However, the mean number of specialist visits was significantly lower in independent practices than in systems—4.0 (95% CI 3.9%–4.0%) versus 4.4 (95% CI 4.3%–4.6%) respectively—reaching statistical significance with p < 0.0001.
Conclusions
Recognizing how privately insured children with disabilities use pediatric primary care from pediatric and nonpediatric primary care specialists through both independent and system‐owned practices is important for improving care quality and value.
Keywords: disability, health care organizations and systems, primary care
What is known on this topic
Children with disabilities face difficulties accessing specialist care.
Little is known about how the systems may impact specialist‐use patterns among children with disabilities relative to independent practices.
What this study adds
For those who deliver frontline care coordination or provide population management support, this study illustrates the range of pediatric and nonpediatric specialists caring for privately insured children with disabilities.
For policy makers interested in how different types of health care organizations perform, this study finds that independent practices and health care systems perform comparably.
1. INTRODUCTION
Children with disabilities have functional impairments that are lifelong and can be life‐limiting. Children with disabilities have long‐term functional impairments that interact with the environment to limit their ability to learn, communicate, move, and care for themselves and to fully participate in home, school, and community activites. 1 , 2 , 3 , 4 , 5 On average, children with disabilities die 20 years earlier than their nondisabled counterparts (their mortality rates comparable to that of survivors of childhood cancer). 4 , 5 , 6 , 7 , 8 , 9 , 10
Nearly half of children with disabilities are insured by private health plans and privately insured children with disabilities use all types of health care—primary care physicians (PCPs), specialists, and hospitals—at higher rates than their nondisabled counterparts. 4 , 5 , 6 , 7 , 8 , 9 , 10 Strategic and thoughtful collaboration between primary care and specialists is thought to be necessary to establish diagnoses, manage primary and comorbid conditions and exacerbations, arrange for specialized therapy or equipment, and gain community‐based supports (e.g., behavioral therapy in the educational setting). 11 , 12 Surveys have highlighted how difficult it is for children with disabilities to gain access to specialists, but far more needs to be understood about the types, frequency, and nature of specialist involvement, particularly the involvement of nonpediatric specialists given how pediatric specialists tend to be located in urban centers. 13 Understanding the patterns by which children with disabilities use specialists is also a necessary preliminary step toward establishing how primary care–specialist collaborations may affect outcomes and quality of life for this at‐risk population.
Now may be a particularly fruitful time to examine how care for privately insured children with disabilities proceeds, either within independently owned practices or in systems—health care organizations that financially integrate inpatient and outpatient services. To our knowledge, only one 2016 industry market survey has attempted to capture the trend away from independent practice in pediatrics and toward systems—it suggested that one third (36.5%) of all pediatricians worked in systems. 14 , 15 , 16 , 17 , 18 , 19 Systems are thought to be the type of organization most able to take on accountable care organization contracts, and these types of contract have been introduced since 2009. 20 , 21 However, a precursor to being able to assess care quality and value generally and for pediatric and nonpediatric specialist use for children with disabilities is to be able to understand their basic utilization patterns.
By combining the recently developed and validated children with disabilities algorithm (CWDA) 3 and with novel methods for identifying whether practices are owned as independents or belong to systems, 22 we describe the types of physicians and practices that children with disabilities visit over the course of an average year with a special eye toward their use of specialists, pediatric, and nonpediatric. Our main a priori hypothesis was that, for a national population of commercially insured children with disabilities, use of nonpediatric specialists would outnumber pediatric ones simply because the nonpediatric specialist workforce is larger and less geographically concentrated. 13 , 23 , 24 , 25 Because there is such a paucity of information on how pediatric‐serving practices are owned, we had no a priori hypothesis related to how practice ownership would be related to specialists use among children with disabilities except that both positive and negative effects could occur.
Understanding how children with disabilities use health care would be valuable for designing health care system interventions and anticipating the impact of value‐based purchasing programs on pediatric practices. 20 , 21 , 26 , 27 General pediatricians in independent practices have formed the bedrock of pediatric primary care for decades, but may be giving way to health care systems. 14 , 15 , 16 , 17 , 28 Health care systems are expected to outperform independent practices because financial integration is expected to deliver greater clinical integration 29 and enhance organizations' ability to take on value‐based purchasing contracts, but health care systems may not deliver on this dual promise if they fail to foster meaningful primary care–specialist relationships, overly constrain specialist or hospital choice, or overlook populations that are medically and socially complex. 30 , 31
2. METHODS
2.1. Study design and population
This is a cross‐sectional, descriptive study of 133,749 person‐years of commercially insured data from 89,987 unique 0‐ to 18‐year‐olds with disabilities between January 1, 2012, and December 31, 2016. This study population was identified from 3,131,954 person‐years of data on 1,774,948 unique 0‐ to 18‐year‐old enrollees who were insured for at least 24 months. 32 Children with disabilities were identified the validated CWDA. 1 , 2 , 3 Conceptually, our study team considers a disabling health condition to affect the whole person and therefore all the health care that they use. This study was approved by the Institutional Review Boards of Boston Children's Hospital, the National Bureau of Economic Research (NBER), and Harvard Medical School.
2.2. Data sources
This study required a linkage between a large, commercial insurance database (LCD) from a single insurer and the newly developed Health Systems and Provider Database (HSPD) in the years 2012–2016. The LCD supplied enrollee characteristics and claims for outpatient, inpatient, and pharmacy services and the provider information necessary to characterize physician specialties and to identify the taxpayer identification numbers to which physicians most frequently billed. The HSPD was developed by the NBER's Center of Excellence on Comparative Health Systems with funding from the Agency for Healthcare Research and Quality (AHRQ); an account of its development is published elsewhere. 22 The HSPD is considered a near census of all physicians, practices, hospitals, and systems in the United States. The HSPD provided the information needed to apply a national definition of system ownership and the component information needed to characterize practices according to their workforce composition (generalists and specialists, pediatric and non‐pediatric). HSPD variables were connected to the LCD via taxpayer identification numbers.
2.3. Attribution of children with disabilities to primary care practices
Care delivered to children with disabilities was conceived of as an ongoing mix of well‐, acute, and chronic disease care across PCPs and specialists. Children began to be observed in the month/year that they began to be enrolled in the LCD. Based on the fact that nearly all (99.5%) of the children made at least one visit to a PCP within a person‐year, that the mean number of visits made to generalists in any year was 7.4 (standard deviation [SD] 6.2), and that the proportion of visits made to generalists outweighs the proportion made to specialists across all age bands (Supplement A), children with disabilities were attributed to the PCP practice that they visited most within a given year using standard methods 33 ; these are the patients for which practices would be financially responsible in value‐based purchasing contracts. Attribution involves enumerating the total number of evaluation and management physician visits made across each person‐year and ultimately identifying the practice that delivered the greatest number of primary care physician (e.g., pediatric, family medicine, medicine‐pediatrics, or general internist) visits for each person‐year.
This process includes connecting enrollees to the physician specialty delivering care using insurer‐coded information, which is a mandatory part of billing. Specialist care can take place at any point during the person‐year. Care delivered by allied health professionals (e.g., nurse practitioners, physician assistants) were excluded from physician counts because the roles of these health care professionals (e.g., supportive or substituting for physician care) and their specialization (e.g., primary or specialty care) could not be determined from their professional information; the volume of visits delivered by such professionals was ~7% of visits.
2.4. Primary care practice ownership: independent versus system
Practices were classified as independent unless they had a parent organization that conformed to the NBER's definition of a system (i.e., a group of commonly owned providers that includes at least 50 physicians, 10 primary care physicians, and one general acute care hospital) on June 30 of the observed year, 22 in which case, they were considered to be system‐owned.
2.5. Specialist‐use patterns
The type of specialist seeing children with disabilities was determined by taking the specialty information embedded in the claims data and cross‐walking it against the Physician Taxonomy file of the HSPD, a file that (a) contains physician data from five sources, each of which had between 3 and 14 fields of information describing each physician (i.e., the National Plan and Provider Enumeration System [which also reflects our National Provider Identification system], Medicare Data on Provider Practice and Specialty, the Centers for Medicare and Medicaid Services Physician Compare file, IQVIA's market database, and the LCD's provider file); (b) mirrors the certification structure of the American Board of Medical Specialties; (c) allows for physicians mapped to their highest level of specialization (e.g., general pediatric + infectious disease = pediatric infectious disease). Ultimately, each of the over 950,000 unique physicians collected in the HSPD database was mapped to 1 of 123 terminal specialties per the American Board of Medical Specialties training paths, and we triangulated the physician counts within the HSPD against the American Board of Medical Specialties' own 10‐year and Ever counts.
After attributing each child to the practice that they visited most for primary care, we examined all specialty visits across each person‐year, calculating specialty‐use rates across a total of 73 board‐certified specialty types, 53 of which comprised specialties with pediatric and nonpediatric versions (e.g., pediatric versus nonpediatric allergy and immunology), 6 that were undifferentiated and of which there was only a pediatric version (e.g., child abuse pediatrics), 14 that were undifferentiated, and of which there was only the nonpediatric version (e.g., toxicology). We were unable to include allied health professionals because our data sources were not detailed enough to differentiate providers according to generalist, specialist, pediatric, nonpediatric, and independent versus ancillary categories.
After examining the range of specialists used, we expressed per‐person specialist‐use patterns for each person‐year based on: (a) whether any specialist was used at all; then, if specialists were used, (b) the total number of specialist types involved (ultimately dichotomizing the distribution to be greater than or equal to two or not based on the overall distribution); and (c) the total number of specialist visits made. Then we examined the relationship between practice ownership and overall yearly rates of specialty use, adjusting for patient clinical and demographic characteristics (e.g., the number of comorbid conditions inclusive of the disabling condition), practice characteristics (e.g., whether specialists worked in the same practice as primary care physicians), area supply of specialists (e.g., county supply), and health care referral regions (HRRs), an area‐based measure that represents tertiary medical care that occurs in specific regions of the United States where there is at least one hospital performing major procedures for adults; there is no corollary for pediatric care. 34 We also examined this association for those who were seeing pediatric specialists, nonpediatric specialists, or both within a given year.
2.6. Statistical analysis
We used descriptive statistics to illustrate how frequently children were attributed to practices and used specialists. After attribution, we used logistic and linear regression models to examine the relationship between primary care practice ownership and specialty‐use patterns. We ran separate models for each type of specialist use. In all models, we adjust for child clinical, insurance, and demographic covariates: age as dummies given the well‐documented nonlinear relationship between age, utilization, and type of specialist likely being used as child ages; sex per administrative data; number of functional impairments up to a maximum of five (physical, sensory, intellectual, developmental, psychiatric) 3 ; body system involvement via AHRQ's Chronic Condition Indicator (CCI) 35 ; rurality; census region; and home ZIP Code poverty level. 36 We included a variable measuring the local supply of health care providers computed at the county level (i.e., total number of pediatric specialists per 10,000 children; total number of non‐pediatric specialists per 10,000 people overall). We included fixed effects for calendar year and for HRRs and adjusted our standard errors for clustering within HRRs. For ease of interpretation, we present the adjusted marginal percentages while setting control variables equal to their mean.
3. RESULTS
3.1. Study population
The prevalence of childhood‐onset disability within this study population was 5.1%, and this equates to 133,749 person‐years. Of the 133,749 child‐years of disability identified, two thirds (63.9%) were documented as male, nearly half (46.0%) had a single impairment (most frequently an intellectual or developmental disability), while 42.0% had two different types of impairments (intellectual or developmental with psychiatric was most frequent), and the remaining 12.0% had three to five different types of impairments (Table 1). Of note, when applying AHRQ's CCIs to this population, we observed that one‐quarter (24.9%) of the population lacked any chronic condition at all, when conceptually one would expect the disabling health condition to also be considered a chronic condition in alternate coding schema (Supplement for frequency of disability‐qualifying diagnoses).
TABLE 1.
Characteristics of commercially insured children with disabilities. a
| Person‐years b | ||
|---|---|---|
| N | % | |
| Totals | 133,749 | 100.0 |
| Clinical characteristics | ||
| Age bands in years | ||
| 0–1 | 8733 | 6.5 |
| 2–3 | 20,521 | 15.3 |
| 4–5 | 17,233 | 12.9 |
| 6–7 | 15,498 | 11.6 |
| 8–9 | 14,560 | 10.9 |
| 10–11 | 13,419 | 10.0 |
| 12–13 | 12,654 | 9.5 |
| 14–15 | 12,632 | 9.4 |
| 16–17 | 12,626 | 9.4 |
| 18 | 5873 | 4.4 |
| Male per documented sex | 85,496 | 63.9 |
| Number of impairment types (physical, sensory, intellectual, developmental, or psychiatric) | ||
| 1 minimum | 61,462 | 46.0 |
| 2 | 56,206 | 42.0 |
| 3 | 11,629 | 8.7 |
| 4 | 3624 | 2.7 |
| 5 maximum | 828 | 0.6 |
| Chronic Condition Index 35 | ||
| 0 | 33,338 | 24.9 |
| 1 | 46,049 | 34.4 |
| 2 | 30,170 | 22.6 |
| 3 | 14,418 | 10.8 |
| 4 | 5848 | 4.37 |
| 5 or more (maximum reached = 13) | 3926 | 2.93 |
| Insurance coverage characteristics | ||
| Beneficiary type | ||
| Youth dependent | 133,640 | 99.9 |
| Adult dependent or other | 109 | 0.1 |
| Enrollment span | ||
| 49+ months | 65,218 | 48.8 |
| 37–48 months | 28,274 | 21.1 |
| 24–36 months | 40,257 | 30.1 |
| Insurance product c | ||
| PPO/POS | 114,603 | 85.7 |
| HMO | 5863 | 4.4 |
| Other | 13,283 | 9.9 |
| Percent living in an area… d , 36 | ||
| U.S. Census Region | ||
| South | 47,657 | 35.6 |
| Northeast | 41,816 | 31.3 |
| West | 26,003 | 19.4 |
| Midwest | 18,273 | 13.7 |
| Where more than 20% of residents live above the Federal Poverty Limit | 119,266 | 89.2 |
| Urbanicity | ||
| Suburban | 66,428 | 49.7 |
| Urban | 62,967 | 47.1 |
| Rural | 4354 | 3.3 |
Identification of children with disabilities was based on an initial 24 months of continuous insurance. 32
133,749 person‐years corresponds to 89,987 unique persons.
In preferred provider organization plans, primary care providers are not required to direct care, and enrollees typically pay some out‐of‐pocket amounts for the care they seek. In point of service plans and health maintenance organizations plans, primary care providers typically direct care within a designated network and patient out‐of‐pocket costs rise if patients seek care out of network.
Geocoded based on home ZIP Code.
Children were almost universally dependent on parental coverage (99.9%), nearly half (48.8%) were insured for 49 or more continuous months, and most (85.7%) were enrolled in either preferred provider organization (PPO) or provider of service (POS) insurance plans. Geographically, the study sample represented all four census regions of the United States. Most (89.2%) lived in ZIP Code where less than 20% of the population had household incomes below the federal poverty limit; 49.7% lived in suburban areas while 47.1% lived in urban ones.
3.2. Primary care practice attribution
On average within a year, general pediatricians were visited most by children with disabilities in 81.4% of cases, followed by family practitioners 18.6% of the time (Table 2). The average number of visits to any primary care provider in a year was 7.4 (SD 6.2). Three‐quarters (75.9%) of children with disabilities received care in independent practices and one‐quarter (24.1%) in system‐owned practices.
TABLE 2.
Characteristics of most visited pediatric primary care physicians and practices among children with disabilities. a
| Type of practice ownership | N | % | Type of primary care physician | ||||
|---|---|---|---|---|---|---|---|
| General pediatricians | Nonpediatrician generalists b | ||||||
| N | % | N | % | ||||
| 133,749 | 100.0 | 108,882 | 81.4 | 24,867 | 18.6 | ||
| Independent | 101,572 | 75.9 | Column % | 85,464 | 78.5 | 16,108 | 64.8 |
| Row % | 84.1 | 15.9 | |||||
| Cell % | 63.9 | 12.0 | |||||
| System | 32,177 | 24.1 | Column % | 23,418 | 21.5 | 8759 | 35.2 |
| Row % | 72.8 | 27.2 | |||||
| Cell % | 17.5 | 6.5 | |||||
Supplement A illustrates these attribution patterns by age band.
Mostly family practitioners, but also includes medicine‐pediatrics physicians and general internists.
3.3. Pediatric and nonpediatric specialist‐use patterns differ by age and specialist type
For seven specialty types frequented in the outpatient setting, children with disabilities used the pediatric version far more frequently than the nonpediatric version (cardiology; endocrine; gastroenterology; nephrology; neurology; pulmonology; rheumatology) (Figure 1). For 10 specialty types, children with disabilities use the nonpediatric version far more frequently (allergy; dermatology; ophthalmology; orthopedics; palliative care; physical medicine and rehabilitation; psychiatry; sports medicine, surgery; urology). For one specialty type (infectious disease), children used the pediatric and nonpediatric versions about equally (Supplement B for specialists for which there was zero utilization or who serve mainly in secondary or hospital‐based roles and for single‐scaled version of Figure 1).
FIGURE 1.
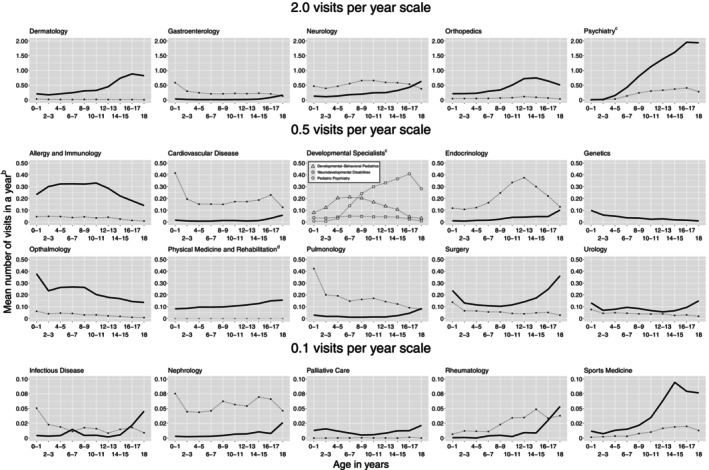
Mean number of specialist visits to selected specialists among commercially insured children with disabilities, aged 0–18.a Thin dashed line corresponds to pediatric specialists, thick solid line corresponds to nonpediatric specialists. Y‐axis scale varies between panels to facilitate viewing patterns by age. aList of nonpictured specialists available in Supplement. bAmong those with any specialist use. cPediatric psychiatry appears twice, with other developmental specialists and with nonpediatric psychiatry. dGray line indicates 0 visits at all ages (pediatric physical medicine and rehabilitation).
3.4. Overall specialist‐use patterns
On average in each year, 59.6% of children used at least one specialist (Table 3). Among children with disabilities accessing specialists, the mean number of different specialty types used was 1.9 (SD 1.3) such that 48.8% of children with disabilities used two or more different specialty types. The mean number of specialist visits within a year was 4.3 (SD 5.9).
TABLE 3.
Specialty‐use patterns for commercially insured children with disabilities.
| (i) Any use within a year a | Given use | ||||||
|---|---|---|---|---|---|---|---|
| (ii) Total number of specialist types used | (iii) Whether two or more types of specialists were used b | (iv) Total number of specialist visits made | |||||
| Mean | SD | Mean | SD | ||||
| Any specialist use, pediatric or nonpediatric use | |||||||
| N = 79,727 | 59.6% | 1.9 | 1.3 | N = 38,872 | 48.8% | 4.3 | 5.9 |
| Sub‐groups c | |||||||
| Those using pediatric specialists | |||||||
| N = 38,451 | 28.7% | 1.5 | 0.8 | N = 11,693 | 14.7% | 3.5 | 5.5 |
| Those using nonpediatric specialists | |||||||
| N = 64,015 | 47.9% | 1.5 | 0.9 | N = 23,092 | 29.0% | 3.3 | 4.0 |
| Those using both pediatric and nonpediatric specialists | |||||||
| N = 22,739 | 17.0% | 3.3 | 1.5 | N = 22,739 | 28.5% | 7.7 | 8.5 |
Percent of total population 133,749.
Percent of population with any specialist use.
These groups overlap and net as those with any specialist use; 59.61% = 28.75% + 47.86% − 17.00%.
The percentage of children with disabilities who used nonpediatric specialists was 47.9%, whereas 28.7% used pediatric specialists; the subset that used both pediatric and nonpediatric specialists was 17.0%. The mean number of specialist types and specialist visits made were similar between those using pediatric and nonpediatric specialists: among users of pediatric specialists, 1.5 (SD 0.8) specialist types were used and 3.5 (SD 5.5) specialist visits were made, while among users of non‐pediatric specialists, 1.5 (SD 0.9) specialist types were used and 3.3 (SD 4.0) specialist visits were made. By comparison, those who used both pediatric and nonpediatric specialists saw a mean of 3.3 (SD 1.5) specialist types and made a mean of 7.7 (SD 8.5) specialist visits.
3.5. Relationship between system‐ownership and specialty‐use patterns
Children with disabilities cared for independent practices were as likely to see a specialist as those in system‐owned practices—65.5% (95% confidence interval [95% CI] 64.8%–66.3%) versus 65.7% (95% CI 64.7%–66.8%), respectively (p = 0.764) (Table 4). There was also little difference in the percentage of children using two or more types of specialists—46.1% (95% CI 45.4%–46.7%) in independent practices and 47.1% (95% CI 46.2%–48.0%) in systems; p = 0.054. However, the mean number of specialist visits was lower in independent practices than in system‐owned practices—4.0 (95% CI 3.9%–4.0%) versus 4.4 (95% CI 4.3%–4.6%), reaching statistical significance with p < 0.0001.
TABLE 4.
Relationship between practice ownership and yearly specialty‐use patterns for children with disabilities.
| Population of children with any specialist use within a year a | Type of practice ownership | (i) Incidence of any use within a year | ||||
|---|---|---|---|---|---|---|
| Estimate | 95% confidence interval | p‐Value c | ||||
| Low | High | |||||
| Any specialist use, pediatric or nonpediatric use | ||||||
| % | 59.6% | Independent | 65.5% | 64.8% | 66.3% | 0.764 |
| N | 79,727 | System | 65.7% | 64.7% | 66.8% | |
| Subgroups d | ||||||
| Those using pediatric specialists | ||||||
| % | 28.7% | Independent | 15.7% | 14.0% | 17.7% | <0.001 |
| N | 38,451 | System | 17.0% | 15.1% | 19.1% | |
| Those using nonpediatric specialists | ||||||
| % | 47.9% | Independent | 49.1% | 48.5% | 49.7% | 0.874 |
| N | 64,015 | System | 49.0% | 47.8% | 50.2% | |
| Those using both pediatric and nonpediatric specialists d | ||||||
| % | 17.0% | Independent | 5.5% | 5.3% | 5.7% | 0.001 |
| N | 22,739 | System | 6.0% | 5.7% | 6.3% | |
| Given use within a year: | |||||||
|---|---|---|---|---|---|---|---|
| (ii) Whether two or more types of specialists were used b | (iii) Total number of specialist visits made | ||||||
| Estimate | 95% confidence interval | p‐Value c | Estimate | 95% confidence interval | p‐Value c | ||
| Low | High | Low | High | ||||
| Any specialist use, pediatric or nonpediatric use | |||||||
| 46.1% | 45.4% | 46.7% | 0.054 | 4.0 | 3.9 | 4.0 | <0.001 |
| 47.1% | 46.2% | 48.0% | 4.4 | 4.3 | 4.6 | ||
| Subgroups d | |||||||
| Those using pediatric specialists | |||||||
| 9.6% | 9.2% | 10.1% | 0.012 | 3.0 | 2.9 | 3.1 | <0.001 |
| 10.5% | 9.9% | 11.1% | 3.5 | 3.4 | 3.7 | ||
| Those using nonpediatric specialists | |||||||
| 31.49% | 25.69% | 37.94% | 0.598 | 3.2 | 3.2 | 3.2 | 0.035 |
| 31.20% | 25.40% | 37.65% | 3.3 | 3.2 | 3.4 | ||
| Those using both pediatric and non‐pediatric specialists d | |||||||
| 5.5% | 5.3% | 5.7% | 0.001 | 7.1 | 6.9 | 7.3 | <0.001 |
| 6.0% | 5.7% | 6.3% | 8.2 | 7.9 | 8.5 | ||
Note: Statistically significant differences are shown in bold texts.
Percent of total population 133,749.
Among those with any specialist use.
p‐value represents the difference between children being cared for by independent versus system‐owned practices.
These groups overlap and net as those with any specialist use; 59.61% = 28.75% + 47.86% − 17.00%.
In the case of pediatric specialist use, there continued to be a small but statistically significant relationship between practice ownership and specialist‐use patterns (Table 4). Specifically, any use of pediatric specialists was 15.7% (95% CI 14.0%–17.7%) in independent practices and 17.0% (95% CI 15.1%–19.1%) in systems with p = 0.0002; the rate of children who used two or more pediatric specialists was 9.6% (95% CI 9.2%–10.1%) in independent practices and 10.5% (95% CI 9.9%–11.1%) in systems with p = 0.012; and the total number of pediatric specialist visits was 3.0 (95% CI 2.9%–3.1%) in independent practices and 3.5 (95% CI 3.4%–3.7%) in systems with p < 0.0001. A similar pattern emerged for the 17.0% of children with disabilities who used both pediatric and nonpediatric specialists within a year (Supplement for full models).
4. DISCUSSION
Privately insured children with disabilities have lifelong conditions that can be life‐shortening, 6 , 8 , 37 How this population is connected to primary care practices and consequently uses specialty care is likely related to desired outcomes, but patterns of care‐seeking and basic information about practice infrastructure are lacking.
These findings provide a few different types of starting points, but also raise additional questions. First, they present quantitative information about how frequently children with disabilities use generalists and specialists. It does appear that, on average, children with disabilities make more visits to PCPs than specialists across the first 18 years of life (although the percentage made to generalists falls as they reach the age of majority), and this finding supports the notion that PCP practices frequently serve as the primary medical home for children with disabilities as they grow into young adults. 38 However, more study is needed to understand the nature of specialist use among children with disabilities—the type of care specialists seem to be involved in (e.g., routine, urgent, chronic, or elective), how patterns of involvement change as children with disabilities grow into adults with childhood‐onset disability, and how care involving pediatric specialists differs from that involving nonpediatric specialists. Complementary study approaches would be needed to characterize the degree to which available access meets needs from either the family or physician perspectives. Second, this study highlights how frequently nonpediatric specialists deliver care to children with disabilities, and this finding prompts more questions about the circumstances under which children with disabilities see pediatric versus nonpediatric specialists; it would be good to understand when pediatric and nonpediatric specialists serve as substitutes or complements. Third, to our knowledge, this study provides first ever information about how much care for children with disabilities is occurring in a type of health care organization that may or may not enhance health care access and quality for children with disabilities—system versus not. At this point in time, we only observe small, sometimes statistically significant differences in the quantity of specialist visits between independent and system‐owned practices. This small difference could be due to the fact that the most likely reason for a person to switch from an independent to a system‐based practice is because a PCP practice has been acquired by a system rather than the patient moving to a different practice. Acquisition, at least in the short run, may not change PCP practice patterns or specialist networks very much. This may be particularly true for pediatric specialties—pediatric specialist workforce ranges between 250 and 3500 nationally, about one tenth the size of nonpediatric specialists; switching PCP practices might not substantially change access to pediatric or nonpediatric specialists.
Taken together, the patterns reported here support the notion that caring for this population is not the sole responsibility of a particular health care sector (e.g., specialists in children's hospitals) but rather a task for physicians, pediatric and nonpediatric, more broadly. Future studies may want to attend to the fact that quality improvement interventions for children with disabilities may need to encompass independent practices and nonpediatric specialists in order to more completely understand how care access, delivery, and outcomes can be optimized.
Our study is limited in a few ways. First, the population that we study represents those most able to access specialists—these are commercially insured children with disabilities with up to 5 years of health insurance and mostly on PPO or POS plans that typically do not require PCP referral for specialist use. Commercially insured children are known to have greater access to specialists than those insured by Medicaid. 39 Further studies are needed to understand the degree to which the utilization dynamics observed herein generalize to Medicaid‐insured populations with and without similarly stable coverage, to different health plan designs (e.g., Medicaid fee‐for‐service or managed care, high‐deductible plans) or dual commercial‐Medicaid coverage. Second, our study may seem dated, but this 2012–2016 cross‐sectional period of time is important to observe because it marks a point in time in which value‐based purchasing and health care delivery reforms have been present enough to have affected outpatient use patterns for children with disabilities. It is also the period of time at which we have information about how practices are owned—to our knowledge, there is not a more current source of information about practice ownership for pediatrics. Third, although we applied a validated algorithm for identifying children with disabilities, such algorithms are dependent on coding practices, which means that if physicians do not recognize or code for disabling health conditions either as primary diagnoses or co‐morbidities, then studies like this may underestimate the size of this population. However, the 5.1% prevalence of children with disabilities in this health plan was within the 3%–8% prevalence range found in nationally representative surveys. 3 , 5 , 40 Lastly, this study does not reflect the care delivered by allied health professionals (e.g., nurse practitioners).
In summary, using new tools, this study quantifies the types of pediatric primary care physicians and practices used by children with disabilities and how the source of pediatric primary care relates to specialty‐use patterns, particularly observing that, overall, specialist access within a system does not appear to be different than that delivered by independent practices. This study's findings also highlight the levels of specialist use and the range of specialist involvement that may be important for improving care for children with disabilities and for navigating ACO contracts that hold pediatric primary care providers financially responsible for specialty use. Acknowledging the roles of both pediatric and nonpediatric specialists is likely important for success in both endeavors.
FUNDING INFORMATION
This study was funded by the Agency for Healthcare Research and Quality U19 HS024075‐05 (Pediatric Project PI: Alyna T. Chien; Overall PI: David Cutler). The funder had no role in the design and the conduct of the study; in the collection, analysis, and interpretation of the dat; or in the preperation, review, or approval of the manuscript or the decision to submit.
CONFLICT OF INTEREST STATEMENT
The authors declare no conflicts of interest.
Supporting information
Data S1: Supporting Information.
ACKNOWLEDGMENT
None.
Chien AT, Wisk LE, Beaulieu N, et al. Specialist use among privately insured children with disabilities. Health Serv Res. 2024;59(4):e14199. doi: 10.1111/1475-6773.14199
REFERENCES
- 1. World Health Organization . The International Classification of Functioning, Disability and Health for Children and Youth. WHO Press; 2007. Accessed December 28, 2022. http://apps.who.int/iris/bitstream/handle/10665/43737/9789241547321_eng.pdf;jsessionid=CB462414089BF2173C7306AADCED2D11?sequence=1 [Google Scholar]
- 2. United Nations . Convention on the Rights of Persons with Disabilities and Optional Protocol. United Nations; 2006. Accessed December 28, 2022. http://www.un.org/disabilities/documents/convention/convoptprot-e.pdf [Google Scholar]
- 3. Chien AT, Kuhlthau KA, Toomey SL, et al. Development of the children with disabilities algorithm. Pediatrics. 2015;136(4):e871‐e878. doi: 10.1542/peds.2015-0228 [DOI] [PubMed] [Google Scholar]
- 4. Chien AT, Toomey SL, Kuo DZ, et al. Care quality and spending among commercially insured children with disabilities. Acad Pediatr. 2019;19(3):291‐299. doi: 10.1016/j.acap.2018.06.004 [DOI] [PubMed] [Google Scholar]
- 5. Chien AT, Kuhlthau KA, Toomey SL, et al. Quality of primary care for children with disabilities enrolled in medicaid. Acad Pediatr. 2017;17(4):443‐449. doi: 10.1016/j.acap.2016.10.015 [DOI] [PubMed] [Google Scholar]
- 6. Forman‐Hoffman VL, Ault KL, Anderson WL, et al. Disability status, mortality, and leading causes of death in the United States community population. Med Care. 2015;53(4):346‐354. doi: 10.1097/MLR.0000000000000321 [DOI] [PMC free article] [PubMed] [Google Scholar]
- 7. Turk MA, Landes SD, Formica MK, Goss KD. Intellectual and developmental disability and COVID‐19 case‐fatality trends: TriNetX analysis. Disabil Health J. 2020;13(3):100942. doi: 10.1016/j.dhjo.2020.100942 [DOI] [PMC free article] [PubMed] [Google Scholar]
- 8. Coppus AMW. People with intellectual disability: what do we know about adulthood and life expectancy? Dev Disabil Res Rev. 2013;18(1):6‐16. doi: 10.1002/ddrr.1123 [DOI] [PubMed] [Google Scholar]
- 9. Balogh RS, Ouellette‐Kuntz H, Brownell M, Colantonio A. Factors associated with hospitalisations for ambulatory care‐sensitive conditions among persons with an intellectual disability—a publicly insured population perspective. J Intellect Disabil Res. 2013;57(3):226‐239. doi: 10.1111/j.1365-2788.2011.01528.x [DOI] [PubMed] [Google Scholar]
- 10. Reichard A, Stolzle H, Fox MH. Health disparities among adults with physical disabilities or cognitive limitations compared to individuals with no disabilities in the United States. Disabil Health J. 2011;4(2):59‐67. doi: 10.1016/j.dhjo.2010.05.003 [DOI] [PubMed] [Google Scholar]
- 11. Magaña S, Lopez K, Aguinaga A, Morton H. Access to diagnosis and treatment services among latino children with autism spectrum disorders. Intellect Dev Disabil. 2013;51(3):141‐153. doi: 10.1352/1934-9556-51.3.141 [DOI] [PubMed] [Google Scholar]
- 12. Chien AT, Leyenaar J, Tomaino M, et al. Difficulty obtaining behavioral health services for children: a National Survey of Multiphysician Practices. The Annals of Family Medicine. 2022;20(1):42‐50. doi: 10.1370/afm.2759 [DOI] [PMC free article] [PubMed] [Google Scholar]
- 13. Ray KN, Bogen DL, Bertolet M, Forrest CB, Mehrotra A. Supply and utilization of pediatric subspecialists in the United States. Pediatrics. 2014;133(6):1061‐1069. doi: 10.1542/peds.2013-3466 [DOI] [PubMed] [Google Scholar]
- 14. Hing E, Burt CW. Office‐based medical practices: methods and estimates from the National Ambulatory Medical Care Survey. Adv Data. 2007;383:1‐16. Accessed April 20, 2014. http://www.cdc.gov/nchs/data/ad/ad383.pdf [PubMed] [Google Scholar]
- 15. Welch WP, Cuellar AE, Stearns SC, Bindman AB. Proportion of physicians in large group practices continued to grow in 2009‐11. Health Aff. 2013;32(9):1659‐1666. doi: 10.1377/hlthaff.2012.1256 [DOI] [PubMed] [Google Scholar]
- 16. Muhlestein DB, Smith NJ. Physician consolidation: rapid movement from small to large group practices, 2013‐15. Health Aff. 2016;35(9):1638‐1642. doi: 10.1377/hlthaff.2016.0130 [DOI] [PubMed] [Google Scholar]
- 17. Kimmey L, Furukawa MF, Jones DJ, Machta RM, Guo J, Rich EC. Geographic variation in the consolidation of physicians into health systems, 2016–18. Health Aff. 2021;40(1):165‐169. doi: 10.1377/hlthaff.2020.00812 [DOI] [PubMed] [Google Scholar]
- 18. SK&A . Market Profile of U.S. Pediatricians . 2016. Accessed February 22, 2022. https://www.onekeydata.com/reports/profile-of-u.s.-pediatricians
- 19. Beaulieu ND, Chernew ME, McWilliams JM, et al. Organization and performance of US health systems. JAMA. 2023;329(4):325. doi: 10.1001/jama.2022.24032 [DOI] [PubMed] [Google Scholar]
- 20. Chien AT, Schiavoni KH, Sprecher E, et al. How accountable care organizations responded to pediatric incentives in the alternative quality contract. Acad Pediatr. 2016;16(2):200‐207. doi: 10.1016/j.acap.2015.10.008 [DOI] [PubMed] [Google Scholar]
- 21. Chien AT, Song Z, Chernew ME, et al. Two‐year impact of the alternative quality contract on pediatric health care quality and spending. Pediatrics. 2014;133(1):96‐104. doi: 10.1542/peds.2012-3440 [DOI] [PMC free article] [PubMed] [Google Scholar]
- 22. Beaulieu ND, Cutler DM. Health Systems and Provider Database Technical Compendium. Agency of Health Research and Quality's Comparative Health Systems Performance Initiative; 2020. Accessed May 28, 2020. http://data.nber.org/hspd_method/ [Google Scholar]
- 23. Chien AT, Pandey A, Lu S, et al. Pediatric hospital services within a one‐hour drive: a national study. Pediatrics. 2020;146(5):e20201724. doi: 10.1542/peds.2020-1724 [DOI] [PubMed] [Google Scholar]
- 24. Mayer ML, Skinner AC. Too many, too few, too concentrated? Arch Pediatr Adolesc Med. 2004;158:1158‐1165. [DOI] [PubMed] [Google Scholar]
- 25. Freed GL, Dunham KM, Gebremariam A, Wheeler JRC. Which pediatricians are providing care to America's children? An update on the trends and changes during the past 26 years. J Pediatr. 2010;157(1):148‐152.e1. doi: 10.1016/j.jpeds.2010.01.003 [DOI] [PubMed] [Google Scholar]
- 26. Chien AT, Rosenthal MB. A 3D Model for Value‐Based Care. UHG; 2019. [Google Scholar]
- 27. Kelleher KJ, Cooper J, Deans K, et al. Cost saving and quality of care in a pediatric accountable care organization. Pediatrics. 2015;135(3):e582‐e589. doi: 10.1542/peds.2014-2725 [DOI] [PubMed] [Google Scholar]
- 28. Shortell SM, Casalino LP. Health care reform requires accountable care systems. JAMA: The Journal of the American Medical Association. 2008;300(1):95‐97. doi: 10.1001/jama.300.1.95 [DOI] [PubMed] [Google Scholar]
- 29. Singer SJ, Kerrissey M, Friedberg M, Phillips R. A comprehensive theory of integration. Med Care Res Rev. 2020;77(2):196‐207. doi: 10.1177/1077558718767000 [DOI] [PubMed] [Google Scholar]
- 30. Winitzer RF, Bisgaier J, Grogan C, Rhodes K. “He only takes those type of patients on certain days”: specialty care access for children with special health care needs. Disabil Health J. 2012;5(1):26‐33. doi: 10.1016/j.dhjo.2011.10.002 [DOI] [PubMed] [Google Scholar]
- 31. Kerrissey MJ, Clark JR, Friedberg MW, et al. Medical group structural integration may not ensure that care is integrated, from the patient's perspective. Health Aff. 2017;36(5):885‐892. doi: 10.1377/hlthaff.2016.0909 [DOI] [PubMed] [Google Scholar]
- 32. Gourevitch RA, Chien AT, Bambury EA, et al. Patterns of use of a price transparency tool for childbirth among pregnant individuals with commercial insurance. JAMA Netw Open. 2021;4(8):e2121410. doi: 10.1001/jamanetworkopen.2021.21410 [DOI] [PMC free article] [PubMed] [Google Scholar]
- 33. CMS, Centers for Medicare & Medicaid Services . Two‐step attribution for measures in the value modifier . https://www.cms.gov/Medicare/Medicare‐Fee‐for‐Service‐Payment/PhysicianFeedbackProgram/Downloads/Attribution‐Fact‐Sheet.pdf
- 34. Research Methods . Dartmouth Atlas of Health Care . Accessed April 5, 2023. https://www.dartmouthatlas.org/research-methods/
- 35. Healthcare Cost and Utilization Project . HCUP Chronic Condition Indicator. Agency for Healthcare Research and Quality; 2014. www.hcup-us.ahrq.gov/toolssoftware/chronic/chronic.jsp [PubMed] [Google Scholar]
- 36. United States Census Bureau . American Community Survey Information Guide. United States Census Bureau; 2017. https://www.census.gov/content/dam/Census/programs‐surveys/acs/about/ACS_Information_Guide.pdf [Google Scholar]
- 37. Yeh J, Ward Z, Chaudry A, et al. Life expectancy of adult survivors of childhood cancer over 3 decades. JAMA Oncology. 2020;6(3):350‐357. [DOI] [PMC free article] [PubMed] [Google Scholar]
- 38. American Academy of Pediatrics Medical Home Initiatives for Children With Special Needs Project Advisory Committee . Policy statement: organizational principles to guide and define the child health care system and/or improve the health of all children. Pediatrics. 2004;113(5 Suppl):1545‐1547. [PubMed] [Google Scholar]
- 39. Smith AJ, Chien AT. Massachusetts health reform and access for children with special health care needs. Pediatrics. 2014;134(2):218‐226. doi: 10.1542/peds.2013-3884 [DOI] [PubMed] [Google Scholar]
- 40. Houtrow AJ, Larson K, Olson LM, Newacheck PW, Halfon N. Changing trends of childhood disability, 2001‐2011. Pediatrics. 2014;134(3):530‐538. doi: 10.1542/peds.2014-0594 [DOI] [PMC free article] [PubMed] [Google Scholar]
Associated Data
This section collects any data citations, data availability statements, or supplementary materials included in this article.
Supplementary Materials
Data S1: Supporting Information.