

Abstract
Oncogenesis and progression of pancreatic ductal adenocarcinoma (PDAC) is driven by complex interactions between the neoplastic component and the tumor microenvironment (TME), which includes immune, stromal, and parenchymal cells. In particular, most PDACs are characterized by a hypovascular and hypoxic environment that alters tumor cell behavior and limits the efficacy of chemotherapy and immunotherapy. Characterization of the spatial features of the vascular niche could advance our understanding of inter- and intra-tumoral heterogeneity in PDAC. Here, we investigated the vascular microenvironment of PDAC by applying imaging mass cytometry using a 26-antibody panel on 35 regions of interest (ROIs) across 9 patients, capturing over 140,000 single cells. The approach distinguished major cell types, including multiple populations of lymphoid and myeloid cells, endocrine cells, ductal cells, stromal cells, and endothelial cells. Evaluation of cellular neighborhoods identified 10 distinct spatial domains, including multiple immune and tumor-enriched environments as well as the vascular niche. Focused analysis revealed differential interactions between immune populations and the vasculature and identified distinct spatial domains wherein tumor cell proliferation occurs. Importantly, the vascular niche was closely associated with a population of CD44-expressing macrophages enriched for a pro-angiogenic gene signature. Together, this study provides insights into the spatial heterogeneity of PDAC and suggests a role for CD44-expressing macrophages in shaping the vascular niche.
Introduction
Pancreatic ductal adenocarcinoma (PDAC) is an aggressive malignancy with early metastases and a poor prognosis. Its progression and resistance to therapy is mediated by complex interactions within the tumor microenvironment, which consists of neoplastic cells, non-neoplastic exocrine and endocrine cells, vasculature, immune cells, and stromal components (1). While sequencing of single cell suspensions allows for the accurate delineation of the individual cell types within the tumor, it lacks spatial information critical for a better understanding of tumor topography. Multiplexed imaging has emerged as a powerful method for studying the intricacies of the tumor microenvironment (TME). These imaging approaches enable the quantification of dozens of protein targets at subcellular resolution in frozen and FFPE-preserved tissues, thereby capturing the spatial layout of cell types and expression patterns within a tumor. Multiplexed imaging has advanced our understanding of inter- and intra-tumoral heterogeneity in multiple cancer types including colorectal and breast cancer (2,3). It has also been used to investigate the spatial landscape of PDAC, revealing important features of immune organization with clinical implications through the evaluation of cellular interactions and the spatial localization of immune activation states (4–11).
The tumor microenvironment of most PDAC tumors is characterized by a dense stroma driven by activated fibroblasts surrounding the tumor. This desmoplastic reaction influences immune infiltration and may also be responsible for the hypovascular nature of these tumors (1). We previously reported that intratumoral heterogeneity with respect to vascular perfusion in PDAC leads to profound differences in tumor cell behavior and therapeutic vulnerabilities (12). While previous multiplexed imaging studies have examined the PDAC tumor immune microenvironment in detail (4–6), there has been limited evaluation of vascular niches in this tumor type. By applying multiplexed imaging through imaging mass cytometry (IMC), we now define and distinguish vessel-rich and vessel-poor neighborhoods and study the spatial relationship of these neighborhoods with respect to various tumor and immune cell populations.
Materials and Methods
Patient cohort
Surgically resected tissue specimens from patients with PDAC were obtained from the Cooperative Human Tissue Network (CHTN). Written informed consent was obtained prior to the procurement of all patient samples, which we have previously characterized (13). Tissue collection protocols were approved by the institutional review board of the University of Pennsylvania and were carried out in compliance with the 1996 Declaration of Helsinki. Patient characteristics and pathology information are shown in Table S1. H&E images for each case have been deposited online as described under Data and Code Availability.
Antibody validation
All antibodies were previously validated in IMC on non-neoplastic pancreas tissues (14–15) and assessed by board-certified pathologists. The antibody staining was reassessed on PDAC samples for proper morphology as well as co-localization upon visual inspection and subsequent computational analysis and clustering. QuPath v0.4.3 was used for visualization of multiplexed IMC images. Images in the figures are individually contrast-adjusted for illustrative purposes.
Antibodies that exhibited high levels of background signal in the PDAC tissue, did not exhibit proper patterns of cellular localization, or did not yield expected patterns of co-expression (as assessed after segmentation and marker quantification) were removed from downstream analysis, resulting in 26 markers remaining in the analysis. Details about all antibodies used for data generation are shown in Table S2.
Antibody labeling and image acquisition
Antibody conjugation and data generation were performed as described previously (14–15) with some modifications. Briefly, antibodies were conjugated with lanthanide metals using the Maxpar X8 metal conjugation kit following the manufacturer’s protocol (Standard BioTools, formerly Fluidigm, 201300). Five μm FFPE sections were stained with an antibody cocktail containing all antibodies. Tissue sections were de-paraffinized with xylene, re-hydrated from 100% ethanol to 70% ethanol, and transferred to PBS. Heat-induced antigen retrieval was performed in a decloaking chamber (Biocare Medical) at 95°C for 30 min in Tris/EDTA buffer (10 mM Tris, 1 mM EDTA, pH 9.2). Slides were cooled to room temperature (RT) and blocked with PBS + 3% BSA for 1h at RT. The antibody cocktail was prepared in PBS + 1% BSA buffer, and each slide was incubated with 100 μl of the antibody cocktail overnight at 4°C. The next day, slides were washed 3 times with PBS and labelled with 1:400 dilution of Intercalator-Ir (Fluidigm 201192B) in PBS for 30 min at RT. Slides were briefly washed with water three times and air dried for at least 30 min before IMC acquisition. Image acquisition was carried out on the Standard BioTools (formerly Fluidigm) Hyperion Imaging System following manufacturer’s instruction at a laser frequency of 200 Hz. Images are at a resolution of 1 μm/pixel. Regions ranging from 500 μm x 500 μm to 1000 μm x 1000 μm were selected based on brightfield and histopathological images. We aimed to capture a breadth of morphologic regions with variation in tumor cellularity, lymphoid infiltration, and stromal content. All images and raw data used in this study are accessible at https://zenodo.org/records/10246315.
Signal compensation
Signal spillover between adjacent channels is produced as a result of metal isotope impurities and oxidative processes. To reduce channel spillover, we utilized the CATALYST package (16) using the default spillover matrix customized to the metal channels in the present antibody panel. A threshold of 2% was defined as a high spillover, and channels with higher crosstalk than the threshold were corrected.
Hot pixel removal
Hot pixels and streaks are an artifact of IMC and were identified for several of the protein markers (CD45, CD4, CD8). Artifacts were identified by applying morphological operations and extracting connected components using the Python OpenCV library. We performed dilation and closing image processing operations to fill empty spaces between streaks and merge them into a single larger object. We filtered connected components by size ≥250 pixels and standard deviation in intensity to differentiate real signal from artifact objects. Artifacts were removed by a weighted subtraction of each artifact object from the original compensated image.
Cell segmentation
Whole cell segmentation was performed using the Mesmer deep learning model (17). The nuclear channels contained the two DNA markers, and the membrane channel was constructed by merging HLA-ABC, CD45, CD99, and pan-Keratin. Each channel (nuclear/membrane) was generated by normalizing the individual markers by the 99.9th percentile and taking the mean of all markers, followed by histogram equalization for contrast enhancement. An RGB image was then constructed with the membrane markers in the blue channel and nuclear markers in the green channel for each ROI. This set of images was used as input to the pre-trained network with default parameters to generate model predictions.
IMC data normalization and integration
For each cell and for each marker, the total intensity per cell was computed. Values were divided by the cell size, and arcsinh transformed with a linear scaling factor of 100 as implemented through ark-analysis v0.6.3 (https://github.com/angelolab/ark-analysis). Transformed expression values were loaded into Seurat v5 (18) in R v4.2.3, and the data was centered and scaled. A PCA was run with all features, a shared nearest neighbor (SNN) graph was constructed using the first 20 principal components with the FindNeighbors function, Louvain clustering was performed with the FindClusters function with resolution=1.8, and a UMAP projection visualized the data using the top 20 principal components with the RunUMAP function.
To correct for batch effects between each region of interest (ROI), the data was integrated along ROIs using reciprocal PCA integration using the top 20 principal components via the IntegrateLayers function in Seurat v5. Subsequent SNN graph construction, Louvain clustering, and UMAP projection using the top 20 principal components was performed as above. Multiple clustering resolutions were evaluated to ensure separation of the expected cell type populations was achieved.
IMC data annotation
Cells were annotated manually based on their patterns of marker expression. All cells remained in the analysis; presumed cell doublets and imaging artifact were captured through a cluster with high intensity of most of the markers and annotated as an artifact cluster. All other clusters displayed expression patterns representative of biologically expected cell types. The main markers used to identify each cell type are as follows. T cells: CD45, CD45RO, CD3, CD4, CD8; B cells: CD45, CD20, HLA-DR; CD11b+ myeloid cells: CD45, CD11bhi, CD68low; CD68+ macrophages; CD45, CD68, HLA-DR; CD68+ CD44hi macrophages; CD45, CD68, CD44; Tumor/ductal cells: pan-keratin, NFkB, CA2; Proliferating tumor cells: pan-keratin, NFkB, CA2, Ki67; Endothelial cells: CD31, Nestin; Alpha cells: Glucagon; Beta cells: PDX-1, C-peptide, NKX6.1; Delta Cells: Somatostatin; Stromal cells: Collagen, pS6, beta-Actin, with absence of other markers. A Ki67+ cluster with mixed expression of macrophages and stromal markers was annotated as Proliferating macrophages/stromal cells.
IMC cell-cell interaction and distance analysis
Spatial analysis of the IMC data was carried out using the imcRtools package v1.4.2 (19). Pairwise interaction/avoidance characteristics of each cell type were evaluated using the testInteractions function with method=“classic” in which the total number of interactions between cell type A and cell type B (defined by a distance of ≤ 10 μm between cell centroids) is divided by the total number of cells of type A. Cell labels were permuted 1,000 times to generate a null distribution of the interaction counts, which was used to generate an empirical p-value for each ROI. For each ROI, a significance threshold of p < 0.01 indicates a significant interaction (+1 interaction score) or avoidance (−1 interaction score) and the total interaction scores were summed over all ROIs.
IMC cellular neighborhood analysis
Cellular neighborhoods were computed based on the method as previously described (2), and as implemented by the imcRtools package. Briefly, a k-nearest neighbors graph from all cells is constructed using the buildSpatialGraph function in imcRtools with k=20, which effectively calculates the neighborhood composition of each cell with a sliding window. These windows are clustered using k-means clustering with respect to their proportions of cell types with k=10 clusters and 50 iterations. Subsequent cellular neighborhoods were annotated manually based on the relative cell type composition for each neighborhood. Statistical significance of cell type enrichment within each neighborhood was calculated using a hypergeometric test. The p-value was calculated based on the following four numbers: (1) the number of cells of a given type in the neighborhood; (2) the total number of cells in the neighborhood; (3) the number of cells of a given type in the IMC dataset; and (4) the total number of cells in the IMC dataset. P-values were adjusted for multiple hypothesis testing using the Benjamini-Hochberg method.
Single-cell RNA-seq analysis
The Seurat object containing the previously published atlas of PDAC scRNA-seq (20) was downloaded from zenodo.org/record/6024273. The macrophage population was subsetted and analyzed as follows: counts were normalized (log normalization, scale factor=10,000); top 2,000 variable features were selected; data were scaled while regressing out number of RNA counts; a PCA was computed; and UMAP was projected using the top 20 principal components. Data was re-integrated along each patient using Harmony (21) with default parameters, and a UMAP was projected as described above.
The data was projected onto the published reference atlas (after pre-processing as detailed below) via the FindTransferAnchors function in Seurat v5 by projecting the PCA from the reference onto the query with the top 50 dimensions, and then using the MapQuery function with the top 50 dimensions from the reference and query. In doing so, each cell in the query is assigned a predicted cell type label based on its nearest neighbor in the reference dataset. Gene signatures (reproduced in Table S3) were assessed in the data using the AddModuleScore function.
Pan-cancer myeloid atlas pre-processing
Count matrices and metadata for the reference atlas of pan-cancer tumor myeloid atlas (22) were downloaded from NCBI GEO (GSE154763) for each tumor type and concatenated, then used to create a Seurat object. Data were log normalized; the top 2,000 variable features were selected; and genes that were expressed in less than 1% of cells were removed. The data was scaled while regressing out the mitochondrial percentage, number of RNA counts, and a module score of heat shock protein expression. A PCA was then computed, which was then used for projecting the query dataset and assigning predicted cell type labels.
Gene set enrichment analysis of scRNA-seq data
A gene set enrichment analysis (GSEA) was conducted to compare differentially expressed pathways in one cluster compared to all other clusters. A full gene list was constructed using the FindMarkers function with parameters “min.pct = 0.0001, logfc.threshold = 0, only.pos = F.” This gene list sorted was by log2FC to use as input to pre-ranked GSEA using the fgsea package (23). Pathways were sourced from the Molecular Signatures Database (MSigDB) (24).
Transcriptional deconvolution of TCGA data and survival analysis
The raw count matrix from the scRNA-seq data was downsampled to a maximum of 500–800 cells per cluster, including the myeloid subpopulations and the non-myeloid coarse populations. Then, a signature matrix was created for deconvolution using CIBERSORTx (25) with default parameters (kappa = 999, q-value = 0.01, filter non-hematopoietic genes = False). Gene expression data from the TCGA-PAAD dataset was used. Cell fractions were imputed without quantile normalization and without batch correction. Survival analysis was performed using Cox proportional hazard’s regression in the R package survival
Cellular interaction analysis
CellChat (26) was used for cellular interaction analysis using the CellChatDB database. All cell subtypes were included, although pDCs were filtered due to their low abundance. The significant cell-cell interactions were determined using CellChat default parameters, with population size accounted for and “trimean” used for calculating mean gene expression. Pathway annotations were taken from the original manuscript. CellChat native functions were used for visualization including netVisual_chord_gene and netAnalysis_signalingRole_heatmap.
Visium spatial transcriptomics analysis
Spatial transcriptomics data (10x Visium) was obtained from a published study which spatially profiled 15 PDAC regions from 10 patients (27), available at phs002371.v1.p1. Count data was loaded into Seurat v5, and normalized using the SCTransform function, regressing out nCount_Spatial. Integration features were identified using SelectIntegratedFeautures (3000 features), a PCA was computed on each sample, and the data was integrated with reciprocal PCA (RPCA) integration using the FindIntegrationAnchors function with the top 30 dimensions and k.anchor=5, followed by the IntegrateData function with the top 30 dimensions. A PCA was computed on the integrated assay, and a UMAP was constructed for visualization with the top 30 principal components.
Spots were annotated by projecting the PDAC scRNA-seq atlas as described above (20) onto the Visium data. First, the scRNA-seq reference was re-normalized using the SCTransform function with default parameters. Then the Visium data was projected by using the FindTransferAnchors function with reference.reduction=“pca” and dims=1:50, followed by the TransferData function with the top 30 dimensions. This infers the relative composition of each spot by providing a fraction for each cell type in the “predictions” assay. Given that each spot contains up to tens of cells, each spot could be approximated as a cellular neighborhood approximating the definition used for the IMC analysis. Analogous to the neighborhood analysis above, the “predictions” assay was clustered using k-means clustering with 10 clusters to identify spatial niches.
Statistical analysis and figure making
R v4.2.3 was used for all computational analysis of high-dimensional data and generation of all analytical figures. BioRender was used for creation of the schematic.
Data and code availability
Pathology images, raw image data, compensated/hot pixel-removed image data, cell segmentation masks, and Seurat objects containing the signal intensities, cell type and neighborhood annotations, and UMAP reductions are publicly available to download at https://zenodo.org/records/10246315. Pathology images include a hematoxylin and eosin stained slide scanned at 40x for each case along with consecutive IHC slides and brightfield images showing selection of ROIs for each case.
Expression profile data analyzed in this study were obtained from Gene Expression Omnibus (GEO) at GSE154763, zenodo.org/record/6024273, phs002371.v1.p1, and The Cancer Genome Atlas (TCGA, https://portal.gdc.cancer.gov/) as noted in the respective methods above. Source code for data processing and figure generation can be made available upon request to the corresponding author.
Results
Data capture, annotation, and interaction analysis
To characterize the spatial composition of the PDAC microenvironment, we applied multiplexed imaging mass cytometry (IMC) to 35 regions of interest (ROIs) across 9 PDAC patient samples, ranging from 0.25 to 1 mm (2) (Methods). ROIs were chosen based on histopathological review, with the intent to capture a range of cellular structures and environments. These regions were assessed for cellularity and the presence of identifiable structures such as ducts, islets, and immune aggregates, although the exact cellular composition and spatial interactions were unknown prior to imaging.
IMC enables the simultaneous quantification of dozens of protein targets via heavy metal-labelled antibodies and laser ablation at a resolution of 1 μm (Figure 1A). We have previously validated this approach with a metal-conjugated antibody panel to study non-neoplastic pancreatic tissue (14–15). After inspection, 26 markers from this panel demonstrated staining consistent with expected patterns of morphology and subcellular localization (Figure S1A–B). We then performed pixel-level compensations, “hot pixel” removal, and cell segmentation, followed by the quantification of marker expression per cell, and computational integration. Assessment of lymphoid cells, cancer cells, islets, and extracellular matrix revealed anticipated patterns of staining (Figure 1B). One ROI was largely comprised of a lymphoid follicle with a dense collection of T cells and B cells (Figure 1B, top left panel) that could not be segmented and thus was excluded from the integrated analysis. Computational integration was necessary to correct for ROI-level staining batch effects that did not reflect biological differences in cell types, and effectively ameliorated these artifacts (Figure S2A). Cells from the remaining 34 ROIs – totaling approximately 145,000 cells – were clustered and manually annotated based on their marker expression (Figure S2B), capturing 15 distinct cell types spanning neoplastic, immune, stromal, and vascular cells (Figure 1C–E and Figure S3). Putative cell doublets and staining/imaging artifacts were captured in one small cluster which exhibited high levels of many biologically incompatible markers (Figure 1C–D).
Figure 1. Imaging mass cytometry captures the major cell types in the PDAC microenvironment.
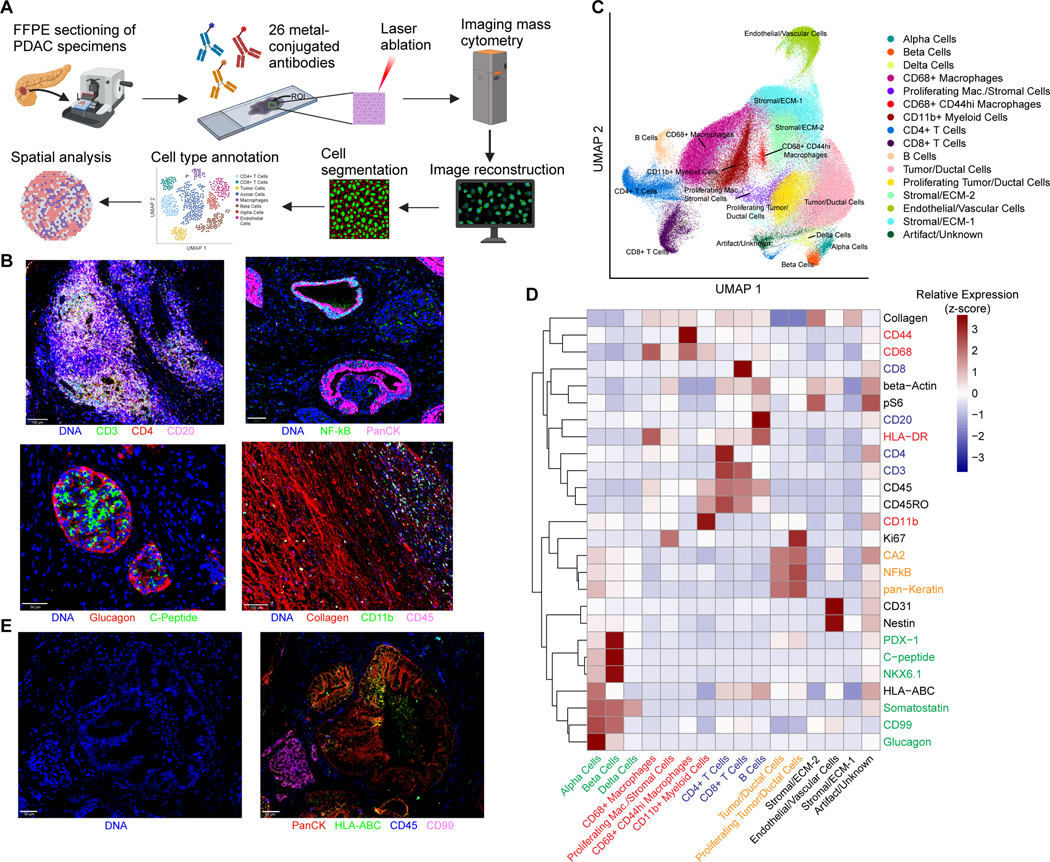
(A) Schematic of IMC workflow and data processing. FFPE sections of human PDAC samples are labeled simultaneously with heavy metal-conjugated antibodies. Regions of interest up to 1 mm x 1 mm are selected for laser ablation. Plumes of particles are carried over to CyTOF for signal quantification. Antibody labeling patterns are reconstructed and output as 32-bit images. Signal compensation, hot pixel removal, and cell segmentation are performed, followed by quantitation of marker intensity in each cell, which enables downstream analysis.
(B) Representative images from imaging mass cytometry demonstrating identification of a lymphoid aggregate, ductal structures, islets, and fibrous stroma.
(C) UMAP projection of 144,976 cells captured across 34 ROIs labeled by cell type, revealing multiple populations of parenchymal and stromal cells including several myeloid and lymphoid populations. A single cluster with high expression of all markers captures putative cell doublets and imaging artifact (“Artifact/Unknown”).
(D) Mean levels of each of the 26 markers used in the final analysis are shown for each of the manually annotated cell types. Values are displayed as z-score-normalized intensities for each row.
(E) Representative IMC images of markers utilized for whole cell segmentation: nuclear channel (left) and 4 markers included in the composite membrane channel (right).
We began our spatial analysis by investigating the geographical orientation of cell types across ROIs, starting with patterns of cellular interaction and avoidance. We applied a permutation test to infer colocalization by identifying significant deviations from a random cellular arrangement for each ROI. Specifically, this analysis reveals the tendency of each pair of cell types to directly interact beyond random chance. As expected, islet cells, tumor cells, and immune cells tended to co-localize with cells of the same type (Figure 2A). Across all interactions, the most frequent non-self-interaction occurred between CD4+ T cells and CD68+ macrophages, followed by interactions between CD4+ T cells and CD8+ T cells (Figure 2A), highlighting the significance of immune interactions within the tumor microenvironment. CD68+ macrophages, the largest macrophage population, had positive interactions with all immune populations and were negatively associated with tumor/ductal cells as well as ECM/stromal cells.
Figure 2. PDAC is composed of distinct cellular neighborhoods.

(A) Heatmap of pairwise interaction-avoidance scores summed across ROIs. Cells are defined as interacting if the distance between centroids is <10 μm in distance. Significance is assessed by comparing the number of interactions in each ROI to a null distribution of randomly permuted cell-type labels, with a threshold of p<0.01 for interaction (+1) or avoidance (–1) for the ROI.
(B) Schematic of cellular neighborhood analysis. A sliding window captures each cell along with its 20 nearest neighboring cells as measured by the Euclidean distance between X/Y coordinates. The cell type composition for each window is clustered by k-means clustering and manually annotated.
(C) Heatmap of cell type proportions across 10 neighborhoods discovered across ROIs. Values are z-score normalized by column. Statistical significance for cell type enrichment in each neighborhood was calculated using a hypergeometric test comparing the cell type-neighborhood preference to a random distribution of the cell type across neighborhoods, adjusted using the Benjamini-Hochberg method. * p < 0.01, ** p < 0.001, *** p < 0.0001.
(D) Relative enrichment of cell types in endothelial cell windows. Enrichment is calculated for each cell type as the sum of its proportion in the 20-nearest neighbor cell window for each endothelial cell, divided by the total number of that cell type in the dataset.
We next evaluated cellular relationships with endothelial cells. Here, we noted that the only positive interaction score was with a stromal cell population (Stromal/ECM-1, Figure 2A), which may include pericytes and fibroblasts. Overall, endothelial cells were distant from most cell types but were most strongly avoidant of tumor and ductal cells, consistent with the hypovascular and hypoxic characteristics of most pancreatic tumors (28–29). Endothelial cells also had recurrent negative interactions with the Stromal/ECM-2 population as well as multiple immune populations, namely CD68+ macrophages and CD11b+ myeloid cells. The highest (least negative) endothelial interaction scores were with islet cells, lymphoid cells, CD44hi macrophages, and proliferating macrophages/stromal cells (Figure 2A and Figure S4A–B). The predominantly negative interaction scores between endothelial cells and most other cell types indicates a significant avoidant interaction and suggests that most cell populations are excluded from the vascular niche, while CD44hi macrophages are most likely to be tolerated in the vicinity of endothelial cells. Taken together, these results show that infiltrating cells within PDAC tumors tend to associate with cells of a similar cell identity, and that endothelial cells display limited interactions with other cell types, especially keratin+ cancer cells.
Cellular neighborhood analysis identifies the vascular niche
Next, we sought to identify cellular “neighborhoods,” which represent recurring spatial patterns of cellular interactions that may reflect localized niches of tissue function. These neighborhoods were defined by analyzing each cell in the context of a sliding window consisting of its 20 nearest neighbors across all ROIs (Figure 2B, Methods). This method captures repeating units of similar cell type proportions across all annotated cell types, going beyond pairwise interactions. This can reveal patterns of localized enrichment between rare cell types that may not be observed as significant pairwise interactions across the tissue. Overall, we identified 10 cellular neighborhoods (Figure 2C and Figure S5). As expected, alpha/beta/delta cells were captured in a single neighborhood, representing islets (Figure 2C). Likewise, lymphoid cells (CD4+/CD8+ T cells, B cells) were mostly found in a distinct cellular neighborhood that also included some macrophages (Figure 2C). Other neighborhoods were enriched for CD11b+ myeloid cells and stromal cells. CD68+ macrophages were distributed throughout both stromal and immune neighborhoods, highlighting the multifaceted roles of macrophages in the tumor microenvironment. Interestingly, non-proliferating (Ki67-) tumor/ductal cells and proliferating (Ki67+) tumor/ductal cells constituted related, but distinct, cellular neighborhoods, suggesting that proliferating cancer cells reside within a unique spatial niche (Figure 2C).
The vascular niche is of particular importance given that differential access to nutrients and oxygen has a profound impact on tumor biology (12, 30, 31). Complementary to the results from the pairwise interaction analysis (Figure 2A), the neighborhood analysis captured a vascular niche that demonstrated involvement of multiple stromal and immune cell populations, notably CD44hi macrophages and proliferating macrophages/stromal cells (Figure 2C). On further examination, CD44hi macrophages were found to be significantly enriched in the vascular neighborhood, the Stromal Enriched-1 neighborhood, and the macrophage enriched neighborhood, indicating that these cells are restricted to specific PDAC spatial niches (Figure 2C). We next examined the overall compositions of the 20 nearest-neighbor windows for endothelial cells identified across all ROIs. The cell types with the greatest relative involvement in the endothelial cell windows were CD68+ CD44hi macrophages and the Stromal/ECM-1 population followed by T cells and islet cells (Figure 2D). Tumor cells were the least likely of all cell types to be found in proximity to endothelial cells and were rare in the vascular neighborhood (Figure 2C–D). Taken together, these results define a PDAC vascular niche across patients and emphasize the positioning of macrophages and stromal cells as key perivascular populations.
To confirm our findings regarding these PDAC cellular neighborhoods, we interrogated a recently published spatial transcriptomic dataset of 15 PDAC samples from 10 patients. By clustering the spots based on their cell type prediction score (Methods), we similarly obtained 10 cellular neighborhoods and likewise observed heterogeneous representation of these neighborhoods across the samples (Figure S6A–D). Consistent with our IMC analysis, we observed localization of B and T cells in a lymphoid enriched neighborhood, an endocrine neighborhood, multiple stromal-enriched and tumor/ductal-enriched neighborhoods, and a mixed tumor/stromal neighborhood (Figure S6D). Importantly, we identified a vascular neighborhood which exhibited enrichment of stellate cells, suggesting that these cells specifically represent an important stromal population in the vascular niche, supporting previous studies suggesting an angiogenic role of pancreatic stellate cells in PDAC (32,33). Additionally, other cell types were largely excluded from the vascular niche, especially ductal cell type 2, which comprises the majority of the tumor cells (Figure S6E–F). Overall, these analyses demonstrate the ability of IMC to characterize the vascular niche and identify CD44hi macrophages and stromal cells as significant perivascular populations, complementing insights available through mRNA-based spatial transcriptomic approaches.
IMC classifies intra-tumoral heterogeneity
Next, we investigated the heterogeneity between the 34 ROIs in the integrated dataset. Assessing the cell type composition between ROIs confirmed significant overall heterogeneity between ROIs; however, we observed that most cell types and neighborhoods were consistently captured in each ROI (Figure 3A–B). ROIs were mostly dominated by either the tumor/ductal component, myeloid-immune component, or stromal component. Vascular and lymphoid elements were captured in all ROIs. Hierarchical clustering of the ROIs by cell type composition revealed several distinct clusters roughly enriched in different cell types: endocrine, lymphoid, neoplastic, stromal, and myeloid (Figure 3C–H). Most lymphoid-enriched ROIs contained relatively equal amounts of CD4+ and CD8+ T cells; a minority were enriched for B cells, and all had variable enrichment in the myeloid cell populations. Tumor/ductal-enriched regions varied in the amount of non-proliferating versus proliferating cells. We observed this heterogeneity both across patients and between ROIs from the same patient (Figure 3C). Notably, the IMC images revealed tumor proliferation occurring in localized patches, in some cases surrounding non-proliferating ductal structures (Figure 3I, S3, S4 (e.g., see regions P3-R1, P3-R4, or P8-R1)), and the relative amounts of non-proliferating and proliferating neighborhoods were similarly heterogeneous both within and across patients (Figure 3B). In addition, ROIs enriched in tumor/ductal cells were generally associated with few lymphoid and myeloid immune cells, consistent with an immune “cold” phenotype (Figure 3C). A collagen-rich background was present in many of the ROIs given the desmoplastic nature of PDAC (Figure 3D–H, S2, fifth row). However, the stromal-enriched ROIs typically captured hypocellular regions with limited positivity for tumor or immune markers. These regions also captured staining artifacts, aberrant staining (e.g., off-target staining of somatostatin) and cell types without specific antibody markers (Figure 3C). Consistent with our earlier findings, the proportion of endothelial cells in each ROI was positively correlated with the proportion of CD68+ CD44hi and proliferating (Ki67+) stromal cells, and inversely correlated with tumor/ductal cells (p-adjusted < 0.01) (Figure 3J). These results indicate that intra-tumoral vascular heterogeneity is characterized by several core patterns of cellular composition.
Figure 3. Heterogeneity across PDAC ROIs.
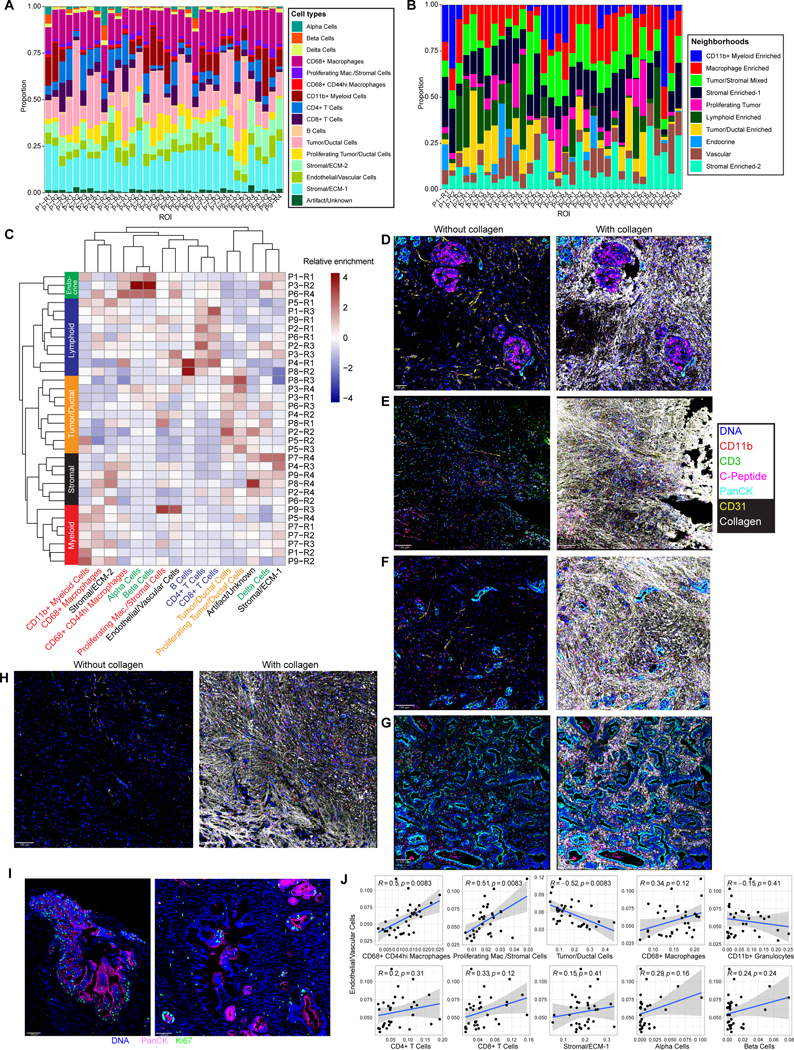
(A) Cell type proportions for each ROI.
(B) Proportions of neighborhood assignments for each ROI.
(C) Heatmap showing hierarchical clustering of cell type proportions for each ROI. Values are z-score normalized by column.
(D-H) Representative images from each cluster of ROIs identified in (C): endocrine-enriched (D), lymphoid-enriched (E), myeloid enriched (F), tumor/ductal-enriched (G), and stromal-enriched (H) shown with (right panels) and without (left panels) collagen staining included. The same markers are shown for each ROI.
(I) Representative images demonstrating spatially localized Ki67 staining surrounding ductal structures.
(J) Correlations between the proportions of indicated cell types and endothelial cells across ROIs, with Pearson’s correlation. Gray bands represent standard error of the linear regression line. P-values are adjusted for multiple hypothesis testing using the Benjamini-Hochberg correction.
CD44-expressing macrophages harbor pro-angiogenic signatures
We next sought to better define CD68+ CD44hi macrophages given their enrichment within the vascular niche and correlation with endothelial cells (Figure 2D, 3J). To this end, we first assessed the association between CD44hi macrophages and endothelial cells by direct visualization (Figure 4A). As expected, we found CD44hi macrophages located in the stroma adjacent to CD31+ endothelial cells. CD44 signaling has been implicated in multiple types of pathological angiogenesis (34–36). Moreover, CD44-expressing tumor-associated macrophages (TAMs) have been directly implicated in tumor angiogenesis through endothelial cell interactions and are associated with poor prognosis in CNS tumors (37). However, their role in other tumor types has not been thoroughly characterized. To better understand the role of CD44 in PDAC infiltrating myeloid cells, we utilized an integrated atlas of PDAC single-cell RNA-seq data which includes 6 datasets with over 130,000 cells in total, including over 20,000 myeloid cells (20). Examining the expression of CD44 across all cell types revealed its wide expression on multiple cell types, especially tumor/ductal cells, macrophages, and T cells, and less expression on endothelial cells and fibroblasts (Figure 4B–C). This is consistent with the CD44 expression levels seen across populations in our IMC dataset (Figure S2B, second row).
Figure 4. CD44hi tumor-associated macrophages (TAMs) in PDAC harbor pro-angiogenic features.

(A) Representative IMC images from two ROIs (top and bottom rows) demonstrating identification of CD68/CD44 double-positive cells (indicated with white arrows) in proximity to endothelial cells.
(B) UMAP projection of cells from PDAC scRNA-seq atlas (136,163 cells) (20).
(C) CD44 expression across PDAC scRNA-seq atlas. Color indicates expression value truncated at the 1st and 99th percentiles.
(D) Predicted cell type annotation for macrophage subset identified in PDAC scRNA-seq atlas after integration and projection onto reference atlas of pan-cancer tumor myeloid cells (23,703 cells)22.
(E) Expression of selected angiogenesis-related genes in the PDAC myeloid cells, colored by expression truncated at the 1st and 99th percentiles.
(F) M1, M2 macrophage, angiogenesis, and phagocytosis scores in PDAC myeloid cells, truncated at the 1st and 90th percentiles for visualization.
(G) Dotplot showing expression of macrophage identity genes and signature genes included in the angiogenesis and phagocytosis gene signatures from (F).
(H) Correlation between normalized CD44 expression and the angiogenesis signature scores across all myeloid populations.
Next, we subsetted the myeloid cells, and re-integrated these cells to account for the significant heterogeneity in cell composition that was seen in ROIs between patients (Figure S7A). Then, we computationally projected these cells onto a pan-cancer myeloid atlas (22), assigning each cell a predicted cell type annotation based on the closest cell in the reference dataset (Figure 4D and Figure S7B–C). This projection identified the major myeloid subtypes, including CD14+ and CD16+ monocytes, two populations of conventional dendritic cells, plasmacytoid dendritic cells, and several populations of macrophages dominated by SPP1+ macrophages and C1QC+ macrophages, which have been previously characterized as being pro-angiogenic and pro-phagocytic, respectively (22, 38). Indeed, the cells with the highest expression of CD68 and CD44 (likely corresponding to the population identified via IMC) projected onto the SPP1+ (pro-angiogenic) macrophage subset (Figure 4D–E). These cells also expressed angiogenic factors including VEGFA, VCAN, and FN1 (Figure 4E–F). The CD68+ CD44hi (SPP1+) macrophage population broadly expressed an M2-like signature (22), consistent with its identity as a TAM population (Figure 4G). Of note, we observed a specific population of CD14+ monocytes that also expressed high levels of CD44 and VCAN and was enriched in an M1-like signature (Figure 4D–F and Figure S7D). Moreover, these CD44hi populations were enriched in a published 25-gene angiogenic signature, but not a phagocytosis signature (22) (Figure 4H and Figure S7E). Accordingly, we demonstrated that CD44 expression is directly correlated to the expression of multiple key angiogenic factors, including VEGFA and VCAN (Figure S7F). Taken together, these findings suggest that CD44 gene expression is associated more generally with a tumor-associated myeloid angiogenesis transcriptional program, and that this angiogenic signature can be expressed by multiple myeloid populations including monocytes and macrophages. This is consistent with a recent report demonstrating high expression of angiogenic genes in PDAC-infiltrating CD14+ monocytes (8).
SPP1+ (CD44hi) macrophages are associated with hypoxic tumors
To functionally characterize the pathways enriched in the SPP1+ (CD44hi) macrophages, we performed a Gene Set Enrichment Analysis (GSEA) to identify differentially expressed pathways between the CD44hi macrophages versus the other myeloid populations using orthogonal Hallmark gene sets. This revealed global alterations in transcriptional pathways, including upregulation of multiple metabolic pathways (i.e., glycolysis, oxidative phosphorylation) and downregulation of immune-related pathways including interferon response pathways (Figure 5A). Importantly, this analysis confirmed enrichment of angiogenic genes, as well as demonstrated an upregulation of the hypoxia pathway, which was the topmost enriched pathway (Figure 5A–B).
Figure 5. CD44hi TAMs are associated with a hypoxic tumor microenvironment.

(A) Gene Set Enrichment Analysis (GSEA) of Hallmark pathways comparing pathway-level differences in gene expression between SPP1+ (CD44hi) macrophages and all other PDAC myeloid populations shown in Figure 4D. GSEA is based on all expressed genes in the scRNA-seq data (Methods).
(B) GSEA enrichment plots of Angiogenesis and Hypoxia pathways from (A).
(C) Chord diagram showing predicted receptor-ligand interactions from myeloid populations to endothelial cells from the PDAC scRNA-seq atlas shown in Figure 4B. The thickness of arrows represents the strength of the inferred interaction. Color of outer bars and arrows indicate sender cell type, and color of inner bars indicate the receiver cell type.
(D) Correlations between endothelial cell fraction and SPP1+ (CD44hi) macrophages (as a fraction of all myeloid populations) across patients from the PDAC scRNA-seq atlas (top) or from the TCGA-PAAD cohort after deconvolution with CIBERSORTx (bottom), with Pearson’s correlation and significance p-value shown.
(E) Schematic of proposed model for pro-angiogenic tumor associated macrophages (TAMs) in PDAC. Global tumor hypoxia is associated with a shift towards the CD44hi macrophage phenotype within the myeloid population. These TAMs secrete multiple pro-angiogenic factors and interact with endothelial cells leading to regions of localized vascularization that contain both endothelial cells and CD44hi macrophages.
We then utilized CellChat to infer cell-cell receptor-ligand interactions, focusing on interactions between various myeloid populations and endothelial cells. Indeed, although multiple myeloid populations expressed some angiogenic genes, the CD44hi macrophages had the greatest number of predicted interactions and greatest overall interaction strength with endothelial cells (Figure 5C). Predicted interactions included VEGF signaling, SPP1, ANGPTL4, and MIF, among other pathways (Figure 5C). This analysis also revealed the potential for endothelial cells to interact with macrophages via a broad array of receptors, including integrins, ICAM1/2, FLT1, and CD74.
Finally, we examined how overall tumor vascularity, as assessed by the frequency of endothelial cells in the tumor, alters the composition of the myeloid compartment. Surprisingly, we found that the fraction of CD44hi macrophages in the myeloid population is inversely correlated with the global proportion of endothelial cells. This was demonstrated using both the PDAC scRNA-seq atlas and the TCGA pancreatic adenocarcinoma cohort after computational deconvolution of the bulk RNA-seq data (Figure 5D, Methods). These results indicate that the myeloid population of hypovascular tumors is relatively enriched in the CD44hi macrophage phenotype. Of note, the proportion CD44hi macrophages was not associated with overall survival (Figure S7G). Taken together, these findings are consistent with a model whereby TAMs adopt a CD44hi phenotype in response to global tumor hypoxia. In turn, they secrete pro-angiogenic factors and interact with endothelial cells, yielding regions of localized vascularization in which both endothelial cells and CD44hi macrophages are present (Figure 5E). Further studies are necessary to elucidate how local vascular and metabolic conditions alter the phenotype of tumor associated myeloid cells to influence their interactions with endothelial cells.
Discussion
Multiplexed imaging of tumor samples has emerged as a powerful technique for understanding spatial relationships and inferring signaling modules within the tumor microenvironment (2,3,5,14). These approaches have several advantages over other single cell techniques that require tissue dissociation (e.g., scRNA-seq), including the ability to study stromal cells that may be more resistant to enzymatic digestion and to recognize differences in mRNA versus protein expression. In this study, we used mass cytometry-based protein detection to capture over 140,000 cells across 34 ROIs from 9 patients. Consistent with previous studies (4–6, 39), we observed an abundance of lymphoid and myeloid cells in PDAC tissues. Using unbiased clustering, these immune populations – along with endocrine cells, tumor/ductal cells, and stromal cells – were found to be distributed among 10 cellular neighborhoods, providing a feature map of PDAC intratumoral heterogeneity.
Of note, tumor cells (pan-Keratin+CA2+NFkB+) comprised two independent cell type clusters – proliferating (Ki67+) and non-proliferating (Ki67-) – and were spatially localized into discrete neighborhoods, suggesting a potential impact of the surrounding cellular composition on cancer cell division within the tumor microenvironment. Proliferating PDAC tumor cells have recently been identified to form distinct tumor cell populations with unique metabolic properties and have been shown to be spatially localized in one patient at the transcriptional level (10–27). Our study generalizes this finding across patients at the protein level, and future studies are expected to elucidate how the tumor microenvironment alters tumor cell phenotypes including proliferation.
As previous studies have characterized the PDAC tumor immune microenvironment (4–8), we focused instead on vascular characteristics of PDAC tumors and found that endothelial cells were inversely correlated (spatially) with tumor cells and instead interacted with a subset of stromal cells (Stromal/ECM-1). These results are consistent with the known hypovascular nature of most PDACs and further support the “stromal barrier” model (1), which posits that stromal interposition between tumor vasculature and cancer cells may hinder drug delivery. Surprisingly, most other cell types, including immune cells, also exhibited a negative interaction with endothelial cells, suggesting that the tumor vascular niche is spatially isolated.
One exception to this pattern of cellular exclusion within the vascular niche was the observation that macrophages – particularly CD44hi macrophages – are tolerated in proximity to endothelial cells and significantly enriched within vascular neighborhoods. We identified a population of macrophages with high co-expression of CD68 and CD44 and low expression of HLA-DR that clustered distinctly from the other cell populations in our IMC analyses. Importantly, these macrophages had the highest endothelial interaction score and interacted infrequently with T cells and B cells compared to all other myeloid populations. This suggests that these macrophages may have a unique function that is distinct from other, more abundant, antigen-presenting myeloid cells in the microenvironment. Using an integrated atlas of PDAC scRNA-seq, we found that CD44hi tumor associated macrophages (TAMs) are enriched in pro-angiogenic and hypoxia signatures, raising the possibility that the perivascular enrichment of this macrophage population may promote neovascularization.
CD44 has broad roles in multiple signal transduction pathways in both cancer and normal physiology, and it is has been shown to mediate cancer proliferation and invasion in multiple tumor types (40). In innate immunity, CD44 acts as a phagocytosis receptor for the clearance of apoptotic cells, microbial pathogens, and gout crystals (41–43). Future studies of the PDAC vascular niche will be needed to define the role of CD44 and pro-angiogenic TAMs in the tumor immune microenvironment, either during tumor progression or under the influence of chemotherapy or immunotherapy. Additionally, several cellular subtypes relevant to PDAC progression and immune response, including fibroblasts and other myeloid populations such as monocytes and neutrophils, could not be further delineated by the present antibody marker panel; additional studies will be needed to define their distribution and role(s) in the vascular niche. In particular, cancer-associated fibroblasts have multifaceted and potentially targetable roles in the PDAC microenvironment, including their ability to activate CD4+ T cells through antigen presentation as well as promoting tumor growth through increased angiogenesis (44–46).
In summary, our findings add to an emerging understanding of the PDAC tumor microenvironment and the spatial relationships of its immune, stromal, tumoral, and vascular components. The finding that PDAC cells are physically isolated from blood vessels to a larger degree than all other cell types in the tumor microenvironment underscores the significant adaptations required for these cancer cells to cope with severe metabolic deprivation. However, this finding may also imply a unique role for the vascular niche in regulating PDAC biology. For instance, while anti-angiogenesis therapies have so far provided minimal benefit in PDAC (47), a greater understanding of factors driving PDAC angiogenesis and vascular niche biology – especially those beyond classical VEGFA-VEGR2 signaling – may uncover key insights into the functional dependency of PDAC on the vasculature. As such, knowledge into the precise roles of the vascular niche in PDAC are expected to reveal novel therapeutic opportunities that involve fully severing the tumor’s already-limited “supply lines.”
Supplementary Material
Significance.
Imaging mass cytometry revealed that pancreatic ductal cancers are composed of 10 distinct cellular neighborhoods, including a vascular niche enriched for macrophages expressing high levels of CD44 and a pro-angiogenic gene signature.
Acknowledgements
We are grateful to Kai Tan and Shovik Bandyopadhyay for their insight and helpful discussions on spatial analysis, Zhan Zhang for help with single-cell myeloid analysis, and Andrew Rech and Golnaz Vahedi for helpful suggestions. This work was supported by NIH P30-CA016520 (Abramson Cancer Center), R01-CA252225 and R01-CA276512 (B.Z.S), R01-CA197916 and R01-CA245323 (G.L.B), the Penn Center for Molecular Studies in Digestive and Liver Diseases (P30-DK050306) and the Penn Pancreatic Cancer Research Center.
Funding:
This work was supported by funding from the NIH, Penn Pancreatic Cancer Research Center and the Abramson Cancer Center.
Abbreviations:
- IMC
imaging mass cytometry
- PDAC
pancreatic ductal adenocarcinoma
- ROI
region of interest
- TAM
tumor-associated macrophage
Footnotes
Conflict of interest: B.Z.S. receives research funding from Boehringer Ingelheim Pharmaceuticals and Revolution Medicines and holds equity in iTeos Therapeutics. G.L.B. reports prior or active roles as a consultant/advisory board member for Boehinger Ingelheim, Adicet Bio, Aduro Biotech, AstraZeneca, BiolineRx, BioMarin Pharmaceuticals, Boehinger Ingelheim, Bristol-Myers Squibb, Cantargia, Cour Pharmaceuticals, Genmab, HiberCell, HotSpot Therapeutics, Incyte, Janssen, Legend Biotech, Merck, Monopteros, Molecular Partners, Nano Ghosts, Opsona, Pancreatic Cancer Action Network, Seagen, Shattuck Labs, and Verastem, and; reports receiving commercial research grants from Alligator Biosciences, Arcus, Bristol-Myers Squibb, Genmab, Gilead, Halozyme, HiberCell, Incyte, Janssen, Newlink, Novartis, and Verastem. G.L.B. is an inventor of intellectual property (U.S. patent numbers 10,640,569 and 10,577,417) and recipient of royalties related to CAR T cells that is licensed by the University of Pennsylvania to Novartis and Tmunity Therapeutics. All other authors declare no potential conflicts of interest.
References
- 1.Ho WJ, Jaffee EM, Zheng L. The tumour microenvironment in pancreatic cancer — clinical challenges and opportunities. Nat Rev Clin Oncol. 2020;17(9):527–540. doi: 10.1038/s41571-020-0363-5 [DOI] [PMC free article] [PubMed] [Google Scholar]
- 2.Schürch CM, Bhate SS, Barlow GL, Phillips DJ, Noti L, Zlobec I, et al. Coordinated Cellular Neighborhoods Orchestrate Antitumoral Immunity at the Colorectal Cancer Invasive Front. Cell. 2020;182(5):1341–1359.e19. doi: 10.1016/j.cell.2020.07.005 [DOI] [PMC free article] [PubMed] [Google Scholar]
- 3.Keren L, Bosse M, Marquez D, Angoshtari R, Jain S, Varma S, et al. A Structured Tumor-Immune Microenvironment in Triple Negative Breast Cancer Revealed by Multiplexed Ion Beam Imaging. Cell. 2018;174(6):1373–1387.e19. doi: 10.1016/j.cell.2018.08.039 [DOI] [PMC free article] [PubMed] [Google Scholar]
- 4.Liudahl SM, Betts CB, Sivagnanam S, Morales-Oyarvide V, da Silva A, Yuan C, et al. Leukocyte Heterogeneity in Pancreatic Ductal Adenocarcinoma: Phenotypic and Spatial Features Associated with Clinical Outcome. Cancer Discov. 2021;11(8):2014–2031. doi: 10.1158/2159-8290.CD-20-0841 [DOI] [PMC free article] [PubMed] [Google Scholar]
- 5.Tsujikawa T, Kumar S, Borkar RN, Azimi V, Thibault G, Chang YH, et al. Quantitative multiplex immunohistochemistry reveals myeloid-inflamed tumor-immune complexity associated with poor prognosis. Cell Rep. 2017;19(1):203–217. doi: 10.1016/j.celrep.2017.03.037 [DOI] [PMC free article] [PubMed] [Google Scholar]
- 6.Steele NG, Carpenter ES, Kemp SB, Sirihorachai V, The S, Delrosario L, et al. Multimodal Mapping of the Tumor and Peripheral Blood Immune Landscape in Human Pancreatic Cancer. Nat Cancer. 2020;1(11):1097–1112. doi: 10.1038/s43018-020-00121-4 [DOI] [PMC free article] [PubMed] [Google Scholar]
- 7.Byrne KT, Betts CB, Mick R, Sivagnanam S, Bajor DL, Laheru DA, et al. Neoadjuvant Selicrelumab, an Agonist CD40 Antibody, Induces Changes in the Tumor Microenvironment in Patients with Resectable Pancreatic Cancer. Clin Cancer Res. 2021;27(16):4574–4586. doi: 10.1158/1078-0432.CCR-21-1047 [DOI] [PMC free article] [PubMed] [Google Scholar]
- 8.Yousuf S, Qiu M, Voithenberg LV von, Hulkkonen J, Macinkovic I, Schulz AR, et al. Spatially Resolved Multi-Omics Single-Cell Analyses Inform Mechanisms of Immune Dysfunction in Pancreatic Cancer. Gastroenterology. 2023;165(4):891–908.e14. doi: 10.1053/j.gastro.2023.05.036 [DOI] [PubMed] [Google Scholar]
- 9.Li Y, Chang RB, Stone ML, Delman D, Markowitz K, Xue Y, et al. Multimodal immune phenotyping reveals microbial-T cell interactions that shape pancreatic cancer. Cell Rep Med. 2024;0(0). doi: 10.1016/j.xcrm.2024.101397 [DOI] [PMC free article] [PubMed] [Google Scholar]
- 10.Wattenberg MM, Colby S, Garrido-Laguna I, Xue Y, Chang R, Delman D, et al. Intratumoral Cell Neighborhoods Coordinate Outcomes in Pancreatic Ductal Adenocarcinoma. Gastroenterology. 2024;0(0). doi: 10.1053/j.gastro.2024.01.013 [DOI] [PMC free article] [PubMed] [Google Scholar]
- 11.Beatty GL, Delman D, Yu J, Liu M, Li JH, Zhang L, et al. Treatment Response in First-Line Metastatic Pancreatic Ductal Adenocarcinoma Is Stratified By a Composite Index of Tumor Proliferation and CD8 T-Cell Infiltration. Clin Cancer Res. 2023;29(17):3514–3525. doi: 10.1158/1078-0432.CCR-23-0535 [DOI] [PMC free article] [PubMed] [Google Scholar]
- 12.Sela Y, Li J, Maheswaran S, Norgard R, Yuan S, Hubbi M, et al. Bcl-xL Enforces a Slow-Cycling State Necessary for Survival in the Nutrient-Deprived Microenvironment of Pancreatic Cancer. Cancer Res. 2022;82(10):1890–1908. doi: 10.1158/0008-5472.CAN-22-0431 [DOI] [PMC free article] [PubMed] [Google Scholar]
- 13.Li Y, Chang R, Stone M, et al. Stromal heterogeneity in solid malignancies is defined by spatial coupling of microbes and immune cells. Cell Rep Med. Published online 2023. [Google Scholar]
- 14.Wang YJ, Traum D, Schug J, Gao L, Liu C, Atkinson MA, et al. Multiplexed In Situ Imaging Mass Cytometry Analysis of the Human Endocrine Pancreas and Immune System in Type 1 Diabetes. Cell Metab. 2019;29(3):769–783.e4. doi: 10.1016/j.cmet.2019.01.003 [DOI] [PMC free article] [PubMed] [Google Scholar]
- 15.Wu M, Lee MYY, Bahl V, Traum D, Schug J, Kusmartseva I, et al. Single-cell analysis of the human pancreas in type 2 diabetes using multi-spectral imaging mass cytometry. Cell Rep. 2021;37(5):109919. doi: 10.1016/j.celrep.2021.109919 [DOI] [PMC free article] [PubMed] [Google Scholar]
- 16.Chevrier S, Crowell HL, Zanotelli VRT, Engler S, Robinson MD, Bodenmiller B. Compensation of Signal Spillover in Suspension and Imaging Mass Cytometry. Cell Syst. 2018;6(5):612–620.e5. doi: 10.1016/j.cels.2018.02.010 [DOI] [PMC free article] [PubMed] [Google Scholar]
- 17.Greenwald NF, Miller G, Moen E, Kong A, Kagel A, Dougherty T, et al. Whole-cell segmentation of tissue images with human-level performance using large-scale data annotation and deep learning. Nat Biotechnol. 2022;40(4):555–565. doi: 10.1038/s41587-021-01094-0 [DOI] [PMC free article] [PubMed] [Google Scholar]
- 18.Hao Y, Stuart T, Kowalski MH, Choudhary S, Hoffman P, Hartman A, et al. Dictionary learning for integrative, multimodal and scalable single-cell analysis. Nat Biotechnol. Published online May 25, 2023:1–12. doi: 10.1038/s41587-023-01767-y [DOI] [PMC free article] [PubMed] [Google Scholar]
- 19.Windhager J, Bodenmiller B, Eling N. An end-to-end workflow for multiplexed image processing and analysis. Published online November 13, 2021:2021.11.12.468357. doi: 10.1101/2021.11.12.468357 [DOI] [PubMed] [Google Scholar]
- 20.Chijimatsu R, Kobayashi S, Takeda Y, Kitakaze M, Tatekawa S, Arao Y, et al. Establishment of a reference single-cell RNA sequencing dataset for human pancreatic adenocarcinoma. iScience. 2022;25(8):104659. doi: 10.1016/j.isci.2022.104659 [DOI] [PMC free article] [PubMed] [Google Scholar]
- 21.Korsunsky I, Millard N, Fan J, Slowikowski K, Zhang F, Wei K, et al. Fast, sensitive and accurate integration of single-cell data with Harmony. Nat Methods. 2019;16(12):1289–1296. doi: 10.1038/s41592-019-0619-0 [DOI] [PMC free article] [PubMed] [Google Scholar]
- 22.Cheng S, Li Z, Gao R, Xing B, Gao Y, Yang Y, et al. A pan-cancer single-cell transcriptional atlas of tumor infiltrating myeloid cells. Cell. 2021;184(3):792–809.e23. doi: 10.1016/j.cell.2021.01.010 [DOI] [PubMed] [Google Scholar]
- 23.Korotkevich G, Sukhov V, Budin N, Shpak B, Artyomov MN, Sergushichev A. Fast gene set enrichment analysis. Published online February 1, 2021:060012. doi: 10.1101/060012 [DOI] [Google Scholar]
- 24.Liberzon A, Birger C, Thorvaldsdóttir H, Ghandi M, Mesirov JP, Tamayo P. The Molecular Signatures Database (MSigDB) hallmark gene set collection. Cell Syst. 2015;1(6):417–425. doi: 10.1016/j.cels.2015.12.004 [DOI] [PMC free article] [PubMed] [Google Scholar]
- 25.Newman AM, Steen CB, Liu CL, Gentles AJ, Chaudhuri AA, Scherer F, et al. Determining cell type abundance and expression from bulk tissues with digital cytometry. Nat Biotechnol. 2019;37(7):773–782. doi: 10.1038/s41587-019-0114-2 [DOI] [PMC free article] [PubMed] [Google Scholar]
- 26.Jin S, Guerrero-Juarez CF, Zhang L, Chang I, Ramos R, Kuan CH, et al. Inference and analysis of cell-cell communication using CellChat. Nat Commun. 2021;12(1):1088. doi: 10.1038/s41467-021-21246-9 [DOI] [PMC free article] [PubMed] [Google Scholar]
- 27.Cui Zhou D, Jayasinghe RG, Chen S, Herndon JM, Iglesia MD, Navale P, et al. Spatially restricted drivers and transitional cell populations cooperate with the microenvironment in untreated and chemo-resistant pancreatic cancer. Nat Genet. 2022;54(9):1390–1405. doi: 10.1038/s41588-022-01157-1 [DOI] [PMC free article] [PubMed] [Google Scholar]
- 28.Koong AC, Mehta VK, Le QT, Fisher GA, Terris DJ, Brown JM, et al. Pancreatic tumors show high levels of hypoxia. Int J Radiat Oncol Biol Phys. 2000;48(4):919–922. doi: 10.1016/s0360-3016(00)00803-8 [DOI] [PubMed] [Google Scholar]
- 29.Kahn BM, Lucas A, Alur RG, Wengyn MD, Schwartz GW, Li J, et al. The vascular landscape of human cancer. J Clin Invest. 2021;131(2):e136655, 136655. doi: 10.1172/JCI136655 [DOI] [PMC free article] [PubMed] [Google Scholar]
- 30.Kumar S, Sharife H, Kreisel T, Mogilevsky M, Bar-Lev L, Grunewald M, et al. Intra-Tumoral Metabolic Zonation and Resultant Phenotypic Diversification Are Dictated by Blood Vessel Proximity. Cell Metab. 2019;30(1):201–211.e6. doi: 10.1016/j.cmet.2019.04.003 [DOI] [PubMed] [Google Scholar]
- 31.Jain IH, Calvo SE, Markhard AL, Skinner OS, To TL, Ast T, et al. Genetic screen for cell fitness in high or low oxygen highlights mitochondrial and lipid metabolism. Cell. 2020;181(3):716–727.e11. doi: 10.1016/j.cell.2020.03.029 [DOI] [PMC free article] [PubMed] [Google Scholar]
- 32.Di Maggio F, Arumugam P, Delvecchio FR, Batista S, Lechertier T, Hodivala-Dilke K, et al. Pancreatic stellate cells regulate blood vessel density in the stroma of pancreatic ductal adenocarcinoma. Pancreatology. 2016;16(6):995–1004. doi: 10.1016/j.pan.2016.05.393 [DOI] [PMC free article] [PubMed] [Google Scholar]
- 33.Wu Y, Zhang C, Jiang K, Werner J, Bazhin AV, D’Haese JG. The Role of Stellate Cells in Pancreatic Ductal Adenocarcinoma: Targeting Perspectives. Front Oncol. 2021;10:621937. doi: 10.3389/fonc.2020.621937 [DOI] [PMC free article] [PubMed] [Google Scholar]
- 34.Chen L, Fu C, Zhang Q, He C, Zhang F, Wei Q. The role of CD44 in pathological angiogenesis. FASEB J. 2020;34(10):13125–13139. doi: 10.1096/fj.202000380RR [DOI] [PubMed] [Google Scholar]
- 35.Ludwig N, Szczepanski MJ, Gluszko A, Szafarowski T, Azambuja JH, Dolg L, et al. CD44(+) tumor cells promote early angiogenesis in head and neck squamous cell carcinoma. Cancer Lett. 2019;467:85–95. doi: 10.1016/j.canlet.2019.10.010 [DOI] [PubMed] [Google Scholar]
- 36.Zhang Q, Chen L, Huang L, Cheng H, Wang L, Xu L, et al. CD44 promotes angiogenesis in myocardial infarction through regulating plasma exosome uptake and further enhancing FGFR2 signaling transduction. Mol Med. 2022;28(1):145. doi: 10.1186/s10020-022-00575-5 [DOI] [PMC free article] [PubMed] [Google Scholar]
- 37.Zhang Q, Cheng S, Wang Y, Wang M, Lu Y, Wen Z, et al. Interrogation of the microenvironmental landscape in spinal ependymomas reveals dual functions of tumor-associated macrophages. Nat Commun. 2021;12(1):6867. doi: 10.1038/s41467-021-27018-9 [DOI] [PMC free article] [PubMed] [Google Scholar]
- 38.Werba G, Weissinger D, Kawaler EA, Zhao E, Kalfakakou D, Dhara S, et al. Single-cell RNA sequencing reveals the effects of chemotherapy on human pancreatic adenocarcinoma and its tumor microenvironment. Nat Commun. 2023;14(1):797. doi: 10.1038/s41467-023-36296-4 [DOI] [PMC free article] [PubMed] [Google Scholar]
- 39.Stromnes IM, Hulbert A, Pierce RH, Greenberg PD, Hingorani SR. T-cell localization, activation, and clonal expansion in human pancreatic ductal adenocarcinoma. Cancer Immunol Res. 2017;5(11):978. doi: 10.1158/2326-6066.CIR-16-0322 [DOI] [PMC free article] [PubMed] [Google Scholar]
- 40.Chen C, Zhao S, Karnad A, Freeman JW. The biology and role of CD44 in cancer progression: therapeutic implications. J Hematol OncolJ Hematol Oncol. 2018;11:64. doi: 10.1186/s13045-018-0605-5 [DOI] [PMC free article] [PubMed] [Google Scholar]
- 41.Vachon E, Martin R, Plumb J, Kwok V, Vandivier RW, Glogauer M, et al. CD44 is a phagocytic receptor. Blood. 2006;107(10):4149–4158. doi: 10.1182/blood-2005-09-3808 [DOI] [PubMed] [Google Scholar]
- 42.Fu Q, Wei Z, Xiao P, Chen Y, Liu X. CD44 enhances macrophage phagocytosis and plays a protective role in Streptococcus equi subsp. zooepidemicus infection. Vet Microbiol. 2017;198:121–126. doi: 10.1016/j.vetmic.2016.12.030 [DOI] [PubMed] [Google Scholar]
- 43.Bousoik E, Qadri M, Elsaid KA. CD44 Receptor Mediates Urate Crystal Phagocytosis by Macrophages and Regulates Inflammation in A Murine Peritoneal Model of Acute Gout. Sci Rep. 2020;10(1):5748. doi: 10.1038/s41598-020-62727-z [DOI] [PMC free article] [PubMed] [Google Scholar]
- 44.Vaish U, Jain T, Are AC, Dudeja V. Cancer-Associated Fibroblasts in Pancreatic Ductal Adenocarcinoma: An Update on Heterogeneity and Therapeutic Targeting. Int J Mol Sci. 2021;22(24):13408. doi: 10.3390/ijms222413408 [DOI] [PMC free article] [PubMed] [Google Scholar]
- 45.Elyada E, Bolisetty M, Laise P, Flynn WF, Courtois ET, Burkhart RA, et al. Cross-species single-cell analysis of pancreatic ductal adenocarcinoma reveals antigen-presenting cancer-associated fibroblasts. Cancer Discov. 2019;9(8):1102–1123. doi: 10.1158/2159-8290.CD-19-0094 [DOI] [PMC free article] [PubMed] [Google Scholar]
- 46.Mathew E, Zhang Y, Holtz AM, Kane KT, Song JY, Allen BL, et al. Dosage-Dependent Regulation of Pancreatic Cancer Growth and Angiogenesis by Hedgehog Signaling. Cell Rep. 2014;9(2):484–494. doi: 10.1016/j.celrep.2014.09.010 [DOI] [PMC free article] [PubMed] [Google Scholar]
- 47.Annese T, Tamma R, Ruggieri S, Ribatti D. Angiogenesis in Pancreatic Cancer: Pre-Clinical and Clinical Studies. Cancers. 2019;11(3):381. doi: 10.3390/cancers11030381 [DOI] [PMC free article] [PubMed] [Google Scholar]
Associated Data
This section collects any data citations, data availability statements, or supplementary materials included in this article.
Supplementary Materials
Data Availability Statement
Pathology images, raw image data, compensated/hot pixel-removed image data, cell segmentation masks, and Seurat objects containing the signal intensities, cell type and neighborhood annotations, and UMAP reductions are publicly available to download at https://zenodo.org/records/10246315. Pathology images include a hematoxylin and eosin stained slide scanned at 40x for each case along with consecutive IHC slides and brightfield images showing selection of ROIs for each case.
Expression profile data analyzed in this study were obtained from Gene Expression Omnibus (GEO) at GSE154763, zenodo.org/record/6024273, phs002371.v1.p1, and The Cancer Genome Atlas (TCGA, https://portal.gdc.cancer.gov/) as noted in the respective methods above. Source code for data processing and figure generation can be made available upon request to the corresponding author.