

Summary
Sepsis survivors are at high risk for infection-related rehospitalization and mortality for years following the resolution of the acute septic event. These infection-causing microorganisms generally do not cause disease in immunocompetent hosts, suggesting that the post-septic immune response is compromised. Given the importance of CD4 T cells in the development of long-lasting protective immunity, we analyzed their post-septic function. Here we showed that sepsis induced chronic increased and non-specific production of IL-17 by CD4 T cells, resulting in the inability to mount an effective immune response to a secondary pneumonia challenge. Altered cell function was associated with metabolic reprogramming, characterized by mitochondrial dysfunction and increased glycolysis. This metabolic reprogramming began during the acute septic event and persisted long after sepsis had resolved. Our findings reveal cell metabolism as a potential therapeutic target. Given the critical role of cell metabolism in the physiological and pathophysiological processes of immune cells, these findings reveal a potential new therapeutic target to help mitigate sepsis survivors’ susceptibility to secondary infections.
Subject areas: Physiology, Molecular biology, Immunology, Components of the immune system
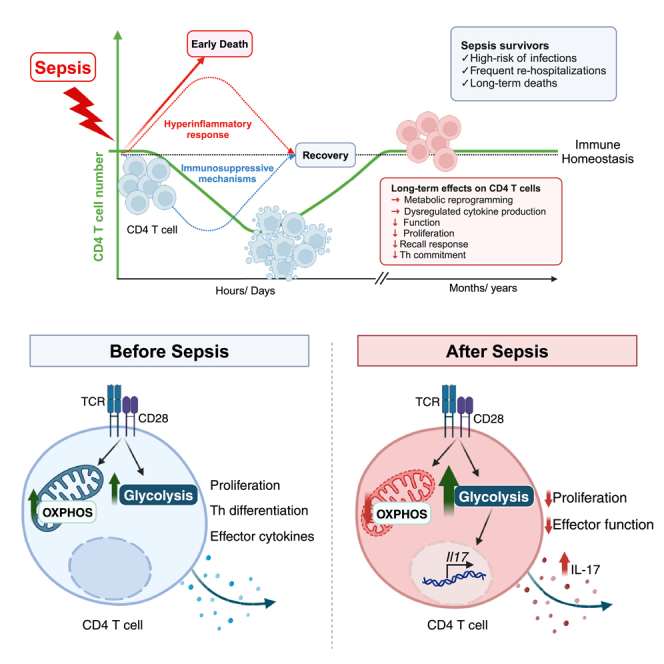
Graphical abstract
Highlights
-
•
Sepsis survivors demonstrate dysfunctional CD4 T cell immunity
-
•
Sepsis induces persistent mitochondrial dysfunction in CD4 T cells
-
•
Post-septic CD4 T cells are highly glycolytic and exhibit a Th17 phenotype
-
•
Sepsis impairs the CD4 T cell recall response
Physiology; Molecular biology; Immunology; Components of the immune system
Introduction
Advances in critical care medicine have substantially increased the survival rate of patients diagnosed with sepsis. However, these medical advances have not addressed the increase in morbidity and mortality seen in post-sepsis survivors. Individuals who survived sepsis are at high risk of infection-related rehospitalization for years after the septic event has occurred, which are primarily due to pneumonia or urinary tract infection.1,2 Further evidence from animal models shows that the immune response to viruses3,4 and autoantigens5 are diminished weeks to months following sepsis. Altogether, this indicates that the post-sepsis increased susceptibility to infections can be attributed to suppressed immune responses.
The acute phase of sepsis is characterized by a robust cytokine-mediated hyperinflammatory process followed by a phase of immunosuppression. Both innate and adaptive immune cells are affected during these phases, and it is believed that the immunosuppressive phase persists chronically in sepsis survivors. Sepsis suppresses Il12 expression in dendritic cells, which then fail to promote Th1 immune responses important for protection during bacterial and viral infections.6 Sepsis-induced epigenetic alterations can also affect bone marrow progenitors and cause persistent impairments in macrophage function.7 Moreover, both T and B cells undergo apoptosis during sepsis, which dramatically reduces the number of these cells in lymphoid tissues.8 After sepsis resolution, the absolute number of lymphocytes are recovered, but T cell function remains compromised.9,10 This includes impairments in CD4 T cell effector function and repertoire diversity, modified composition of naive antigen-specific cell pools and altered the representation of Th1, Th2 and Th17 subsets.8 CD4 T cells are core participants in the development of cellular and humoral immune responses against infection and are pivotal for long-lasting protection. Thus, sepsis-induced alterations in CD4 T cell function likely contributes to the increased susceptibility to secondary infections.
Upon recognizing a specific antigen, T cells undergo expansion and differentiation into effector cells. These effector cells are responsible for directed killing and cytokine production, and some effector cells become memory cells that provide long-term protection.11 This activation and differentiation are tightly regulated by growth factors, cytokines, specific receptors, and metabolic pathways. Recent studies have demonstrated that metabolic reprogramming is intimately integrated with T cell activation, differentiation, and cell fate determination.12,13,14 Naive T cells primarily use mitochondrial glucose catabolism via the tricarboxylic acid (TCA) cycle and oxidative phosphorylation (OXPHOS). Following TCR ligation, co-stimulation and cytokine signaling, the T cell metabolic program shifts to support anabolic growth through increased aerobic glycolysis and OXPHOS activity. During infection, the differentiation of CD4 T cells into effector phenotypes, including Th1 or Th17, is accompanied by a substantial increase in glycolysis. This metabolic shift supports the subsequent production of the pro-inflammatory cytokines IFNγ and IL-17, which are crucial to mount an effective immune response against pathogens.15 After pathogen clearance, most effector T cells undergo apoptosis, with only a small fraction differentiating into long-lived memory cells. Memory T cells, similar to quiescent naive T cells, rely on mitochondrial OXPHOS for energy. However, after antigen rechallenge, memory cells rapidly increase OXPHOS and glycolytic activity to facilitate expansion and effector function.14
Sepsis-induced impairment in leukocyte function has recently been associated with alterations in cell metabolism and mitochondrial dysfunction.16 Significant mitochondrial membrane depolarization was observed in the monocytes of septic patients and was associated with cell apoptosis and severity of disease.17 In addition, tolerant monocytes from septic patients show severe defects in cellular energy metabolism, which results in an impaired ability to respond to secondary stimulation.18 In general, studies exploring immune cell metabolism in sepsis are limited to the investigation of total PBMCs or monocytes within a few hours or days after the onset of sepsis, while cells continue to be exposed to a hyperinflammatory milieu. One recent study demonstrated that sepsis-induced mitochondrial dysfunction was linked to long-term muscle weakness in sepsis survivors.19 This report raised our interest in the long-term consequences of sepsis on cell metabolism, considering that very little is known about the metabolic status of immune cells following recovery from sepsis. Even though many studies have demonstrated the role of innate and adaptive cells in post-sepsis immunosuppression, the underlying mechanisms that cause persistent changes in T cell immunity following sepsis are currently unknown.
Immunosuppression commonly manifests as flawed cell activation, reduced the expression of genes encoding pro-inflammatory cytokines and chemokines, increased the expression of anti-inflammatory genes, and lymphocyte anergy.8 Infections, including sepsis, trigger immune cell metabolic reprogramming toward glycolysis, which favors cell activation and effector function. Once the infection is cleared, immune cells should shift back toward OXPHOS as the primary source of metabolism. The mechanisms for reestablishing resting metabolism are crucial to maintain immunological homeostasis and restore appropriate cell function.20 CD4 T cells are critical to forming an effective and protective immune response during infection, and cell metabolism is intricately linked to T cell activation, function, and memory pool establishment. Therefore, we sought to investigate the impact of sepsis on CD4 T cell metabolism and function to better understand its role in long-term morbidities and mortality associated with sepsis. We identified that sepsis induced long-lasting reprograming of CD4 T cell metabolism, characterized by the continuous activation of glycolysis and mitochondrial damage. This highly energetic phenotype led to the dysregulated production of IL-17 and consequently impaired proper CD4 T cell function. Thus, targeting cell metabolism during and after sepsis is a potential therapeutic approach to mitigate sepsis survivors’ susceptibility to secondary infections.
Results
Sepsis induced a transient leukopenia and affected the frequency and phenotype of CD4 T cells
In this study, we adapted a recently developed non-surgical model of sepsis in which mice were injected with a bolus of cecal slurry (CS).21 A series of different CS doses were administered to mice to titrate the severity of the model, and a high dose of heat-killed CS (hk-CS) preparation was used as a control. The CS preparation was lethal as soon as 24h after injection, whereas hk-CS was not. Lethal doses of CS caused a severe drop in body temperature paired with a high clinical score, using the modified Mouse Sepsis Score (MSS-22). (Figure S1). Optimization of this model to mimic ICU-like sepsis included a therapeutic resuscitation regimen (Figure 1A). Antibiotic and fluid administration was initiated 12h after CS injection and was continued twice daily for 4 days.21 The addition of this resuscitation regimen still resulted in a dramatic body temperature drop and high clinical score in the first 72h, yet efficiently cleared the bacterial blood infection by day 4 and promoted a high survival rate (67.2%) (Figures 1B–1E). Indicators of the severity of disease in this model are weight loss, increased the plasma concentration of inflammatory cytokines (Figures 1F and 1G) and ALT (Figure 1H), a common marker of liver damage that is suggestive of organ injury.
Figure 1.

Sepsis-induced leukopenia and alterations in CD4 T cells subsets
(A) Schematic protocol diagram for the assessment of long-term sepsis survivors. Sepsis is induced by the i.p. injection of cecal slurry (CS) and therapeutic resuscitation was initiated after 12h. Resuscitation includes antibiotics and fluids administration and continues twice daily for 4 days (B) Body temperature and (C) Clinical score assessment based on the modified Murine Sepsis Score (MSS) (Shrum, 2014). Control: injection of vehicle (PBS 15% glycerol); hk-CS: injection of heat-killed CS; Sepsis: CS injection.
(D) Culture of blood obtained from mice 3 h, 4 days and 21 days following CS injection.
(E) After sepsis induction survival was monitored for 5 days. Kaplan-Meier Log rank test hk-CS/sepsis group.
(F) Body weight assessment on day 4 post-sepsis induction.
(G) Quantification of IL-6, TNF-α and (H) ALT in plasma samples from controls, mice at 3 days (d3) and 21 days (d21) after sepsis induction.
(I) Flow cytometry analysis of splenocytes showing number of lymphocytes and (J) Frequency of CD4 T cells subsets from controls and septic mice at day 1 and 3 and post-septic mice at day 21 after CS injection. ∗ Comparison of each sepsis group to controls is indicated by an asterisk. (I; J) asterisks with colors corresponding to each cell group compared to respective controls. Mean ± SEM of three-five different experiments are shown; statistical analysis by one-way ANOVA with Bonferroni’s test for multiple comparisons. (A-J) ∗∗∗p ≤ 0.0001; (B) ∗p = 0.0381; (E) ∗∗p = 0.0028; (I) ∗p ≤ 0.0263; (J) ∗p ≤ 0.0354, ∗∗p = 0.0013.
During sepsis, there is a significant loss of leukocytes through apoptosis. Lymphocytes are particularly affected and B cells, CD4, and CD8+ T cell populations are significantly reduced during sepsis. However, total lymphocyte and antigen-specific CD4 T cell numbers are normalized 2-week after sepsis.10,21,23 Here, to study the long-term effects of sepsis on immune cells, we considered mice at 3-week after sepsis as long-term survivors, as these mice recovered baseline values for plasma cytokines, ALT and number of lymphocytes (Figures 1G–1I). Importantly, even though these mice no longer presented clinical signs of disease, a closer look into the CD4 T cell subsets, including naive (Tn - CD62L+CD44−), central memory (Tcm - CD62L+CD44+), effector memory (Tem - CD62L−CD44+) and effector (Teff - CD62L−CD44−), showed persistent alterations in the distribution of these subsets. We observed a significant increase in the effector populations (Teff/Tem) for up to 12 weeks post-sepsis (Figures 1J and S1D). Thus, CD4 T cell were altered not only during early sepsis but remained persistently altered after sepsis had resolved. CD4 T cells are instrumental to a wide variety of immune processes, especially in the context of inflammation and response to infection. Therefore, it is likely that sepsis-induced impairments in CD4 T cell function are linked to the increased infection susceptibility seen in sepsis survivors.
Long-term changes in CD4 T cell function and metabolism after sepsis
Once activated, effector CD4 T cells proliferate and differentiate into different phenotypes, such as Th1, Th2, Th17, follicular Th or Treg, according to the antigen-driven cytokine and costimulatory molecule milieu. Sepsis survivors present an altered CD4 T cell subset distribution compared to controls. Thus, we sought to investigate the functionality of these cells in the context of protective effector responses. Upon in vitro stimulation with αCD3/CD28, CD4 T cells from post-septic mice demonstrated reduced proliferative capacity, with less cells undergoing 3–4 cell divisions, although we could not exclude that this was related to reduced survival of post-septic cells in culture (Figure 2A). Previous studies have identified that post-septic CD4 T cells increase the production of nonspecific cytokines in both Th1 and Th2 inflammation models,10 with increased IL-17 in viral secondary infections regardless of the skewing conditions.23 These results indicate that post-septic CD4 T cells do not properly form effective immune responses, which directly affects immunopathology. Here we cultured CD4 T cells from controls and post-septic mice in skewing conditions that generate Th phenotypes associated with protective responses to infections (i.e., Th1 and Th17). Post-septic cells cultured only with αCD3/CD28 (Th0), showed higher production of IFNγ and IL-17. Additionally, post-septic cells highly produced IL-17 regardless of the stimulatory milieu, including Th0, Th1 or Th17 (Figure 2B), corroborating prior observations that post-septic CD4 T cells are functionally reactive and/or cytokine dysregulation is present. Notably, increased IL-17 production persisted for up to 9-week (S1 E), indicating long-lasting effects of sepsis on CD4 T cell function.
Figure 2.

Long-lasting functional impairments in CD4 T cells after sepsis
(A) CD4 T cells isolated from spleens of controls, septic (d3) and post-sepsis (d21) mice were stimulated in vitro with αCD3/CD28 for 72h. Flow cytometry assessment of cell proliferation using Cell Trace labeling and cell survival using Live/Dead staining.
(B) CD4 T cells were culture in skewing conditions. Th0: αCD3/CD28; Th1: αCD3/CD28, rIL-12 (10 ng/mL), anti-IL-4 (10 μg/mL) or Th17: αCD3/CD28, rIL-6 (10 ng/mL), rIL-23 (10 ng/mL), rTGF-β (5 ng/mL), anti-IL-4 (10 μg/mL) and anti- IFNγ (10 μg/mL). Graphics show ELISA cytokines quantification in the culture supernatants. Extracellular flux assay displaying OCR (oxygen consumption rate) and PER (proton efflux rate): (C) Metabolic phenotype of CD4 T cells ex vivo and stimulated in vitro with αCD3/CD28, and (D) ATP production rate of stimulated cells, based on source: glycolysis ATP (glycoATP) or mitochondrial ATP (mitoATP). ∗Red asterisk and red lines indicate the comparison of glycoATP between groups and black asterisk and line corresponds to glycoATP versus mitoATP. CD4 T cells were skewed in vitro for 72h in media containing glucose 10mM or galactose 10mM (E) cytokines were quantified in the supernatants; (F) and gene expression for the transcription factors Tbet and RORγt were determined by Fold Change over control cells in Th0 condition and glucose media. Mean ± SEM of two-three different experiments are shown; statistical analysis by one-way ANOVA with Bonferroni’s test for multiple comparisons. (A,D)∗∗∗p ≤ 0.0001.
Multiple T cell processes are regulated by cell metabolism and signaling, including activation, differentiation, and maintenance of the memory pool. To investigate if the sepsis-induced dysregulation of CD4 T cells was linked to changes in cell metabolism, we performed an extracellular flux analysis to assess metabolic phenotype. Mitochondrial respiration, or OXPHOS, is shown mainly by oxygen consumption rates (OCRs), whereas proton efflux rate (PER) is a measurement of glycolysis-derived protons extruded into the extracellular medium and correlates with glycolytic activity. By principle, TCR activation and co-stimulation initiates a network of transcriptional and translational changes accompanied by metabolic adaptations characterized by increased OXPHOS and glycolysis.12 Without stimulation (ex vivo), CD4 T cells from control, septic (d3), and post-septic (d21) mice present a low energetic or quiescent phenotype. Following stimulation with αCD3/CD28, the metabolic activity of control cells increases. As expected, CD4 T cells from septic mice (d3), significantly upregulated both glycolysis and OXPHOS to attend to the energetic demand of fighting a massive infection, in contrast to controls. Notably, even after sepsis was resolved (d21), CD4 T cells failed to reset their metabolic program back to homeostasis, instead maintaining a persistently higher metabolic activity compared to control cells (Figure 2C). These results suggest that sepsis-induced metabolic alterations in CD4 T cells are not readily apparent in their quiescent state, but are instead linked to cell activation. Importantly, the failure of CD4 T cells to revert to a lower metabolic state even after the resolution of sepsis indicates that sepsis has a lasting impact on cellular metabolism. Based on these results, we will analyze cell metabolism after in vitro stimulation with αCD3/CD28 for subsequent experiments. By compartmentalizing the ATP source, we observed that although TCR stimulation significantly increased ATP production rate from both glycolysis (glycoATP) and OXPHOS (mitoATP), there were no significant differences in mitoATP between non-septic and septic groups. In contrast, during (d3) and after sepsis (d21), there was a notable increase in glycoATP (Figure 2D).
To investigate if the altered cytokine production was linked to cell metabolism, we skewed control and post-septic CD4 T cells in Th1 or Th17 conditions. Activation of cells under these conditions is known to upregulate glycolysis,24 which is fueled by glucose present in the media. Using galactose rather than glucose in the media forces cells to rely mostly on OXPHOS metabolism to generate ATP rather than glycolysis.24 Galactose is not efficiently metabolized by the glycolysis pathway, requiring additional steps for the conversion of Glucose-6-phospate.25 Skewing cells while glycolysis was effectively blocked did not alter IFNγ production (Figure 2E). However, blocking glycolysis caused a significant reduction in the levels of IL-17 in post-septic (d21) cells (Figure 2E). Gene expression analysis of Th1 and Th17 signature transcription factors Tbx21 and Rorc, respectively, suggested that sepsis reduces the expression of Tbx21 whereas Rorc expression remained unaltered (Figure 2F). Limiting glycolysis by skewing CD4 T cells in galactose media, reverts the inhibition of Tbx21, suggesting a dependence on glycolysis for its regulation. Notably, Rorc expression was unchanged under these conditions. These results indicate that the increased IL-17 production seen in post-septic CD4 T cells was dependent on a functional glycolysis pathway. However, it does not correlate with a direct increase in Rorc expression, suggesting the involvement of additional mechanisms in this process.
Sepsis induced mitochondrial dysfunction in CD4 T cells
Growing evidence indicates that there is severe damage to mitochondria during sepsis, which is associated with organ dysfunction and poor outcomes.26,27,28 Mitochondria are dynamic organelles with roles beyond just fueling cells with energy. Mitochondrial metabolism generates intermediates that are critical for cell signaling pathways, redox signaling and calcium homeostasis.16 Thus, we sought to investigate CD4 T cell mitochondrial morphology and function upon activation in non-septic and septic mice. To assess changes in mitochondrial function, we measured membrane potential (ΔΨm) using a TMRE probe, which permeates only negatively charged polarized mitochondria. Therefore, TMRE uptake is an indicator of gain or loss of mitochondrial functionality.29 We analyzed CD4 T cells in different conditions: unstimulated, stimulated with PMA/Ionomycin for 3h or stimulated for 72h with αCD3/CD28 with and without IL-2, as both CD28 and IL-2 signaling are primary regulators of early metabolic changes in T cells. All stimuli increased mitochondrial membrane activity in control cells. Cells from acutely septic mice had similar TMRE uptake compared to control cells at rest, but had reduced TMRE uptake following activation, indicating ΔΨm alterations or defects in the electron transportation chain (ETC) (Figure S2A).
To broadly determine mitochondrial health and integrity, we combined TMRE incorporation with an assessment of mitochondrial mass by adding the probe MitoTracker Green. With this approach, it is possible to distinguish between healthy and dysfunctional mitochondria.29 Healthy mitochondria are MitoTracker Greenhigh and TMREhigh, whereas dysfunctional mitochondria are MitoTracker Greenhigh and TMRElow. Higher frequency of cells with dysfunctional mitochondria was present in post-septic CD4 T cells (d21 and up to 9-week) compared to non-septic control cells or cells during the acute septic event (d3) (Figures 3A, 3B, S2B, and S2C). We next evaluated mitochondrial health in CD4 T cell subsets between the different exposure groups, including naive (Tn), effector memory (Tem) and central memory cells (Tcm). Tn and Tcm subsets demonstrated the most significant differences in mitochondrial mass and altered function between the groups, with the most dysfunctional mitochondria noted in the Tn and Tcm cells 21 days after the septic event (Figure S2D).
Figure 3.

Sepsis induces long-term alterations in CD4 T cell mitochondria
CD4 T cells were isolated from the spleen of controls, mice 3 days after sepsis induction (d3) and mice 21 days after sepsis induction (d21-sepsis survivors). Cells were stimulated in vitro with αCD3/CD28 for 3 days and then processed for mitochondrial assessment by flow cytometry.
(A) Representative plots showing Mitotracker Green and TMRE staining. Healthy mitochondria are characterized by MitoTracker Greenhigh and TMREhigh whereas dysfunctional mitochondria are MitoTracker Greenhigh and TMRElow. (B) Percentage of cells presenting Healthy and Dysfunctional mitochondria.
(C) Observation of mitochondrial by transmission electron microscopy. Representative micrographs at 2,000X and 6,000X (n = 5/group). Classification of mitochondrial morphology are indicated with the following symbols: normal (black arrowheads), aberrant - indicating densely compacted cristae (green arrows) and empty state with the destruction of cristae with expanded matrix space (red arrows). Percentage of each mitochondrial state is represented in the graphic (right).
(D) Average mitochondrial number per cell.
(E) mitochondrial mass by flow cytometry using Mitotracker Green, (F) mitochondrial function by the incorporation of TMRE (ΔΨm) and (G) Mito-SOX (mitochondrial ROS).
(H) Ratio ΔΨm/Mitochondria mass and mROS/Mitochondria mass was calculated as the ratio of TMRE/Mitotracker MFI or mitoSOX/Mitotracker MFI. Mean ± SEM of two-three different experiments are shown; statistical analysis by one-way ANOVA with Bonferroni’s test for multiple comparisons. (B-G) p ≤ 0.0001; (E,F) p ≤ 0.0061; (G) p = 0.0372.
We next evaluated mitochondrial morphology. Healthy mitochondrial morphology is characterized by the arrangement of the inner mitochondrial membrane in parallel stacks.30 During the acute phase of sepsis (d3), CD4 T cell had several mitochondria with abnormal cristae (aberrant state) that were twirled, compartmentalized, or fused. These features were observed both at low (2,000X-top panel) and larger (6,000×-bottom panel) magnifications (Figure 3C, middle panel). Remarkably, weeks after sepsis was resolved (d21), mitochondrial alterations evolved from aberrant cristae to the absence of cristae (empty state) and vacuole-like structures in the matrix of CD4 T cells (Figure 3C, right panel). A significant reduction was also seen in the number of mitochondria in CD4 T cells from long-term sepsis survivors (d21) (Figure 3D). Mitochondrial mass started to decrease in post-septic cells at 48h of stimulation, with the most prominent effects seen at 72h and 96h (Figure 3E). As observed in d3 cells, d21 CD4 T cells also showed reduced ΔΨm and mROS, both indicators of mitochondrial dysfunction (Figures 3F and 3G). Post-septic cells showed reduced ΔΨm at all time points before and after stimulation, indicating persistent functional mitochondrial defects. To exclude the possibility of these differences being a result of the reduced mass/number of mitochondria, we accounted for the mitochondria loss by displaying the ratio of both ΔΨm or mROS per mitochondrial mass in each sample following 72h of stimulation (Figure 3H). These findings align in timeline with the increased production of IL-17 as mitochondria dysfunction was observed for up to 9-week after sepsis (Figure S2E). Mitochondrial damage in post-septic CD4 T cells seems to be an event that progresses over time after TCR stimulation. This could implicate a failure of CD4 T cells to shift their metabolism to OXPHOS, which is necessary to return to homeostasis after an immune response has concluded.
Mitochondrial dysfunction in CD4 T cells led to increased glycolytic capacity after sepsis
Having established that sepsis caused significant and lasting alterations in the mitochondria of CD4 T cells, we next sought to further understand its metabolic consequences. We measured the expression of CD4 T cell genes encoded by mitochondrial DNA (Mt-DNA) involved in OXPHOS, such as nicotinamide adenine dinucleotide dehydrogenase 1 (Nd1) of complex I, cytochrome c oxidase (Cox3) of complex II and ATPase 6 (Atp6) of complex V. Compared to non-septic controls, expression of these genes was unchanged during acute sepsis (d3), but there was the upregulation of all three genes in long-term sepsis survivors (d21) (Figure 4A). Increased Mt-DNA gene expression has been associated with enhanced mitochondrial biogenesis in an attempt to meet cellular energetic demands or as a compensatory response to a decline in mitochondrial function.31
Figure 4.

Sepsis caused chronic mitochondrial proton-leak and hyper glycolytic metabolism
(A) Quantification of mRNA expression of mitochondrial genes: Mt-Nd1, Mt-Cox3 and Mt-Atp6 in CD4 T cells from septic (d3) and post-septic mice (d21) compared to controls (dotted line).
(B) Extracellular flux assay of CD4 T cells stimulated with αCD3/CD28 for 3 days. Graphic representation of real time OCR from MitoStress test.
(C) Basal OCR and ECAR (extracellular acidification rate).
(D) Metabolic fitness represented by SRC (spare respiratory capacity).
(E) Basal OCR was stablished as 100% and the percentage of OCR dedicated to ATP-linked, Proton Leak or non-mitochondrial oxidation is displayed as percentage of total.
(F) Graphic representation of real time PER from Glycolysis Stress test.
(G) Basal Glycolysis, Induced Glycolysis (after the addition of Glucose) and Compensatory Glycolysis (after the addition of Oligomycin). CD4 T cells stimulated with αCD3/CD28 in 10mM glucose or 10mM galactose media for (H) Real time analyze using ATP Rate Assay.
(I) PER at baseline from mitochondrial activity (left) or glycolysis (right).
(J) ATP production rate based on source: glycolysis ATP (glycoATP) or mitochondrial ATP (mitoATP). Mean ± SEM of two-three different experiments are shown; statistical analysis by one-way ANOVA with Bonferroni’s test for multiple comparisons. (A-J) ∗p ≤ 0.0001; (B)∗∗p = 0.0061; (E)∗p ≤ 0.046; (H)∗∗p = 0.0002; (J)∗p = 0.0172 red-glycoATP, ∗∗∗p < 0.0001 blue-mitoATP.
We next performed an extracellular flux analysis to assess mitochondrial function. CD4 T cells from septic mice (d3) had higher oxygen consumption rates (OCRs) and extracellular acidification rates (ECARs) compared to non-septic controls. Notably, this high mitochondrial activity was maintained long-after the septic event (d21) (Figures 4B and 4C). In addition, d3 and d21 cells exhibited higher metabolic fitness, demonstrated by increased spare respiratory capacity, an indicator of the cellular energy reserve necessary to withstand periods of stress32 (Figure 4D). Increase in basal OCR can be due to an increase in ATP turnover, an increase in proton-leak and/or an increase in non-mitochondrial oxygen consumption. Upon αCD3/CD28 stimulation, CD4 T cells drove over half of their total oxygen consumption through ATP turnover, while the remaining oxygen was consumed by proton-leak through the mitochondrial inner membrane and by non-mitochondrial oxidases. During sepsis, CD4 T cells boost ATP synthesis, which is expected during an immune response in order to augment metabolic activity in the setting of increased energy demand. However, after sepsis is resolved, CD4 T cells do not readjust mitochondrial function and demonstrate a significant increase in proton-leak (Figure 4E). Shifts in oxygen consumption can indicate low ATP demand, lack of substrate or damage to the electron transport chain.33 Proton-leak occurs when protons migrate through the mitochondrial matrix without producing ATP, resulting in the mitochondrial membrane depolarization and uncoupling of oxygen consumption and ATP generation.34 In addition, proton-leak is a necessary mechanism to mitigate ROS production in cells through a protective feedback loop. An increase in ROS generation activates mechanisms that promote proton-leak, which in turn reduces ROS production and limits mitochondrial damage.32,34 These results paired with evidence of ΔΨm alterations and reduced mROS production (Figure 3), suggest that proton-leak is a result of mitochondrial stress or damage. Furthermore, this trait is not only observed during sepsis, but also weeks after the infection and sepsis are resolved.
When mitochondrial respiration cannot meet the cell’s energetic demands, aerobic glycolysis is upregulated to compensate. In support of this, glycolysis was highly activated in CD4 T cells from septic and post-septic mice (Figure 4F), with augmented glycolytic capacity (Figure 4G). It is not surprising that in an inflammatory environment such as sepsis, immune cells would shift their metabolism to a more activated glycolytic state. However, it is noteworthy that post-septic cells sustain a hyper glycolytic phenotype when induced with glucose and retain higher compensatory glycolysis, which may be how post-septic cells compensate for ongoing mitochondrial dysfunction.
We then hypothesized that post-septic cells were highly glycolytic due to mitochondrial dysfunction. To test the capacity of mitochondria to compensate for a lack of glycolysis, we stimulated cells in glucose or galactose media. As shown previously, post-septic cells in glucose-containing media showed higher glycolytic capacity at baseline and when OXPHOS was blocked (with the addition of Rot/AA) (Figure 4H). Post-septic cells cultured in glucose media upregulated glycolysis to a greater extent compared to control cells, but both cells demonstrated reduced glycolysis activity when cultured in galactose media, requiring OXPHOS to supply energy (Figure 4I). Surprisingly, by measuring the ATP rate, we observed that mitochondria from post-septic cells could increase their ATP production rate to compensate for the reduced glycolytic activity (Figure 4J). In summary, post-septic CD4 T cells sustain a highly glycolytic metabolic program. Although we observed signs of mitochondrial dysfunction in d21 cells, by culturing cells in galactose to make glycolysis more difficult, OXPHOS was upregulated to compensate. It is possible that mitochondrial dysfunction was a result of the maintenance of the “activated” phenotype observed in the highly energetic state of post-septic cells. However, further studies are necessary to identify the underlying mechanisms of the post-septic metabolic shift of CD4 T cells and the metabolic consequences of mitochondrial reduced mass, membrane potential and increased proton-leak.
Increased glycolysis was necessary to support elevated IL-17 production by post-septic CD4 T cells
We observed that the sepsis-induced boost in CD4 T cell metabolism, especially glycolysis, persisted in sepsis survivors. This altered metabolism was associated with decreased proliferation and increased production of IL-17. We observed a significant decrease in IL-17 production in cells cultured in galactose. Thus, it is plausible to associate the highly energetic profile of post-septic cells with dysregulated cytokine production. To determine the metabolic route responsible for this phenotype, CD4 T cells were cultured in skewing Th0, Th1 or Th17 conditions in the presence of inhibitors of glycolysis (2-DG) or OXPHOS (Oligomycin, Rotenone/Antimycin). Blockage of glycolysis with 2-DG significantly reduced the production of IL-17 in controls and post-septic cells. Conversely, the inhibition of mitochondrial ATP-synthesis with Oligomycin, blockage of the electron transport chain with Rotenone/Antimycin or combining these inhibitors to cause a complete shut-down of mitochondrial OXPHOS did not affect IL-17 production significantly (Figures 5A–5C). It is important to note that the IL-17 production of post-septic cells in Th1 skewing conditions was not changed by the independent inhibition of glycolysis or OXPHOS, indicating that nonspecific cytokine production is not solely dependent on glycolysis. Based on these results, we conclude that post-septic CD4 T cell’s dysregulated production of IL-17 is dependent on its hyper glycolytic metabolic program, which can sustain energy even when OXPHOS is completely inhibited. Further studies are necessary to better understand the mechanisms regulating the changes in this metabolic program and its link to cytokine production.
Figure 5.

Post-sepsis persistent hyper metabolic state of CD4 T cells supports dysregulated cytokine production
CD4 T cells from controls and post-sepsis mice were cultured in skewing conditions were treated with specific inhibitors of glycolysis or mitochondria OXPHOS: 2-DG (1mM); Oligomycin (0.001μM); Rotenone (0.04 μM) and Antimycin (0.04μM). Quantification of IL-17 in (A) CD4 T cells by flow citometry and (B-C) in the culture supernatants after 4 days of culture. Th0: αCD3/CD28; Th1: αCD3/CD28, rIL-12 (10 ng/mL), anti-IL-4 (10 μg/mL); Th17: αCD3/CD28, rIL-6 (10 ng/mL), rIL-23 (10 ng/mL), rTGF-α (5 ng/mL), anti-IL-4 (10 μg/mL) and anti- IFNγ (10 μg/mL) or Th1: αCD3/CD28, rIL-12 (10 ng/mL) and anti-IL-4 (10 μg/mL). Mean ± SEM of four different experiments is shown; statistical analysis by one-way ANOVA with Bonferroni’s test for multiple comparisons. ∗p ≤ 0.0210; ∗∗p = 0.0057; ∗∗∗p ≤ 0.0001. Black asterisks indicated the difference between control and d21 groups. Red asterisk indicates the difference between RPMI and treatments among d21 samples.
Sepsis impaired the recall response of circulatory CD4 T cells to Klebsiella pneumoniae
Sepsis survivors have an increased risk of hospital re-admissions and late mortality compared to non-septic ICU patients for up to 2 years after hospital discharge.2 The most common causes for re-hospitalization are bacterial pneumonia and urinary tract infections.1 Klebsiella pneumoniae (Kp) is the leading cause of nosocomial gram-negative bacterial pneumonia.35 Thus, to investigate if our sepsis model increased susceptibility to secondary infections, we employed a pulmonary infection with Kp 3-week after sepsis.18,36 Post-septic mice did not exhibit increased mortality or significant weight loss compared to non-septic controls, despite the fact that bacterial burden in the lung of this group was higher (Figures S3A–S3C).
Since sepsis did not alter the survival to a primary challenge with Kp, we sought to investigate if sepsis would affect the CD4 T cell recall response on a second encounter with the pathogen. Thus, mice were immunized with heat-killed Kp (hk-Kp) and separated into two groups: 1) non-septic controls and 2) sepsis survivors. Three weeks after sepsis induction, both groups of mice were infected with live Kp (Figure 6A). Once again, there was no increased susceptibility in post-septic mice compared to non-septic controls. Immunization with hk-Kp was highly protective, increasing survival and reducing weight loss (Figures S3A–S3C). Immunization generates a substantial pool of tissue-resident memory T cells (TRMs), a terminally differentiated and non-circulating population of memory cells, in the lung mucosa and elicits a robust antibody response.36 In the context of Kp infection, TRMs are the frontline of a recall response by producing the cytokine IL-17, which will engage in the recruitment of neutrophils and macrophages to the lung mucosa and enhance their bactericidal function.37
Figure 6.

Sepsis alters CD4 T cell function in response to secondary infection with Klebsiella pneumoniae
(A) Great/Smart mice were immunized i.n. with heat-killed K. pneumoniae (hk-Kp) twice before sepsis induction. Sepsis survivors were infected with 107 CFU of live Kp. After 24h, 5μg of anti-CD4 antibody was injected i.v. into mice 5 min before euthanasia.
(B) Absolut number of circulatory and resident CD4 T cells in the lungs of Kp-infected mice.
(C) Media of fluorescence intensity indicating the expression of CD69 in CD4 T cells.
(D) Frequency of CD4 T cells subsets among circulatory and resident CD4 T cell.
(E) detection of IL-17+ (hNGFR+) cells in lung cells ex vivo and (F) after in vitro restimulation with PMA (50 ng/mL) and Ionomycin (1 mg/mL) (right) or αCD3/CD28 (left).
(G) C57BL/6 mice were immunized with hk-Kp twice before sepsis induction. After 3-week from sepsis induction lungs were obtained and circulatory CD4 T cells (in vivo stained) isolated by cell sorting. These cells were transferred to RAG2−/− mice which were infected with 105 CFU of live Kp.
(H) Lungs were obtained from recipient mice for bacterial burden quantification (CFU) and (I) restimulated in vitro for cytokine assessment in the supernatant. Mean ± SEM of four (A–F) and two (G–I) different experiments are shown; statistical analysis by one-way ANOVA with Bonferroni’s test for multiple comparisons. (B–I) ∗∗p ≤ 0.0064; ∗∗∗p ≤ 0.0003.
Others have demonstrated that sepsis impairs CD4 T responses to infectious pathogens.9,23,38,39 Even though we have not seen differences in survival, it was still plausible that sepsis would alter CD4 T cell effector function in our secondary pneumonia model. We first evaluated the presence of TRM cells by employing an antibody-labeling technique to differentiate between circulatory and lung-infiltrating CD4 T cells (Figure S3D) (Anderson et al., 2014). Immunization with hk-Kp induced an accumulation of TRM (CD4 res) in the lungs, and accumulation of CD4 T cells in the lung draining lymph nodes (LDLN) (Figure S3E). There was no difference in the number of TRM between immunized controls and post-septic mice, but there was a remarkable increase in the circulatory CD4 T cells (CD4 circ) in the lungs of post-septic mice during Kp infection (Figure 6B). The phenotype of TRM cells in the lungs was confirmed by the expression of CD69 (distinctive marker of Kp-induced lung TRM cells-36 and, as expected, circulatory CD4 T cells did not express CD69 (Figure 6C). Upon infection, circulatory CD4 T cells that infiltrate the lungs of immunized mice are comprised mainly of naive cells (Tn) and memory effector cells (Tem). However, in post-septic mice there is a significant increase in effector cells (Teff) and a reduction of Tn (Figure 6D). On the other hand, immunization leads to the enrichment of Tem, with the reduction of Tn subsets in post-septic mice (Figure 6D). Moreover, there are no significant differences in the LDLN subsets between controls and post-septic mice (Figure S3F).
In response to Kp, activated TRM cells rapidly produce IL-17 to control the infection. Surprisingly, the Ag-dependent production of IL-17 by TRM cells was not altered in post-septic mice (Figures 6E and S3G). Conversely, Ag-independent restimulation with TCR-independent activators (PMA/Ionomycin) or non-specific TCR ligands plus co-stimulation (αCD3/28) reproduced the increased production of IL-17 previously observed in splenic CD4 T cells (Figure 6F). These findings suggest that the dysregulated cytokine production in post-septic CD4 T cells is not coupled to an Ag-specific response.
Sepsis caused some significant changes in the circulatory CD4 populations that infiltrated the lung during Kp infection, whereas fully differentiated cells in this tissue were protected. Since TRM cells are the principal producers of IL-17 in the lungs, circulatory CD4 T cells recruited to the lungs during Kp infection may be irrelevant. Nonetheless, to evaluate the extent of alterations that sepsis induced in this population, we isolated circulatory CD4 T cells from hk-Kp immunized mice and transferred them into RAG2−/− mice (Figure 6G). Recipient mice that received post-septic cells were more susceptible to the infection, as evidenced by a higher bacterial burden (Figure 6H). Lung cells of RAG2−/− mice who received cells from post-septic mice had higher production of IL-17 after being restimulated in vitro with hk-Kp, compared to recipients who received cells from non-septic controls (Figure 6I). Hence, sepsis led to chronic functional alterations in circulatory CD4 T cells and dysregulated IL-17 production that was not beneficial for an effective immune response in vivo.
Discussion
Sepsis is a life-threatening condition with high mortality rates worldwide. In the past few years, advances in critical care medicine have contributed substantially to increases in sepsis survival rates. However, not all survivors of sepsis will have the same outcome, and approximately half of these individuals will be re-hospitalized in the next few years, mainly due to pneumonia and urinary tract infections.2 This increased susceptibility to secondary infections suggests that the immune system is suppressed. Thus, understanding the mechanisms and immune components underlying post-septic immunosuppression is crucial for the developing targeted therapeutic interventions. In this study, we show that sepsis caused long-lasting dysregulation of IL-17 production in CD4 T cells that was mediated by the reprogramming of cell metabolism, which impaired CD4 T cell’s ability to form proper immune responses against K. pneumoniae. Therefore, the impairment of CD4 T cells function is, at least in part, responsible for the increased susceptibility to secondary infections among sepsis survivors. We observed this altered phenotype in CD4 T cells persisting for up to 9-week following sepsis onset. How long the effects of sepsis can persist in T cells is unknown. Studies involving sepsis survivors have shown that over 40% of these individuals die within the first 2 years post-diagnosis,1,2,40 showing the critical nature of the initial months after sepsis.
Numerous investigations have demonstrated that diminished innate and adaptive immune function can extend for years beyond the initial septic event. Sepsis-induced epigenetic modifications in bone marrow progenitors contribute to dysfunctional dendritic cell and macrophage responses, compromising antigen presentation, proinflammatory cytokine production, and microbicidal effector function.7,41,42 Sepsis also results in persistently aberrant pro-inflammatory cytokine signaling, including elevated levels of TNF-α and IL-6, which can perpetuate inflammatory cascades and cause tissue damage. Myeloid-derived suppressor cells (MDSCs) are also increased during and after sepsis, which may further exacerbate immune dysfunction.43 In the adaptive compartment, it has been hypothesized that poor T cell responses in the post-septic environment are a result of prolonged immunosuppression. After sepsis-induced lymphopenia, cell numbers are recovered through homeostatic proliferation, which affects the repertoire/composition of all CD4 T cell subsets: naive, effector and memory44 and memory CD8 T cells.45 In addition, increased the expression of inhibitory receptors,46,47 diminished effector function9 and proliferation of Ag-specific memory cells38,45 has also been observed in CD4 and CD8 T cells post-sepsis. However, the intrinsic mechanisms underlying T cell impairments after sepsis are not yet fully understood.
CD4 T cells play multiple essential roles in shaping the protective immune response against a broad range of pathogens. CD4 T cells indirectly regulate the function of other immune cells, including macrophage antimicrobial activities, CD8 cytotoxic responses, and B cell antibody production. Upon antigen recognition, CD4 T cells will acquire effector phenotypes, such as Th1, Th2, Th17, and Treg, depending on the cytokine milieu. Th1 cells are typically differentiated in response to bacterial and viral pulmonary infections, often in conjunction with Th17 cells. Th17 responses, on the other hand, are generally triggered by fungal microbes and serve as the primary Th cell population protecting mucosal sites against infections. In contrast, Th2 cells drive potent humoral immune response against extracellular parasites and allergens, while, Treg cells primarily regulate T cell-driven inflammatory responses.48 Dysfunctional or impaired CD4 T cells significantly compromise effective immune responses, thereby increasing susceptibility to infections. Furthermore, the involvement of Th1 and Th17 cells and their canonical cytokines IFNγ and IL-17, respectively, has been extensively described in autoimmune diseases, both systemic (e.g., lupus erythematosus and rheumatoid arthritis) and organ specific (e.g., multiple sclerosis and Type 1 Diabetes). In addition to the well-studied cytokine IL-17A, Th17 cells produce a variety of other pro-inflammatory cytokines, including IL-21 and IL-22, IL-17B-F, as well as IFNγ and GM-CSF, all of which have the potential to amplify inflammatory responses.49
Here, we show that sepsis causes metabolic reprogramming in CD4 T cells which become persistently hyper glycolytic, even after the infection has resolved and the cells return to homeostasis. We observed post-septic dysregulation of CD4 T cells with the increased production of IL-17 in specific and non-specific skewing conditions and reduced proliferation. During sepsis, the activation of CD4 T cells is proceeded by a shift in metabolism, increasing aerobic glycolysis and OXPHOS, which is necessary to attend to the energetic demand and provide substrates for various cellular processes. Once the infection is cleared and the initial immune response is terminated, surviving cells should transition their metabolism back to OXPHOS, which is necessary to restore cell homeostasis.50 On the contrary, after sepsis, CD4 T cells do not return to a homeostatic resting state, but rather keep their metabolic program highly activated, especially their glycolytic activity. Blocking glycolysis in post-septic CD4 T cells markedly reduced IL-17 production but did not interfere with IFNγ production. This indicates that glycolysis is specifically associated with the abnormal differentiation of Th17 cells. Growing evidence has shown that OXPHOS metabolism is required for the differentiation of Th17 cells in vivo51 and resistance to apoptotic cell death.52 In addition, blocking ATP synthases increases the Foxp3 expression of cells in Th17 skewing conditions, which favors the development of cells with a Treg rather than a Th17 phenotype.51 In this study, although we observed that oligomycin dampened IL-17 production in control cells, it did not reduce IL-17 production in post-septic cells, corroborating our findings that dysregulated IL-17 production by post-septic cells is linked to their high glycolytic metabolism.
At this stage, it is difficult to determine the mechanisms of mitochondrial dysfunction, which could be a product of sepsis-induced errors during mitochondrial genesis or sepsis-induced mitogenesis. Notably, mitochondrial damage progressed over time after the co-stimulation of the TCR and CD28 receptors, which is compatible with the phenotype of chronically stimulated T cells. Chronic activation of T cells in vitro (8–14 days), leads to an initial increase in mitochondrial function, which will progressively decline with continuous activation.53 The inability to maintain mitochondrial OXPHOS in response to TCR activation correlates with an increasing dependency on glycolysis for energy. Consequently, post-sepsis CD4 T cells present a phenotype akin to that of chronically activated cells, characterized by increased glycolysis, mitochondrial dysfunction, and high IL-17 production. Recently, it was reported that the release of Mt-DNA during SARS-CoV-2 infection activates TLR9 and triggers an inflammatory response causing endothelial cell dysfunction.54 This Mt-DNA-induced TLR9 activation in CD4 T cells promotes cell survival via MyD88-NFκB signaling.55 Thus, exploring the role of Mt-DNA in sepsis-induced mitochondrial dysfunction warrants further investigation.
An interesting observation in our study is that sepsis did not impair the number or function of lung CD4 TRM cells. Previously, it was observed that sepsis altered the number and function of Listeria monocytogenes IFNγ+ Ag-specific memory CD4 T cells.38 Another related study showed that sepsis changed the memory CD8 T cell pool, diminishing the number of cells, Ag-dependent and -independent response.45 Both studies were limited to circulating memory cells, so the effects of sepsis on tissue resident cells still needs to be determined. There are two potential explanations for why TRMs are not affected by sepsis. One is that intrinsic TRM cell factors protect this specific population from sepsis-induced apoptosis and deleterious consequences. Alternatively, TRM cells could be protected from the sepsis-induced cytokine storm by its own local environment, whereas circulating cells would be exposed and therefore, impaired by sepsis. In fact, severe sepsis can cause apoptosis and impaired function in tumor-specific CD8 TRM cells.56 However, this study analyzed TRM cells shortly after sepsis and not in long-term sepsis survivors. It is still plausible that a combination of intrinsic TRM factors plus the sheltered environment would protect or allow the reestablishment of the CD4 TRM cells in the lung of hk-Kp immunized mice. On the other hand, circulatory CD4 T cells that infiltrated the lung during Kp infection showed sepsis-related alterations, including a significant increase in the effector population (Teff). This Teff may not have derived from Ag-specific memory cells, given the increase in IL-17 by lung cells following non-specific rather than Ag-specific stimulation. Using the RAG2−/− cell transfer model, we were able to demonstrate that although circulatory CD4 T cells that infiltrated the lungs during Kp infection produced higher concentrations of IL-17, they failed to confer effective protection to the host. The sustained production of IL-17 observed in chronic or persistent infections often leads to tissue damage and inflammation rather than effective pathogen clearance. In these scenarios, excessive IL-17 production can contribute to immune dysfunction, including impaired proliferation and cytokine production by CD4 T cells, ultimately hindering the host’s ability to control infection.49
Th17 cells play a crucial role in immune responses by producing IL-17, which promotes the production of pro-inflammatory cytokines, chemokines, and the recruitment and activation of neutrophils.49 However, dysregulated IL-17 production can lead to chronic inflammatory conditions. Increased IL-17 production in post-septic CD4 T cells has been shown to have deleterious effect on viral immunity, exacerbating immunopathology in lung viral infections.23 Post-sepsis increased the production of IL-17 by CD4 T cells was associated with continual binding of the transcription factor STAT3 to the promoter region of the gene Il17.23 STAT3 regulates Th17 differentiation through different mechanisms, (i) directly binding to the promoter and promoting the expression of the RORγt gene (Rorc)57; (ii) inhibiting Foxp3 expression58 and (iii) directly activating the IL-17 gene promoter (Il17).59 The STAT3 signaling pathway is activated by the cytokine IL-6, which is augmented during sepsis. Additionally, the mTOR/HIF1α axis is involved in the differentiation of Th17 cells through multiple mechanisms, including the modulation of STAT3 and RORγt function, and controlling the gene expression of IL-21 and IL-23R.60 Furthermore, mTORC1 influences Th17 differentiation via the HIF1α-dependent glycolytic pathway, promoting IL-17 production. Inhibition of mTORC1 or glycolytic activity reduces IL-17 production, emphasizing the role of metabolic pathways in Th17 differentiation.15 Thus, sepsis-induced alterations in IL-17 production and Th17 phenotype may be mediated by the mTOR/HIF1α or IL-6/STAT3 signaling pathways without changes in RORγt gene expression.
Collectively, our study provides a comprehensive investigation into the long-term immune dysregulation observed in sepsis survivors. By focusing on the role of CD4 T cells, pivotal players in adaptive immunity, we provide valuable insights into the mechanism underlying post-sepsis immunosuppression and increased susceptibility to secondary infections. The identification of long-term, non-specific increased production of IL-17 is a previously unrecognized aspect of the post-septic immune response. Moreover, the integration between sepsis-induced altered cell metabolism and immune dysregulation further enriches our understanding of the pathological processes at play. Importantly, this study not only delineated a sepsis-induced metabolic switch in CD4 T cells but also demonstrated a persistence of this metabolic phenotype long after the resolution of sepsis. This emphasizes the enduring impact of sepsis on immune function. Here, we showed that CD4 T cell dysfunction and dysregulated cytokine production lead to an inappropriate and inefficient immune response to infection. The fact that mitochondrial damage is a hallmark of poor outcomes following sepsis has led to an increased interest in therapies targeting mitochondrial function during sepsis. By uncovering these critical aspects of post-sepsis immune dysregulation, this study sheds light on the modulation of cellular metabolism during and after sepsis as a promising therapeutic approach to improve life quality and prolong life expectancy for sepsis survivors.
Limitations of the study
This study primarily focuses on the role of CD4 T cells and their dysregulated IL-17 production in post-septic immune dysfunction. However, the immune response involves a complex interplay of various cell types and cytokines, and additional research is needed to elucidate the contributions of other immune cells and signaling pathways in this context. Furthermore, while metabolic reprogramming, particularly mitochondrial dysfunction and increased glycolysis, is implicated in the observed CD4 T cell dysfunction, the precise mechanisms underlying these metabolic alterations remain unclear. One of the future directions of this study will aim to dissect the specific metabolic pathways and regulatory mechanisms involved, focusing on dysregulated IL-17 production. Additionally, the current study primarily investigates the immune response to a secondary pneumonia challenge, but the long-term consequences of altered CD4 T cell function on susceptibility to other infections or inflammatory disorders require further investigation. Overall, while the findings of this study shed light on the immune dysregulation following sepsis, further mechanistic studies are essential to fully understand the underlying molecular and cellular processes and develop targeted therapeutic strategies to improve outcomes in sepsis survivors.
STAR★Methods
Key resources table
| REAGENT or RESOURCE | SOURCE | IDENTIFIER |
|---|---|---|
| Antibodies | ||
| Ultra-LEAF purified anti-mouse IL-4 (clone 11B11) | Biolegend | Cat# 504122; RRID: AB_11150601 |
| Ultra-LEAF purified anti-mouse IFNγ (clone R4-6A2) | Biolegend | Cat# 505709; RRID: AB_2932805 |
| anti-CD16/32 (Fc Block 2.5 μg/mL; clone 93) | Biolegend | Cat# 101320; RRID: AB_1574975 |
| PerCPCy5.5 anti-mouse TCRβ (1 μg/mL; clone H57-597) | Biolegend | Cat# 109228; RRID: AB_1575173 |
| APC anti-mouse CD4 (1 μg/mL; clone RM4.5) | Biolegend | Cat# 100411; RRID: AB_312696 |
| Alexa700 anti-mouse CD4 (5mg/ mouse; clone RM4.4) | Biolegend | Cat# 116022; RRID: AB_2715958 |
| PE anti-mouse CD8 (1 μg/mL; clone 53-6.7) | Biolegend | Cat# 100708; RRID: AB_312747 |
| FITC anti-mouse B220 (1 μg/mL; clone RA3-6B2) | Biolegend | Cat# 103206; RRID: AB_312991 |
| Brilliant violet 605 anti-mouse CD44 (1 μg/mL; clone IM7) | Biolegend | Cat# 103047; RRID: AB_2562451 |
| APC-Cy7 anti-mouse CD62L (1 μg/mL; clone MEL-14) | Biolegend | Cat# 104428; RRID: AB_830799 |
| PE-Cy7 anti-human CD271 (1 μg/mL; hNGFR - IL-17 reporter, clone ME20.4) | Biolegend | Cat# 345110; RRID: AB_11203542 |
| Bacterial and virus strains | ||
| K. pneumoniae (Kp) | ATCC | strain 43816 |
| Chemicals, peptides, and recombinant proteins | ||
| Primaxin (Imipenem-cilastatin) 500mg, USP (i.v.) | Merck | NDC 0006-3516-59 |
| Collagenase A | Roche | Cat# 10103586001 |
| Glucose | Gibco | Cat# A2494001 |
| Galactose | Sigma-Aldrich | Cat# G5388 |
| Dynabeads™ mouse T-cell activator CD3/CD28 | ThemoFisher | Cat# 11452D |
| Recombinant mouse IL-12 | R&D Systems | Cat# 419-ML-010 |
| Recombinant mouse IL-6 | R&D Systems | Cat# 406-ML-005 |
| Recombinant mouse IL-23 | Prepotech | Cat# 200-23 |
| Recombinant mouse TGF-β | R&D Systems | Cat# 7666-MB-005 |
| PMA | Invivogen | Cat# tlrl-pma |
| Ionomycin | Invivogen | Cat# inh-ion |
| MitoTracker™ Green FM | ThermoFisher | Cat# M7514 |
| MitoSOX™ Mitochondrial Superoxide Indicator | ThermoFisher | Cat# M36008 |
| TMRE Mitochondrial Membrane Potential Reagent | Abcam | Cat# ab113852 |
| 2.5% Glutaraldehyde in 0.1M Sodium Cacodylate Buffer, pH 7.4 | Electron Microscopy Sciences | Cat# 15960 |
| Seahorse XF RPMI medium | Agilent | Cat# 103579 |
| Cell-Tack™ | Corning | Cat# 354240 |
| Trizol | ThermoFisher | Cat# 15596018 |
| Oligomycin A | Sigma-Aldrich | Cat# 75351 |
| Carbonylcyanide 4 (trifluoromethoxy)phenylhydrazone (FCCP) | Sigma-Aldrich | Cat# C2920 |
| Rotenone | Sigma-Aldrich | Cat# R8875 |
| Antimycin A | Sigma-Aldrich | Cat# A8674 |
| 2-deoxy-D-glucose (2-DG) | Sigma-Aldrich | Cat# D6134 |
| RPMI 1640 medium | Gibco | Cat# A1049101 |
| Critical commercial assays | ||
| Alanine Aminotransferase Activity Colorimetric/Fluorometric Assay | Biovision | Cat# K752 |
| Mouse IL-17 DuoSet ELISA | R&D Systems | Cat# DY421 |
| Mouse IFNγ DuoSet ELISA | R&D Systems | Cat# DY485 |
| LIVE/DEAD™ Fixable Violet Dead Cell Stain Kit | Thermo Fisher | Cat# L34964 |
| CellTrace™ CFSE Cell Proliferation | Thermo Fisher | Cat# C34554 |
| EasySep™ Dead Cell Removal (Anexin V) Kit | STEMCELL Technologies | Cat# 17899 |
| CD4 isolation kit EasySep™ Mouse CD4+ T Cell Isolation Kit | STEMCELL Technologies | Cat# 19852 |
| iScript | Bio-Rad | Cat# 170-8842 |
| Pierce™ BCA Protein Assay Kits | ThermoFisher | Cat# 23227 |
| Experimental models: Organisms/strains | ||
| C57BL/6J mice | The Jackson Laboratory | 000664 |
| B6.Cg-Rag2tm1.1Cgn/J | The Jackson Laboratory | 008449 |
| il17aSmart/SMART-17A | The Jackson Laboratory | 032406 |
| Oligonucleotides | ||
| ND-1 Taqman Probe | Thermo Fisher | Mm04225274_s1 |
| ATP6 Taqman Probe | Thermo Fisher | Mm03649417_g1 |
| COX3 Taqman Probe | Thermo Fisher | Mm04225261_g1 |
| RORc | Thermo Fisher | Mm01261022_m1 |
| Tbx21 | Thermo Fisher | Mm00450960_m1 |
| Software and algorithms | ||
| Wave software | Agilent | Version 2.6 |
| FlowJo software | Tree Star | Version 10.1 |
| Graphpad Prism 9.0 | GraphPad Prism | Version 9.0 |
Resource availability
Lead contact
Additional information and requests for resources and reagents should be directed to and will be fulfilled by the lead contact, Patricia Assis (pdeassis@med.umich.edu).
Materials availability
This study did not generate new unique reagents.
Data and code availability
-
•
All data reported in this paper will be shared by the lead contact upon request.
-
•
This paper does not report original code.
-
•
Any additional information required to reanalyze the data reported in this work paper is available from the lead contact upon request.
Experimental model and study participant details
Mice
All animal care and use were performed in accordance with the Institutional Animal Care and Use Committee (IACUC) at the University of Michigan (Protocol No. PRO00011769). All mice received water and food ad libitum through the course of the study. Both males and females were equally used in all experiments. Great/Smart mice (Price, et al. 2012) and RAG2-/- mice were obtained from The Jackson Laboratory with ages ranging from 8-12 weeks old.
Preparation of cecal slurry stock
A large volume of cecal slurry (CS) was prepared from the cecal content of donor mice. After dissecting the cecum and collecting its fecal content, this material was resuspended in PBS 10% glycerol at 100 mg/ mL. The resulting mixture was sequentially strained through sterile mesh presenting 810; 380, 210 and 100 μm of pore size, respectively. The final slurry was aliquoted and stored at -80°C until use. To increase consistency, donor mice were all C57BL/6 males (12-16 weeks old) obtained from The Jackson Laboratory and acclimated for 7 days before harvesting the cecum.
Cecal slurry sepsis model
To induce sepsis, mice were injected intraperitoneally (i.p.) with CS21 at a dose that results in 100% lethality. Both male and female mice were used, thus CS volume was adjusted according to body weight. Clinical signs of sepsis observed were development of severe hypothermia (approx. 30°C), mild piloerection, decreased movement, loss of appetite. At 12h after injection, we started resuscitation protocol: antibiotics (imipenem, 1.5 mg/mouse, i.p.) and fluid resuscitation (sterile physiological saline 0.95) and were continued twice a day. Antibiotic administration was continued for at least 4 days, and fluid resuscitation (1 mL s.c.) was continued until body temperature reach 35°C. Septic mice were euthanized at day 3 (d3) after injection and sepsis survivors were euthanized 21 days (d21/week-3) after injection along with non-septic controls (injected with vehicle). In some experiments, sepsis survivors were euthanized on days 42 (week-6), 63 (week-9) and 84 (week-12) after sepsis. Small blood samples were collected to assess bacteria presence 3h, 4 days and 21 days after CS injection. The tail vein was wiped with alcohol and punched with a 28g needle, and 10 μL of blood was collected, diluted in 10 μL of sterile saline and 10 μL were plated in Trypsin Soy Agar plates. Plates were incubated at 37°C for 24h. ALT levels were quantified in the plasma using the Alanine Aminotransferase Activity Colorimetric/Fluorometric Assay.
Immunization and infection with Klebsiella pneumoniae
K. pneumoniae (Kp) ATCC strain 43816 was expanded overnight at 37°C in trypsin soy broth. A new culture was started by adding 200 μL to 50 mL of broth and grown for 2-3h at 37°C and 200 rpm rotation, until the culture reached log phase. We measured the absorbance at 600nm to determine the bacterial concentration. Bacteria suspension was centrifuged at 4,500rpm for 10 min, washed twice with PBS, and re-suspended in 5 mL of PBS. The resulting suspension was incubated at 70°C for 4h to heat kill the bacterial. We quantified the protein using Pierce™ BCA Protein Assay Kits (ThermoFisher) and stored at -80°C aliquots containing 1 mg/mL of heat-killed Kp (hk-Kp). Immunization of mice was performed by intranasal administration of 40 μL of hk-Kp at days 0 and 7 prior to sepsis.
For Kp infection, bacteria were expanded overnight and grown for 2-3h to reach log phase as described above. The concentration of Kp was determined by absorbance at 600nm, and bacterial suspension was pelleted by centrifugation at 4,500 rpm for 10 min, washed twice in sterile PBS, and re-suspended at the desired concentration with sterile PBS. Non-immunized mice were infected with 1x10⁴ CFU intranasally whereas immunized mice were infected with 1x10⁷ CFU. 24 hours after infection mice were euthanized for harvesting of Lungs and Lung draining lymph nodes (LDLN). To access bacterial load, lungs were collected and homogenized in sterile PBS, a serial dilution was prepared, and homogenates were plated in trypsin soy agar and incubated for 24h at 37°C. Individual colonies were counted to determine bacterial CFU in the lungs.
Method details
Murine cell culture
Single-cell suspensions were prepared from whole spleens, lungs and lung draining lymph nodes (LDLN). Lungs and LDLN were first processed with collagenase A (Roche) and all single-cell suspensions were incubated with cold RBC lysis buffer for 1 min. CD4+ T cells were isolated using CD4 isolation kit EasySep™ Mouse CD4+ T Cell Isolation Kit (STEMCELL Technologies), according to the manufacturer’s instructions. Isolated cells were checked for purity by flow cytometry. Depending on the experiment, cells were cultured in supplemented RPMI containing either 10mM of Glucose or 10mM of Galactose. Cells were cultured for 24-96h and skewed as follows: Th0: anti-CD3 and anti-CD28 covered beads - Dynabeads™ mouse T-cell activator CD3/CD28 (ThemoFisher); Th1: anti-CD3/CD28 beads, anti-IL-4 (10 μg/mL) (Biolegend), rIL-12 (10 ng/mL) (R&D Systems); Th17: anti-CD3/CD28 beads, anti-IL-4 (10 μg/mL), anti-IFNγ (10 μg/mL) (Biolegend), rIL-6 (10 ng/mL), rIL-23 (10 ng/mL), rTGF-β (5 ng/mL) (R&D Systems). For lungs and LDLN restimulation in vitro, single-cell suspensions from individual mice were seeded in a 96-well flat-bottom plate and restimulated with heat-killed Kp for 48h, or anti-CD3/CD28 beads for 72h, or PMA (50 ng/mL) and Ionomycin (1 μg/mL) (Invivogen) for 3h.
Cytokine quantification
Culture supernatants were collected after 72h, and mouse plasma was collected on days 3 and 21 after sepsis induction. Cytokines quantification was performed using the mouse IL-17 or IFNγ DuoSet ELISA (R&D Systems) according to manufacturer’s instructions.
Flow cytometry
Analysis of cell surface markers and cytokine expression were detected by staining with fluorescent antibodies in flow cytometry buffer (PBS, 1% FBS, 2mM EDTA). Antibodies used in this study were all purchased from Biolegend: purified anti-CD16/32 (Fc Block), PerCPCy5.5-TCRβ, APC-CD4, Alexa700-CD4, PE-CD8, FITC-B220, Brilliant violet 605-CD44, APC-Cy7-CD62L. Detection of IL-17+ cells was performed using the surface antibody PE-Cy7-hNGFR (IL-17 reporter). For exclusion of dead cells during analysis, cell suspensions were stained with LIVE/DEAD™ Fixable Violet Dead Cell Stain Kit (Thermo Fisher). For proliferation study, cells were incubated with 5 μM of CellTrace™ CFSE prior culture stimulation.
For mitochondrial assessment, cells were incubated in PBS 2% FBS buffer for 20 min. at 37°C with MitoTracker™ Green FM (100nM) and MitoSOX™ (5 μM) (ThermoFisher) or TMRE (200nM) (Abcam) according to manufacture instructions, followed by antibody surface staining. Flow samples were acquired using NovoCyte® 3005 (Agillent) and BD FACSCelesta (BD Biosciences). Data were analyzed with FlowJo software (TreeStar).
Electron microscopy
Splenocytes from non-septic controls, septic (d3) and post-septic mice (d21) were used for isolation of CD4+ T cells. In order to obtain enough cells, each sample consisted of a pool of 5 mice. For stimulation, cells were seeded in 6-well plates and cultured with anti-CD3/CD28 beads (ThermoFisher) for 72h. Dead cells were removed from the cell suspension using EasySep™ Dead Cell Removal (Anexin V) Kit (STEMCELL Technologies). Live cells were treated for 5 min with 2.5% Glutaraldehyde in 0.1M Sodium Cacodylate Buffer, pH 7.4 (Electron Microscopy Sciences), concentrated in 50 μL in the same buffer and processed for electron microscopy. Cells were post-fixed for 1h (1% osmiumtetroxide , 1% potassiumferrocyanide), stained for 1h (2% uranyl acetate), and dehydrated. Samples were dried using Leica EM CPD300 Point Dryer and submitted to sputtering coating surfaces with gold on a Leica EM ACE600. Imaging was performed using JEOL Jem-1400 plus TEM at the University of Michigan Microscopy Core Facility. A total of 20 cells were captured per sample at 2,000X and 6,000X magnification. Pictures obtained were decodified, allowing blind counting. Mitochondria counting was performed in 20 cells per sample.
Seahorse
Seahorse assays were performed using XF-96 Extracellular Flux Analyzer (Agilent). Cells were seeded in 6-well plates and stimulated with anti-CD3/CD28 beads (Thermo Fisher) for 72h. The day prior the assay, sensor cartridges were hydrated with dH2O overnight and then with XF calibrant (Agilent) for 3h in a non-CO2 incubator at 37°C on the day of the assay. Cartridges were loaded with oligomycin (1 μM), carbonyl cyanide p-trifluoromethoxyphenylhydrazone (FCCP) (1.5 μM), and rotenone/antimycin A (0.5 μM) for the Mito stress test (Agilent) or with glucose (10 mM), oligomycin (1 μM), and 2-Deoxy-D-Glucose (2-DG) (50 mM) for the glucose stress test (Agilent) or, rotenone/antimycin A (0.5 μM) and 2-DG (50 mM) for the glycolytic rate assay (Agilent) or, oligomycin (1 μM) and rotenone/antimycin A (0.5 μM) for the ATP Rate Assay (Agilent). After stimulation, dead cells were removed from the cell cultures using EasySep™ Dead Cell Removal (Anexin V) Kit (STEMCELL Technologies). Live CD4+ T cells were washed and resuspended in Seahorse XF RPMI medium (Agilent) and 2x10⁵ cells were seeded in Cell Tack-coated plates and allowed to equilibrate for 30 min in a non-CO2 incubator at 37°C. For the Mito stress test, the metabolic phenotype was determined through basal OCR and ECAR measurements (i.e., before inhibitor treatment). SRC was determined by subtracting basal OCR from maximal OCR measurements. Oxygen consumption linked to ATP synthesis, or to Proton Leak or were non-mitochondrial were calculated using Wave 2.6 software. For the cell energy phenotype, glycolysis stress test, glycolytic rate assay, and ATP rate assay PER measurements were calculated by the GRA Report Generator using Wave 2.6 software.
RNA
Total RNA was isolated by Trizol (ThermoFisher) and reverse transcribed by use of iScript (Bio-Rad). RT-qPCR was performed on an Applied Biosystems 7500 analyzer by use of TaqMan reagents. All genes were normalized to 18S to conduct ΔΔ comparative analysis and results are expressed as Fold Change over reference group.
In vivo/ ex vivo labeling of lung CD4 T cells
We used in vivo staining to discriminate TRM (CD4+ T cells residents at the lung parenchyma) from circulating CD4+ T cells. Briefly, mice were injected intravenously with 5mg of Alexa700 conjugated anti-CD4 antibody diluted in PBS (clone RM4.4) and euthanized after 8 min. After harvesting of the lungs, in vitro staining was performed using APC conjugated anti-CD4 antibody (clone RM4.5). Non-injected mice and splenocytes were used as labeling controls (Figure S3D).
Quantification and statistical analysis
Data were analyzed using Graphpad Prism 9.0 Software. The differences between three or more groups were analyzed by 2-way ANOVA with Bonferroni’s test for multiple comparisons. The differences between 2 groups were verified using the Student t-test for parametric data. Values of P ≤ 0.05 were considered statistically significant. Statistical details can be found in the figure legends.
Acknowledgments
The authors thank the Pathology Flow Cytometry Core for its support and the Microcopy Core for the sample preparation and image acquisition from electron microscopy. We would like to thank Dr. Benjamin Singer for providing the Klebsiella pneumonia strain and Michael Newstead for technical assistance. Graphical Abstract, Figures 1A, 6A and 6G were created with BioRender.com. This study was funded by the Shock Society Faculty Research Award 2022/24.
Author contributions
P.A.A. conceptualized the study, planned, and performed the experiments, analyzed the data, writing and editing the article; R.M.A. performed experiments and analyzed data; M.S. contributed with the conceptualization and design, data interpretation, and revised the article for critical intellectual content. S.L.K. contributed with critical intellectual content, funding acquisition, and resources. J.R.B was the principal investigator, contributing with conceptualization and design, revised the article, and supervision.
Declaration of interests
The authors declare no competing interests.
Published: May 29, 2024
Footnotes
Supplemental information can be found online at https://doi.org/10.1016/j.isci.2024.110114.
Contributor Information
Patricia A. Assis, Email: pdeassis@med.umich.edu.
Jennifer R. Bermick, Email: jennifer-bermick@uiowa.edu.
Supplemental information
References
- 1.Wang T., Derhovanessian A., De Cruz S., Belperio J.A., Deng J.C., Hoo G.S. Subsequent infections in survivors of sepsis: epidemiology and outcomes. J. Intensive Care Med. 2014;29:87–95. doi: 10.1177/0885066612467162. [DOI] [PMC free article] [PubMed] [Google Scholar]
- 2.Prescott H.C., Osterholzer J.J., Langa K.M., Angus D.C., Iwashyna T.J. Late mortality after sepsis: propensity matched cohort study. BMJ. 2016;353 doi: 10.1136/bmj.i2375. [DOI] [PMC free article] [PubMed] [Google Scholar]
- 3.Danahy D.B., Anthony S.M., Jensen I.J., Hartwig S.M., Shan Q., Xue H.H., Harty J.T., Griffith T.S., Badovinac V.P. Polymicrobial sepsis impairs bystander recruitment of effector cells to infected skin despite optimal sensing and alarming function of skin resident memory CD8 T cells. PLoS Pathog. 2017;13 doi: 10.1371/journal.ppat.1006569. [DOI] [PMC free article] [PubMed] [Google Scholar]
- 4.Duong S., Condotta S.A., Rai D., Martin M.D., Griffith T.S., Badovinac V.P. Polymicrobial sepsis alters antigen-dependent and -independent memory CD8 T cell functions. J. Immunol. 2014;192:3618–3625. doi: 10.4049/jimmunol.1303460. [DOI] [PMC free article] [PubMed] [Google Scholar]
- 5.Jensen I.J., Jensen S.N., Sjaastad F.V., Gibson-Corley K.N., Dileepan T., Griffith T.S., Mangalam A.K., Badovinac V.P. Sepsis impedes EAE disease development and diminishes autoantigen-specific naive CD4 T cells. Elife. 2020;9 doi: 10.7554/eLife.55800. [DOI] [PMC free article] [PubMed] [Google Scholar]
- 6.Wen H., Hogaboam C.M., Gauldie J., Kunkel S.L. Severe sepsis exacerbates cell-mediated immunity in the lung due to an altered dendritic cell cytokine profile. Am. J. Pathol. 2006;168:1940–1950. doi: 10.2353/ajpath.2006.051155. [DOI] [PMC free article] [PubMed] [Google Scholar]
- 7.Davis F.M., Schaller M.A., Dendekker A., Joshi A.D., Kimball A.S., Evanoff H., Wilke C., Obi A.T., Melvin W.J., Cavassani K., et al. Sepsis Induces Prolonged Epigenetic Modifications in Bone Marrow and Peripheral Macrophages Impairing Inflammation and Wound Healing. Arterioscler. Thromb. Vasc. Biol. 2019;39:2353–2366. doi: 10.1161/ATVBAHA.119.312754. [DOI] [PMC free article] [PubMed] [Google Scholar]
- 8.Martin M.D., Badovinac V.P., Griffith T.S. CD4 T Cell Responses and the Sepsis-Induced Immunoparalysis State. Front. Immunol. 2020;11:1364. doi: 10.3389/fimmu.2020.01364. [DOI] [PMC free article] [PubMed] [Google Scholar]
- 9.Cabrera-Perez J., Condotta S.A., Badovinac V.P., Griffith T.S. Impact of sepsis on CD4 T cell immunity. J. Leukoc. Biol. 2014;96:767–777. doi: 10.1189/jlb.5MR0114-067R. [DOI] [PMC free article] [PubMed] [Google Scholar]
- 10.Carson W.F., 4th, Cavassani K.A., Ito T., Schaller M., Ishii M., Dou Y., Kunkel S.L. Impaired CD4+ T-cell proliferation and effector function correlates with repressive histone methylation events in a mouse model of severe sepsis. Eur. J. Immunol. 2010;40:998–1010. doi: 10.1002/eji.200939739. [DOI] [PMC free article] [PubMed] [Google Scholar]
- 11.Farber D.L., Yudanin N.A., Restifo N.P. Human memory T cells: generation, compartmentalization and homeostasis. Nat. Rev. Immunol. 2014;14:24–35. doi: 10.1038/nri3567. [DOI] [PMC free article] [PubMed] [Google Scholar]
- 12.Chapman N.M., Boothby M.R., Chi H. Metabolic coordination of T cell quiescence and activation. Nat. Rev. Immunol. 2020;20:55–70. doi: 10.1038/s41577-019-0203-y. [DOI] [PubMed] [Google Scholar]
- 13.Bailis W., Shyer J.A., Zhao J., Canaveras J.C.G., Al Khazal F.J., Qu R., Steach H.R., Bielecki P., Khan O., Jackson R., et al. Distinct modes of mitochondrial metabolism uncouple T cell differentiation and function. Nature. 2019;571:403–407. doi: 10.1038/s41586-019-1311-3. [DOI] [PMC free article] [PubMed] [Google Scholar]
- 14.O'Sullivan D. The metabolic spectrum of memory T cells. Immunol. Cell Biol. 2019;97:636–646. doi: 10.1111/imcb.12274. [DOI] [PubMed] [Google Scholar]
- 15.Wang P., Zhang Q., Tan L., Xu Y., Xie X., Zhao Y. The Regulatory Effects of mTOR Complexes in the Differentiation and Function of CD4(+) T Cell Subsets. J. Immunol. Res. 2020;2020 doi: 10.1155/2020/3406032. [DOI] [PMC free article] [PubMed] [Google Scholar]
- 16.McBride M.A., Owen A.M., Stothers C.L., Hernandez A., Luan L., Burelbach K.R., Patil T.K., Bohannon J.K., Sherwood E.R., Patil N.K. The Metabolic Basis of Immune Dysfunction Following Sepsis and Trauma. Front. Immunol. 2020;11:1043. doi: 10.3389/fimmu.2020.01043. [DOI] [PMC free article] [PubMed] [Google Scholar]
- 17.Adrie C., Bachelet M., Vayssier-Taussat M., Russo-Marie F., Bouchaert I., Adib-Conquy M., Cavaillon J.M., Pinsky M.R., Dhainaut J.F., Polla B.S. Mitochondrial membrane potential and apoptosis peripheral blood monocytes in severe human sepsis. Am. J. Respir. Crit. Care Med. 2001;164:389–395. doi: 10.1164/ajrccm.164.3.2009088. [DOI] [PubMed] [Google Scholar]
- 18.Cheng S.C., Scicluna B.P., Arts R.J.W., Gresnigt M.S., Lachmandas E., Giamarellos-Bourboulis E.J., Kox M., Manjeri G.R., Wagenaars J.A.L., Cremer O.L., et al. Broad defects in the energy metabolism of leukocytes underlie immunoparalysis in sepsis. Nat. Immunol. 2016;17:406–413. doi: 10.1038/ni.3398. [DOI] [PubMed] [Google Scholar]
- 19.Owen A.M., Patel S.P., Smith J.D., Balasuriya B.K., Mori S.F., Hawk G.S., Stromberg A.J., Kuriyama N., Kaneki M., Rabchevsky A.G., et al. Chronic muscle weakness and mitochondrial dysfunction in the absence of sustained atrophy in a preclinical sepsis model. Elife. 2019;8 doi: 10.7554/eLife.49920. [DOI] [PMC free article] [PubMed] [Google Scholar]
- 20.Loftus R.M., Finlay D.K. Immunometabolism: Cellular Metabolism Turns Immune Regulator. J. Biol. Chem. 2016;291:1–10. doi: 10.1074/jbc.R115.693903. [DOI] [PMC free article] [PubMed] [Google Scholar]
- 21.Steele A.M., Starr M.E., Saito H. Late Therapeutic Intervention with Antibiotics and Fluid Resuscitation Allows for a Prolonged Disease Course with High Survival in a Severe Murine Model of Sepsis. Shock. 2017;47:726–734. doi: 10.1097/SHK.0000000000000799. [DOI] [PMC free article] [PubMed] [Google Scholar]
- 22.Shrum B., Anantha R.V., Xu S.X., Donnelly M., Haeryfar S.M.M., McCormick J.K., Mele T. A robust scoring system to evaluate sepsis severity in an animal model. BMC Res. Notes. 2014;7:233. doi: 10.1186/1756-0500-7-233. [DOI] [PMC free article] [PubMed] [Google Scholar]
- 23.Mukherjee S., Allen R.M., Lukacs N.W., Kunkel S.L., Carson W.F., 4th STAT3-mediated IL-17 production by postseptic T cells exacerbates viral immunopathology of the lung. Shock. 2012;38:515–523. doi: 10.1097/SHK.0b013e31826f862c. [DOI] [PMC free article] [PubMed] [Google Scholar]
- 24.Chang C.H., Curtis J.D., Maggi L.B., Jr., Faubert B., Villarino A.V., O'Sullivan D., Huang S.C.C., van der Windt G.J.W., Blagih J., Qiu J., et al. Posttranscriptional control of T cell effector function by aerobic glycolysis. Cell. 2013;153:1239–1251. doi: 10.1016/j.cell.2013.05.016. [DOI] [PMC free article] [PubMed] [Google Scholar]
- 25.Bustamante E., Pedersen P.L. High aerobic glycolysis of rat hepatoma cells in culture: role of mitochondrial hexokinase. Proc. Natl. Acad. Sci. USA. 1977;74:3735–3739. doi: 10.1073/pnas.74.9.3735. [DOI] [PMC free article] [PubMed] [Google Scholar]
- 26.Preau S., Vodovar D., Jung B., Lancel S., Zafrani L., Flatres A., Oualha M., Voiriot G., Jouan Y., Joffre J., et al. Energetic dysfunction in sepsis: a narrative review. Ann. Intensive Care. 2021;11:104. doi: 10.1186/s13613-021-00893-7. [DOI] [PMC free article] [PubMed] [Google Scholar]
- 27.Rahmel T., Marko B., Nowak H., Bergmann L., Thon P., Rump K., Kreimendahl S., Rassow J., Peters J., Singer M., et al. Mitochondrial dysfunction in sepsis is associated with diminished intramitochondrial TFAM despite its increased cellular expression. Sci. Rep. 2020;10 doi: 10.1038/s41598-020-78195-4. [DOI] [PMC free article] [PubMed] [Google Scholar]
- 28.Zhang H., Feng Y.W., Yao Y.M. Potential therapy strategy: targeting mitochondrial dysfunction in sepsis. Mil. Med. Res. 2018;5:41. doi: 10.1186/s40779-018-0187-0. [DOI] [PMC free article] [PubMed] [Google Scholar]
- 29.Monteiro L.d.B., Davanzo G.G., de Aguiar C.F., Moraes-Vieira P.M.M. Using flow cytometry for mitochondrial assays. MethodsX. 2020;7 doi: 10.1016/j.mex.2020.100938. [DOI] [PMC free article] [PubMed] [Google Scholar]
- 30.Jiang Y.F., Lin S.S., Chen J.M., Tsai H.Z., Hsieh T.S., Fu C.Y. Electron tomographic analysis reveals ultrastructural features of mitochondrial cristae architecture which reflect energetic state and aging. Sci. Rep. 2017;7 doi: 10.1038/srep45474. [DOI] [PMC free article] [PubMed] [Google Scholar]
- 31.Popov L.D. Mitochondrial biogenesis: An update. J. Cell Mol. Med. 2020;24:4892–4899. doi: 10.1111/jcmm.15194. [DOI] [PMC free article] [PubMed] [Google Scholar]
- 32.Divakaruni A.S., Jastroch M. A practical guide for the analysis, standardization and interpretation of oxygen consumption measurements. Nat. Metab. 2022;4:978–994. doi: 10.1038/s42255-022-00619-4. [DOI] [PMC free article] [PubMed] [Google Scholar]
- 33.Hill B.G., Benavides G.A., Lancaster J.R., Jr., Ballinger S., Dell'Italia L., Jianhua Z., Darley-Usmar V.M. Integration of cellular bioenergetics with mitochondrial quality control and autophagy. Biol. Chem. 2012;393:1485–1512. doi: 10.1515/hsz-2012-0198. [DOI] [PMC free article] [PubMed] [Google Scholar]
- 34.Cheng J., Nanayakkara G., Shao Y., Cueto R., Wang L., Yang W.Y., Tian Y., Wang H., Yang X. Mitochondrial Proton Leak Plays a Critical Role in Pathogenesis of Cardiovascular Diseases. Adv. Exp. Med. Biol. 2017;982:359–370. doi: 10.1007/978-3-319-55330-6_20. [DOI] [PMC free article] [PubMed] [Google Scholar]
- 35.Denstaedt S.J., Singer B.H., Standiford T.J. Sepsis and Nosocomial Infection: Patient Characteristics, Mechanisms, and Modulation. Front. Immunol. 2018;9:2446. doi: 10.3389/fimmu.2018.02446. [DOI] [PMC free article] [PubMed] [Google Scholar]
- 36.Amezcua Vesely M.C., Pallis P., Bielecki P., Low J.S., Zhao J., Harman C.C.D., Kroehling L., Jackson R., Bailis W., Licona-Limón P., et al. Effector T(H)17 Cells Give Rise to Long-Lived T(RM) Cells that Are Essential for an Immediate Response against Bacterial Infection. Cell. 2019;178:1176–1188.e15. doi: 10.1016/j.cell.2019.07.032. [DOI] [PMC free article] [PubMed] [Google Scholar]
- 37.Bengoechea J.A., Sa Pessoa J. Klebsiella pneumoniae infection biology: living to counteract host defences. FEMS Microbiol. Rev. 2019;43:123–144. doi: 10.1093/femsre/fuy043. [DOI] [PMC free article] [PubMed] [Google Scholar]
- 38.Sjaastad F.V., Jensen I.J., Berton R.R., Badovinac V.P., Griffith T.S. Inducing Experimental Polymicrobial Sepsis by Cecal Ligation and Puncture. Curr. Protoc. Immunol. 2020;131 doi: 10.1002/cpim.110. [DOI] [PMC free article] [PubMed] [Google Scholar]
- 39.Jensen I.J., Winborn C.S., Fosdick M.G., Shao P., Tremblay M.M., Shan Q., Tripathy S.K., Snyder C.M., Xue H.H., Griffith T.S., et al. Polymicrobial sepsis influences NK-cell-mediated immunity by diminishing NK-cell-intrinsic receptor-mediated effector responses to viral ligands or infections. PLoS Pathog. 2018;14 doi: 10.1371/journal.ppat.1007405. [DOI] [PMC free article] [PubMed] [Google Scholar]
- 40.Farrah K., McIntyre L., Doig C.J., Talarico R., Taljaard M., Krahn M., Fergusson D., Forster A.J., Coyle D., Thavorn K. Sepsis-Associated Mortality, Resource Use, and Healthcare Costs: A Propensity-Matched Cohort Study. Crit. Care Med. 2021;49:215–227. doi: 10.1097/CCM.0000000000004777. [DOI] [PubMed] [Google Scholar]
- 41.Carson W.F., Cavassani K.A., Dou Y., Kunkel S.L. Epigenetic regulation of immune cell functions during post-septic immunosuppression. Epigenetics. 2011;6:273–283. doi: 10.4161/epi.6.3.14017. [DOI] [PMC free article] [PubMed] [Google Scholar]
- 42.Nascimento D.C., Viacava P.R., Ferreira R.G., Damaceno M.A., Piñeros A.R., Melo P.H., Donate P.B., Toller-Kawahisa J.E., Zoppi D., Veras F.P., et al. Sepsis expands a CD39(+) plasmablast population that promotes immunosuppression via adenosine-mediated inhibition of macrophage antimicrobial activity. Immunity. 2021;54:2024–2041.e8. doi: 10.1016/j.immuni.2021.08.005. [DOI] [PubMed] [Google Scholar]
- 43.Venet F., Demaret J., Gossez M., Monneret G. Myeloid cells in sepsis-acquired immunodeficiency. Ann. N. Y. Acad. Sci. 2021;1499:3–17. doi: 10.1111/nyas.14333. [DOI] [PubMed] [Google Scholar]
- 44.Jensen I.J., Farber D.L. Gutsy memory T cells stand their ground against pathogens. Sci. Immunol. 2022;7 doi: 10.1126/sciimmunol.ade7168. [DOI] [PubMed] [Google Scholar]
- 45.Moioffer S.J., Berton R.R., McGonagill P.W., Jensen I.J., Griffith T.S., Badovinac V.P. Inefficient Recovery of Repeatedly Stimulated Memory CD8 T Cells after Polymicrobial Sepsis Induction Leads to Changes in Memory CD8 T Cell Pool Composition. J. Immunol. 2023;210:168–179. doi: 10.4049/jimmunol.2200676. [DOI] [PMC free article] [PubMed] [Google Scholar]
- 46.Chen C.W., Mittal R., Klingensmith N.J., Burd E.M., Terhorst C., Martin G.S., Coopersmith C.M., Ford M.L. Cutting Edge: 2B4-Mediated Coinhibition of CD4(+) T Cells Underlies Mortality in Experimental Sepsis. J. Immunol. 2017;199:1961–1966. doi: 10.4049/jimmunol.1700375. [DOI] [PMC free article] [PubMed] [Google Scholar]
- 47.Spec A., Shindo Y., Burnham C.A.D., Wilson S., Ablordeppey E.A., Beiter E.R., Chang K., Drewry A.M., Hotchkiss R.S. T cells from patients with Candida sepsis display a suppressive immunophenotype. Crit. Care. 2016;20:15. doi: 10.1186/s13054-016-1182-z. [DOI] [PMC free article] [PubMed] [Google Scholar]
- 48.Sun L., Su Y., Jiao A., Wang X., Zhang B. T cells in health and disease. Signal Transduct. Targeted. Ther. 2023;8:235. doi: 10.1038/s41392-023-01471-y. [DOI] [PMC free article] [PubMed] [Google Scholar]
- 49.Mills K.H.G. IL-17 and IL-17-producing cells in protection versus pathology. Nat. Rev. Immunol. 2023;23:38–54. doi: 10.1038/s41577-022-00746-9. [DOI] [PMC free article] [PubMed] [Google Scholar]
- 50.Mills E.L., Kelly B., O'Neill L.A.J. Mitochondria are the powerhouses of immunity. Nat. Immunol. 2017;18:488–498. doi: 10.1038/ni.3704. [DOI] [PubMed] [Google Scholar]
- 51.Shin B., Benavides G.A., Geng J., Koralov S.B., Hu H., Darley-Usmar V.M., Harrington L.E. Mitochondrial Oxidative Phosphorylation Regulates the Fate Decision between Pathogenic Th17 and Regulatory T Cells. Cell Rep. 2020;30:1898–1909.e4. doi: 10.1016/j.celrep.2020.01.022. [DOI] [PMC free article] [PubMed] [Google Scholar]
- 52.Hong H.S., Mbah N.E., Shan M., Loesel K., Lin L., Sajjakulnukit P., Correa L.O., Andren A., Lin J., Hayashi A., et al. OXPHOS promotes apoptotic resistance and cellular persistence in T(H)17 cells in the periphery and tumor microenvironment. Sci. Immunol. 2022;7 doi: 10.1126/sciimmunol.abm8182. [DOI] [PMC free article] [PubMed] [Google Scholar]
- 53.Vardhana S.A., Hwee M.A., Berisa M., Wells D.K., Yost K.E., King B., Smith M., Herrera P.S., Chang H.Y., Satpathy A.T., et al. Impaired mitochondrial oxidative phosphorylation limits the self-renewal of T cells exposed to persistent antigen. Nat. Immunol. 2020;21:1022–1033. doi: 10.1038/s41590-020-0725-2. [DOI] [PMC free article] [PubMed] [Google Scholar]
- 54.Costa T.J., Potje S.R., Fraga-Silva T.F.C., da Silva-Neto J.A., Barros P.R., Rodrigues D., Machado M.R., Martins R.B., Santos-Eichler R.A., Benatti M.N., et al. Mitochondrial DNA and TLR9 activation contribute to SARS-CoV-2-induced endothelial cell damage. Vascul. Pharmacol. 2022;142 doi: 10.1016/j.vph.2021.106946. [DOI] [PMC free article] [PubMed] [Google Scholar]
- 55.Zheng L., Asprodites N., Keene A.H., Rodriguez P., Brown K.D., Davila E. TLR9 engagement on CD4 T lymphocytes represses gamma-radiation-induced apoptosis through activation of checkpoint kinase response elements. Blood. 2008;111:2704–2713. doi: 10.1182/blood-2007-07-104141. [DOI] [PMC free article] [PubMed] [Google Scholar]
- 56.Moioffer S.J., Danahy D.B., van de Wall S., Jensen I.J., Sjaastad F.V., Anthony S.M., Harty J.T., Griffith T.S., Badovinac V.P. Severity of Sepsis Determines the Degree of Impairment Observed in Circulatory and Tissue-Resident Memory CD8 T Cell Populations. J. Immunol. 2021;207:1871–1881. doi: 10.4049/jimmunol.2001142. [DOI] [PMC free article] [PubMed] [Google Scholar]
- 57.Bauquet A.T., Jin H., Paterson A.M., Mitsdoerffer M., Ho I.C., Sharpe A.H., Kuchroo V.K. The costimulatory molecule ICOS regulates the expression of c-Maf and IL-21 in the development of follicular T helper cells and TH-17 cells. Nat. Immunol. 2009;10:167–175. doi: 10.1038/ni.1690. [DOI] [PMC free article] [PubMed] [Google Scholar]
- 58.Korn T., Mitsdoerffer M., Croxford A.L., Awasthi A., Dardalhon V.A., Galileos G., Vollmar P., Stritesky G.L., Kaplan M.H., Waisman A., et al. IL-6 controls Th17 immunity in vivo by inhibiting the conversion of conventional T cells into Foxp3+ regulatory T cells. Proc. Natl. Acad. Sci. USA. 2008;105:18460–18465. doi: 10.1073/pnas.0809850105. [DOI] [PMC free article] [PubMed] [Google Scholar]
- 59.Akimzhanov A.M., Yang X.O., Dong C. Chromatin remodeling of interleukin-17 (IL-17)-IL-17F cytokine gene locus during inflammatory helper T cell differentiation. J. Biol. Chem. 2007;282:5969–5972. doi: 10.1074/jbc.C600322200. [DOI] [PubMed] [Google Scholar]
- 60.Kurebayashi Y., Nagai S., Ikejiri A., Ohtani M., Ichiyama K., Baba Y., Yamada T., Egami S., Hoshii T., Hirao A., et al. PI3K-Akt-mTORC1-S6K1/2 axis controls Th17 differentiation by regulating Gfi1 expression and nuclear translocation of RORγ. Cell Rep. 2012;1:360–373. doi: 10.1016/j.celrep.2012.02.007. [DOI] [PubMed] [Google Scholar]
Associated Data
This section collects any data citations, data availability statements, or supplementary materials included in this article.
Supplementary Materials
Data Availability Statement
-
•
All data reported in this paper will be shared by the lead contact upon request.
-
•
This paper does not report original code.
-
•
Any additional information required to reanalyze the data reported in this work paper is available from the lead contact upon request.