

Abstract
Natural killer cell‐derived extracellular vesicles (NK‐EVs) are candidate biotherapeutics against various cancers. However, standardised potency assays are necessary for a reliable assessment of NK‐EVs' cytotoxicity. This study aims to thoroughly evaluate a highly sensitive resazurin phenoxazine‐based cell viability potency assay (measurement of the cellular redox metabolism) for quantifying the cytotoxicity of NK‐EVs against leukaemia K562 cells (suspension model) and breast cancer MDA‐MB‐231 cells (adherent model) in vitro. The assay was evaluated based on common analytical parameters setforth by regulatory guidelines, including specificity, selectivity,accuracy, precision, linearity, range and stability. Our results revealed that this resazurin‐based cell viability potency assay reliably and reproducibly measured a dose‐response of NK‐EVs’ cytotoxic activity against both cancer models. The assay showed precision with 5% and 20% variation for intra‐run and inter‐run variability. The assay signal showed specificity and selectivity of NK‐EVs against cancer target cells, as evidenced by the diminished viability of cancer cells following a 5‐hour treatment with NK‐EVs, without any detectable interference or background. The linearity analysis of target cancer cells revealed strong linearity for densities of 5000 K562 and 1000 MDA‐MB‐231 cells per test with a consistent range. Importantly, NK‐EVs’ dose‐response for cytotoxicity showed a strong correlation (|ρ| ∼ 0.8) with the levels of known cytotoxic factors associated with the NK‐EVs’ corona (FasL, GNLY, GzmB, PFN and IFN‐γ), thereby validating the accuracy of the assay. The assay also distinguished cytotoxicity changes in degraded NK‐EVs, indicating the ability of the assay to detect the potential loss of sample integrity. Compared to other commonly reported bioassays (i.e., flow cytometry, cell counting, lactate dehydrogenase release assay, DNA‐binding reporter assay and confluence assay), our results support this highly sensitive resazurin‐based viability potency assay as a high‐throughput and quantitative method for assessing NK‐EVs’ cytotoxicity against both suspension and adherent cancer models for evaluating NK‐EVs’ biotherapeutics.
Keywords: biotherapeutics, cancer, exosome, extracellular vesicles (EVs), natural killer (NK) cells, potency assay, resazurin
1. INTRODUCTION
Research in extracellular vesicle (EV)‐based biotherapeutics in cancer treatment is soaring worldwide (Gandham et al., 2020; Lener et al., 2015; Nguyen et al., 2020; Nieuwland et al., 2020; Reiner et al., 2017). However, a considerable barrier to the advancement of natural killer cell‐derived EVs (NK‐EVs) as a therapy for cancer has been the lack of validated standardised potency assays to measure NK‐EVs’ cytotoxic activity (Dosil et al., 2022; EL Andaloussi et al., 2013; Elsharkasy et al., 2020; Farcas & Inngjerdingen, 2020; Federici et al., 2014; Geeurickx et al., 2019; Jiang et al., 2021; Lugini et al., 2012; Neviani et al., 2019; St‐Denis‐Bissonnette et al., 2022; St‐Denis‐Bissonnette et al., 2023; Sun et al., 2019; Yáñez‐Mó et al., 2015). Such standardised quantitative potency assays must meet key attributes aligned with regulatory guidelines, such as the International Council for Harmonisation of Technical Requirements for Pharmaceuticals for Human Use (ICH) (FDA, 2011; Gimona et al., 2017; ICH, 2022; Nguyen et al., 2020; Reiner et al., 2017). Other challenges include: i) comparing novel EV‐based therapeutics across studies, EV lots/preparations, and individual experiments (St‐Denis‐Bissonnette et al., 2023); ii) the need for more essential quality controls and consistent dosing methodologies (Gimona et al., 2017; Nguyen et al., 2020; Reiner et al., 2017; St‐Denis‐Bissonnette et al., 2023).
Historically, flow cytometry and various plate‐based assays have been used to evaluate the potency of various biotherapeutics, including both cell and EV products (Choi et al., 2020; Cochran & Kornbluth, 2021; di Pace et al., 2020; Enomoto et al., 2022; Federici et al., 2020; Han et al., 2020; Jiang et al., 2021; Kaban et al., 2021; Kim et al., 2022; Lugini et al., 2012; Shoae‐Hassani et al., 2017; Wu et al., 2019; Yang et al., 2021; Zhu et al., 2017; Zhu et al., 2019). Whilst many of these assays have also been used to assess the cytotoxic effect of NK‐EVs in various cancer cell models, to the best of our knowledge, no published studies have yet systematically investigated specificity, selectivity, accuracy, precision, linearity, range and stability of these potency assays.
To thisend, we evaluated a high sensitivity (HS) cell viabilityassay, the PrestoBlue HS cell viability assay, which relies on reducing resazurin to resorufin (detectable by absorbance or fluorescence), as a measurement of the metabolic activity of living cells. Here, we perform a rigorous analysis of the performance of this highly sensitive resazurin‐based cell viability assay against other commonly reported assays in the field using the NK92‐MI cell line‐derived‐EVs, which is a clinically relevant model (Cochran & Kornbluth, 2021; Enomoto et al., 2022; Kaban et al., 2021; Kim et al., 2022; St‐Denis‐Bissonnette et al., 2023; Wu et al., 2019; Wu et al., 2021; Zhu et al., 2017; Zhu et al., 2019). This resazurin‐based reagent, marketed by Thermo Fisher Scientific, is promoted as an exceptional pure resazurin solution with better signal‐to‐background ratio compared to the standard version.
The assay performance and suitability were based on the evaluation of common analytical parameters such as accuracy (comparing measured values to a known reference), precision (measuring consistency across repeated measurements, formally known as Intermediate Precision, and reported as an intra‐run and inter‐run variation), linearity (confirming accurate and proportional results across analyte concentrations), range (the interval between the lowest and the highest reportable results), specificity and selectivity (assessing the accurate identification of the intended analyte without interference) and stability (evaluating the integrity and performance of the product over time‐based on bioactivity levels). Additionally, we performed Spearman dose‐response correlations using levels of known NK‐EVs’ cytotoxic factors (i.e., Fas Ligand—FasL, Granulysin—GNLY, Granzyme B—GzmB, Perforin—PFN and Interferon‐gamma—IFN‐γ) to validate the accuracy of the potency assay.
This is the first study to comprehensively provide common analytical parameters supporting the utility of a highly sensitive resazurin phenoxazine‐based cell viability assay as a reliable high‐throughput and quantitative potency assay to measure the cytotoxicity of NK‐EVs against cancer cell models in comparison to other commonly used potency assays (e.g., flow cytometry, cell counting, lactate dehydrogenase (LDH) release assay, DNA‐binding reporter assay and confluence assay). This cell viability assay's high sensitivity, quick and user‐friendly features render it an accessible and reliable method for assessing the potency of NK‐EVs’ cytotoxic products. This work contributes to the standardisation and development of potency assays for EV‐based cancer therapeutics, fostering advancement in the clinical translation of EV‐based products.
2. MATERIALS AND METHODS
2.1. Cell culture parameters
The human leukaemia K562 cell line (ATCC, CCL‐243 ™) was cultured in RPMI‐1640 with 10% Fetal Bovine Serum (FBS, Gibco, cat#12483020). Cells were maintained between 1–6 × 10⁵ cells/mL and passaged every 2–3 days. The human breast cancer cell line MDA‐MB‐231 tagged with Red Fluorescent Protein (RFP) was cultured in Hams F‐12 Medium (Corning cat#10‐080‐CV) and high glucose DMEM with GlutaMAX™ Supplement (Gibco, cat#10566016) at 1:1 ratio with 10% FBS. During passaging, cell detachment was performed using TrypLe select (Gibco, cat#12563‐029) after washing the cells with sterile Dulbecco's phosphate‐buffered saline without Ca2+/Mg2+ (DPBS−/−, Gibco, cat#14190250). Cells were maintained between 3–4 × 10⁴ cells/cm2 and passaged every 2–3 days. The FreeStyle™ 293F cell line (Thermo Fisher Scientific, R790‐07) was cultured in FreeStyle™ 293 Expression Medium (Gibco, cat#12338018) to produce non‐therapeutic control EVs (i.e., 293F‐EVs), as previously done (St‐Denis‐Bissonnette et al., 2023). Cells were maintained between 1–3 × 10⁶ cells/mL on a heat‐resistant shaker (Thermo Fisher Scientific, cat#88881127) at 135 RPM. Cell lines were cultured at 37°C in a 5% CO2 incubator, except the 293F cell line, which was cultured at 37°C in an 8% CO2 incubator. Cell counting was performed on the Cellometer Auto 2000 Viability Counter (Nexcelom BioScience LLC) using the ViaStain Acridine Orange and Propidium Iodide (Acridine Orange/Propidium Iodide) Staining Solution (ESBE Scientific, cat#CS2‐0106) with the immune cell AO/PI program (channel 1: 470/535 nm for 0.5 sec of exposure and channel 2: 540/605 nm for 3 sec of exposure).
2.2. Biomanufacturing of NK‐EVs from NK92‐MI cells
As previously done, NK‐EVs were manufactured using a large‐scale biomanufacturing workflow that adheres to Good Manufacturing Practices and uses NK92‐MI cells (St‐Denis‐Bissonnette et al., 2023). Briefly, the biomanufacturing of NK92‐MI cells and NK‐EVs was performed using a closed‐loop hollow fibre bioreactor to generate large quantities of clinical‐grade NK‐EVs. NK92‐MI cells were seeded into the hollow fibre cartridge and cultured in serum‐free, xeno‐free and feeder‐free medium—ImmunoCult™‐XF T Cell Expansion Medium (StemCell Technologies, cat#10981). NK92‐MI cells were expanded in the cartridge and harvested at the end of the production cycle. The EV‐rich conditioned medium (CM) was collected and stored at −80°C daily until further processing.
2.3. Purification of NK‐EVs by fast protein liquid chromatography (FPLC) using size‐exclusion chromatography (SEC) and ultrafiltration (UF)
Purification of NK‐EVs was performed as previously described with slight modifications (St‐Denis‐Bissonnette et al., 2023). Thawed NK‐EVs‐rich CM was centrifuged at 10,000 × g for 30 min before being loaded into a 60 mL syringe (BD Biosciences, cat#309653) for SEC‐based EV purification. SEC was performed on the AKTA Fast Protein Liquid Chromatograph (GE Lifesciences, cat#29022094) using the HiScale™ chromatography column 10/40 (Cytiva, cat#29360550) packed with CaptoCore 700 resin (Cytiva, cat#17548102) for a total bed height of 20 cm. The column/resin was stored in 20% ethanol (Commercial Alcohols, cat#P006EAAN). Clean‐in‐place and priming procedures were performed using the following filtered solutions; filtration performed using the 0.1 μm vacuum filtration unit Filtropur V50 (Sarstedt, cat#83.3941.002): cleaning solution (0.5 M NaOH (Supelco, cat#SX0607N‐6) and 30% Isopropyl Alcohol (EMD, cat#PX1834‐1) in water), water and DPBS−/− (Fisher, cat#BP399‐1) according to manufacturer protocol. The ultraviolet absorbance was zeroed after the reading stabilised whilst running filtered‐DPBS−/− through the instrument. The NK‐EVs‐rich CM was loaded on the column at a flow velocity of 150 cm/h (flow rate of 2.0 mL/min). Sample fractionation, collected into 15 mL tubes (Corning, cat#430791), was initiated once the ultraviolet absorbance level passed the 230 mAU mark and stopped when the ultraviolet absorbance level dropped below the 1600 mAU mark. To ensure sterility, the fractionated sample was combined before filtration at 0.22 μm with a pre‐wet (filtered‐DPBS−/−) Acrodisc Syringe Filter (Pall Corporation, cat#PN4612). Then, the FPLC‐retentate solution was concentrated using a pre‐equilibrated (sterilised with 70% ethanol and rinsed twice with filtered‐DPBS−/−) 10 kDa Centricon Plus‐70 Centrifugal Filter—regenerated cellulose membrane (Millipore Sigma, cat#UFC701008) at 4000 × g for 15–25 min to attain a concentration factor of 40–45 X pre‐concentration volume. The FPLC‐retentate was mixed using a serological pipette after 15 min of spinning using the Centricon apparatus. Then, the FPLC‐retentate was further spun for an extra 10 min. The final retentate was collected by inverting the filter into the collection cup and spinning the assembly at 2000 × g for 2 min. NK‐EVs were stored at 4°C, and their use was limited to 7 days post isolation for the entire study, except for the experiment section entitled ‛Characteristics and bioactivity assessment of NK‐EVs following 25°C treatment over time’. Each experimental replicate was made from a different NK‐EVs’ isolation.
2.4. Nanoparticle tracking analysis (NTA) of NK‐EVs
NTA analysis was performed as previously described with slight modifications (St‐Denis‐Bissonnette et al., 2023). Purified NK‐EVs samples were thoroughly vortexed before preparing two EV dilutions within the working range of the system using filtered‐DPBS−/− and analysed using the NanoSight NS300 (V3.4 software; Malvern, UK), equipped with a 488 nm laser and a sCMOS camera. For capture settings, the camera level was set to 14 and the detection threshold to 15 for analysis, resulting in approximately 30–80 particles per frame. Two dilutions were run, one ranging from 30–50 particles per frame and the other from 50–80 particles per frame (dilutions of 1500X and 1000X, respectively). After temperature‐stabilising the instrument at 23°C, approximately 1 mL of NK‐EVs sample was loaded in a 1 mL syringe (Thermo Fisher Scientific, cat#MB9204560TF‐LAB), where roughly half of the syringe content was manually injected into the chamber of the instrument until the camera observed stable particles per frame. The syringe was then mounted on the syringe pump (Harvard Apparatus, cat#984730) for acquisition capture in flow mode (flow speed 30) for one capture of 1 min. After the acquisition, the flow rate was increased to 1000 for ∼10 sec before returning to 30. This sequence was repeated for a total of five captures. This acquisition method allows sampling and analysis of the sample through the syringe, assuring an accurate representation of the entire sample. To ensure maximal reproducibility and accuracy, the EV concentration was calculated for each NK‐EVs preparation by averaging the dilution‐corrected concentration of both dilutions ran on NTA, where each dilution captures were averaged.
2.5. ELISA assessment and protein quantification of NK‐EVs’ corona
ELISA assessment of purified intact NK‐EVs was performed per the manufacturer's protocol to assess the level of the following cytotoxic factors that are likely associated with the NK‐EVs’ corona: FasL/TNFSF6 (R&D Systems, cat#DFL00B), GNLY (Abcam, cat#ab256402), GzmB (R&D Systems, cat#DGZB00), PFN (Abcam, cat#ab46068) and IFN‐γ (R&D Systems, cat#DIF50C). Readings were made using the Microplate Reader (BioTek Synergy H1 Multimode Reader; cat#SH1M2G‐SN; Gen5 software V3.14). PBS buffer was added as a control for background subtraction in data processing, and negative values were zeroed. Protein quantification was performed using the Qubit® Protein BR Assay Kit (Invitrogen, cat#A50669) on the Qubit 4 Fluorometer according to the manufacturer's protocol, using triplicates.
2.6. Resazurin‐based cell viability assay: Potency evaluation of NK‐EVs treated cancer cells
Using 96‐well Flat Clear Bottom Black Polystyrene TC‐treated Microplates (Costar, cat#3603), 5000 K562 target cells (suspension cells) or 1000 MDA‐MB‐231 target cells (adherent cells) were seeded per well; four technical replicates per condition. Cells were maintained in Fluorobrite DMEM (Gibco, cat#A18967‐01) with 10% Exosome‐Depleted FBS (Gibco, cat#A2720803), where the final well volume was normalised to 250 μL final. Untreated cells, 1X of Triton‐X 100 (Sigma, cat#T‐9284) detergent‐treated cells and 293F‐EVs were used as controls. Cells were allowed to settle into the plate for 1–2 hours before adding effector EVs (NK‐EVs and negative control 293F‐EVs) at various effector EVs to target cancer cell ratios: 500; 5000; 50,000; 500,000 and 5,000,000. After 5 hours of treatment at 37°C with 5% CO2, PrestoBlue™ HS Cell Viability Reagent Assay (Invitrogen, cat#P50200) was added to each well as per manufacturer protocol. Plate incubation was performed at 37°C in a 5% CO2 incubator and protected from light for 90 min (maximising the assay sensitivity). Fluorescence was measured (Ex/Em 560/590 ± 9 nm) with a Microplate Reader (BioTek Synergy H1 Multimode Reader; cat#SH1M2G‐SN; Gen5 software V3.14), temperature‐stabilised at 37°C to reduce temperature‐variation on fluorescence measurements. Before acquisition, the plate reader mixed the plate for 60 sec at 350 RPM to homogenise the content in each well. Technical replicates were averaged for analysis and then corrected for background before performing a dose‐response analysis using a non‐linear regression for inhibition effect showing the log(inhibitor) versus normalised response—variable slope without constraint; the Hillslope and EC50 were recorded.
2.7. Resazurin‐based cell viability assay: Evaluation of linearity and range
To assess this resazurin‐based cell viability assay linearity, K562 cells or MDA‐MB‐231 cells were seeded, ranging from 0 cells to 50,000 cells per well (0, 10, 50, 100, 500, 750, 1000, 2500, 5000, 10,000, 25,000 and 50,000), in 96‐well Flat Clear Bottom Black Polystyrene TC‐treated Microplates. To assess this resazurin‐based cell viability assay range, 5000 K562 cells/well were seeded at varying levels of viability (0%, 5%, 10%, 20%, 25%, 37.5%, 50%, 62.5%, 75%, 80%, 90% and ‛max; as per AO/PI counting’), which was achieved by mixing the appropriate ratio of untreated cells to heat‐shocked (30 min at 70°C) treated K562 cells. Alternatively, 1000 MDA‐MB‐231 cells/well were seeded with varying levels of viability (cells treated with varying concentrations of sodium dodecyl sulphate solution (SDS; Sigma, cat#71736‐500 mL) for 30–60 min). MDA‐MB‐231 cells were allowed to settle and adhere to the bottom of the plate for at least 12–24 hours before linearity and range assessment. The culture media was changed prior to evaluation to remove un‐attached MDA‐MB‐231 cells. Well volume was normalised to 100 μL final using Fluorobrite DMEM with 10% FBS. Cell viability assessment was performed as detailed in the section ‛Resazurin‐based cell viability assay: Potency evaluation of NK‐EVs treated cancer cells’.
2.8. Characteristics and bioactivity assessment of NK‐EVs following 25°C treatment over time
After NK‐EVs’ purification, the final product was thoroughly vortexed before being equally aliquoted in Eppendorf Protein LoBind 0.5 mL tubes (Eppendorf, cat#022431064). NK‐EVs aliquots were treated at 25°C for 3 weeks to promote product degradation. Weekly, NTA was used to assess the NK‐EVs’ characteristics for size and concentration quantification (as detailed above) and selected plate‐based assays (PrestoBlue™ HS Cell Viability assay and Cell Counting Kit 8 Assay (Sigma‐Aldrich, cat#96992)—CCK8) to assess NK‐EVs’ bioactivity. Cytotoxicity assessment of NK‐EVs was performed using 96‐well Flat Clear Bottom Black Polystyrene TC‐treated Microplates, in which 5000 K562 target cells (suspension cells) were seeded per well in duplicates. Untreated cells and media only were used as controls. K562 cancer cells were maintained in Fluorobrite DMEM with 10% Exosome‐Depleted FBS. Well volume was normalised to 100 μL final using the cell culture medium, where the plate was maintained at 37°C with 5% CO2. We used 1X CCK8 (450 nm absorption) for continuous assessment (every hour for the first 8 hours and then every 24 hours until 72 hours). Cell Viability assessment was performed as detailed in the section ‛Resazurin‐based cell viability assay potency evaluation of NK‐EVs treated cancer cells’. Cell viability was calculated as follows, where RFU is relative fluorescence units:
2.9. EV‐TRACK
We have submitted all relevant data of our experiments to the EV‐TRACK knowledgebase (EV‐TRACK ID: EV230983) (van Deun et al., 2017).
2.10. Statistical analysis
Data were expressed as the means ± the standard deviation (SD) or the standard error of the mean (SEM) as indicated in the figure legend. Data were normalised to the control group for relative comparison, as indicated in each figure legend. The number of experimental and technical replicates used is also indicated in figure legends. Statistical analyses were performed using GraphPad Prism version 7.0 (GraphPad Software Inc., LaJolla, CA, USA). Two‐way ANOVA followed by post hoc tests (Tukey's or Sidak's multiple comparisons) were used and identified in the figure legend. Results were considered significant when p < 0.05. To assess the accuracy of potency assays, we performed Spearman correlations between the outcome of the assay (response induced by NK‐EVs) and the level of cytotoxic factors, where the response was transformed to its logarithmic value (log of RFU), and the cytotoxic factor dose was transformed to its root square value (sqr of cytotoxic factor ng/mg of proteins) for better data representation. Correlation coefficient values (ρ) are defined as perfectly negative (−1), strongly negative (−0.8), moderately negative (−0.5), weakly negative (−0.2), no association (0), weakly positive (0.2), moderately positive (0.5), strongly positive (0.8), perfectly positive (1).
3. RESULTS
This study aims to thoroughly evaluate potency assays for quantifying NK‐EVs' cytotoxicity, starting with a highly sensitive resazurin‐based cell viability assay (measurement based on redox metabolism), based on common analytical parameters, including specificity, selectivity, accuracy, precision, linearity, range and stability.
3.1. Resazurin‐based cell viability assay reaffirms a dose‐dependent cell viability loss in leukaemia cells after treatment with NK‐EVs
First, cell viability loss following NK‐EVs treatment was reaffirmed using a highly sensitive resazurin‐based cell viability assay, as previously shown (St‐Denis‐Bissonnette et al., 2023). Cytotoxic NK‐EVs or negative control 293F‐EVs were incubated at various concentrations with the leukaemia cell line K562 (gold‐standard cell model for NK cytotoxicity (Pross et al., 1981)) for over 5 hours. As shown in Figure 1a‐i , the cell viability assay revealed a dose‐response of K562 cell viability loss after treatment with NK‐EVs. In contrast, control 293F‐EVs did not exhibit a cytotoxic dose‐response, indicating a specific effect attributed to the cytotoxic effectors of NK‐EVs. The EC50 of NK‐EVs’ cytotoxic effect was measured at an E: T ratio (Effector: Target) of 392,351 particles per K562 cell, as shown in Figure 1a‐ii .
FIGURE 1.
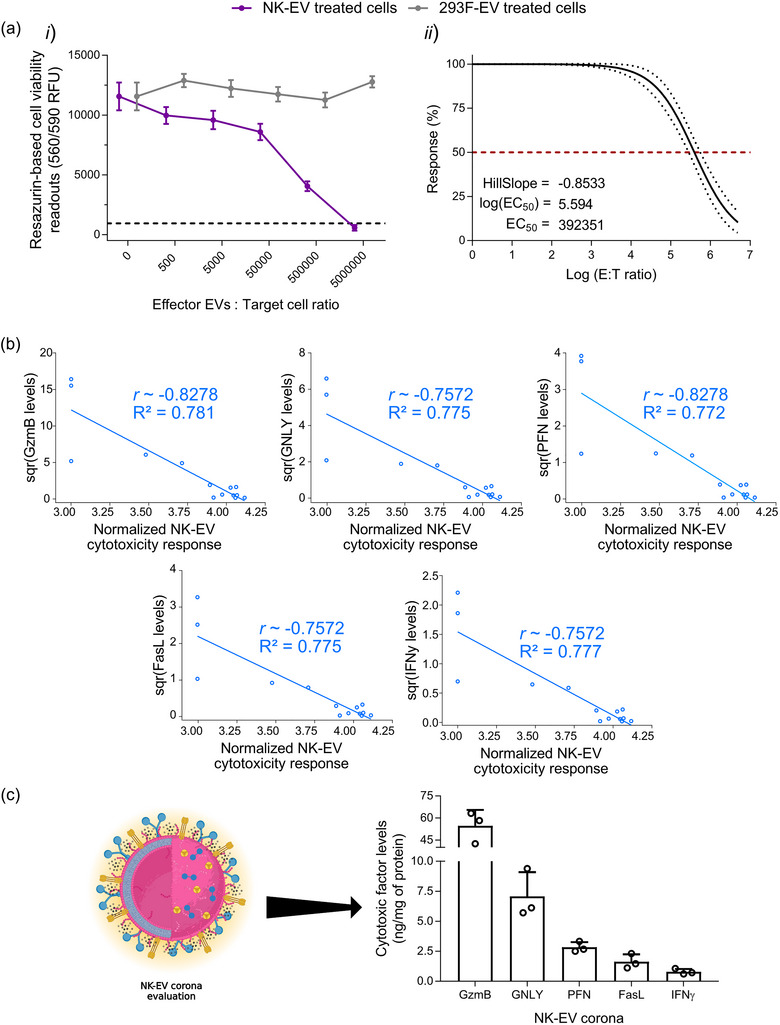
Resazurin‐based cell viability assay reaffirms a dose‐dependent cell viability loss in leukaemia cells after NK‐EV correlating with levels of cytotoxic factors. (a) Leukaemia K562 cells were treated for 5 hours with various E: T ratios of NK‐EVs or negative control 293F‐EVs, followed by endpoint resazurin‐based cell viability assay. The results are presented in (i) RFU (Relative Fluorescence Units) readouts (black dashed line represents lysed K562 cell control; detergent‐treated) and (ii) EC50 curve analysis with variable slope for NK‐EV treatment with 95% confidence interval/prediction bands (red dashed line represents 50% response). Data are shown as mean ± S.E.M. from seven independent experiments, each with technical quadruplets. (b) Spearman correlations of selected NK‐EV's corona cytotoxic factors (GzmB, GNLY, PFN, FasL and IFN‐γ) detected by ELISA in relation to cell viability assay using leukaemia K562 cells (n = 14 correlations pairs where one pair (a dot in the figure) represents the correlation between the level of a cytotoxic factor and the cell viability assay readout for a given NK‐EV dose). (c) NK‐EVs corona cytotoxic factors (schematically shown) were assessed by ELISA and presented as the protein‐normalised levels (ng/mg of protein) of a given cytotoxic factor (GzmB, GNLY, PFN, FasL and IFN‐γ) using total protein levels (mg) detected by Qubit Protein Assay. Data are shown as mean ± S.D. from three independent experiments, each with technical duplicates.
3.2. Resazurin‐based cell viability assay shows excellent dose‐dependent correlations to known cytotoxic factors of NK‐EVs’ corona in leukaemia K562 cells
To validate the accuracy of this cell viability assay as a reliable potency assay for NK‐EVs’ cytotoxicity against target cancer cells, the levels of cytotoxic factors (i.e., FasL, GNLY, GzmB, PFN and IFN‐γ) that are likely associated with the NK‐EVs’ corona (i.e., a layer of molecules embedded to the EV external surface, thereby excluding the intravesicular content) were assessed by ELISA and used for dose‐response correlations. The levels of each cytotoxic factor (square root transformed) were correlated to the corresponding cell viability assay RFU values (logarithmically transformed). Data transformation was done to optimise data visualisation. As shown in Figure 1b, dose‐response of the cell viability assay strongly correlated with all cytotoxic factors that mediate cell death in target K562 cells (|ρ| ∼ 0.757–0.828 and R 2 ∼ 0.772–0.828). Notably, all cytotoxic factors correlated similarly, as shown in Table 1. Comparatively, 293F‐EV control did not yield a dose‐response correlation, as shown in Figure S1 and Table 2. The abundance of cytotoxic factors in the NK‐EVs’ corona across different batches of product preparations is depicted in Figure 1c. NK‐EVs' corona is composed of GzmB (54.63 ± 6.27 ng), GNLY (7.08 ± 1.16 ng), PFN (2.83 ± 0.25 ng), FasL (1.63 ± 0.36 ng) and IFN‐γ (0.80 ± 0.14 ng), normalised to the protein levels (mg) in solution.
TABLE 1.
Spearman correlational analyses of selected NK‐EV's corona cytotoxic factors detected by ELISA in relation to PrestoBlue viability assay responses in leukaemia K562 cells.
| Potency assay | PrestoBlue HS | CCK8 | ||
|---|---|---|---|---|
| Assay quality/robustness | Z’ factor | 0.9340 | 0.8446 | |
| Spearman correlation by cytotoxic factor | GzmB | Rho (ρ) | −0.7403 | −0.7982 |
| p‐value | 0.0071 | 0.0032 | ||
| R 2 | 0.7640 | 0.6370 | ||
| PFN | Rho (ρ) | −0.7403 | n.a. | |
| p‐value | 0.0071 | n.a. | ||
| R 2 | 0.7596 | n.a. | ||
| FasL | Rho (ρ) | −0.6940 | n.a. | |
| p‐value | 0.0104 | n.a. | ||
| R 2 | 0.8010 | n.a. | ||
| IFN‐γ | Rho (ρ) | −0.6940 | n.a. | |
| p‐value | 0.0104 | n.a. | ||
| R 2 | 0.7876 | n.a. | ||
| GNLY | Rho (ρ) | −0.6940 | n.a. | |
| p‐value | 0.0104 | n.a. | ||
| R 2 | 0.7823 | n.a. | ||
| |Average| | Rho (ρ) | 0.7125 | 0.7982 | |
| p‐value | 0.0091 | 0.0032 | ||
| R 2 | 0.7789 | 0.6370 |
Note: Coefficient value (r) are defined as perfectly negative (−1), strongly negative (−0.8), moderately negative (−0.5), weakly negative (−0.2), no association (0), weakly positive (0.2), moderately positive (0.5), strongly positive (0.8), perfectly positive (1). Each correlation was made using n = 14 data points acquired from n = 3 experimental replicates with appropriate technical replicates.
TABLE 2.
Spearman correlational analyses of selected 293F‐EV's corona cytotoxic factors detected by ELISA in relation to PrestoBlue viability assay responses in leukaemia K562 cells.
| Potency assay | PrestoBlue HS | ||
|---|---|---|---|
| Spearman correlation by cytotoxic factor | GzmB | Rho (ρ) | 0 |
| p‐value | 0.999 | ||
| R 2 | 0 | ||
| PFN | Rho (ρ) | 0 | |
| p‐value | 0.999 | ||
| R 2 | 0 | ||
| FasL | Rho (ρ) | 0 | |
| p‐value | 0.999 | ||
| R 2 | 0 | ||
| IFN‐γ | Rho (ρ) | 0 | |
| p‐value | 0.999 | ||
| R 2 | 0 | ||
| GNLY | Rho (ρ) | 0 | |
| p‐value | 0.999 | ||
| R 2 | 0 | ||
| |Average| | Rho (ρ) | 0.0000 | |
| p‐value | 0.9990 | ||
| R 2 | 0.0000 |
Note: Coefficient value (r) are defined as perfectly negative (−1), strongly negative (−0.8), moderately negative (−0.5), weakly negative (−0.2), no association (0), weakly positive (0.2), moderately positive (0.5), strongly positive (0.8), perfectly positive (1). Each correlation was made using n = 14 data points acquired from n = 3 experimental replicates with appropriate technical replicates.
3.3. Resazurin‐based cell viability assay shows precision with K562 cells
To assess this resazurin‐based cell viability assay precision, the coefficient of variation (% CV, defined as the ratio of the standard deviation to the mean) from the results in Figure 1a was plotted. As shown in Figure 2a, intra‐run variability (between technical quadruplets within each assay) ranges from 2.94 to 9.63% CV with a mean of 6.15% CV. Similarly, inter‐run variability (between independent assays) ranges from 13.48 to 24.46% CV with a mean of 20.05% CV, as shown in Figure 2b and Table 3.
FIGURE 2.
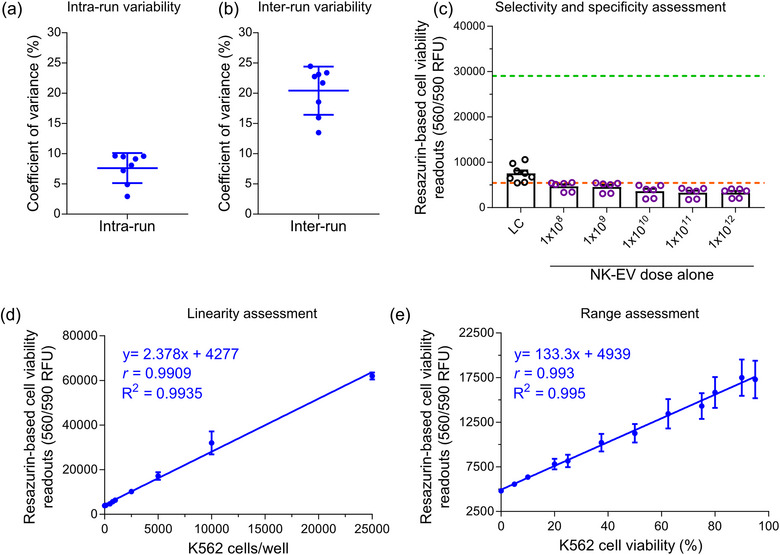
Analytics of highly sensitive resazurin‐based cell viability assay conducted with K562 leukaemia cells. (a) The mean coefficient of variance ± S.D., representing the intra‐run variability in the resazurin‐based cell viability assay, was calculated from seven independent experiments, each with technical quadruplets. Each independent experiment had eight samples, including six NK‐EV doses, untreated K562 cells and detergent‐treated K562 cells. (b) The mean coefficient of variance ± S.D., representing the inter‐run variability in the resazurin‐based cell viability assay, was calculated from seven independent experiments, each with technical quadruplets. Each independent experiment had eight samples, including six NK‐EV doses, untreated K562 cells and detergent‐treated K562 cells. (c) Fluorescence readings (RFU) of varying NK‐EV doses for resazurin‐based cell viability assay assessment are presented as mean ± S.E.M. from eight independent experiments, each with technical duplicates. The green and orange dashed line represents the upper (5000 K562 cells alone without any NK‐EV treatment) and lower (media only without any cells or NK‐EVs) assay readouts, respectively, based on controls. Legends: LC—lysed cells. (d) Linearity assessment of resazurin‐based cell viability assay (0–50,000 K562 cells/well). The data are presented as mean ± S.E.M. from four independent experiments, each with technical duplicates. (e) Range assessment of resazurin‐based cell viability assay (5000 K562 cells/well with varying levels of viability). The data are presented as mean ± S.E.M. from four independent experiments, each with technical duplicates.
TABLE 3.
PrestoBlue viability assay variability (precision; intra‐run and inter‐run coefficient of variation) for K562 cells.
| Samples | Mean | S.D. | CV% |
|---|---|---|---|
| Intra‐run | |||
| 1 | 15,444.50 | 2215.63 | 14.35 |
| 2 | 9986.50 | 1728.18 | 17.31 |
| 3 | 23,623.00 | 1995.21 | 8.45 |
| 4 | 25,618.25 | 919.10 | 3.59 |
| 5 | 15,847.67 | 420.69 | 2.65 |
| 6 | 12,882.33 | 828.54 | 6.43 |
| 7 | 11,930.00 | 659.91 | 5.53 |
| 8 | 5587.00 | 257.71 | 4.61 |
| 9 | 5435.00 | 21.21 | 0.39 |
| 10 | 9754.50 | 340.13 | 3.49 |
| 11 | 10,577.00 | 247.26 | 2.34 |
| 12 | 8507.33 | 124.04 | 1.46 |
| 13 | 5287.33 | 179.92 | 3.40 |
| 14 | 5221.00 | 231.93 | 4.44 |
| 15 | 11,930.00 | 659.91 | 5.53 |
| 16 | 5307.75 | 62.90 | 1.19 |
| 17 | 4149.75 | 75.45 | 1.82 |
| 18 | 8939.50 | 128.96 | 1.44 |
| 19 | 9806.75 | 70.10 | 0.71 |
| 20 | 6319.00 | 356.38 | 5.64 |
| 21 | 3864.00 | 442.65 | 11.46 |
| Average CV% | – | – | 5.06 |
| Inter‐run | |||
| 1 | 13,218.20 | 2453.91 | 18.56 |
| 2 | 6007.53 | 1404.54 | 23.38 |
| 3 | 4697.80 | 1085.96 | 23.12 |
| 4 | 14,255.35 | 2274.54 | 15.96 |
| 5 | 13,154.55 | 1773.56 | 13.48 |
| 6 | 13,073.60 | 3197.18 | 24.46 |
| 7 | 10,439.60 | 2375.74 | 22.76 |
| 8 | 6240.95 | 1355.51 | 21.72 |
| Average CV% | – | – | 20.43 |
3.4. Resazurin‐based cell viability assay exhibits both selectivity and specificity in detecting the loss of cell viability and shows excellent linearity and range with K562 cells
To evaluate the selectivity and specificity of this resazurin‐based cell viability assay, varying concentrations of purified NK‐EVs were introduced into a plate containing only the cell viability reagent without any cancer cells present. Consequently, the contribution of NK‐EVs alone on the assay readings, specifically assessing their background and interference, was evaluated. As depicted in Figure 2c, the assay readouts remained unaffected by adding NK‐EVs alone, regardless of the dose. This affirms that the assay readouts specifically reflect a decline in target cell viability and are not impacted by NK‐EVs alone, thus showing no measurable interference.
The incubation time for this highly sensitive resazurin‐based cell viability reagent was comprehensively evaluated to assess the assay's rapidity and sensitivity using the 96‐well plate format, as shown in Figure S2. A minimum of 30 min of incubation is required to achieve statistical differences (p < 0.0005), yielding a fold‐difference close to 13 for untreated K562 cells (5842.93 ± 833.14 RFU) over detergent‐treated K562 cells (469.38 ± 81.24 RFU). Shorter incubation times did not yield statistically significant results (α = 0.05). Comparatively, 90 min (p < 0.0001) of incubation allowed for a fold‐difference close to 18 when comparing untreated K562 cells (12,845.80 ± 1758.80 RFU) to detergent‐treated K562 cells (734.56 ± 92.87 RFU). The assay signal for untreated K562 cells increased proportionally over time, whereas the signal for detergent‐treated cells barely increased.
Moreover, the linearity of this resazurin‐based cell viability assay was assessed by seeding K562 cells in a 96‐well plate, ranging from 0 to 50,000 cells, and performed a linear regression analysis. The assay exhibited a linear response capable of detecting a minimum of 100 cells per well and a maximum of 25,000 cells per well, highlighting its high sensitivity. Using the 96‐well plate format without allowing cell replication, robust linearity for 100–10,000 K562 cells/well (R 2 ∼ 0.994 and |ρ| ∼ 0.991) was demonstrated, as depicted in Figure 2d. Similarly, the assay range was assessed by seeding 5000 K562 cells/well with varying levels of viability, artificially generated by mixing the appropriate ratio of untreated cells to heat‐shocked treated K562 cells. Using the 96‐well plate format and without allowing cell replication, the assay could distinguish between low and high levels of cell viability (R 2 ∼ 0.995 and |ρ| ∼ 0.993), as shown in Figure 2e.
3.5. Resazurin‐based cell viability assay effectively discriminates changes in NK‐EVs’ bioactivity following a 25°C treatment over time
To evaluate the ability of this resazurin‐based cell viability assay to distinguish changes in bioactivity, NK‐EVs were subjected to a 25°C treatment over 3 weeks to expedite NK‐EVs’ degradation. Importantly, the 25°C treatment temperature was intentionally selected to accelerate product degradation over a short period, unlike the more commonly used storage temperature for EVs (4, −20 or −80°C), which favours product stability. Functional potency is a stability‐indicating quality attribute for investigational biotherapeutics, including NK‐EVs. To evaluate the stability of 25°C‐treated NK‐EVs cell viability was assessed using this resazurin‐based cell viability assay, and particle size range distribution, and concentration by Nanoparticle Tracking Analysis (NTA) every week.
In this experiment, three NK‐EVs doses were selected to depict the dose‐response effect against gold‐standard leukaemia cells, as shown in Figure 3a. After EV isolation, NK‐EVs at time 0 yielded cytotoxicity against K562 cells, except for the low dose (2 × 10⁴ NK‐EVs per K562 cell). For instance, the medium dose (1 × 10⁶ NK‐EVs per K562 cell) and the high dose (2 × 10⁷ NK‐EVs per K562 cell) generated 20.69% ± 3.43% and 80.26% ± 1.04% cytotoxicity, respectively. However, after 1 week of treatment at 25°C, the functionality of the NK‐EVs was significantly impaired. Notably, the medium dose (1 × 10⁶ NK‐EVs per K562 cell) could no longer yield cytotoxicity. In contrast, the high dose (2 × 10⁷ NK‐EVs per K562 cell) only produced an 18.30 ± 7.30% cytotoxic effect. This represents approximately a 62% potency difference for the same dose equivalency between untreated and temperature‐treated NK‐EVs for the high treatment dose. Moreover, NK‐EVs’ cytotoxicity was entirely reduced by the second week of treatment, highlighting the ability of this resazurin‐based cell viability assay to detect changes in the NK‐EVs product bioactivity. Interestingly, despite this loss of function, the product size distribution and concentration remained highly consistent over time, as depicted in Figure 3b,c and Table 4, suggesting that EV size and concentration are not stability‐indicating attributes.
FIGURE 3.
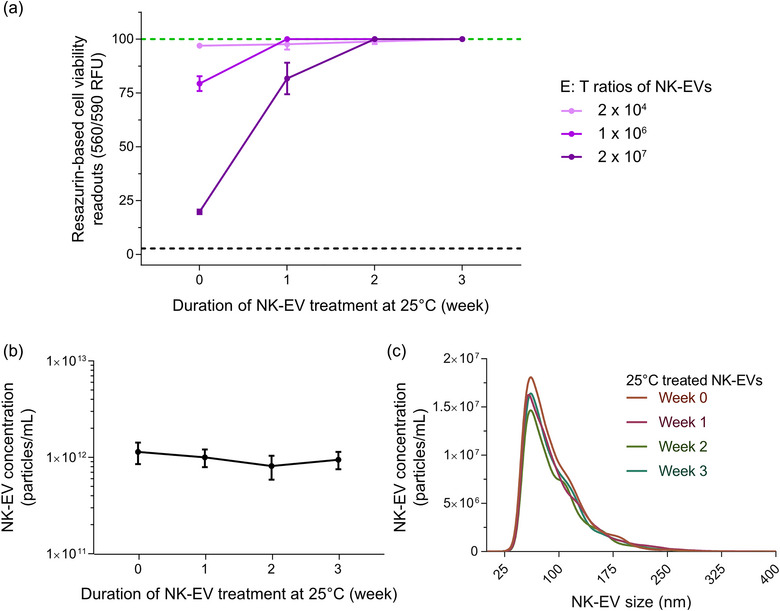
Resazurin‐based cell viability assay distinguishes changes in bioactivity after exposure of NK‐EVs to 25°C treatment over time using K562 leukaemia cells. (a) K562 cells were treated for 5 hours with various E: T ratios of NK‐EVs (after incubation at 25°C for 0, 1, 2 and 3 weeks), where their viability was assessed using the resazurin‐based cell viability assay. The black dashed line represents lysed K562 cell control (detergent‐treated) and the green dashed line represents untreated K562 cells. NK‐EV dose information per K562 cell: low dose (2 × 10⁴), medium dose (1 × 10⁶) and high dose (2 × 10⁷). Data are presented as mean ± S.E.M. from four independent experiments, each with technical duplicates. (b) NK‐EV particle product concentration (particles/mL) measured over time by NTA, presented as mean ± S.D. from four independent experiments, each with technical duplicates. (c) NK‐EV product size distribution after exposure to 25°C for 0, 1, 2 and 3 weeks, measured by NTA, shown as mean from four independent experiments, each with 10 technical replicates.
TABLE 4.
Properties of size distribution in NK‐EV product following 25°C treatment do not change over time.
| Week 0 | Average | ||||||||||
|---|---|---|---|---|---|---|---|---|---|---|---|
| D10 | 76.1 | 81.3 | 76.6 | 75.3 | 74.6 | 75 | 79.6 | 80.2 | 75.2 | 77.9 | 77.18 |
| D50 | 108.4 | 115.1 | 102 | 103.1 | 103.4 | 103 | 109 | 108 | 105.8 | 107.7 | 106.55 |
| D90 | 166.8 | 176.6 | 169.4 | 169.1 | 170 | 164.6 | 175.8 | 172.9 | 174.7 | 181.5 | 172.14 |
| Mean | 116.1 | 123.7 | 114.4 | 115.3 | 114.3 | 113.9 | 121.1 | 118.6 | 116.2 | 122.2 | 117.58 |
| Mode | 88.6 | 95.9 | 84 | 88 | 82.1 | 82.9 | 84.9 | 86.9 | 89.4 | 87.3 | 87 |
| S.D. | 40 | 41.9 | 40.8 | 41.2 | 40.1 | 39.8 | 42.4 | 39.4 | 40.5 | 51.8 | 41.79 |
| Week 1 | Average | ||||||||||
| D10 | 78.4 | 76 | 75.1 | 76.3 | 79.2 | 74 | 79.3 | 78.7 | 74.4 | 77.7 | 76.91 |
| D50 | 107.2 | 106.9 | 103.9 | 105.6 | 109 | 104.5 | 110.2 | 109.4 | 103.1 | 103.7 | 106.35 |
| D90 | 169.8 | 176.8 | 172.5 | 180.1 | 186.8 | 184.8 | 180.7 | 189.4 | 168.8 | 169.6 | 177.93 |
| Mean | 118.1 | 120.2 | 116.3 | 119.1 | 121.5 | 118.2 | 123.3 | 123 | 114.4 | 115 | 118.91 |
| Mode | 83 | 98.7 | 78.9 | 78.3 | 85.4 | 79.6 | 83.1 | 81.7 | 92.7 | 86.1 | 84.75 |
| S.D. | 42 | 47.1 | 43.7 | 45.4 | 46.6 | 47.2 | 48.2 | 46.4 | 41.6 | 40.4 | 44.86 |
| Week 2 | Average | ||||||||||
| D10 | 78.4 | 78 | 80.2 | 77.9 | 78.2 | 77.2 | 78.3 | 77.7 | 77.3 | 77.2 | 78.04 |
| D50 | 108.3 | 106.8 | 109.2 | 108.2 | 106.1 | 105 | 106.3 | 107.5 | 109.3 | 107.6 | 107.43 |
| D90 | 176 | 166 | 180.4 | 168.3 | 174.8 | 179.6 | 178.3 | 173.2 | 177.1 | 171.4 | 174.51 |
| Mean | 118.5 | 115.8 | 120.4 | 118.5 | 117 | 117.9 | 118.6 | 118.9 | 119.3 | 118.1 | 118.3 |
| Mode | 84.3 | 98.7 | 88.5 | 84.8 | 83.1 | 84.1 | 86.6 | 81.7 | 85.8 | 86.2 | 86.38 |
| S.D. | 40.5 | 36.5 | 41.1 | 41.6 | 40.7 | 43.9 | 43.4 | 42.6 | 43.2 | 42.9 | 41.64 |
| Week 3 | Average | ||||||||||
| D10 | 78 | 79.2 | 77.7 | 81.6 | 76.4 | 75.4 | 78.6 | 75.3 | 77.4 | 75.9 | 77.55 |
| D50 | 108.3 | 108.7 | 105 | 107.3 | 106.2 | 103.9 | 107.3 | 105.6 | 113.1 | 112.3 | 107.77 |
| D90 | 173.8 | 172.2 | 170.3 | 180.1 | 162.3 | 173.3 | 192.5 | 167.7 | 188.2 | 178.8 | 175.92 |
| Mean | 119.3 | 118.5 | 117.8 | 119.7 | 115.5 | 116.3 | 120.5 | 115.3 | 124.3 | 117.9 | 118.51 |
| Mode | 84.1 | 92.3 | 85.9 | 92.2 | 84.8 | 93.6 | 83.3 | 80.7 | 83.5 | 78.4 | 85.88 |
| S.D. | 43.7 | 40.5 | 43 | 40.6 | 41 | 42.2 | 47.1 | 40.9 | 46.8 | 48 | 43.38 |
Note: NK‐EV product NTA size metrics (D10 ‐ size below which 10% of all particles are located, D50 ‐ size below which 50% of all particles are located, D90 ‐ size below which 90% of all particles are located, the mean, the mode and the S.D.) of NTA measurements, presented as mean ± S.D. from five independent experimental replicates with technical duplicates.
3.6. Assessment of the resazurin‐based cell viability assay using adherent breast cancer cell model
Since this resazurin‐based cell viability assay showed promising results in evaluating the cytotoxic effect of NK‐EVs using the gold‐standard leukaemia cell line K562 (suspension model), we asked whether it also performed well using adherent cancer cells as targets. Following a similar methodology, cytotoxic NK‐EVs or negative control 293F‐EVs were incubated at various concentrations to treat breast cancer MDA‐MB‐231 cells over 5 hours. The potency of NK‐EVs was assessed using this resazurin‐based cell viability assay. As shown in Figure 4a‐i , this resazurin‐based cell viability assay revealed a dose‐response of MDA‐MB‐231 cell viability loss after NK‐EVs’ treatment. The EC50 of NK‐EVs’ cytotoxic effect was measured at an E: T ratio of 655,055 NK‐EVs’ particles per MDA‐MB‐231 cell, as shown in Figure 4a‐ii . There was a similar correlational trend for all cytotoxic factors that mediate cell death in target MDA‐MB‐231 cells (|ρ| ∼ 0.631–0.653 and R 2 ∼ 0.747–0.827), as shown in Figure 4b.
FIGURE 4.
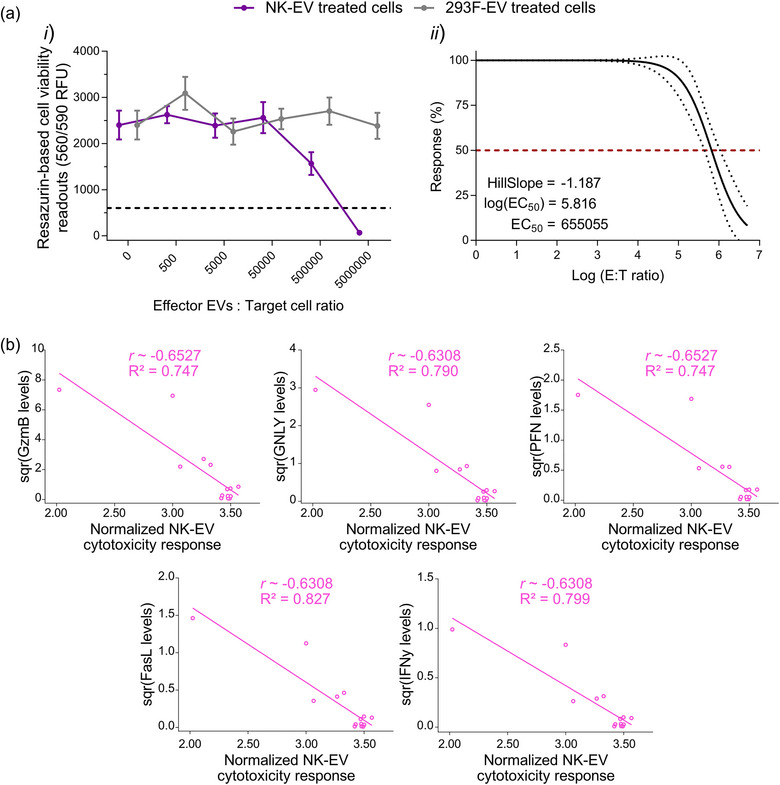
Resazurin‐based cell viability assay reveals a dose‐dependent cell viability loss in in adherent breast cancer MDA‐MB‐231 cells upon NK‐EV treatment correlating with levels of cytotoxic factors. (a) Breast cancer MDA‐MB‐231 cells were treated for 5 hours with various E: T ratios of NK‐EVs or negative control 293F‐EVs, followed by endpoint resazurin‐based cell viability assay. The results are presented in (i) RFU (black dashed line represents lysed cell control) and (ii) EC50 curve analysis with variable slope for NK‐EV treatment with 95% confidence interval/prediction bands (red dashed line represents 50% response). Data are shown as mean ± S.E.M. from six independent experiments, each with technical quadruplets. (b) Spearman correlations of the selected NK‐EVs corona cytotoxic factors (GzmB, GNLY, PFN, FasL and IFN‐γ) in relation to cell viability assay responses in MDA‐MB231 cancer cells (n = 14 correlations pairs where one pair (a dot in the figure) represents the correlation between the level of a cytotoxic factor and the cell viability assay readout for a given NK‐EV dose).
This resazurin‐based cell viability assay exhibited precision for intra‐run variability ranges from 3.12 to 6.79% CV with a mean of 5.53% CV, as shown in Figure 5a. Similarly, the inter‐run variability ranges from 17.69 to 25.74% CV with a mean of 22.5% CV, as shown in Figure 5b and Table 5. Additionally, this resazurin‐based cell viability assay signal showed excellent linearity and range in breast cancer MDA‐MB‐231 cells, using the 96‐well plate format, allowing the cells to adhere to the well and washing away unadhered cells. Figure 5c shows robust linearity for 100–10,000 MDA‐MB‐231 cells/well (R 2 ∼ 0.998 and |ρ| ∼ 1.000). Similarly, the assay range was assessed by seeding 1000 MDA‐MB‐231 cells/well with varying levels of viability artificially generated after treatment with different concentrations of SDS (anionic detergent). As shown in Figure 5d, the assay could distinguish between low and high viability (R 2 ∼ 0.816 and |ρ| ∼ 0.833).
FIGURE 5.
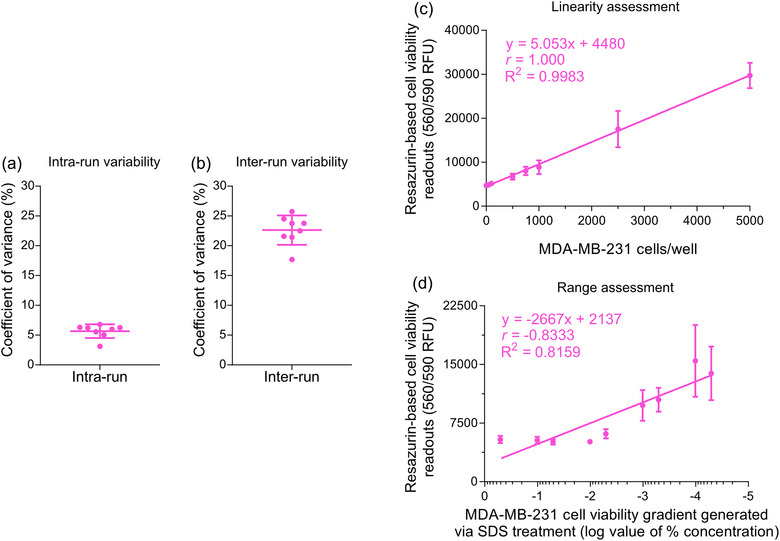
Analytics of highly sensitive resazurin‐based cell viability assay conducted with adherent MDA‐MB‐231 breast cancer cells. (a) The mean coefficient of variance ± S.D., reflecting the intra‐run variability in the resazurin‐based cell viability assay, was calculated from six independent experiments, each with technical quadruplets. Each independent experiment had eight samples, including six NK‐EV doses, untreated MDA‐MB‐231 cells, and detergent‐treated MDA‐MB‐231 cells. (b) The mean coefficient of variance ± S.D., reflecting the inter‐run variability in the resazurin‐based cell viability assay, was calculated from six independent experiments, each with technical quadruplets. Each independent experiment had eight samples, including six NK‐EV doses, untreated MDA‐MB‐231 cells and detergent‐treated MDA‐MB‐231 cells. (c) Linearity assessment of resazurin‐based cell viability assay (0–50,000 breast cancer MDA‐MB‐231 cells/well). The data are presented as mean ± S.E.M. from four independent experiments, each with technical duplicates. (d) Range assessment resazurin‐based cell viability assay (1000 breast cancer MDA‐MB‐231 cells/well with varying levels of viability). The data are presented as mean ± S.E.M. from four independent experiments, each with technical duplicates.
TABLE 5.
PrestoBlue viability assay variability (precision; intra‐run and inter‐run coefficient of variation) for MDA‐MB‐231 cells.
| Samples | Mean | S.D. | CV% |
|---|---|---|---|
| Intra‐run | |||
| 1 | 6381.50 | 422.24 | 6.62 |
| 2 | 5573.00 | 163.00 | 2.92 |
| 3 | 5406.00 | 66.79 | 1.24 |
| 4 | 4892.75 | 290.18 | 5.93 |
| 5 | 4813.75 | 37.88 | 0.79 |
| 6 | 4168.00 | 79.33 | 1.90 |
| 7 | 11,502.50 | 610.59 | 5.31 |
| 8 | 8372.50 | 660.89 | 7.89 |
| 9 | 7955.00 | 170.20 | 2.14 |
| 10 | 10,321.33 | 45.94 | 0.45 |
| 11 | 8335.50 | 271.29 | 3.25 |
| 12 | 7641.75 | 339.62 | 4.44 |
| 13 | 8520.33 | 726.20 | 8.52 |
| 14 | 8171.00 | 179.57 | 2.20 |
| 15 | 6657.50 | 355.67 | 5.34 |
| 16 | 9472.50 | 659.61 | 6.96 |
| 17 | 8768.00 | 216.01 | 2.46 |
| 18 | 6657.50 | 355.67 | 5.34 |
| 19 | 6332.00 | 355.27 | 5.61 |
| 20 | 5202.00 | 149.84 | 2.88 |
| 21 | 4900.00 | 432.75 | 8.83 |
| Average CV% | – | – | 4.34 |
| Inter‐run | |||
| 1 | 8381.93 | 2157.27 | 25.74 |
| 2 | 7075.81 | 1681.79 | 23.77 |
| 3 | 6240.50 | 1347.46 | 21.59 |
| 4 | 8555.50 | 1834.60 | 21.44 |
| 5 | 8398.00 | 1994.66 | 23.75 |
| 6 | 8875.92 | 2176.79 | 24.52 |
| 7 | 7190.21 | 1618.45 | 22.51 |
| 8 | 5914.07 | 1046.38 | 17.69 |
| Average CV% | – | – | 22.63 |
3.7. Alternative potency assays for NK‐EVs’ functional assessment show limitations
Alternative potency assays were evaluated under the same conditions as this resazurin‐based cell viability assays, including assay length, seeding density (except for non‐plate‐based assays) and various NK‐EVs doses. Initially, the CCK8 viability assay, another metabolism‐based assay, was investigated, allowing for continuous monitoring of cell viability (72 hours of treatment). Both cell models (K562 and MDA‐MB‐231 cells) exhibited an increasing difference in CCK8 dye readings over time between high treatment doses (i.e., 2 × 10⁶ NK‐EVs per K562 cell) compared to untreated cells and the cells treated with lower doses of NK‐EVs, as shown in Figure S3A. For the highest dose of NK‐EVs (2 × 10⁶ NK‐EVs per K562 cell), it took approximately 3 and 48 hours to observe significant signal divergence from non‐treated K562 cells and non‐treated MDA‐MB‐231 cells, respectively. However, the seeding density of 5000 cells/well (suspension K562 cells) resulted in the loss of the assay range after approximately 48 hours of culture (Figure S3A‐i ). This was not the case for the seeding density of 1000 cells/well for adherent MDA‐MB‐231 cells. The CCK8 viability assay also strongly correlated with GzmB levels (|ρ| ∼ 0.8 with statistical significance and R 2 ∼ 0.637), as shown in Figure S3B. Importantly, CCK8 assay readings, like those of the resazurin‐based cell viability assay, are specific to a loss of cell viability and are not influenced by NK‐EVs alone, as shown in Figure S3C. To simplify the assay precision analysis, the intra/inter‐run variability was calculated using untreated cancer cells over time, and the results are comparable to the other samples. As shown in Figure S3D, the intra‐run variability ranges from 1.12 to 8.97% CV with a mean of 1.84% CV. As shown in Figure S3E, inter‐run variability ranges from 0.42 to 7.98% CV with a mean of 1.32% CV.
Further, the endpoint lactate dehydrogenase (LDH) release assay, often used as a surrogate for cytotoxicity via LDH release indicative of cell membrane damage during cell death processes, was also investigated. The measured signal was not selective to NK‐EVs' cytotoxicity but rather to endogenous LDH present in NK‐EVs, as evidenced by quantitative assessment in Figure S4A, where even NK‐EVs alone (in the absence of cells) could yield a signal indicative of LDH presence. Furthermore, a relatively low dose of 1 × 10⁸ NK‐EVs generated an LDH signal comparable to the one from the detergent‐treated cell control (theoretical maximum).
Next, the endpoint CellTox DNA‐binding dye cytotoxicity assay was also investigated. The assay signal was determined to be non‐selective, where quantitative assessment demonstrated an artificially generated assay signal when measuring DNA presence via the CellTox dye in NK‐EVs alone (without the presence of cells), as shown in Figure S4B. This indicates the presence of endogenously loaded DNA in NK‐EVs.
Lastly, AO/PI counting and flow cytometry methods for evaluating the cytotoxic effect of NK‐EVs were investigated. As shown in Figure S5, AO/PI cell counting, and flow cytometry methods could not yield the expected NK‐EVs’ cytotoxic dose‐response in both K562 and MDA‐MB‐231 cell models despite these assays working correctly according to controls. Figure S6 depicts the flow cytometry gating strategy.
4. DISCUSSION AND CONCLUSION
Potency assays are critical requirement for the development of commercially available cell and gene therapy products. Accordingly, potency assays should align with the published guidelines set forth by the ICH (ICH Q6B, ICH Q2(R2), ICH Q8), which are adopted and implemented internationally by multiple regulatory agencies. Potency assays, whether applied to biological or non‐biological, are defined as methods capable of predicting a product's specific ability to achieve the desired clinical outcome using appropriate laboratory tests, providing representative measurements of the therapeutic effect (FDA, 2011; Nguyen et al., 2020; Reiner et al., 2017). Adopting a standardised potency assay helps set acceptance limits for both the release and validation of drug substance, ensuring results meet specified criteria. Such test should possess key attributes, including the ability to (1) assess potential therapeutic function, (2) provide quantitative measurements, (3) utilise reference materials if possible and (4) contribute to confirmation of product identity. Additional requirements are needed for clinical manufacturing and product release (FDA, 2011; Geeurickx et al., 2019; Nguyen et al., 2020; Reiner et al., 2017).
As the interest in EV biotherapeutics in cancer treatment continues to grow, there is a critical need to establish, refine and standardise potency assays for cytotoxic EV products (Nguyen et al., 2020). These assays are crucial building blocks for developing and advancing therapeutic applications using EVs. For in vitro assays, various techniques, including flow cytometry (Cochran & Kornbluth, 2021; di Pace et al., 2020; Enomoto et al., 2022; Han et al., 2020; Jiang et al., 2021; Kim et al., 2022; Lugini et al., 2012; Wang et al., 2019; Zhu et al., 2017), cell counting (Jong et al., 2017; Kim et al., 2022; Wu et al., 2019), a range of plate‐based assays (Choi et al., 2020; Cochran & Kornbluth, 2021; Han et al., 2020; Jiang et al., 2021; Kaban et al., 2021; Kim et al., 2022; Shoae‐Hassani et al., 2017; St‐Denis‐Bissonnette et al., 2023; Wu et al., 2019; Yang et al., 2021; Zhu et al., 2019; Zhu et al., 2018) and reporter loss assays (Jong et al., 2017; Wang et al., 2019; Zhu et al., 2017) have been employed for this purpose. Nonetheless, challenges persist in the reliable evaluation of EVs’ therapeutic potential against cancer, hindering progress (Nguyen et al., 2020; St‐Denis‐Bissonnette et al., 2023). These challenges encompass various aspects of the preclinical assessment, including a lack of standardised or even proven assays, inconsistent dosing methodology (i.e., NTA vs. protein dosing), essential quality controls and inadequate time points or cell models (Gimona et al., 2017; Reiner et al., 2017). Potency assays should also allow for discrimination between an active and inactive or degraded form of the product (bioactivity levels) (FDA, 2011; Nguyen et al., 2020; Reiner et al., 2017). Adhering to regulatory guidelines is crucial, and potency assays play a vital role in their development (Gimona et al., 2017). Pursuing potential novel EV‐based therapeutics and comparing results between studies, EV lots/preparation, and individual experiments is complicated and sometimes only possible with a standardised evaluation process. Therefore, establishing standardised assays to robustly assess cytotoxic NK‐EVs is urgently needed.
To address this demand, we assessed a highly sensitive resazurin phenoxazine‐based cell viability potency assay (PrestoBlue HS Cell Viability Reagent) for evaluating the cytotoxic effect of NK‐EVs against cancer cells, building on promising results in our previous report (St‐Denis‐Bissonnette et al., 2023). This product is a ready‐to‐use resazurin‐based solution serving as a cell health indicator, using the reducing power of living cells to measure viability quantitatively. Other metabolism‐based cell viability assays, such as alamarBlue (resazurin‐based reagent), CellTiter‐Blue® cell viability assay (resazurin‐based reagent) and 3‐[4,5‐dimethylthiazol‐2‐yl]−2,5‐diphenyl tetrazolium bromide cell viability assay (MTT, a non‐resazurin‐based reagent) are also available. A 2014 study by Xu et al. (2015) showed that resazurin‐based assays (i.e., PrestoBlue cell viability assay (standard version) and alamarBlue cell viability assay) are more sensitive than the MTT cell viability assay. The authors proposed two rationales to substantiate this assertion: i) MTT primarily measures mitochondrial dehydrogenase activity, reduced mainly by oxidoreductase enzymes utilising NADH, whereas those resazurin‐based assays involve various mitochondrial enzymes and accept electrons from NADPH, FADH, FMNH, NADH and cytochromes, and ii) the reagent solubility difference where MTT formazan is insoluble comparatively to soluble resazurin. Additionally, resazurin reagents are non‐toxic compared to the MTT reagent and can be detected by both absorbance and fluorescence methods, offering more flexibility. The primary difference between commercially available resazurin reagents is the purity level, resulting in a more sensitive assay with reduced background noise. For example, the PrestoBlue cell viability assay (HS and standard version) is marketed as a faster assay with higher sensitivity (the manufacturer advertises a minimum 10‐min incubation) over the alamarBlue cell viability assay (manufacturer advertises a minimum 60‐min incubation). Although the alamarBlue cell viability assay has not been evaluated in this study, we have illustrated that the PrestoBlue HS cell viability assay enables rapid determination of cell viability within 30 min of incubation to attain statistically significant results using the 96‐well plate format. This result is consistent with previous study (Xu et al., 2015). It is conceivable that the advertised 10‐min incubation time may yield statistical significance when using the 384‐well plate format. Prolonged incubation increases the assay resolution by amplifying the signal difference (fold‐difference) between positive and negative sample readouts. In this study, 90‐min incubation was done to maximise the assay resolution. Nonetheless, the PrestoBlue HS cell viability assay incubation time is relatively short.
To evaluate the reliability and utility of resazurin‐based cell viability assay for NK‐EVs’ cytotoxicity measurements against cancer cells, our potency assay validation plan adhered to the regulatory guideline criteria mentioned earlier, including precision, accuracy, linearity, range, specificity, selectivity and stability (changes in bioactivity). The assay robustness was confirmed and validated internally but not further investigated; see the general chapter < 1033 > Biological Assay Validation (2013). This assay reliably evaluates the potency of NK‐EVs’ cytotoxicity by generating reproducible dose‐response curves in both suspension and adherent cancer cell models. Additionally, the cytotoxic dose‐response strongly correlates with recognised NK cytotoxic factor levels (i.e., FasL, GNLY, GzmB, PFN and IFN‐γ), with readouts specifically indicating a loss of target cancer cell viability and distinguishing varying levels of NK‐EVs’ bioactivity. This is crucial according to the ICH Q2(R2) guidelines (ICH, 2022). We demonstrated that resazurin‐based cell viability assay is a validated method for identifying changes in key quality attributes of NK‐EV product from NK‐EVs during storage. This stability‐indicating test reliably detects alterations in the products' characteristics over time. In summary, we have methodologically demonstrated that this highly sensitive resazurin‐based cell viability assay is well‐suited to evaluate the cytotoxic function of NK‐EVs biotherapeutics.
Generally, most plate‐based assays require minimal manipulations and enable extensive data collection and analysis, thereby improving statistical reproducibility (Abassi et al., 2009; Zhang et al., 1999). For a comprehensive evaluation, it is advisable to incorporate a minimum of five doses to investigate the dose‐response, as recommended by the MISEV2023 and ICH guidelines (Welsh et al., 2024; ICH, 2022). Furthermore, reporting results as functional units can facilitate clinical translation and cross‐study comparison (Nguyen et al., 2020; St‐Denis‐Bissonnette et al., 2023). In this context, the functional unit can be derived by generating a non‐linear regression to obtain the EC50 and Hillslope values. The EC50 represents the concentration required to elicit a response halfway between the baseline and maximum responses. This would translate to a 50% cytotoxic response from NK‐EVs against the target cancer cells. Therefore, regardless of the specific doses utilised in a study, reporting the EC50 (ideally for both particle‐based or protein‐based dosing; EV/mL or E: T ratio and protein/mL or protein quantity) and the Hillslope value could alleviate the challenge of comparing results across studies, EV preparations, and individual experiments, thereby standardising the assessment of EV therapeutics.
We also investigated alternative potency assays commonly used to assess NK‐EVs' cytotoxicity, revealing significant limitations. Notably, flow cytometry is a widely used method for characterising and evaluating cell‐based products. However, it has shown poor utility in evaluating NK‐EVs’ cytotoxicity in our study. The same trend was also observed for AO/PI cell counting (dual stain working via Förster resonance energy transfer—FRET), despite its recognised utility for cell counting in cell passaging by the International Organization for Standardization (ISO) (Altman et al., 1993; Jones & Senft, 1985; Mascotti et al., 2000). Theoretically, comparable results would be anticipated with Trypan Blue staining, a more commonly used method than AO/PI for cell viability assessment but is known to be less accurate than AO/PI counting (Altman et al., 1993; Jones & Senft, 1985; Mascotti et al., 2000). Importantly, these assays were tested using cancer cells treated with the same effector NK‐EVs to target cell ratios as used in the resazurin‐based cell viability assay. Whilst the highest dose tested yielded complete cancer cell killing according to this resazurin‐based cell viability assay, neither flow cytometry nor AO/PI cell counting revealed cell killing. We postulate bias is introduced during the necessary cell‐washing steps, impacting downstream measurements where dying cancer cells are washed away and lost. For example, cells with compromised structural integrity (e.g., lysed and dying cells) are likely lost in this process, resulting in unreliable analysis. This would be akin to cells treated with a detergent (i.e., Triton‐X), where significantly fewer cells would be detectable by flow cytometry or cell counting. Despite their widespread use to assess the functionality of NK‐EVs our study was unable to accurately and reliably assess NK‐EVs potency using these methods.
Similarly, we conducted several additional plate‐based assaysand observed that confluence and reporter loss assays areunsuited for the brief assessment period (<5 hours) due to their limited resolution and sensitivity when measured by an image‐based cytometer (data not shown). Alternatively, an extended assessment period could be employed to discern differences in the NK‐EVs’ effect, as shown by other groups (Jiang et al., 2021; Kaban et al., 2021). On average, the treatment duration of 24–48 hours was necessary before significant changes became evident, with longer treatment durations amplifying the cytotoxic effect of NK‐EVs. For example, our study found that the CCK8 assay, which exhibited potential for continuous evaluation of NK‐EVs’ cytotoxicity (showing great precision, signal readout specificity and selectivity), requires a longer duration to discern differences between the treatments and the controls. Of note, the CCK8 assay, using WST‐8 reagent as the tetrazolium salt, resembles the previously mentioned MTT assay, which uses MTT reagent as the tetrazolium salt. According to the manufacturer, both tetrazolium salts are reduced to formazan in metabolically active cells. However, only the formazan produced by CCK8 is soluble and non‐toxic. Therefore, the CCK8 assay, along with other assays such as confluence, reporter loss and bioelectronic/impedance‐based assays, could be helpful for live monitoring assessment of NK‐EVs’ cytotoxic effect against cancer cells as an ‛orthogonal procedure comparison’ potency assay per the ICH guidelines. Live monitoring assays offer cost‐effective and efficient approaches to overcoming limitations associated with traditional endpoint assays (i.e., insufficient information from a single data point and indirect and potentially destructive biochemical detection measures). However, some will require specialised and often expensive equipment (i.e., bioelectronic/impedance‐based assays and quantitative image‐based cytometer instruments). Whilst these assays could prove valuable for evaluating outcomes over extended durations, their effectiveness as potency assays for NK‐EVs should be carefully considered, particularly in light of the swift and rapid cytotoxic effect of NK‐EVs.
Lastly, it is important to note that endogenous components present in NK‐EVs can significantly affect potency assessment, especially when these are directly involved in the assay principle, as observed in LDH release assay and CellTox™ Green Cytotoxicity. For instance, despite dose‐response results for these assays (data not shown), we observed an artificial increase in NK‐EVs’ readouts (i.e. background/interference) based on NK‐EVs alone, leading to false‐positive cytotoxicity readouts and lack of sensitivity. This outcome is logical, given that LDH is a well‐known protein commonly found in EVs (see ExoCarta Top 100 database) and will interfere with an LDH release‐based potency assay (Göran Ronquist, 2019). Similarly, the known presence of nucleic acid molecules in EVs prevents the application of a potency assay relying on DNA‐binding dyes. Consequently, despite their frequent use in the literature, these two assays cannot accurately and reliably measure NK‐EVs’ cytotoxicity, as their readouts lack selectivity to cell death.
In conclusion, our study reveals that this highly sensitive resazurin phenoxazine‐based cell viability assay is an analytical method suitable for potency evaluation of cytotoxic NK‐EVs. This assay also demonstrates that other types of EVs, such as the 293F‐EVs shown in this study, lack cytotoxicity potential. However, we have not conducted cytotoxic experiments on other types of EVs. This work highlights the importance of reproducibility, reliability and high‐throughput capabilities, aligning with and meeting regulatory guidelines for potency assays. Notably, our results suggest that the highly sensitive resazurin‐based cell viability assay has the potential to predict whether a particular NK‐EVs’ preparation can achieve its intended therapeutic effects and may enable the comparison of EV preparations produced across batches, manufacturing platforms or from different producer cells. Furthermore, this assay stands out for its cost‐effectiveness (< CAD 0.09/test), safety (non‐toxic), disposability, rapid turnaround (1–5 hours), ease of use and access and potential for automation. Researchers and regulatory agencies' efforts towards standardisation and recognition of the necessity for reliable and reproducible potency assays signify encouraging progress. Continued research endeavours will help to overcome challenges and advance the field of EV‐based therapeutics, facilitating clinical translation.
AUTHOR CONTRIBUTIONS
Jessie R. Lavoie, Lisheng Wang and Frédéric St‐Denis‐Bissonnette conceived the idea. Frédéric St‐Denis‐Bissonnette cultured and maintained all the cell lines. Amit Shrestha generated the RPF‐MDA‐MB‐231 cell line. Frédéric St‐Denis‐Bissonnette and Gauri Muradia performed the NK‐EVs’ biomanufacturing. Frédéric St‐Denis‐Bissonnette performed the EV isolation and EV characterisation (NTA assessment, protein and nucleic acids quantification). Gauri Muradia performed the ELISA assessment, and Frédéric St‐Denis‐Bissonnette performed the analyses. Frédéric St‐Denis‐Bissonnette performed all EV cytotoxicity assays (flow and plate‐based), and Shirley Qiu contributed to the processing of flow cytometry samples. Andrew Stalker acquired flow cytometry data, and Gauri Muradia performed AO/PI counting. Jessie R. Lavoie, Lisheng Wang and Frédéric St‐Denis‐Bissonnette contributed to the cytotoxicity analyses. Frédéric St‐Denis‐Bissonnette and Melanie Kirkby performed the bioactivity assessment (EV isolation, EV characterisation and EV cytotoxicity assays) with the help of Jelica Mehic for NTA assessment. Frédéric St‐Denis‐Bissonnette performed additional cell viability assay validation. Jessie R. Lavoie, Lisheng Wang and Frédéric St‐Denis‐Bissonnette performed the statistical analyses. All authors contributed general intellectual inputs on the experimental design, contributed to the data analysis, and discussed the results. Jessie R. Lavoie, Lisheng Wang and Frédéric St‐Denis‐Bissonnette wrote the manuscript and assembled the figures. All authors reviewed and edited the manuscript and approved its final version.
CONFLICT OF INTEREST STATEMENT
Most authors declare no conflict of interest. MA is a Scientific Advisory Board Member for Aakha Therapeutics and is under a contract agreement to perform sponsored research with Dragonfly Therapeutics. Neither consulting nor sponsored research is related to the present article.
Supporting information
Supporting Information
Supporting Information
Supporting Information
Supporting Information
Supporting Information
Supporting Information
Supporting Information
ACKNOWLEDGEMENTS
The authors would like to acknowledge and thank Health Canada's researchers, specifically Dr. Donald Gagné and Dr. Huixin Lu, for their support in packing the HiScale 10/40 column; Dr. Dawn Jin for sharing the CellCyte (quantitative Image‐Base Cytometry) instrument; and Dr. Eric Deneault, Dr. Roger Tam and Dr. Simon Sauvé for their critical manuscript reviews. This work was supported by operating grants from the Genomics Research and Development Initiative (GRDI) Phase VII (2019‐2025) from the Government of Canada obtained by JRL, LW, as well as operating grants from the Natural Sciences and Engineering Research Council RGPIN‐2019‐05220, Cancer Research Society/University of Ottawa 24064, the Canadian Institutes of Health (CIHR) Research Operating Grant 175177 obtained by LW, the CIHR MSc Scholarship obtained by MK, and the Queen Elizabeth II Scholarships in Science and Technology (QEII‐GSST) obtained by FSDB.
St‐Denis‐Bissonnette, F. , Qiu, S. , Cummings, S. E. , Kirkby, M. , Haile, Y. , Wassmer, S. , Muradia, G. , Mehic, J. , Stalker, A. , Shrestha, A. , Ardolino, M. , Lee, S.‐H. , Burger, D. , Wang, L. , & Lavoie, J. R. (2024). Evaluation of Resazurin Phenoxazine Dye as a Highly Sensitive Cell Viability Potency Assay for Natural Killer Cell‐derived Extracellular Vesicle‐based Cancer Biotherapeutics. Journal of Extracellular Biology, 3, e166. 10.1002/jex2.166
Contributor Information
Lisheng Wang, Email: Lisheng.Wang@uottawa.ca.
Jessie R. Lavoie, Email: jessie.lavoie@hc-sc.gc.ca.
REFERENCES
- Abassi, Y. A. , Xi, B. , Zhang, W. , Ye, P. , Kirstein, S. L. , Gaylord, M. R. , Feinstein, S. C. , Wang, X. , & Xu, X. (2009). Kinetic cell‐based morphological screening: Prediction of mechanism of compound action and off‐target effects. Chemistry & Biology, 16(7), 712–723. [DOI] [PMC free article] [PubMed] [Google Scholar]
- Altman, S. A. , Randers, L. , & Rao, G. (1993). Comparison of trypan blue dye exclusion and fluorometric assays for mammalian cell viability determinations. Biotechnology Progress, 9(6), 671–674. [DOI] [PubMed] [Google Scholar]
- Choi, J. W. , Lim, S. , Kang, J. H. , Hwang, S. H. , Hwang, K. C. , Kim, S. W. , & Lee, S. (2020). Proteome analysis of human natural killer cell derived extracellular vesicles for identification of anticancer effectors. Molecules (Basel, Switzerland), 25(21), 5216. [DOI] [PMC free article] [PubMed] [Google Scholar]
- Cochran, A. M. , & Kornbluth, J. (2021). Extracellular vesicles from the human natural killer cell line NK3.3 have broad and potent anti‐tumor activity. Frontiers in Cell and Developmental Biology, 9, 698639. [DOI] [PMC free article] [PubMed] [Google Scholar]
- di Pace, A. L. , Tumino, N. , Besi, F. , Alicata, C. , Conti, L. A. , Munari, E. , Maggi, E. , Vacca, P. , & Moretta, L. (2020). Characterization of human NK cell‐derived exosomes: Role of DNAM1 receptor in exosome‐mediated cytotoxicity against tumor. Cancers, 12(3), 661. [DOI] [PMC free article] [PubMed] [Google Scholar]
- Dosil, S. G. , Lopez‐Cobo, S. , Rodriguez‐Galan, A. , Fernandez‐Delgado, I. , Ramirez‐Huesca, M. , Milan‐Rois, P. , Castellanos, M. , Somoza, A. , Gómez, M. J. , Reyburn, H. T. , Vales‐Gomez, M. , Sánchez Madrid, F. , & Fernandez‐Messina, L. (2022). Natural killer (NK) cell‐derived extracellular‐vesicle shuttled microRNAs control T cell responses. Elife, 11, e76319. [DOI] [PMC free article] [PubMed] [Google Scholar]
- EL Andaloussi, S. , Mäger, I. , Breakefield, X. O. , & Wood, M. J. (2013). Extracellular vesicles: Biology and emerging therapeutic opportunities. Nature Reviews. Drug Discovery, 12(5), 347–357. [DOI] [PubMed] [Google Scholar]
- Elsharkasy, O. M. , Nordin, J. Z. , Hagey, D. W. , de Jong, O. G. , Schiffelers, R. M. , Andaloussi, S. E. , & Vader, P. (2020). Extracellular vesicles as drug delivery systems: Why and how? Advanced Drug Delivery Reviews, 159, 332–343. [DOI] [PubMed] [Google Scholar]
- Enomoto, Y. , Li, P. , Jenkins, L. M. , Anastasakis, D. , Lyons, G. C. , Hafner, M. , & Leonard, W. J. (2022). Cytokine‐enhanced cytolytic activity of exosomes from NK Cells. Cancer Gene Therapy, 29(6), 734–749. [DOI] [PMC free article] [PubMed] [Google Scholar]
- Farcas, M. , & Inngjerdingen, M. (2020). Natural killer cell‐derived extracellular vesicles in cancer therapy. Scandinavian Journal of Immunology, 92(4), e12938. [DOI] [PubMed] [Google Scholar]
- FDA . (2011). Potency Tests for Cellular and Gene Therapy Products . Available from: https://www.fda.gov/regulatory‐information/search‐fda‐guidance‐documents/potency‐tests‐cellular‐and‐gene‐therapy‐products
- Federici, C. , Petrucci, F. , Caimi, S. , Cesolini, A. , Logozzi, M. , Borghi, M. , D'Ilio, S. , Lugini, L. , Violante, N. , Azzarito, T. , Majorani, C. , Brambilla, D. , & Fais, S. (2014). Exosome release and low pH belong to a framework of resistance of human melanoma cells to cisplatin. PLoS ONE, 9(2), e88193. [DOI] [PMC free article] [PubMed] [Google Scholar]
- Federici, C. , Shahaj, E. , Cecchetti, S. , Camerini, S. , Casella, M. , Iessi, E. , Camisaschi, C. , Paolino, G. , Calvieri, S. , Ferro, S. , Cova, A. , Squarcina, P. , Bertuccini, L. , Iosi, F. , Huber, V. , & Lugini, L. (2020). Natural‐killer‐derived extracellular vesicles: Immune sensors and interactors. Frontiers in Immunology, 11, 262. [DOI] [PMC free article] [PubMed] [Google Scholar]
- Gandham, S. , Su, X. , Wood, J. , Nocera, A. L. , Alli, S. C. , Milane, L. , Zimmerman, A. , Amiji, M. , & Ivanov, A. R. (2020). Technologies and standardization in research on extracellular vesicles. Trends in Biotechnology, 38(10), 1066–1098. [DOI] [PMC free article] [PubMed] [Google Scholar]
- Geeurickx, E. , Tulkens, J. , Dhondt, B. , Van Deun, J. , Lippens, L. , Vergauwen, G. , Heyrman, E. , De Sutter, D. , Gevaert, K. , Impens, F. , Miinalainen, I. , Van Bockstal, P. J. , De Beer, T. , Wauben, M. H. M. , Nolte‐’t‐Hoen, E. N. M. , Bloch, K. , Swinnen, J. V. , van der Pol, E. , Nieuwland, R. , … Hendrix, A. (2019). The generation and use of recombinant extracellular vesicles as biological reference material. Nature Communications, 10(1), 3288. [DOI] [PMC free article] [PubMed] [Google Scholar]
- Gimona, M. , Pachler, K. , Laner‐Plamberger, S. , Schallmoser, K. , & Rohde, E. (2017). Manufacturing of human extracellular vesicle‐based therapeutics for clinical use. International Journal of Molecular Sciences, 18(6), 1190. [DOI] [PMC free article] [PubMed] [Google Scholar]
- Göran Ronquist, K. (2019). Extracellular vesicles and energy metabolism. Clinica Chimica Acta; International Journal of Clinical Chemistry, 488, 116–121. [DOI] [PubMed] [Google Scholar]
- Han, D. , Wang, K. , Zhang, T. , Gao, G. C. , & Xu, H. (2020). Natural killer cell‐derived exosome‐entrapped paclitaxel can enhance its anti‐tumor effect. European Review for Medical and Pharmacological Sciences, 24(10), 5703–5713. [DOI] [PubMed] [Google Scholar]
- ICH . (2022). ICH harmonised guidelines Q2(R2) ‐ Validation of Analytical Procedures. Available from: https://database.ich.org/sites/default/files/ICH_Q2‐R2_Document_Step2_Guideline_2022_0324.pdf
- Jiang, Y. , Jiang, H. , Wang, K. , Liu, C. , Man, X. , & Fu, Q. (2021). Hypoxia enhances the production and antitumor effect of exosomes derived from natural killer cells. Annals of Translational Medicine, 9(6), 473. [DOI] [PMC free article] [PubMed] [Google Scholar]
- Jiang, Y. , Wang, F. , Wang, K. , Zhong, Y. , Wei, X. , Wang, Q. , & Zhang, H. (2021). Engineered exosomes: A promising drug delivery strategy for brain diseases. Current Medicinal Chemistry, 29(17), 3111–3124. [DOI] [PubMed] [Google Scholar]
- Jones, K. H. , & Senft, J. A. (1985). An improved method to determine cell viability by simultaneous staining with fluorescein diacetate‐propidium iodide. The Journal of Histochemistry and Cytochemistry: Official Journal of the Histochemistry Society, 33(1), 77–79. [DOI] [PubMed] [Google Scholar]
- Jong, A. Y. , Wu, C. H. , Li, J. , Sun, J. , Fabbri, M. , Wayne, A. S. , & Seeger, R. C. (2017). Large‐scale isolation and cytotoxicity of extracellular vesicles derived from activated human natural killer cells. Journal of Extracellular Vesicles, 6(1), 1294368. [DOI] [PMC free article] [PubMed] [Google Scholar]
- Kaban, K. , Hinterleitner, C. , Zhou, Y. , Salva, E. , Kantarci, A. G. , Salih, H. R. , & Märklin, M. (2021). Therapeutic silencing of BCL‐2 using NK cell‐derived exosomes as a novel therapeutic approach in breast cancer. Cancers, 13(10), 2397. [DOI] [PMC free article] [PubMed] [Google Scholar]
- Kim, H. Y. , Min, H. K. , Song, H. W. , Yoo, A. , Lee, S. , Kim, K. P. , Park, J. O. , Choi, Y. H. , & Choi, E. (2022). Delivery of human natural killer cell‐derived exosomes for liver cancer therapy: An in vivo study in subcutaneous and orthotopic animal models. Drug Delivery, 29(1), 2897–2911. [DOI] [PMC free article] [PubMed] [Google Scholar]
- Lener, T. , Gimona, M. , Aigner, L. , Börger, V. , Buzas, E. , Camussi, G. , Chaput, N. , Chatterjee, D. , Court, F. A. , Del Portillo, H. A. , O'Driscoll, L. , Fais, S. , Falcon‐Perez, J. M. , Felderhoff‐Mueser, U. , Fraile, L. , Gho, Y. S. , Görgens, A. , Gupta, R. C. , Hendrix, A. , … Giebel, B. (2015). Applying extracellular vesicles based therapeutics in clinical trials—an ISEV position paper. Journal of Extracellular Vesicles, 4, 30087. [DOI] [PMC free article] [PubMed] [Google Scholar]
- Lugini, L. , Cecchetti, S. , Huber, V. , Luciani, F. , Macchia, G. , Spadaro, F. , Paris, L. , Abalsamo, L. , Colone, M. , Molinari, A. , Podo, F. , Rivoltini, L. , Ramoni, C. , & Fais, S. (2012). Immune surveillance properties of human NK cell‐derived exosomes. Journal of Immunology (Baltimore, Md.: 1950), 189(6), 2833–2842. [DOI] [PubMed] [Google Scholar]
- Mascotti, K. , McCullough, J. , & Burger, S. R. (2000). HPC viability measurement: Trypan blue versus acridine orange and propidium iodide. Transfusion, 40(6), 693–696. [DOI] [PubMed] [Google Scholar]
- Neviani, P. , Wise, P. M. , Murtadha, M. , Liu, C. W. , Wu, C. H. , Jong, A. Y. , Seeger, R. C. , & Fabbri, M. (2019). Natural killer‐derived exosomal miR‐186 inhibits neuroblastoma growth and immune escape mechanisms. Cancer Research, 79(6), 1151–1164. [DOI] [PMC free article] [PubMed] [Google Scholar]
- Nguyen, V. V. T. , Witwer, K. W. , Verhaar, M. C. , Strunk, D. , & van Balkom, B. W. M. (2020). Functional assays to assess the therapeutic potential of extracellular vesicles. Journal of Extracellular Vesicles, 10(1), e12033. [DOI] [PMC free article] [PubMed] [Google Scholar]
- Nieuwland, R. , Falcón‐Pérez, J. M. , Théry, C. , & Witwer, K. W. (2020). Rigor and standardization of extracellular vesicle research: Paving the road towards robustness. Journal of Extracellular Vesicles, 10(2), e12037. [DOI] [PMC free article] [PubMed] [Google Scholar]
- Pharmacopeia, U. S. (2013). (1033) Biological Assay Validation (General chapters ‐ General information, Issue). Available from: https://online.uspnf.com/uspnf/document/1_GUID‐952E8C3B‐738B‐40F8‐A552‐E14026AC78A9_1_en‐US
- Pross, H. F. , Baines, M. G. , Rubin, P. , Shragge, P. , & Patterson, M. S. (1981). Spontaneous human lymphocyte‐mediated cytotoxicity against tumor target cells. IX. The quantitation of natural killer cell activity. Journal of Clinical Immunology, 1(1), 51–63. [DOI] [PubMed] [Google Scholar]
- Reiner, A. T. , Witwer, K. W. , van Balkom, B. W. M. , de Beer, J. , Brodie, C. , Corteling, R. L. , Gabrielsson, S. , Gimona, M. , Ibrahim, A. G. , de Kleijn, D. , Lai, C. P. , Lötvall, J. , Del Portillo, H. A. , Reischl, I. G. , Riazifar, M. , Salomon, C. , Tahara, H. , Toh, W. S. , Wauben, M. H. M. , … Lim, S. K. (2017). Concise review: Developing best‐practice models for the therapeutic use of extracellular vesicles. Stem Cells Translational Medicine, 6(8), 1730–1739. [DOI] [PMC free article] [PubMed] [Google Scholar]
- Shoae‐Hassani, A. , Hamidieh, A. A. , Behfar, M. , Mohseni, R. , Mortazavi‐Tabatabaei, S. A. , & Asgharzadeh, S. (2017). NK cell‐derived exosomes from NK cells previously exposed to neuroblastoma cells augment the antitumor activity of cytokine‐activated NK cells. Journal of Immunotherapy (Hagerstown, Md.: 1997), 40(7), 265–276. [DOI] [PMC free article] [PubMed] [Google Scholar]
- St‐Denis‐Bissonnette, F. , Cummings, S. E. , Qiu, S. , Stalker, A. , Muradia, G. , Mehic, J. , Mediratta, K. , Kaczmarek, S. , Burger, D. , Lee, S. H. , Wang, L. , & Lavoie, J. R. (2023). A clinically relevant large‐scale biomanufacturing workflow to produce natural killer cells and natural killer cell‐derived extracellular vesicles for cancer immunotherapy. Journal of Extracellular Vesicles, 12(12), e12387. [DOI] [PMC free article] [PubMed] [Google Scholar]
- St‐Denis‐Bissonnette, F. , Khoury, R. , Mediratta, K. , El‐Sahli, S. , Wang, L. , & Lavoie, J. R. (2022). Applications of extracellular vesicles in triple‐negative breast cancer. Cancers, 14(2), 451. [DOI] [PMC free article] [PubMed] [Google Scholar]
- Sun, H. , Shi, K. , Qi, K. , Kong, H. , Zhang, J. , Dai, S. , Ye, W. , Deng, T. , He, Q. , & Zhou, M. (2019). Natural killer cell‐derived exosomal miR‐3607‐3p inhibits pancreatic cancer progression by targeting IL‐26. Frontiers in Immunology, 10, 2819. [DOI] [PMC free article] [PubMed] [Google Scholar] [Retracted]
- Van Deun, J. , Mestdagh, P. , Agostinis, P. , Akay, Ö. , Anand, S. , Anckaert, J. , Martinez, Z. A. , Baetens, T. , Beghein, E. , Bertier, L. , Berx, G. , Boere, J. , Boukouris, S. , Bremer, M. , Buschmann, D. , Byrd, J. B. , Casert, C. , Cheng, L. , Hendrix, A. , … EV‐TRACK Consortium . (2017). EV‐TRACK: Transparent reporting and centralizing knowledge in extracellular vesicle research. Nature Methods, 14(3), 228–232. [DOI] [PubMed] [Google Scholar]
- Wang, G. , Hu, W. , Chen, H. , Shou, X. , Ye, T. , & Xu, Y. (2019). Cocktail strategy based on NK cell‐derived exosomes and their biomimetic nanoparticles for dual tumor therapy. Cancers, 11(10), 1560. [DOI] [PMC free article] [PubMed] [Google Scholar]
- Welsh, J. A. , Goberdhan, D. C. I. , O'Driscoll, L. , Buzas, E. I. , Blenkiron, C. , Bussolati, B. , Cai, H. , Di Vizio, D. , Driedonks, T. A. P. , Erdbrügger, U. , Falcon‐Perez, J. M. , Fu, Q. L. , Hill, A. F. , Lenassi, M. , Lim, S. K. , Mahoney, M. G. , Mohanty, S. , Möller, A. , Nieuwland, R. , … Witwer, K. W. (2024). Minimal information for studies of extracellular vesicles (MISEV2023): From basic to advanced approaches. Journal of Extracellular Vesicles, 13(2), e12404. [DOI] [PMC free article] [PubMed] [Google Scholar]
- Wu, C. H. , Li, J. , Li, L. , Sun, J. , Fabbri, M. , Wayne, A. S. , Seeger, R. C. , & Jong, A. Y. (2019). Extracellular vesicles derived from natural killer cells use multiple cytotoxic proteins and killing mechanisms to target cancer cells. Journal of Extracellular Vesicles, 8(1), 1588538. [DOI] [PMC free article] [PubMed] [Google Scholar]
- Wu, F. , Xie, M. , Hun, M. , She, Z. , Li, C. , Luo, S. , Chen, X. , Wan, W. , Wen, C. , & Tian, J. (2021). Natural killer cell‐derived extracellular vesicles: Novel players in cancer immunotherapy. Frontiers in Immunology, 12, 658698. [DOI] [PMC free article] [PubMed] [Google Scholar]
- Xu, M. , McCanna, D. J. , & Sivak, J. G. (2015). Use of the viability reagent PrestoBlue in comparison with alamarBlue and MTT to assess the viability of human corneal epithelial cells. Journal of Pharmacological and Toxicological Methods, 71, 1–7. [DOI] [PubMed] [Google Scholar]
- Yáñez‐Mó, M. , Siljander, P. R. , Andreu, Z. , Zavec, A. B. , Borràs, F. E. , Buzas, E. I. , Buzas, K. , Casal, E. , Cappello, F. , Carvalho, J. , Colás, E. , Cordeiro‐da Silva, A. , Fais, S. , Falcon‐Perez, J. M. , Ghobrial, I. M. , Giebel, B. , Gimona, M. , Graner, M. , Gursel, I. , … de Wever, O. (2015). Biological properties of extracellular vesicles and their physiological functions. Journal of Extracellular Vesicles, 4, 27066. [DOI] [PMC free article] [PubMed] [Google Scholar]
- Yang, P. , Cao, X. , Cai, H. , Feng, P. , Chen, X. , Zhu, Y. , Yang, Y. , An, W. , Yang, Y. , & Jie, J. (2021). The exosomes derived from CAR‐T cell efficiently target mesothelin and reduce triple‐negative breast cancer growth. Cellular Immunology, 360, 104262. [DOI] [PubMed] [Google Scholar]
- Zhang, J. H. , Chung, T. D. , & Oldenburg, K. R. (1999). A simple statistical parameter for use in evaluation and validation of high throughput screening assays. Journal of Biomolecular Screening, 4(2), 67–73. [DOI] [PubMed] [Google Scholar]
- Zhu, L. , Gangadaran, P. , Kalimuthu, S. , Oh, J. M. , Baek, S. H. , Jeong, S. Y. , Lee, S. W. , Lee, J. , & Ahn, B. C. (2018). Novel alternatives to extracellular vesicle‐based immunotherapy—exosome mimetics derived from natural killer cells. Artificial Cells, Nanomedicine, and Biotechnology, 46(sup3), S166–S179. [DOI] [PubMed] [Google Scholar]
- Zhu, L. , Kalimuthu, S. , Gangadaran, P. , Oh, J. M. , Lee, H. W. , Baek, S. H. , Jeong, S. Y. , Lee, S. W. , Lee, J. , & Ahn, B. C. (2017). Exosomes derived from natural killer cells exert therapeutic effect in melanoma. Theranostics, 7(10), 2732–2745. [DOI] [PMC free article] [PubMed] [Google Scholar]
- Zhu, L. , Kalimuthu, S. , Oh, J. M. , Gangadaran, P. , Baek, S. H. , Jeong, S. Y. , Lee, S. W. , Lee, J. , & Ahn, B. C. (2019). Enhancement of antitumor potency of extracellular vesicles derived from natural killer cells by IL‐15 priming. Biomaterials, 190‐191, 38–50. [DOI] [PubMed] [Google Scholar]
Associated Data
This section collects any data citations, data availability statements, or supplementary materials included in this article.
Supplementary Materials
Supporting Information
Supporting Information
Supporting Information
Supporting Information
Supporting Information
Supporting Information
Supporting Information