Abstract
A structure–property–process relation is established for a diblock bottlebrush copolymer solution, through a combination of rheo-neutron scattering, imaging, and rheological measurements. Polylactic acid--polystyrene diblock bottlebrush copolymers were dispersed in toluene with a concentration of 175 mg ml−1, where they self-assembled into a lamellar phase. All measurements were carried out at 5 °C. The solution color, as observed in reflection, is shown to be a function of the shear rate. Under equilibrium and near-equilibrium conditions, the solution has a green color. At low shear rates the solution remains green, while at intermediate rates the solution is cyan. At the highest rates applied the solution is indigo. The lamellar spacing is shown to be a decreasing function of shear rate, partially accounting for the color change. The lamellae are oriented ‘face-on’ with the wall under quiescence and low shear rates, while a switch to ‘edge-on’ is observed at the highest shear rates, where the reflected color disappears. The intramolecular distance between bottlebrush polymers does not change with shear rate, although at high shear rates, the bottlebrush polymers are preferentially aligned in the vorticity direction within the lamellae. We therefore form a consistent relation between structure and function, spanning a wide range of length scales and shear rates.
I. Introduction
Bottlebrush polymers are a class of high molecular weight polymers consisting of a single linear backbone with a series of side chains densely grafted along the length of a linear backbone. These materials have garnered significant attention due to the wide range of physical properties that are accessed by adjusting the polymer’s chemistry, backbone length, side chain length, and graft density.1–6 Bottlebrush polymers are characterized by the steric repulsions between side chains forcing the linear backbone to elongate, thus inhibiting the formation of entanglements along the length of the polymer at molecular weights where entanglements are observed in linear chains of the same chemistry.2,7–13 The extent of this steric repulsive effect is dependent on the length of the arms relative to their spacing.1,3,14,15
The fundamental branched architecture of a bottlebrush polymer provides access to a wide range of polymer properties simply by modifying the polymer’s topology. Bulky wedge and dendrimer side groups grafted onto a linear backbone lead to an increase in the polymer’s persistence length, thus resulting in a stiffer molecule.16–25 The space occupied by dendrimer and wedge polymers is significantly larger than that occupied by a liner polymer of equivalent length.24 As a result, dendrimer graft polymers differentiate themselves from bottlebrush polymers by adopting an intrinsic shape that is retained when the material is deposited on a surface.23,26 On the other hand, lowering the graft density of bottlebrush polymers leads to what are known as low density bottlebrush polymers and comb polymers.27 These materials are significantly more flexible than bottlebrush polymers.1,27,28 With such a broad range of properties accessible simply through modifications to the topology of the material, a number of potential applications for these polymers have been identified, such as super soft elastomers,27 drug delivery mechanisms,29,30 stimuli responsive polymers,31,32 liquid crystals,17 and photonic materials.20,33–35One-dimensional photonic crystals (PCs) are a class of composite photonic material also known as Bragg stacks. These materials are composed of alternating layers of high and low refractive index materials with a periodic spacing on the order of the wavelength of light. This structure results in a photonic band gap within the material that prohibits the propagation of specific wavelengths of light, instead constructively reflecting them.36–38 The wavelength of the reflected light can be approximated by the layer spacing and the refractive indices of each layer using
| (1) |
where is the calculated reflected wavelength of light, is the index of refraction of one of the layers, and is the index of refraction of the other layer.33,39 The terms and correspond to the sizes of layers 1 and 2, respectively, and are assumed to be equal.
Recent studies have been demonstrated the possibility of producing photonic crystals with domain spacing on the order of 100 nm using ultrahigh molecular weight linear diblock copolymers.40,41 However, issues arising from processability and entanglements between linear polymer chains limit their use in practical situations.33,34 Diblock bottlebrush copolymers circumvent these challenges. The semi-flexible behavior, as well as the increased effective radius of these polymers, allow for the rapid self-assembly of microstructures with large domain sizes that are typically difficult or impossible to access with linear polymers of equivalent molecular weight.42 Recent studies have focused on the self-assembly of uniform diblock bottlebrush copolymers into regular lamellar structures with domain spacings upward of 100 nm to form one-dimensional photonic crystals.20,33,42–45
Investigations into the self-assembly of diblock bottlebrush copolymers into PCs have primarily focused on the material under quiescent conditions, typically after allowing the bottlebrushes to dry and form a thin film. Miyake et al. characterized the effects of molecular weight on the reflected color, concluding that increasing the backbone length without changing the arm length caused an increase in the lamellar spacing, which resulted in the peak reflected wavelength shifting to longer wavelengths.45 Two studies, one from Macfarlane et al. and another from Miyake et al., have demonstrated how the domain spacing of the lamellar microstructure observed in a diblock bottlebrush thin film could also be increased through the addition of linear polymers or higher molecular weight diblock bottlebrush copolymers, respectively.42,43
It is common, when characterizing diblock bottlebrush PCs, that the polymer thin film is formed through solvent-casting on either the inside of a vial or on a pre-treated substrate. This process results in a uniform structure formed under no-shear conditions. However, the films formed may not be at equilibrium because of the rate at which the solvent evaporates, leaving the assembly in a kinetically trapped state. Annealing of the thin films at an elevated temperature provides additional thermal energy that can be used to more effectively explore the potential energy landscape, allowing the material to progress toward thermodynamic equilibrium.20,44 Considering the microstructure of the bottlebrush polymer under quiescent conditions, therefore, only provides insight into equilibrium and near-equilibrium structures.
Prior studies characterizing the microstructure of gels and polymeric systems have demonstrated the significance of the out-of-equilibrium processing conditions of a soft material can have on its microstructure and thus macroscopic properties.46–49 Extensive experimental and computational work on diblock copolymers has demonstrated how the application of shear can lead to a reorientation50–52 and in certain cases, a complete reconfiguration53–55 of the self-assembled microstructure depending on the applied shear rate and chemistry of the polymer. The well-established relation between self-assembled microstructure and applied shear rate allows for on-the-fly tuning of material properties simply by adjusting the processing conditions. In the case of additive manufacturing processes such as melt extrusion and direct ink writing, this property–process relation implies that the self-assembled microstructure, and thus the color, of the diblock bottlebrush copolymer can be actively adjusted during the printing process. Control over the sample color by adjusting printing conditions has the potential to replace existing color printing technology that relies on the addition of dyes containing toxic material to the bulk filament.56 Use of this material would also allow for multiple colors to be printed from a single source material, something only achieved with current printing technology using complex and time-consuming setups that require the use of multiple pre-dyed materials to print in more than one color.
In melt extrusion and direct-ink-writing, the deposited polymer undergoes a wide range of deformation processes, leaving it with a complex shear history.57 Understanding how the self-assembled microstructure of diblock bottlebrush block copolymers will be affected by this process requires a series of studies that examine how printing conditions such as nozzle speed and temperature affect the microstructure during and after the printing process. In the case of melt extrusion, Boyle et al. successfully observed the rapid development of microphases within an extruded diblock bottlebrush polymer filament.20 While this work demonstrates the possibility of achieving color with diblock bottlebrush copolymers in additive manufacturing, the work of Boyle et al. primarily focuses on the effect of molecular composition rather than the impact of processing conditions. A recent study carried out by Patel et al., has begun to explore the effects of printing conditions on the final self-assembled microstructure of diblock bottlebrush compolymers.58 The microstructure and corresponding color of the deposited diblock bottlebrush copolymer film was observed to vary systematically with both print speed and substrate temperature.
This variation in structure with printing conditions is reminiscent of the behavior of a baroplastic. Baroplastics are block copolymer melts and thin films that exhibit a shift in the order–disorder transition temperatures as a function of pressure.59–63 Recent work carried out by Lee et al. identify that increasing the pressure leads to a reduction in lamellae spacing and a loss of long range order.64 It is suggested that the decreased lamellar spacing corresponds to the compressibility of the diblock polymers in melt.64 A similar process could potentially explain the decrease in lamellar spacing observed in diblock bottlebrush thin films after undergoing a complex printing process.58
To understand how the microstructure develops during the printing process, we study the non-equilibrium behavior of a lamellar phase made of diblock bottlebrush copolymer via constant shearing across a wide range of shear rates. The effects of the steady flow conditions on the self-assembled microstructure are elucidated using microscopy, bulk rheology, and rheo-SANS. By considering the structure of the bottlebrush polymers within the solution in tandem with the rheological response, we develop a structure–property–process relation that connects the applied shear rate to the self-assembled microstructure, which dictates the macroscopic color of the sample. This relation can be applied to printing processes to help us better understand how the shear rates experienced by the bottlebrush polymer during a solution printing process affect the final microstructure of the deposited thin film.
II. Experimental methods
a. Materials
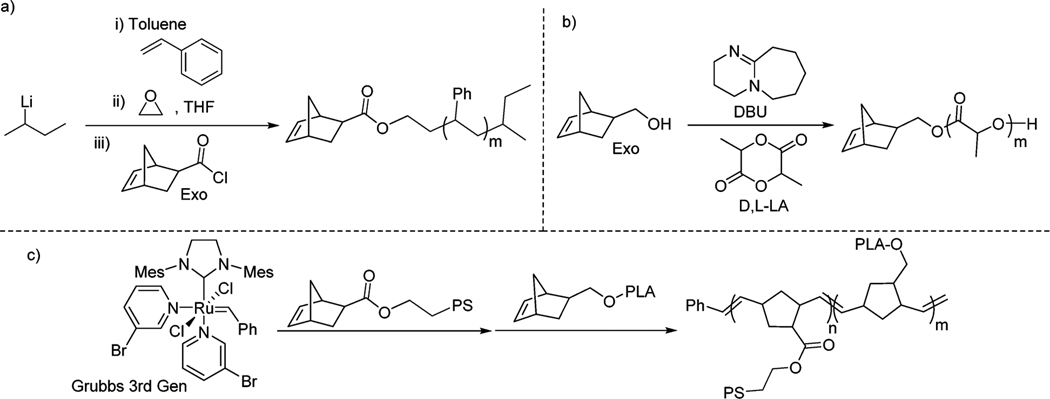
Well-defined poly(styrene)- -poly(lactic acid) (PS--PLA) di-block bottlebrushes were synthesized by graft-through polymerization of macromonomers as seen in Fig. 1. Polystyrene and polylactic acid were chosen since they are synthetically accessible through controlled polymerizations and have a significant refractive index difference, which results in a high reflected light intensity when organized into a photonic crystal.
Fig. 1.
Synthesis of PS--PLA bottlebrushes. (a) Anionic polymerization of styrene to produce PS macromonomers. (b) DBU catalyzed ROP of lactide to produce PLA macromonomers. (c) Sequential addition ROMP of PS and PLA macromonomers.
The PS macromonomers (; ) were synthesized via an anionic polymerization of styrene initiated by secBuLi, and the reaction was quenched with ethylene oxide followed by the addition of norobornene-2-acid chloride.65–67 The PLA macromonomers (; ) were synthesized in situ by an organocatalyzed DBU ring opening polymerization of lactide initiated by norobornene-2-methanol.68,69 Sequential addition ring-opening metathesis polymerization (ROMP) was used to synthesize a di-block bottlebrush (targeting 50% by weight of PS; backbone length 400 repeating units; ; ) with the polymerization of PS macromonomers first and PLA macromonomers second.9,69–71 GPC chromatograms were collected and analyzed at each stage of the synthesis (see ESI† for GPC data). The very narrow distribution of the molecular weight of the bottlebrush enabled us to identify and quantify the percentage of leftover brushes and first block bottlebrushes (homo-polystyrene bottlebrush). By comparing the GPC after block 1 (PS) synthesis with the final di-block synthesis, we can conclude that the leftover brushes are solely polystyrene. 1H NMR of the sample showed no residual double bond signals (characteristic of the norbornene end-group), suggesting that the leftover PS brushes are caused by an incomplete functionalization during the quenching anionic polymerization. Some homopolystyrene bottlebrushes were also detected and are presumably caused by some impurities deactivating part of metathesis catalyst upon addition of PLA macromonomers. Upon fitting normal distributions to the GPC chromatogram, we determine that the sample contains 94% di-block bottlebrush by mass, 4% homopolystyrene bottlebrush by mass, and 2% PS brushes by mass. With the formation of homopolystyrene, the final diblock will have slightly asymmetric blocks. Calculations reveal that the block length of PS is 196 and the block of PLA is 210. This level of homoblock bottlebrush polymer is difficult to prevent and precisely quantify. The very narrow dispersities of the ROMP polymer eased our ability to quantify this, as a broader distribution could ultimately prevent the differentiation between the homopolymer and the diblock polymer. This precision in composition characterization is important when studying material properties, as it is known that the addition of homopolymer to di-block bottlebrushes can result in the swelling of the domain size, which ultimately alters the photonic properties of the material.42
The PS-PLA diblock bottlebrush polymers were dissolved in toluene to form a solution with a concentration of 175 mg ml−1. To enhance the contrast between the polymer and the solvent neutron scattering experiments were carried out on a solution dispersed in deuterated toluene. The solutions were gently mixed for at least 12 hours using either a shaker table or roller mixer to ensure the polymer solution was homogenous. Samples were maintained at 5 °C throughout all tests to reduce evaporation effects.
b. Rheometry
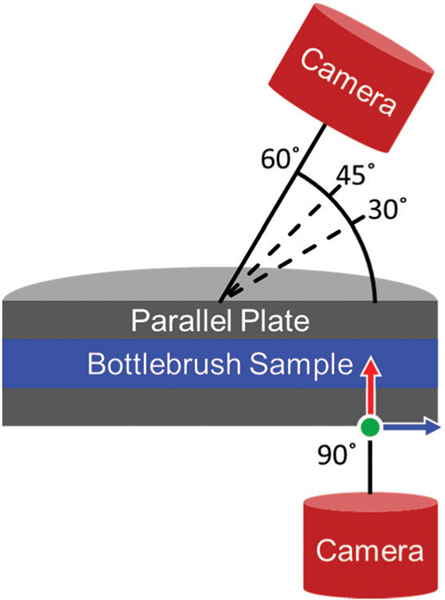
The linear rheology and flow properties were characterized using two stress-controlled Anton-Paar rheometers. In situ imaging measurements were carried out on an MCR 702 in a 43 mm glass parallel plate geometry that allowed for a microscope and digital camera to be setup beneath the geometry as shown in Fig. 2. In situ scattering measurements were carried out on an MCR 501 in a concentric-cylinder Couette cell with a 50 mm quartz cup and a hollow 48 mm titanium bob. Solvent traps were employed on both rheometers to limit the effects of solvent evaporation. Frequency sweeps were measured from 0.1 to 10 rad s−1 at a strain amplitude of 1% strain. Flow curves were measured over shear rates from 0.01 to 562 s−1 with each shear rate being applied for an equilibration time of 60 s followed by an averaging time of 30 s. In the parallel plate geometry, shear rates greater than 562 s−1 resulted in sample ejection. Higher shear rate measurements were collected using the concentric-cylinder Couette cell.
Fig. 2.
A schematic depicting the position of the microscope and camera setup relative to the sample during measurements. All images captured at 90° correspond to the 1–3 shear plane. The light source originates from the camera at each angle. The green, red, and blue arrows correspond to the flow, gradient, and vorticity directions, respectively.
During each run of tests, the linear rheology was regularly characterized and compared against previous measurements to ensure that the properties of the material had not changed due to evaporation or sample degradation. Once the sample’s linear rheological response differed from initial measurements by 10%, the sample concentration was corrected by adding a small volume of solvent to dissolve any sample that had dried to form a thin film. The sample was steadily sheared at a rate of 100 s−1 for five minutes to dissolve the polymer and incorporate the solvent into the sample.
c. Microscopy and imaging
Images of the sample depicting the reflected color at 90° on the microscopic scale were obtained using the microscope attachment for the Anton-Paar MCR 702. Images were captured using a Lumenera LM165C camera. A 20× microscope lens was attached to the camera to narrow the field of view and focus on a region in which the shear rate was nearly constant. The camera was positioned beneath the rheometer such that the outer edge of the image was 0.5 mm away from the edge of the geometry, as shown schematically in Fig. 2. In this configuration, the camera is positioned far enough away from the edge of the geometry to avoid capturing any color variation due to solvent evaporation along the edge of the geometry. Positioning the camera 0.5 mm from the edge of the geometry also ensured that the shear rate captured within the frame of the geometry was only 2% less than the shear rate reported by the rheometer. The sample was illuminated using a SugarCUBE Ultra White LED light source situated in line with the camera beneath the geometry. A solvent trap isolated the system from ambient light such that images collected by the camera were illuminated by light from the SugarCUBE light source reflecting off the sample. Prior to collecting images, the white balance of the camera was calibrated using white and gray reference cards. This step ensured that images collected as part of this study were reproducible.
Macroscopic images were obtained using a Nikon D3400 positioned 15 cm away from the center of the glass parallel plate geometry. The camera was positioned to collect images at approximately 60°, 45°, and 30° relative to the bottom plate. Images were captured in a dark room. The sample was illuminated by the camera’s flash. At 45° and 30°, a diffuser was placed between the flash and the sample to reduce glare from the geometry. A diffuser was not needed at 60° due to the top of the rheometer partially blocking the flash.
d. VSANS
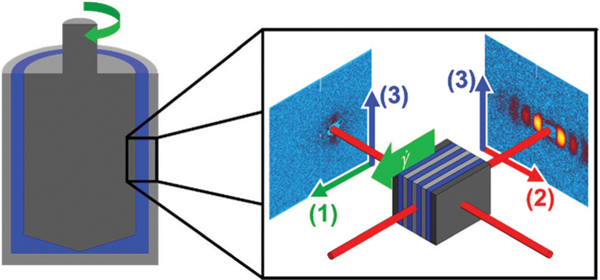
Neutron scattering experiments were carried out at the NIST Center for Neutron Research (NCNR) in Gaithersburg, MD on the Very Small Angle Neutron Scattering (VSANS) beamline. Shear rates from 0.01 s−1 to 1770 s−1 were applied using a stress-controlled Anton-Paar MCR 501. To capture multiple projections of the three-dimensional self-assembled structure, scattering data was collected with the beam passing through the center of the concentric cylinder (radial configuration) to measure the structure in the 1–3 plane and through the side of the concentric cylinder (tangential configuration) to measure the structure in the 2–3 plane. A diagram depicting these two configurations is shown in Fig. 3.
Fig. 3.
A schematic depicting the scattering planes that can be accessed in a concentric cylinder geometry. Scattering with the beam perpendicular to the geometry allows for the 1–3 scattering plane to be accessed, while aligning the beam such that it passes tangentially through the geometry results in scattering in the 2–3 scattering pane. These two images are combined to provide a complete 3-dimensional representation of the microstructure.
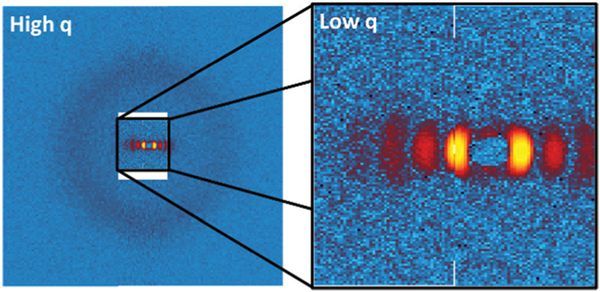
Data were collected simultaneously at both low and high scattering vector, , using the unique detector setup available on the VSANS beamline. An depiction of the detector setup is presented in Fig. 4. A front set of 4 detectors was situated 4.2 m from the sample. The detectors were spaced around the beam center such that they collected scattered neutrons at scattering vectors with magnitudes from 0.027 Å−1 to 0.048 Å−1. A second set of detectors was positioned 19.4 m from the sample to collect scattered neutrons across a range from 0.0027 Å−1 to 0.027 Å−1. Low- detectors were positioned such that the right detector captured the beam center while the left detector captured slightly higher . This setup ensured that as large a range as possible could be covered without missing any key features due to gaps between detectors. All data were collected using a neutron wavelength () of 5 Å with a distribution of . Corrections for the background, empty cell and sample transmission were carried out using protocols provided by NIST.72
Fig. 4.
A diagram demonstrating how the detectors were setup within the VSANS beamline to capture high and low simultaneously. Detectors at high were positioned such that a portion of the beam could pass through and fall on the detectors at low . The intensity at high was rescaled to provide the readers a better sense of how intense the beam is at each point.
III. Results
a. Imaging and sample color
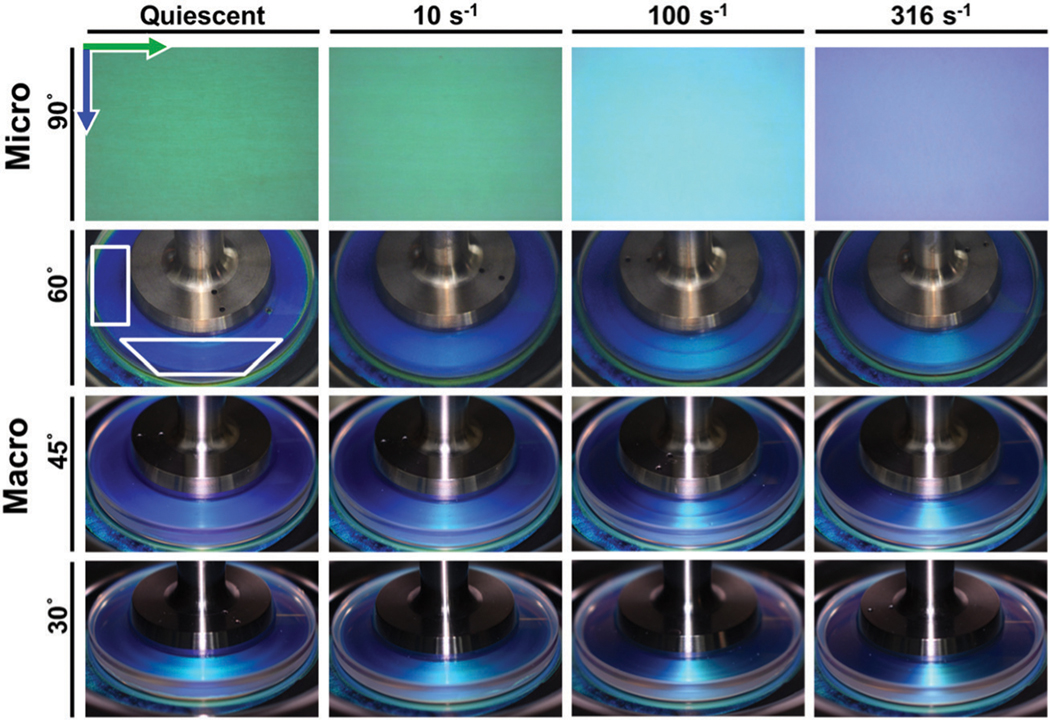
The color of the sample, as determined by rheo-microscopy in reflection at 90°, is observed to vary significantly as a function of shear rate. Images collected through rheo-microscopy and standard imaging techniques can be seen in Fig. 4. At quiescence and very low shear rates, the sample appears green when viewed at 90°. Above a critical shear rate, , which also marks a transition in the rheology, the color begins to transition from green to cyan. At higher shear rates exceeding a second critical shear rates, , the sample transitions from cyan to indigo. Though shear rates above 562 s−1 could not be tested on the MCR 702 without the sample ejecting from the parallel plate geometry, the sample was observed to become colorless when viewed in the 1–3 direction at shear rates of 1000 s−1 and greater in the quartz Couette geometry on the MCR 501.
On the macroscopic scale, the colors reflected by the sample were observed to vary with both viewing angle and shear rate (Fig. 4). The region at the front of the geometry transitions from blue to green with increasing shear rate. The intensity of this band varies significantly with viewing angle. Along the sides of the geometry, the sample is observed to transition from light to dark blue at 60° and dark blue to purple at 30° and 45°. Under quiescent conditions, the color of the sample changes from light blue to green with viewing angle. Similar effects are observed at all subsequent shear rates. This change of color with viewing angle is consistent with the presence of a photonic crystal in which the reflected wavelength increases as with increasing path length through the structure. Radial variation in the sample color is not observed at the macroscopic scale due to the color change occurring at different orders of magnitude of shear rate while the shear rate only varies linearly along the radius of the geometry. In addition, the metal portion of the geometry is approximately half the radius of the geometry, thus limiting the visible portion to a minimum observable shear rate of 0.5× the shear rate at the edge.
b. Rheometry
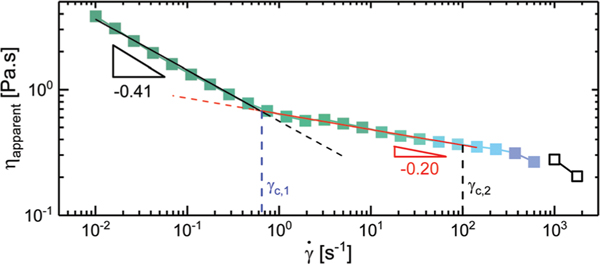
The steady shear response of the material taken on the two different rheometers on samples with protonated and deuterated solvent were in reasonable agreement with one another. The viscosities determined for the deuterated sample were approximately 30% larger than those calculated for the protonated solvent. This shift is comparable to observations made in the existing literature.73,74 Protonated and deuterated solvents can have additional effects on the self-assembly of a material as shown in the work done by Lopez-Barron et al. on wormlike micelles.73 However, we do not expect significant differences in the structure and polarity for protonated and deuterated toluene. For the sake of clarity, only the rheological results collected during the rheo-microscopy measurements are shown in Fig. 5 with the exception the two points at 1000 and 1770 s−1 which were collected during the rheo-SANS measurements. A complete flow curve from the rheo-SANS measurements can be found in the ESI† (Fig. S8). No plateau in the viscosity, indicating the presence of a zero-shear viscosity, is observed at low shear rates, as the data are always dependent on the shear rate with a power law slope of −0.42 for shear rates up to . Above the data exhibit a different power law slope of −0.20. Above a second critical shear rate, , the apparent viscosity transitions to a third regime, where the data follow a lower power-law exponent. The highest shear rate data could only be collected with the concentric-cylinder Couette geometry as the material was ejected from the plate–plate geometry prior to reaching these shear rates.
Fig. 5.
Representative microscopy and imaging data collected across a range of angles. Two boxes are drawn on the image taken under quiescence at 60° to serve as guides to the eye, highlighting regions where the color change is most noticeable. Green and blue arrows represent the flow (circumferential) and vorticity (radial) directions relative to the orientation of the microscopy image, respectively.
c. Neutron scattering
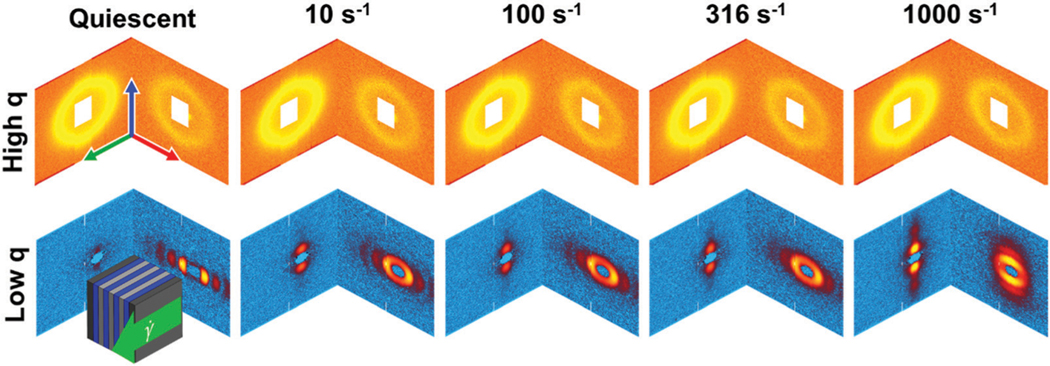
The 1–3 and 2–3 two-dimensional SANS patterns are reassembled into an isometric view to make it easier to interpret the three-dimensional structure. The scattering data are separated into two regimes due to the configuration of the neutron detectors as laid out in Fig. 3. High refers to the scattering data collected on the front set of detectors, while low refers to data collected by the back set of detectors. In the high regime, an interaction peak is observed in both the 1–3 and 2–3 scattering planes at . This peak is understood to be representative of the inter-backbone spacing between the bottlebrush polymers and does not varyin location or intensity across the range of shear rates tested, as seen in Fig. 6.
Fig. 6.
The steady flow response of the diblock bottlebrush solution. The color of each point represents the color captured by the microscope at the given shear rate, with open symbols corresponding to a lack of observable color.
At low , four distinct peaks can be observed in the 2–3 scattering plane under quiescent conditions. This feature is coupled with a lack of identifiable peaks in the 1–3 scattering plane. These peaks are spaced at integer multiples of the lowest observable peak, indicative of a lamellae structure. This structure is in agreement with prior studies that have shown that diblock bottlebrush polymers with blocks of approximately equal size will self-assemble into lamellar structures with a layer spacing determined by the backbone contour length.20,42–45,75 Verification of this microstructure can be found in Section III.c.ii.
As can be seen in Fig. 6, these lamellar peaks smear azimuthally as the steady shear rate increases, and they completely reorient along the vorticity direction at 1000 s−1 in the 2–3 plane. The peaks also appear to broaden with increasing shear rate. At the same time, increasing the shear rate results in the appearance of peaks in the vorticity direction starting at in the 1–3 plane. To further analyze the features observed in the 1–3 and 2–3 scattering patterns at both low and high , a series of azimuthal sweeps and sector averages are conducted. Demonstrative figures depicting how the annular sweeps and sector averages were calculated are included in the ESI† (Fig. S1).
i. Scattering at high .
At high , a uniform interaction peak is observed at (Fig. 6). The length scale corresponding to , , is approximately 14 nm. This length is on the same order of magnitude as the contour length of the bottlebrush’s side chains, thus indicating that this peak is representative of the inter-backbone spacing between the bottlebrush polymers.
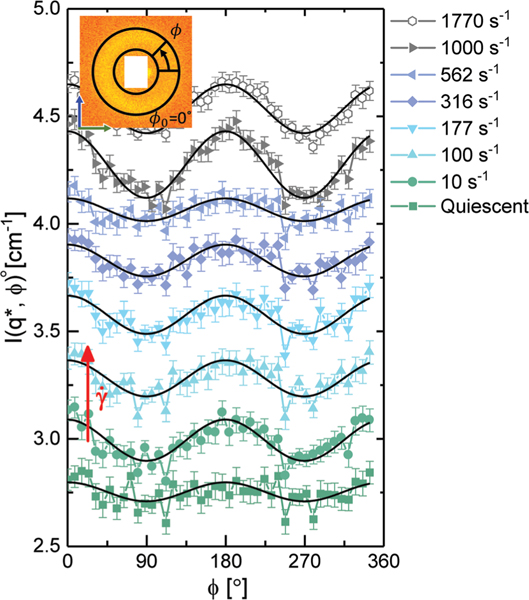
The azimuthal variation of scattered intensity at indicates the preferential alignment of the bottlebrushes within the lamellae. We show in Fig. 7 the azimuthal intensity for each shear rate, using an annular average centered at with a width of 0.01 Å−1. Under quiescent conditions, any observed variation in the intensity as a function of in the 1–3 scattering plane is within the noise of our data. As higher shear rates are applied, the intensity of the peak follows a cosinusoidal trend, thus indicating that the bottlebrushes are aligning along the vorticity direction.
Fig. 7.
Representative scattering data mapped onto an isometric view. The green, red, and blue arrows represent the flow, velocity gradient, and vorticity directions, respectively.
The extent of this alignment is quantified using the alignment factor (). This term represents the degree of alignment relative to a given angle76 and is determined as the cosinusoidal component of the azimuthal scattering intensity,
| (2) |
where is the intensity at a fixed for a given azimuthal angle . The term represents a reference angle, which in this case corresponds to either 0 or 90° depending on the relative location of maximum intensity. For a perfectly isotropic system, is expected to have a value of zero. For a strongly aligned feature, is expected to approach a value of one. The alignment factor assumes that the scattering intensity for a well-aligned system exhibits a functional form. Should the intensity exhibit a different dependence, then may not fully capture the extent of alignment within the system.76 We show in Fig. 8 the value of the alignment factor for the high- peak as a function of shear rate.
Fig. 8.
The azimuthal variation at for a representative set of shear rates. Cosinusoidal fits for each data set have been shown as black lines to highlight the extent of alignment. Error bars represent the standard deviation of scattering intensities over the averaged area. Data have been offset for the sake of comparing intensity variation with .
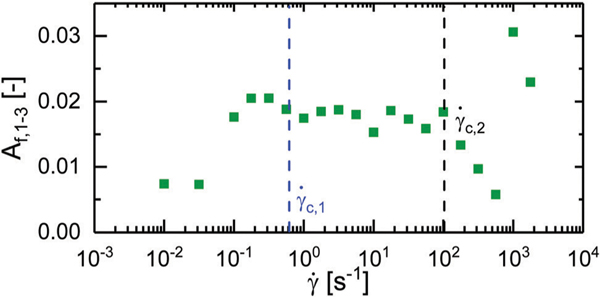
In the 1–3 scattering plane, the polymers exhibit no preferential alignment for the two lowest shear rates tested, with an alignment factor on the order of 0.003. Prior to at a shear rate of the value of the alignment factor jumps to approximately 0.02 where it remains constant up until a shear rate of . In this regime, the bottlebrush polymers are therefore weakly aligned perpendicular to the flow direction, along the vorticity direction. This alignment occurs at a shear rate prior to any significant changes in the rheology. Once the shear rate exceeds , the polymers revert to an isotropic state as indicated by the drop in the alignment factor. At shear rates of 1000 s−1 and 1770 s−1 the polymers realign along the vorticity direction as indicated by a jump in the alignment factor up to 0.031.
ii. Scattering at low .
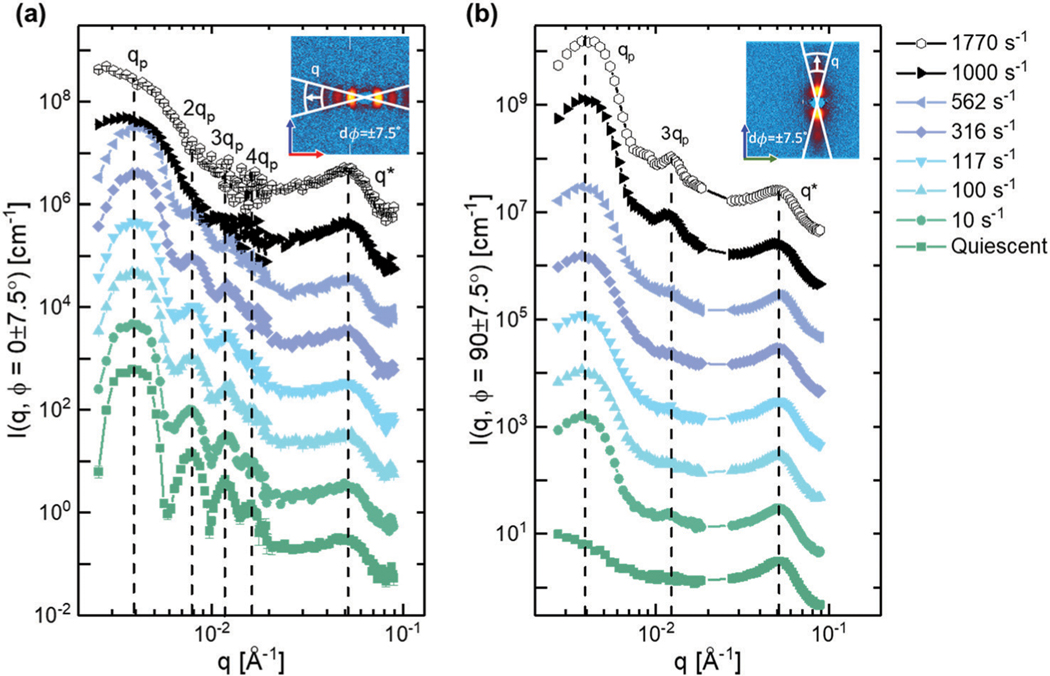
To determine the location and dispersity of each peak observed in the two-dimensional scattering patterns, sector averages were taken along the gradient and vorticity directions for the tangential and radial configurations, respectively. Sector widths of 15° were used to capture the maxima of these peaks. In Fig. 9, a select set of sector averages are plotted. We highlight the location of each peak under quiescent conditions with dashed lines.
Fig. 9.
Alignment factor along the flow direction calculated from azimuthal sweeps performed at in the 1–3 scattering plane plotted against shear rate. Critical shear rates and have been highlighted with vertical dotted lines.
From these sector averages, four distinct peaks can be identified in the 2–3 scattering plane during quiescence at values of 0.0039 Å−1, 0.0078 Å−1, 0.0117 Å−1 and 0.0156 Å−1. The fifth peak observed at , corresponds to the inter-backbone interactions of the bottlebrush polymer and has been discussed in detail in Section III.c.i. The four peaks are all located at integer multiples of the primary peak, , suggesting that the bottlebrush has self-assembled into a lamellar microstructure with a layer spacing of 161 nm. At quiescence and very low shear rates, features associated with this lamellar structure are only observed along the velocity gradient direction in the 2–3 scattering plane, indicating that the lamellae formed by the bottlebrush polymers is oriented such that the faces of the lamellae are parallel to the walls of the geometry in the so-called ‘face-on’ configuration. The length scale associated with the lamellae is approximately 3/5th the contour length of the bottlebrush, suggesting that the polymer is not adopting a completely rigid conformation within the lamellae. Such an observation is consistent with recent studies carried out on homo and diblock bottlebrush polymer systems.9,77
With increasing shear rate, the 3rd and 4th order peaks in the 2–3 plane are observed to widen and lose definition, indicating a loss of long-range order. At shear rates of 1000 s−1 and greater, all higher-order peaks in the 2–3 plane become indistinguishable from the primary peak. In the 1–3 scattering plane, higher shear rates lead to the appearance of a primary peak at along the vorticity direction. A tertiary peak is observed to appear for shear rates greater than 1000 s−1, indicating the presence of long-range order. The appearance of regularly spaced peaks along the vorticity direction in both the 1–3 and 2–3 scattering planes indicates that the lamellae have been reoriented and are arranged in the ‘edge-on’ configuration with the walls of the geometry.
To quantify how shear rate affects the lamellar microstructure, the location of the primary peak () and full width at half max (FWHM) of each peak was determined by fitting a series of Gaussian curves to the data. A lamellar model fit to this data set was attempted, but the hierarchical microstructure does not lend itself to a simple description provided by lamellar models. The features from the Gaussian fits can be seen in Fig. 10. A diagram depicting this fitting process can be found in the ESI† (Fig. S2).
Fig. 10.
(a) Sector averages for select shear rates taken at 0° in the 2–3 scattering plane. Dotted lines serve as guides to the eye, highlighting the initial peak positions under quiescence. (b) Sector averages for select shear rates taken at 90° in the 1–3 scattering plane. Error bars represent the standard deviation of scattering intensities over the averaged area. Data have been offset to aid in the comparison of peak position and width.
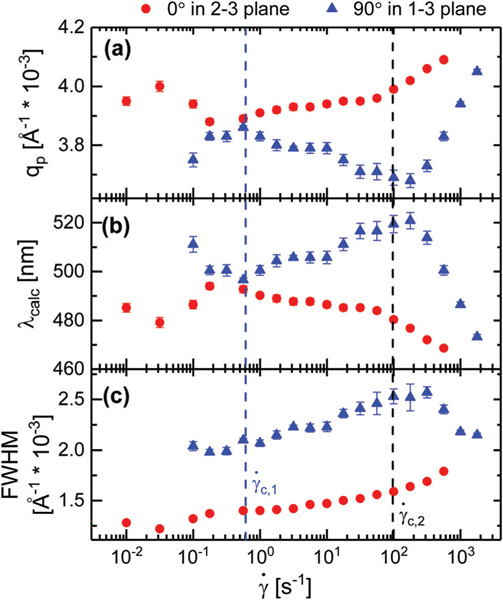
In the 2–3 plane, the location of the primary lamellar peak was observed to shift to higher in the gradient direction as a function of shear rate, as seen in Fig. 10a. Between shear rates from to , the position of the peak is observed to monotonically increase in magnitude of the scattering vector from 3.89 × 10⁻³ Å−1 to 3.99 × 10⁻³ Å−1. This shift in corresponds to a decreased lamellar spacing of 4 nm, which results in the expected reflected wavelength, , dropping from 493 nm to 480 nm as shown in Fig. 10b. This 13 nm change in corresponds to a visible color shift from light green to cyan as seen in Fig. 4 and 5. For shear rates from to 562 s−1, the peak location increases from 3.99 × 10⁻³ Å−1 to 4.09 × 10⁻³ Å−1, resulting in a change in lamellar spacing from 157 nm to 153 nm and a decrease in from 479 nm to 467 nm. This change in scatter wavelength partially accounts for the cyan to indigo transition we observe for shear rates between to 1000 s−1 as shown in Fig. 4 and 5. These trends demonstrate that the major cause of the color change observed in the microscopy is the shear-rate-dependent lamellar spacing.
In addition to the peak location, the peak width was also observed to change with shear rate. There are several instrumental factors that can contribute to the width of the observed peaks. To limit these contributions, the instrument setup and experimental conditions were kept constant across all measured shear rates. As such, we interpret the monotonic increase in peak width with shear rate as an indication of increased structural variation. The widening of the peaks is characterized by the full width half max (FWHM), which we show in Fig. 10c. For the primary peak along the gradient direction in the 2–3 plane, the FWHM is observed to increase as a function of shear rate. This increased dispersity in the primary peak indicates the existence of many scatterers with smaller length scales than suggested by the primary peak position alone. The increased number of smaller spacings therefore also contributes the cyan to indigo color transition observed for shear rates from to 1000 s−1 as shown in Fig. 5 and 6.
In contrast, the location of the primary lamellae peak was observed to decrease in the vorticity direction as a function of shear rate in the 1–3 scattering plane as shown in Fig. 10a. Between and , decreases from 3.78 × 10⁻³ Å−1 to 3.73 × 10⁻³ Å−1 which results in an increased lamellae spacing of 2.5 nm and an increased reflected wavelength from 507 nm to 514 nm. This 7 nm increase in corresponds to the green hue observed at low angles on a macroscopic scale as shown in Fig. 4. For shear rates exceeding , the primary lamellae peak is observed to increase up to 4.06 × 10⁻³ Å−1 at 1770 s−1, which leads to decrease in the lamellae spacing from 169 nm to 154 nm and reflected wavelength from 514 nm to 472 nm. This reduction in reflected wavelength contributes to the narrowing of the green region when viewing the sample at low angles as shown in Fig. 5.
The FWHM of the primary peak observed in the 1–3 plane along the vorticity direction exhibits a non-monotonic trend with increasing shear rate. For shear rates between and , the width of the primary peak increases with increasing shear rate. Once is exceeded, the FWHM is observed to decrease with increasing shear rate. The increased definition in the peaks suggests that the lamellae transition from an incoherent state to an ordered state along the vorticity direction. This increased coherence between lamellae, coupled with the reduced lamellar spacing, results in the reduction of the green band at shear rates above .
At quiescence, no features are observed in the 1–3 scattering plane or along the vorticity direction in the 2–3 scattering plane. Similarly, the higher shear rates result in the primary peak being completely smeared out along the velocity gradient direction. As such, peak widths and centers are not included for these two shear rates in Fig. 11.
Fig. 11.
(a) The location of the primary peak, , (b) expected reflected wavelength, , as calculated by eqn (2), and (c) the full width half max of the primary peak. Values calculated along the gradient direction in the 2–3 plane and vorticity direction in the 1–3 scattering plane. Error bars represent the standard error reported by OriginPro for the fitted Gaussian peaks.
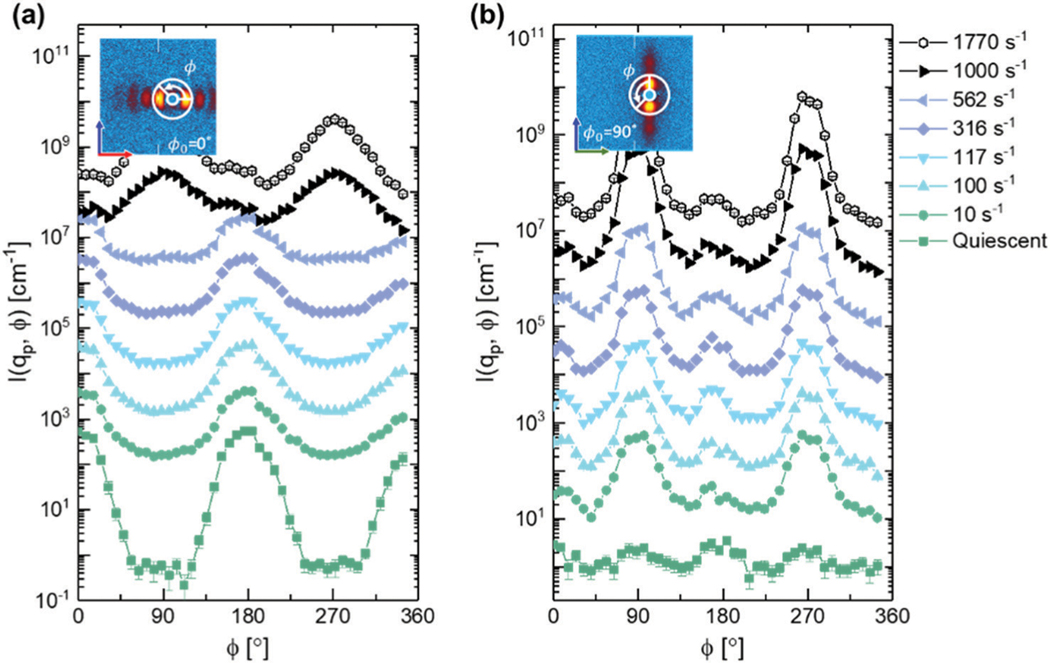
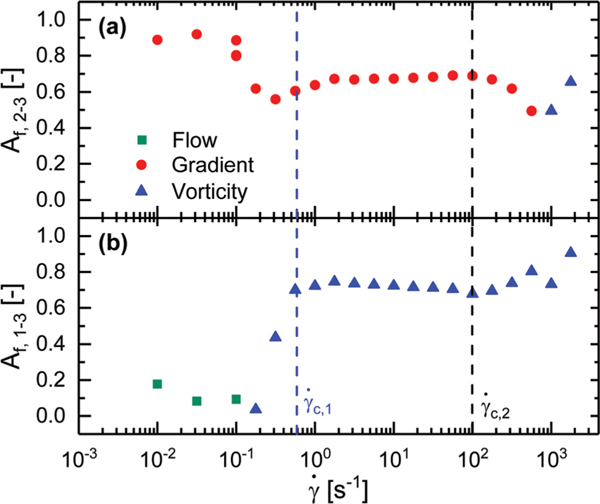
To more accurately quantify the overall orientation of the self-assembled microstructure, azimuthal sweeps were taken in both the 1–3 and 2–3 scattering planes at low . The sweeps were centered at with a width of 0.001 Å−1. In Fig. 12, select shear rates are shown to highlight the key changes to the microstructure with increasing shear rate. From the azimuthal sweeps, the alignment factors were calculated according to eqn (2) and are shown in Fig. 13.
Fig. 12.
The azimuthal variation in the structure peak observed at for a representative set of shear rates in the (a) 2–3 scattering plane and (b) 1–3 scattering plane. Data have been offset for the sake of comparing intensity variation with .
Fig. 13.
Alignment factors calculated from the azimuthal sweeps at 0.0039 Å−1 in the (a) 2–3 scattering plane and (b) 1–3 scattering plane. Colors indicate the direction of strongest alignment. Green corresponds to the flow direction in which in the 1–3 plane. Red corresponds to the gradient direction where in the 1–3 plane. Blue corresponds to the vorticity direction where in both the 1–3 and 2–3 plane.
In the 2–3 plane, the lamellae appear nearly perfectly aligned along the gradient direction under quiescent conditions. At a (low) shear rate of 0.1 s−1, a drop in the alignment of the lamellae along the gradient direction is observed, as can be seen in Fig. 12a. This feature is mirrored in Fig. 12b, where we observe a jump in alignment along the vorticity direction in the 1–3 plane at 0.1 s−1. This structural change occurs at the same shear rate when the bottlebrush polymers begin to weakly alignalong the vorticity direction (Fig. 8). From to , the orientation of the lamellae remains constant in both the 1–3 and 2–3 scattering planes. As a result of this distortion, the path length through the lamellae is increased, thus extending the region in which we observe a green color out to 10 s−1 despite a reduction in lamellar spacing from green to cyan as shown in Fig. 5 and 10b.
At shear rates exceeding , the extent of alignment exhibited by the lamellae drops in the 2–3 plane until it reaches a shear rate of 1000 s−1 at which point the alignment factor increases, albeit along the vorticity direction (see Fig. 12a). In the 1–3 plane, the alignment of the lamellae monotonically increases along the vorticity direction for shear rates above , as shown in Fig. 12b. These features correspond to the reorientation of the lamellae from a face-on configuration to an edge-on configuration. This reorientation results in an effectively infinite path length through the material when viewed in the 1–3 plane, thus leaving the sample colorless (Fig. 5).
IV. Discussion and conclusions
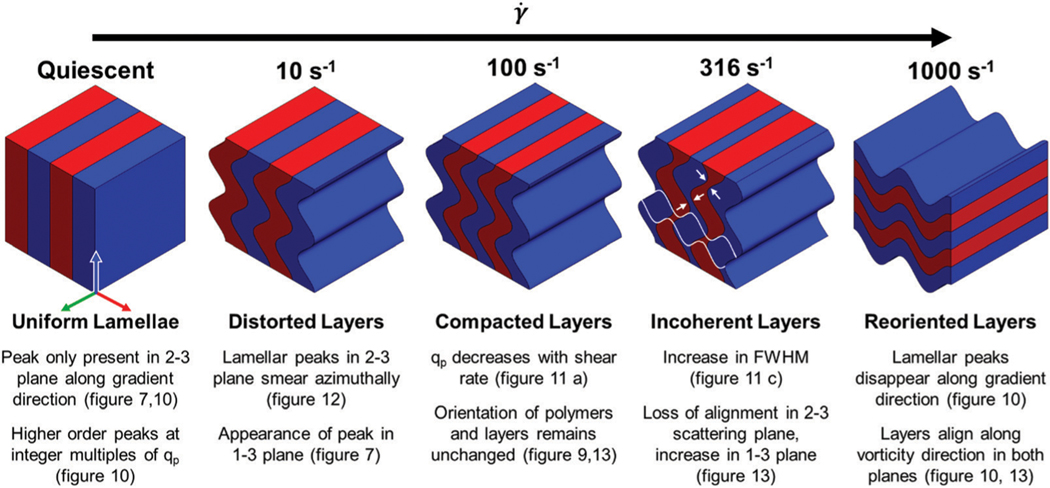
We bring together the rheology, microscopy, and neutron scattering at high and low scattering angles to propose a comprehensive structure–property–processing relation, represented visually in Fig. 13. Under quiescent conditions the bottlebrush polymers self-assemble into well-ordered, flat lamellae that are parallel to the walls of the geometry, as indicated by the well-defined narrow peaks in the 2–3 plane only as shown in Fig. 6 and 9. Within the lamellae, the bottlebrush polymers are isotropically arranged under quiescent conditions in the 1–3 plane, indicated by the weak azimuthal dependence in the scattered intensity of the high peak shown in Fig. 7. When shear rates exceeding 0.1 s−1 are applied, the individual polymers weakly align within the lamellae along the vorticity direction. The rearrangement at the inter-backbone length scale leads to a reduced modulus in the vorticity direction. This alignment of individual polymers is correlated with the appearance of slight distortions in the lamellar in the (now softer) vorticity direction, in addition to a slight reduction in domain spacing, as seen by the loss of alignment at low shear rates and the increase in with shear rate depicted in Fig. 11 and 10a, respectively. Our data do not allow us to tell whether the arrangement of bottlebrushes within the lamellae causes the anisotropic modulus of the lamellae, or if the hydrodynamic forces induce undulations in the lamellae which then results in the rearrangement of the individual polymers. However, we can say that the degree of preferential alignment of individual polymers within the lamellae is correlated with the appearance and size of the lamellar undulations: the more aligned the polymers are, the more the larger-scale lamellae undulate.
As higher shear rates are applied to the polymer solution, moving from left to right in Fig. 13, the lamellar spacing is reduced while the orientation remains unchanged, indicated by the decrease in with increasing shear and the alignment factor remaining constant up to as shown in Fig. 10a and 13, respectively. This structural change results in the sample color transitioning from green to indigo (Fig. 4 and 5). That these changes in color are not observed at rates below suggest that this shear rate acts as some sort of initiation shear rate, or minimum input energy for reducing the lamellae spacing.
At , the system is observed to transition to a new shear thinning regime characterized by a power law exponent greater than −0.12. Above this shear rate, the widening of the lamellar peaks indicates a greater dispersity in the lamellar spacing, while the azimuthal smearing indicates a wider range of orientations within the system, as seen by an increase in the FWHM and decrease in in the gradient direction with increasing shear shown in Fig. 10c and 13, respectively. The system therefore exhibits an average decrease in lamellar spacing, but an increase in the dispersity of those spacings. These trends are consistent with a loss of coherence of the undulations, depicted in Fig. 12 at 100 s−1. The loss of the fourth-order lamellar peak due to the widening of the peaks, seen in Fig. 9a, indicates an overall reduction in the long-range order of the structure. As higher shear rates are applied the incoherent undulations lead to a pinching and joining of adjacent lamellae highlighted in Fig. 13 at 316 s−1. At higher rates, the incoherence increases until adjacent undulating blocks of the same chemistry kiss and join, resulting in an apparent rotation that leaves the lamellae oriented perpendicular to the vorticity direction at 1000 s−1. This is depicted in Fig. 13 by the white lines that indicate regions of different undulating layers that eventually join into a single rotated layer at high shear rates. Above 316 s−1 we observe a narrowing of the lamellae peaks in the vorticity direction as shown in Fig. 10c, suggesting that 316 s−1 not only acts as transition point from face-on to edge-on lamellae, but also from incoherently undulating lamellae to more coherently undulating lamellae. This apparent rotation of the lamellae results in a complete loss of sample color due to the increased path length as seen in Fig. 5. At these high rates we observed the sample climbing up the walls of the geometry, indicating strong normal forces that are not possible to measure in the concentric cylinder geometry, but lend support to the dramatic realignment of the lamellar structure.
In conclusion, we have characterized the microstructure and photonic properties of a diblock bottlebrush solution across a broad range of steady shear rates. From this information we have identified features in the rheology, scattering, and microscopy that establish a comprehensive structure–property–processing relation. This relation highlights how the complex flow environment in printing processes such as additive manufacturing and solution printing can impact the self-assembled microstructure and can therefore impact the wide range of photonic properties accessible with diblock bottlebrush polymers.
Supplementary Material
Fig. 14.
A schematic representation of the structural transitions undergone at different shear rates, supported by the data shown elsewhere in this paper. Arrows at serve as guides to the eye, highlighting pinch points that develop between the incoherent layers. White lines at the same shear rate indicate layers that could develop due to these pinch points.
Acknowledgements
This work was supported by the National Science Foundation under the DMREF Award Number DMR-1727605. Access to VSANS was provided by the Center for High Resolution Neutron Scattering, a partnership between the National Institute of Standards and Technology and the National Science Foundation under Agreement No. DMR-1508249. M. A. W, J. C.-W. L and S. A. R. thank Anton Paar for their support through their VIP academic program. The authors would like to thank Ying Diao, Charles Sing, Bijal Patel, and Gavin Donley for their intellectual discussion regarding this work. Any mention of commercial products in this manuscript are for information only and does not imply endorsement by NIST.
Footnotes
Conflicts of interest
There are no conflicts to declare.
Electronic supplementary information (ESI) available.
References
- 1.Haugan IN, Maher MJ, Chang AB, Lin T-P, Grubbs RH, Hillmyer MA and Bates FS, ACS Macro Lett., 2018, 7, 525–530. [DOI] [PubMed] [Google Scholar]
- 2.Dalsin SJ, Hillmyer MA and Bates FS, Macromolecules, 2015, 48, 4680–4691. [Google Scholar]
- 3.López-Barrón CR, Tsou AH, Hagadorn JR and Throckmorton JA, Macromolecules, 2018, 51, 6958–6966. [Google Scholar]
- 4.Rzayev J, ACS Macro Lett., 2012, 1, 1146–1149. [DOI] [PubMed] [Google Scholar]
- 5.Lecommandoux S, Chécot F, Borsali R, Schappacher M, Deffieux, Bruˆlet A. and Cotton JP, Macromolecules, 2002, 35, 8878–8881. [Google Scholar]
- 6.Desvergne S, Héroguez V, Gnanou Yand Borsali R, Macromolecules, 2005, 38, 2400–2409. [Google Scholar]
- 7.Dalsin SJ, Hillmyer MA and Bates FS, ACS Macro Lett., 2014, 3, 423–427. [DOI] [PubMed] [Google Scholar]
- 8.Pesek SL, Xiang Q, Hammouda B. and Verduzco R, J. Polym. Sci., Part B: Polym. Phys, 2017, 55, 104–111. [Google Scholar]
- 9.Dutta S, Wade MA, Walsh DJ, Guironnet D, Rogers SA and Sing CE, Soft Matter, 2019, 15, 2928–2941. [DOI] [PubMed] [Google Scholar]
- 10.Rathgebe Sr, Pakul Ta, Wil Ak, Matyjaszewsk Ki, il Le He and Beer KLs, Polymer, 2006, 47, 7318–7327. [Google Scholar]
- 11.Liang H, Grest GS and Dobrynin AV, ACS Macro Lett., 2019, 8, 1328–1333. [DOI] [PubMed] [Google Scholar]
- 12.Liang H, Wang Z, Sheiko SS and Dobrynin AV, Macromolecules, 2019, 52, 3942–3950. [Google Scholar]
- 13.Hu M, Xia Y, McKenna GB, Kornfield JA and Grubbs RH, Macromolecules, 2011, 44, 6935–6943. [Google Scholar]
- 14.López-Barrón CR, Shivokhin MEand Hagadorn JR, J. Rheol, 2019, 63, 917–926. [Google Scholar]
- 15.Terao K, Takeo Y, Tazaki M, Nakamura Y. and Norisuye T, Polym. J, 1999, 31, 193–198. [Google Scholar]
- 16.Jahromi S, Palmen JHM and Steeman PAM, Macromolecules., 2000, 33, 577–581. [Google Scholar]
- 17.Borisov OV, Zhulina EB and Birshtein TM, ACS Macro Lett., 2012, 1, 1166–1169. [DOI] [PubMed] [Google Scholar]
- 18.Qian Z, Koh YP, Pallaka MR, Chang AB, Lin TP, Guzmán PE, Grubbs RH, Simon SL and Mckenna GB, Macromolecules, 2019, 52, 2063–2074. [Google Scholar]
- 19.Aluculesei A, Pipertzis A, Piunova VA, Miyake GM, Floudas G, Fytas G. and Grubbs RH, Macromolecules, 2015, 48, 4142–4150. [Google Scholar]
- 20.Boyle BM, French TA, Pearson RM, McCarthy BG and Miyake GM, ACS Nano, 2017, 11, 3052–3058. [DOI] [PMC free article] [PubMed] [Google Scholar]
- 21.Frauenrath H, Prog. Polym. Sci, 2005, 30, 325–384. [Google Scholar]
- 22.Costanzo S, Scherz LF, Schweizer T, Kröger M, Floudas G, Dieter Schlu A. and Vlassopoulos D, Macromolecules, 2016, 49, 7054–7068. [Google Scholar]
- 23.Costanzo S, Scherz L, Floudas G, Pasquino R, Kröger M, Schlüter AD and Vlassopoulos D, Macromolecules, 2019, 52, 7331–7342. [Google Scholar]
- 24.Mikhailov IV, Darinskii AA, Zhulina EB, Borisov OV and Leermakers FAM, Soft Matter, 2015, 11, 9367–9378. [DOI] [PubMed] [Google Scholar]
- 25.Hu M, Xia Y, Daeffler CS, Wang J, McKenna GB, Kornfield JA and Grubbs RH, J. Polym. Sci., Part B: Polym. Phys, 2015, 53, 899–906. [Google Scholar]
- 26.Schlüter AD, Halperin A, Kröger M, Vlassopoulos D, Wegner G. and Zhang B, ACS Macro Lett., 2014, 3, 991–998. [DOI] [PubMed] [Google Scholar]
- 27.Daniel WFM, Burdyńska J, Vatankhah-Varnoosfaderani M, Matyjaszewski K, Paturej J, Rubinstein M, Dobrynin AV and Sheiko SS, Nat. Mater, 2015, 15, 183–189. [DOI] [PubMed] [Google Scholar]
- 28.Abbasi M, Faust L. and Wilhelm M, Adv. Mater, 2019, 31, 1806484. [DOI] [PubMed] [Google Scholar]
- 29.Johnson JA, Lu YY, Burts AO, Xia Y, Durrell AC, Tirrell DA and Grubbs RH, Macromolecules, 2010, 43, 10326–10335. [DOI] [PMC free article] [PubMed] [Google Scholar]
- 30.Unsal H, Onbulak S, Calik F, Er-Rafik M, Schmutz M, Sanyal A. and Rzayev J, Macromolecules, 2017, 50, 1342–1352. [Google Scholar]
- 31.il Lee H, Pietrasik J, Sheiko SS and Matyjaszewski K, Prog. Polym. Sci, 2010, 35, 24–44. [Google Scholar]
- 32.Li X, Prukop SL, Biswal SL and Verduzco R, Macromolecules, 2012, 45, 7118–7127. [Google Scholar]
- 33.Liberman-Martin AL, Chu CK and Grubbs RH, Macromol. Rapid Commun, 2017, 38, 1700058. [DOI] [PubMed] [Google Scholar]
- 34.Bates CM and Bates FS, Macromolecules, 2017, 50, 3–22. [Google Scholar]
- 35.Fan Y, Cai YQ, Bin Fu X, Yao Y. and Chen Y, Polymer, 2016, 107, 154–162. [Google Scholar]
- 36.Joannopoulos JD, Johnson SG, Winn JN and Meade RD, Photonic Crystals: Molding the Flow of Light, Princeton University Press, Princeton, NJ, 2008. [Google Scholar]
- 37.Edrington AC, Urbas AM, DeRege P, Chen CX, Swager TM, Hadjichristidis N, Xeidou M, Fetters LJ, Joannopoulos JD, Fink Y. and Thomas EL, Adv. Mater, 2001, 6, 421–425. [Google Scholar]
- 38.Fink Y, Winn JN, Fan S, Chen C, Michel J, Joannopoulos JD and Thomas EL, Science, 1998, 282, 1679–1682. [DOI] [PubMed] [Google Scholar]
- 39.Alfrey T, Gurnee EF and Schrenk WJ, Polym. Eng. Sci, 1969, 9, 400–404. [Google Scholar]
- 40.Hustad PD, Marchand GR, Garcia-Meitin EI, Roberts PL and Weinhold JD, Macromolecules, 2009, 42, 3788–3794. [Google Scholar]
- 41.Mapas JKD, Thomay T, Cartwright AN, Ilavsky J. and Rzayev J, Macromolecules, 2016, 49, 3733–3738. [Google Scholar]
- 42.Macfarlane RJ, Kim B, Lee B, Weitekamp RA, Bates CM, Lee SF, Chang AB, Delaney KT, Fredrickson GH, Atwater HA and Grubbs RH, J. Am. Chem. Soc, 2014, 136, 17374–17377. [DOI] [PubMed] [Google Scholar]
- 43.Miyake GM, Piunova VA, Weitekamp RA and Grubbs RH, Angew. Chem., Int. Ed, 2012, 51, 11246–11248. [DOI] [PubMed] [Google Scholar]
- 44.Chae CG, Yu YG, Bin Seo H, Kim MJ, Grubbs RH and Lee JS, Macromolecules, 2018, 51, 3458–3466. [Google Scholar]
- 45.Miyake GM, Weitekamp RA, Piunova VA and Grubbs RH, J. Am. Chem. Soc, 2012, 134, 14249–14254. [DOI] [PubMed] [Google Scholar]
- 46.Raeburn J, Cardoso AZ and Adams DJ, Chem. Soc. Rev, 2013, 42, 5143–5156. [DOI] [PubMed] [Google Scholar]
- 47.Qu G, Kwok JJ and Diao Y, Acc. Chem. Res, 2016, 49, 2756–2764. [DOI] [PubMed] [Google Scholar]
- 48.Diao Y, Shaw L, Bao Z. and Mannsfeld SCB, Energy Environ. Sci, 2014, 7, 2145–2159. [Google Scholar]
- 49.Hayward RC and Pochan DJ, Macromolecules, 2010, 43, 3577–3584. [Google Scholar]
- 50.Angelescu DE, Waller JH, Adamson DH, Deshpande P, Chou SY, Register RA and Chaikin PM, Adv. Mater, 2004, 16, 1736–1740. [Google Scholar]
- 51.Winey KI, Patel SS, Larson RG and Watanabe H, Macromolecules, 1993, 26, 2542–2549. [Google Scholar]
- 52.Nikoubashman A, Register RA and Panagiotopoulos AZ, Macromolecules, 2014, 47, 1193–1198. [Google Scholar]
- 53.Marencic AP and Register RA, Annu. Rev. Chem. Biomol. Eng, 2010, 1, 277–297. [DOI] [PubMed] [Google Scholar]
- 54.Wunenburger AS, Colin A, Colin T. and Roux D, Eur. Phys. J. E: Soft Matter Biol. Phys, 2000, 2, 277–283. [Google Scholar]
- 55.Diat O, Roux D, Nallet F, Diat O, Roux D. and Nallet F, J. Phys. II, 1993, 3, 1427–1452. [Google Scholar]
- 56.Braungart M, McDonough W. and Clinton PB, The upcycle: beyond sustainability–designing for abundance, Farrar, Straus and Giroux, 2014. [Google Scholar]
- 57.Mackay ME, Rheol J., 2018, 62, 1549–1561. [Google Scholar]
- 58.Patel B, Walsh D, Kim DH, Kwok J, Lee B, Guironnet D. and Diao Y, Sci. Adv, in press. [DOI] [PMC free article] [PubMed] [Google Scholar]
- 59.Pollar M, Russel TP, Ruzette AV, Mayes AM and Gallot Y, Macromolecules, 1998, 31, 6493–6498. [Google Scholar]
- 60.Ruzette AVG, Mayes AM, Pollard M, Russell TP and Hammouda B, Macromolecules, 2003, 36, 3351–3356. [Google Scholar]
- 61.Lee Y, Lee H, Kim SW, Park S, Kim E, Han YS and Ryu DY, Polymer, 2014, 55, 6967–6972. [Google Scholar]
- 62.Ryu DY, Lee DJ, Kim JK, Lavery KA, Russell TP, Han YS, Seong BS, Lee CH and Thiyagarajan P, Phys. Rev. Lett, 2003, 90, 235501. [DOI] [PubMed] [Google Scholar]
- 63.Hasegawa H, Sakamoto N, Takeno H, Jinnai H, Hashimoto T, Schwahn D, Frielinghaus H, Janben S, Imai M. and Mortensen K, J. Phys. Chem. Solids, 1999, 60, 1307–1312. [Google Scholar]
- 64.Lee J, Wang T, Shin K. and Cho J, Polymer, 2019, 175, 265–271. [Google Scholar]
- 65.Worsfold DJ and Bywater S, Can. J. Chem, 1960, 38, 1891–1900. [Google Scholar]
- 66.Waack R, Rembaum A, Coombes JD and Szwarc M, J. Am. Chem. Soc, 1957, 79, 2026–2027. [Google Scholar]
- 67.Breunig S, Héroguez V, Gnanou Yand Fontanille M, Macromol. Symp, 1995, 95, 151–166. [Google Scholar]
- 68.Lohmeijer BGG, Pratt RC, Leibfarth F, Logan JW, Long DA, Dove AP, Nederberg F, Choi J, Wade C, Waymouth RM and Hedrick JL, Macromolecules, 2006, 39, 8574–8583. [Google Scholar]
- 69.Walsh DJ and Guironnet D, Proc. Natl. Acad. Sci. U. S. A, 2019, 116, 1538–1542. [DOI] [PMC free article] [PubMed] [Google Scholar]
- 70.Love JA, Morgan JP, Trnka TM and Grubbs R, Angew. Chem., Int. Ed, 2002, 41, 4034–4037. [DOI] [PubMed] [Google Scholar]
- 71.Radzinski SC, Foster JC, Chapleski RC, Troya D. and Matson JB, J. Am. Chem. Soc, 2016, 138, 6998–7004. [DOI] [PubMed] [Google Scholar]
- 72.Kline SR, J. Appl. Crystallogr, 2006, 39, 895–900. [Google Scholar]
- 73.Lo CR´pez-Barrón and Wagner NJ, Soft Matter, 2011, 7, 10856. [Google Scholar]
- 74.Mukerjee P, Kapauan P. and Meyer HG, J. Phys. Chem, 1966, 70, 783–786. [Google Scholar]
- 75.Sveinbjörnsson BR, Weitekamp RA, Miyake GM, Xia Y, Atwater HAand Grubbs RH, Proc. Natl. Acad. Sci. U. S. A, 2012, 109, 14332–14336. [DOI] [PMC free article] [PubMed] [Google Scholar]
- 76.Walker LM and Wagner NJ, Macromolecules, 1996, 29, 2298–2301. [Google Scholar]
- 77.Dalsin SJ, Rions-Maehren TG, Beam MD, Bates FS, Hillmyer MA and Matsen MW, ACS Nano, 2015, 9, 12233–12245. [DOI] [PubMed] [Google Scholar]
Associated Data
This section collects any data citations, data availability statements, or supplementary materials included in this article.


