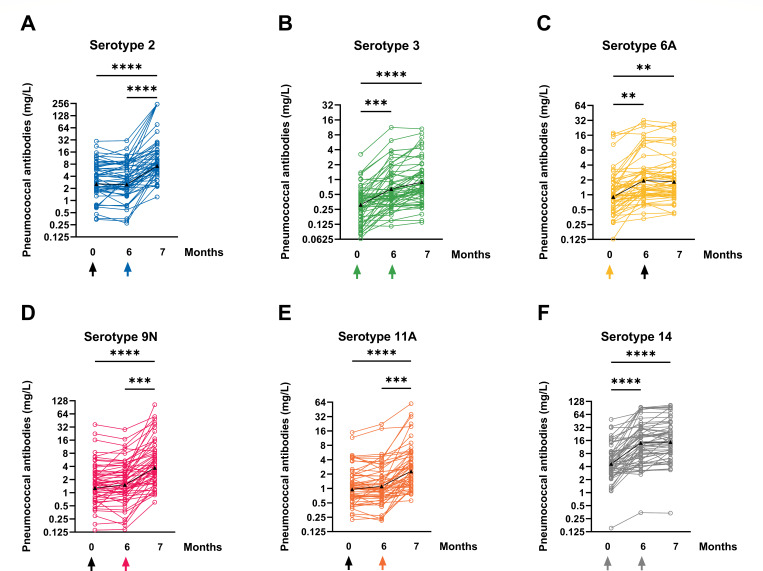
Fig 2.
The graphs in panels A–F display the changes in serotype-specific pneumococcal antibodies for six different serotypes, including 2, 3, 6A, 9N, 11A, and 14, before and after vaccinations with PCV13 (at month 0) and PPSV23 (at month 6). The time of vaccination is indicated by an arrow, and the colored arrows indicate that the vaccine contains the corresponding serotype. The geometric mean values are represented by a black line with triangles, and the results are displayed on a logarithmic scale (log2). The data from 57 psoriasis patients were analyzed using the Kruskal-Wallis test, with Dunn’s multiple comparisons test. **P < 0.01, ***P < 0.0005, ****P < 0.0001.

