Abstract
Phthiocerol dimycocerosate (PDIM) is an essential virulence lipid of Mycobacterium tuberculosis. In vitro culturing rapidly selects for spontaneous PDIM-negative mutants, which have attenuated virulence and increased cell wall permeability, thus impacting the relevance of experimental findings. PDIM loss can also reduce efficacy of the BCG Pasteur vaccine. Here, we show that vancomycin susceptibility can rapidly screen for M. tuberculosis PDIM production. We find that metabolic deficiency of methylmalonyl-CoA impedes the growth of PDIM-producing bacilli, selecting for PDIM-negative variants. Supplementation with odd-chain fatty acids, cholesterol, or vitamin B12 restores PDIM-positive bacterial growth. Specifically, we show that propionate supplementation enhances PDIM-producing bacterial growth and selects against PDIM-negative mutants, analogous to in vivo conditions. Our study provides a simple approach to screen for and maintain PDIM production, and reveals how discrepancies between the host and in vitro nutrient environments can attenuate bacterial pathogenicity.
Introduction
The cell wall of Mycobacterium tuberculosis (Mtb) is exceptionally complex and is essential to its success as a pathogen. Phthiocerol dimycocerosates (PDIMs) are long-chain non-polar lipids found in the outermost layer of the cell wall of Mtb and other pathogenic slow-growing mycobacteria1. PDIMs play a crucial role in Mtb pathogenesis (reviewed in2), however, Mtb is prone to losing the ability to produce PDIM in vitro due to spontaneous mutation of PDIM biosynthesis genes3,4. Loss of PDIM biosynthesis confers a growth advantage in current mycobacterial culture media3,5, resulting in PDIM-deficient mutants dominating cultures with successive passage3. As PDIM deficiency decreases virulence5–11 and increases cell wall permeability12,13, spontaneous PDIM loss adversely affects experimental reliability, reproducibility, and the interpretation of results. PDIM deficiency has also been shown to reduce the vaccine efficacy of Mycobacterium bovis BCG Pasteur14. “The PDIM problem” thus presents a major challenge in tuberculosis research and has hindered progress in the field for decades. The genetically unstable nature of the PDIM biosynthetic pathway makes routine PDIM screening essential for all branches of tuberculosis research. However, current PDIM screening approaches such as whole genome sequencing (WGS), mass spectrometry, and thin layer chromatography (TLC), are expensive, cumbersome, and require specialized equipment and expertise, further compounding the PDIM problem.
We sought to understand the underlying cause of PDIM loss and develop routine methods to enable reproducible PDIM bias-free investigations in all branches of Mtb research. Here we developed a facile and scalable routine assay for PDIM production and a modified culture media that maintains PDIM production. We show that in standard culture media, the growth of PDIM-producing bacilli is impaired due to MMCoA deficiency. Supplementation with propionyl-CoA-generating carbon sources or vitamin B12 restores the growth of PDIM-producing Mtb, eliminating the selective advantage of PDIM loss. Propionate supplementation was found to select against PDIM-negative mutants enabling the maintenance of pure PDIM-positive cultures. Furthermore, we show that propionate supplementation enhances PDIM-dependent drug resistance, directly linking propionyl-CoA metabolism and PDIM production with enhanced rifampicin resistance.
Results
Vancomycin sensitivity can screen for PDIM phenotype
We hypothesized that the differential permeability of PDIM-positive [PDIM(+)] and PDIM-negative [PDIM(-)] Mtb12,13 could be exploited to develop a simpler functional PDIM assay. To test this, we first assembled a PDIM reference strain set comprised of six BSL2-approved attenuated Mtb H37Rv strains with varying PDIM content (Fig. 1a, Supplementary Table 1). These strains demonstrate the heterogeneity of PDIM production commonly found in laboratory Mtb strains. Vancomycin – a large antimicrobial glycopeptide not normally used for Mtb treatment due to poor penetration, has previously been reported to be more effective against PDIM deletion mutants of Mtb and M. bovis BCG than the corresponding PDIM(+) wildtype strains15. Accordingly, we found that PDIM levels measured by TLC significantly correlated with vancomycin MIC90 and MIC50 in our reference strain set after 10–14 days of incubation (Supplementary Fig. 1). PDIM(+) Mtb mc27902 was also more resistant to other high molecular weight compounds than PDIM(-) mc28398, though vancomycin gave the best differentiation (Extended Data Fig. 1a-g). Furthermore, much greater Ethidium Bromide uptake16 was observed in mc28398 than mc27902 (Extended Data Fig. 1h), consistent with enhanced permeability of PDIM(-) strains.
Fig. 1 |. Vancomycin resistance is enhanced by propionate or vitamin B12 supplementation and is predictive of PDIM production in Mtb.
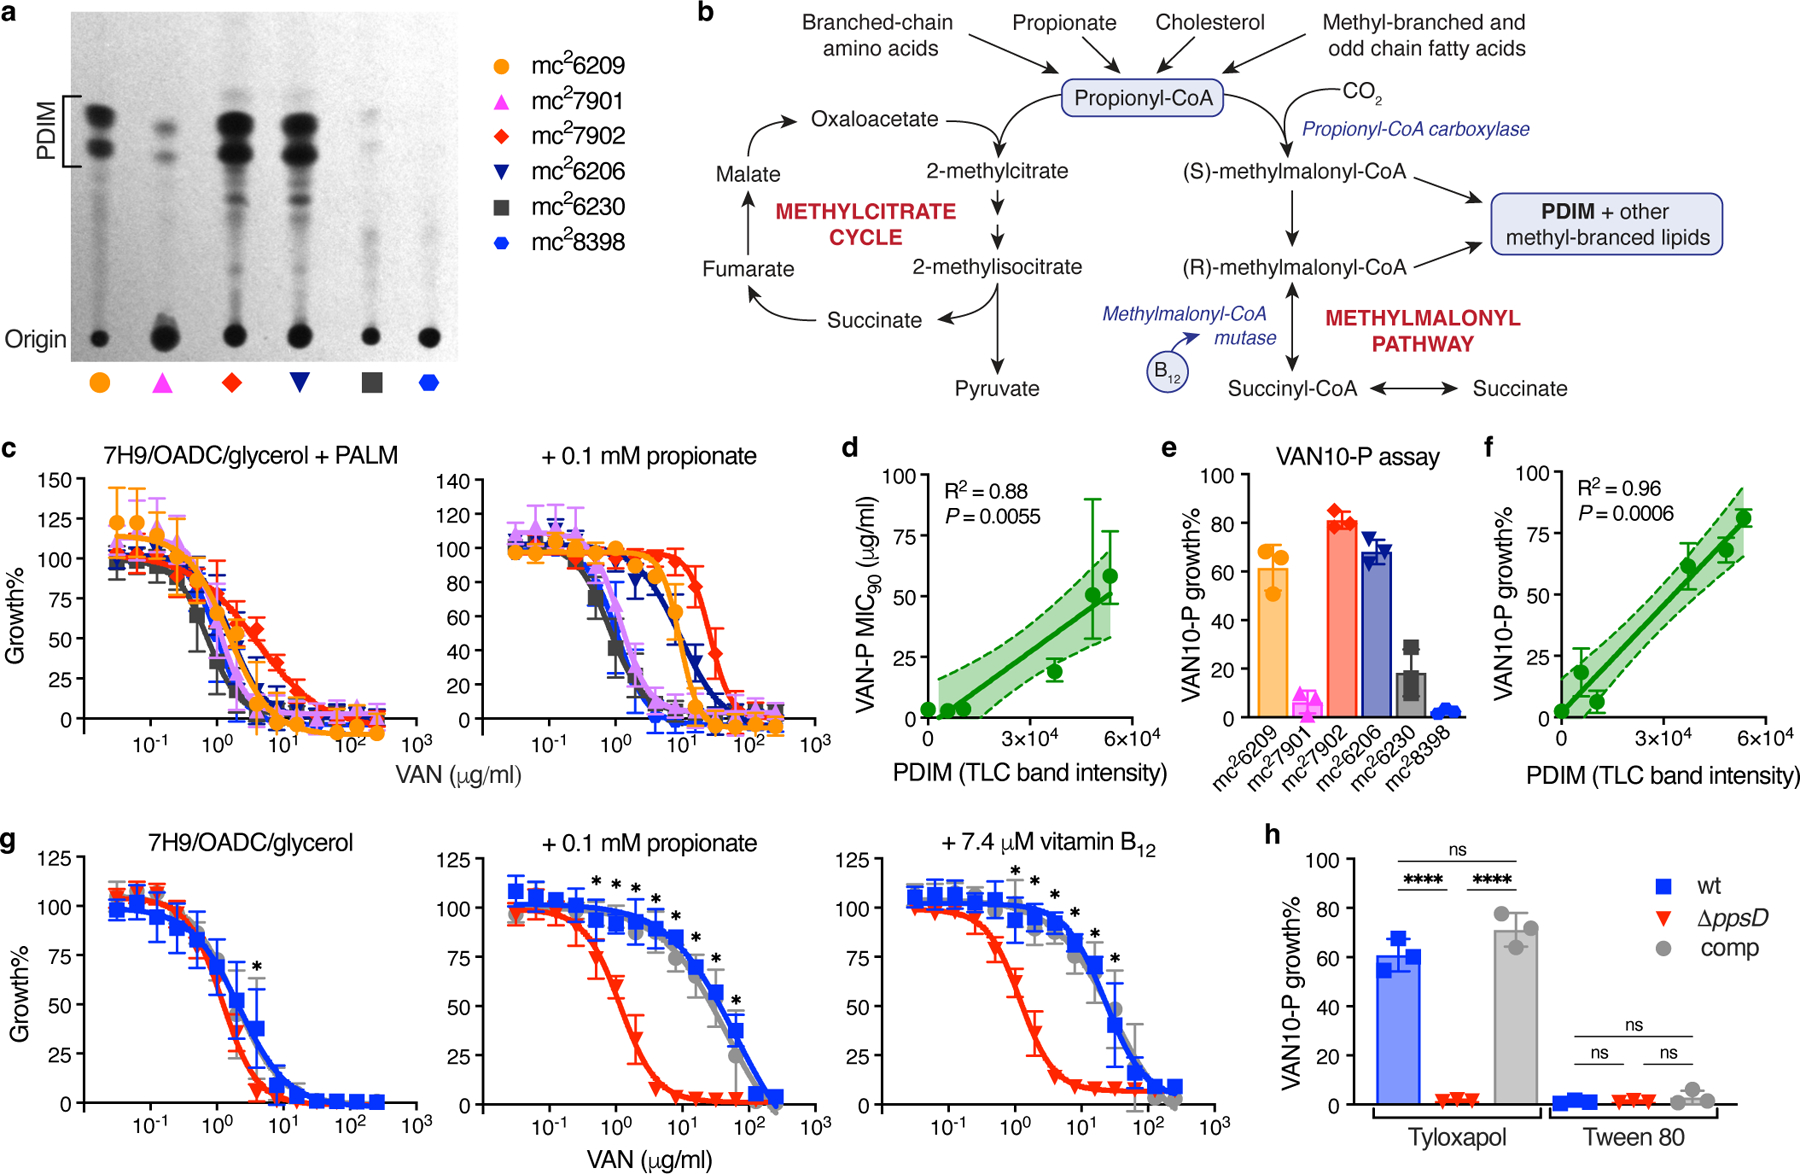
a, TLC lipid analysis of the PDIM reference strain set (see Supplementary Table 1). b, Metabolic pathways of methylmalonyl-CoA production and propionyl-CoA catabolism. c, Vancomycin resistance of the Mtb PDIM reference strain set in 7H9/OADC/glycerol/tyloxapol + PALM (pantothenate, arginine, leucine, and methionine) media, and additionally supplemented with 0.1 mM propionate (‘VAN-P’ MIC), measured after 7 days incubation. d, Correlation between VAN-P MIC90 from the curve fit in (c) (+ 0.1 mM propionate) and PDIM band intensity from (a). The solid line indicates the linear regression best-fit, and the error bands the 95% CI. e, ‘VAN10-P’ assay comparing growth in 10 μg/ml vancomycin with 0.1 mM propionate to drug-free controls (VAN10 OD / VAN0 OD × 100 = VAN10-P growth%). f, Correlation between VAN10-P growth% from (e) and PDIM from (a). The solid line indicates the linear regression best-fit, and the error bands the 95% CI. g, Vancomycin resistance of PDIM(+) and PDIM(-) Mtb H37Rv strains in standard 7H9/OADC/glycerol/tyloxapol media and supplemented with 0.1 mM propionate or 7.4 μM vitamin B12 (10 μg/ml). *P < 0.001 for both wt and comp versus ΔppsD; two-way ANOVA with Tukey’s multiple comparison test. h, VAN10-P assay of H37Rv strains with tyloxapol or Tween 80. ****P < 0.0001; one-way ANOVA with Tukey’s multiple comparison test. MIC data show mean ± SD for n = 4 biological replicates from two independent experiments. VAN10-P data show mean ± SD for n = 3 three independent experiments, each performed in triplicate.
Whilst an intact biosynthetic pathway is essential for PDIM production, PDIM size and abundance are dependent on the availability of the precursor methylmalonyl-CoA (MMCoA)17. MMCoA is generated from propionyl-CoA by propionyl-CoA carboxylase, or, from succinyl-CoA by vitamin B12-dependent MMCoA mutase (Fig. 1b). In the host, Mtb has access to propionyl-CoA-generating carbon sources such as cholesterol18,19 and possibly also scavenges vitamin B1220-22. Standard Middlebrook 7H9/OADC/glycerol media, however, lacks both a propionyl-CoA-generating carbon source and vitamin B12. Propionate supplementation or growth on cholesterol have been shown to increase the biosynthesis of PDIM and other virulence lipids17,19,23,24. Accordingly, we found that the addition of 0.1 or 1.0 mM propionate preferentially increased vancomycin resistance of PDIM(+) strains in 7H9/OADC/glycerol/tyloxapol + PALM media (pantothenate, arginine, leucine, and methionine; for BSL2 auxotrophic strains), enhancing the differentiation between PDIM(+) and PDIM(-) Mtb while improving assay robustness and reducing time to result (Fig. 1c, and Extended Data Fig. 2). To further simplify our approach and enable scalability, we established a single concentration assay we term the ‘VAN10-P assay’ (Fig. 1e, Extended Data Fig. 2c and Supplementary Fig. 2). This compares growth in 10 μg/ml vancomycin with 0.1 mM propionate to no-drug controls and highly correlates with PDIM production (Fig. 1f). We additionally validated our approach using PDIM(-) (ΔppsD) and complemented (ΔppsD::comp) strains constructed from a PDIM(+) clone (H37Rv-SC, wildtype) (Supplementary Table 2). PDIM(+) and PDIM(-) H37Rv showed a >30-fold difference in vancomycin MIC90 with 0.1 mM propionate (‘VAN-P’ MIC) (Fig. 1g) and this was also reflected in the VAN10-P assay (Fig. 1h). Highly similar results were also obtained for Mtb CDC1551 and its PDIM(-) (Δmas) mutant (Supplementary Fig. 3).
To confirm that increased vancomycin resistance with propionate was due to enhanced PDIM production rather than other effects such as accumulation of propionyl-CoA or methylcitrate cycle intermediates25,26, we supplemented with vitamin B12 to provide an alternate route for MMCoA production via the vitamin B12-dependent methylmalonyl pathway22 (Fig. 1b). Vitamin B12 selectively increased the vancomycin resistance of PDIM(+) Mtb mirroring the effect of propionate (Fig. 1g and Extended Data Fig. 2b,c), consistent with enhanced resistance due to increased PDIM production. Co-supplementation with both propionate and vitamin B12 had comparable effects to each on its own (Supplementary Fig. 4), indicating the activation of either pathway provides sufficient precursors for PDIM biosynthesis at the concentrations tested. The branched-chain amino leucine did not have a marked effect on vancomycin resistance at the concentration provided in PALM-supplemented media (Supplementary Fig. 5a). Whilst degradation of branched-chain amino acids provides a potential source of propionyl-CoA, the end products of leucine catabolism are in fact acetyl-CoA and acetoacetate27, likely explaining the failure of this to phenocopy propionate supplementation.
As Tween 80 is another detergent commonly used in Mtb culture media we tested whether tyloxapol could be replaced with Tween 80 in our assay. Tween 80 is known to remove several layers of the mycobacterial cell wall including PDIM28. Consistent with this, Tween 80 abolished PDIM-related differences in vancomycin resistance and further increased the vancomycin sensitivity of PDIM(-) Mtb (Fig. 1h and Extended Data Fig. 3).
Prevalence of PDIM loss across Mtb strains
Next, we determined the predictive power of our approach in a range of virulent Mtb strains including Erdman, HN878, KZN 4207, and two different CDC1551 and H37Rv stocks (Supplementary Table 2). VAN-P screening reliably predicted PDIM levels as determined by TLC for all these strains (Fig. 2a and Extended Data Fig. 4a–d). Furthermore, VAN-P assays outperformed WGS at diagnosing PDIM deficiencies in heterogeneous populations. TLC and VAN10-P assays showed low PDIM levels in H37Rv-A and CDC1551-A (Fig. 2a), however, standard WGS variant calling failed to identify any PDIM mutations in these stocks, whilst an unfixed mutation was identified in Erdman (Supplementary Table 3). Low-frequency variant analysis subsequently identified putative PDIM mutations at ~10–13% frequency in each of these stocks (Supplementary Table 4), indicating they comprise a mixture of different PDIM(-) mutants. Thus, WGS is a poor predictor of PDIM levels in mixed populations as these can comprise an array of different low-frequency PDIM mutations, which can be difficult to detect by WGS.
Fig. 2 |. VAN-P assays accurately predict PDIM status during genetic manipulations and across different Mtb strains and lineages.
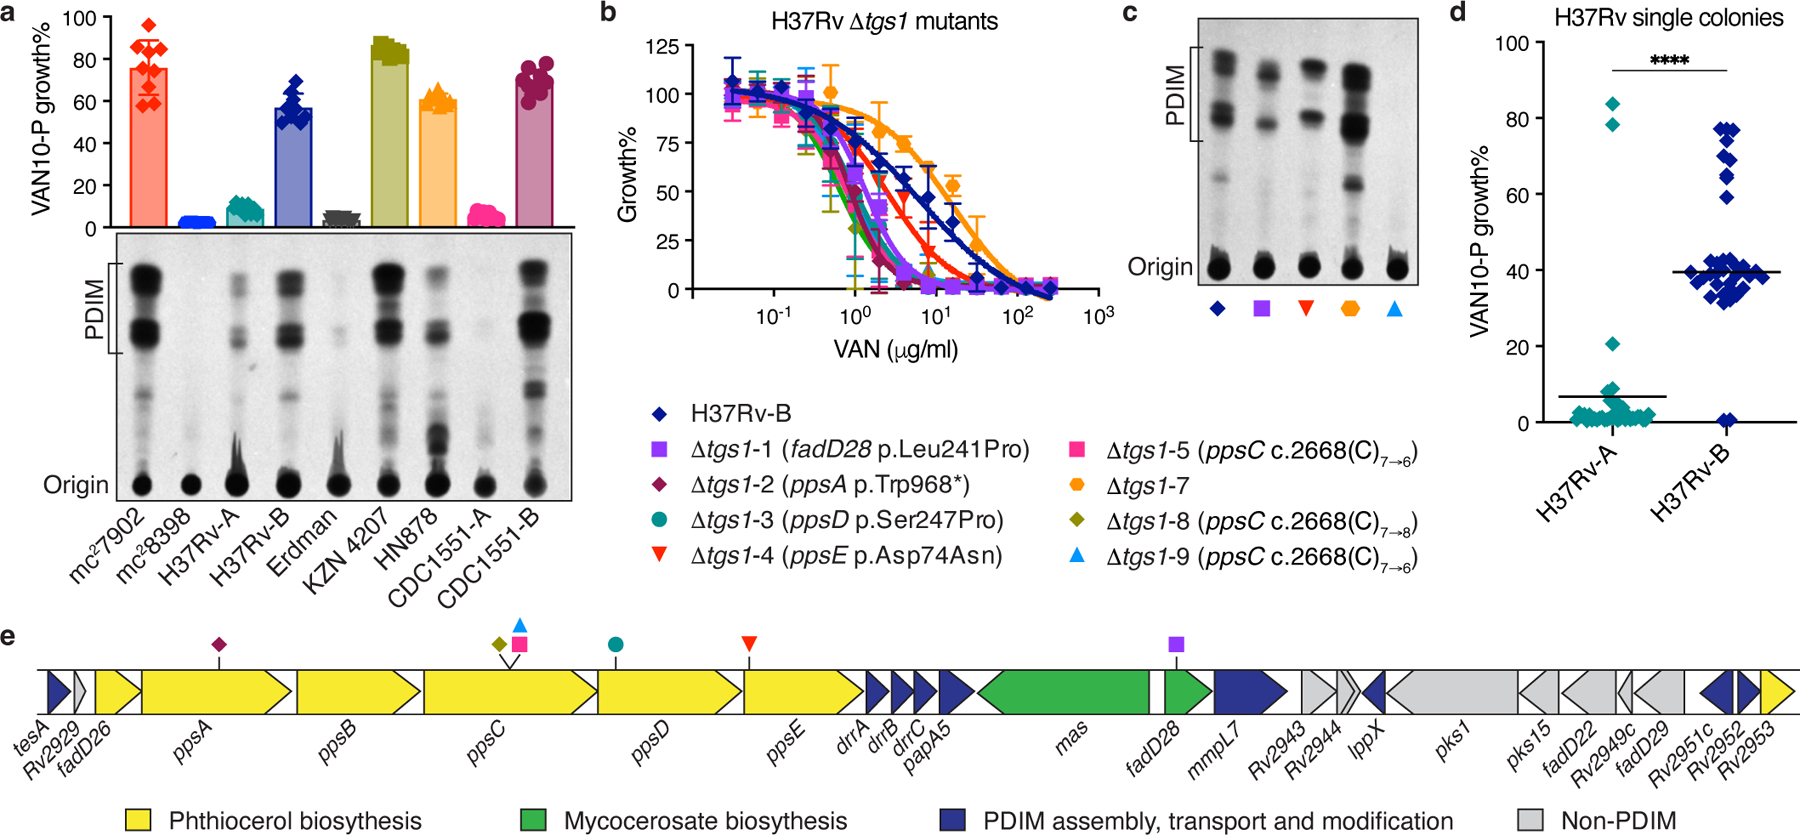
a, TLC lipid analysis and VAN10-P assays of different laboratory stocks of virulent Mtb strains alongside Mtb mc27902 and mc28398. Mean ± SD for n = 9 pairwise comparisons between triplicate wells. b, VAN-P MIC assays of eight Δtgs1 mutants and the parent H37Rv-B. Mean ± SD for n = 3 (Δtgs1-3, -5, -7 and -9) or n = 4 (H37Rv-B, Δtgs1-1, -2, -4, -8) biological replicates from two independent experiments. Mutations in PDIM biosynthetic genes are indicated in brackets in the legend. No mutations were detected in H37Rv-B or Δtgs1-7. c, TLC lipid analysis of four Δtgs1 mutants and H37Rv-B. Lipid extracts in (a) and (c) were run on the same TLC plate. d, VAN10-P screening of single colonies isolated from H37Rv-A (n = 38) and H37Rv-B (n = 37). Each colony was assayed in triplicate and data points represent mean VAN10-P growth%. Lines indicate the median. P < 0.0001; unpaired two-tailed Mann-Whitney test. e. Schematic showing the PDIM gene cluster and location of secondary PDIM mutations in Δtgs1 mutants.
To investigate how genetic engineering of Mtb strains is affected by PDIM loss we generated knockout mutants of the non-PDIM-related gene tgs1 from a mouse-passaged H37Rv stock (H37Rv-B) using specialized transduction29. Surprisingly, despite this being an animal-passaged stock, only one of eight Δtgs1 mutants obtained (Δtgs1-7) was found to be fully PDIM(+) by VAN-P MICs (Fig. 2b). This was further validated by TLC and sequence analysis (Fig. 2c, Supplementary Table 3). Δtgs1-1 and Δtgs1-4 were deemed PDIM-deficient by our assay and harbor non-synonymous PDIM SNPs yet showed PDIM bands by TLC. Both, however, display altered band patterns and lower overall PDIM abundance compared to the fully PDIM(+) Δtgs1-7 mutant. This highlights the sensitivity of our approach to detect PDIM biosynthetic defects that do not fully eliminate PDIM production but have phenotypic consequences.
Historically animal passaging was the only procedure known to select for PDIM(+) Mtb. However, our results suggested that despite animal passage H37Rv-B may still be a mixed population (Fig. 2a–c). Indeed, VAN10-P single colony screening confirmed that while animal passage enriched for PDIM(+) clones, PDIM-deficient strains were not completely removed (Fig. 2d, Supplementary Table 3). Consequently, using VAN10-P single colony screening, we were able to isolate single PDIM(+) clones from H37Rv-B, as well as other virulent strains and avirulent mc26230 (Extended Data Fig. 4 and Supplementary Table 3).
Strikingly, six different mutations in five different PDIM genes were identified across the seven PDIM(-) Δtgs1 mutants (Fig. 2e), emphasizing the genetic heterogeneity in the PDIM gene cluster in mixed populations. We also found two unique frameshift mutations in a 7-cytosine homopolymeric tract in ppsC (Extended Data Fig. 5). This region appears to be a ‘hotspot’ for mutation as we also found ppsC homopolymeric tract mutations in mc26230 (Supplementary Tables 3 and 5) and in the literature30,31. Homopolymeric tracts are prone to mutations caused by slipped-strand mispairing32 and as Mtb lacks a DNA mismatch repair system33 this may lead to hypervariability in these regions, further augmenting the propensity for PDIM loss in vitro.
Collectively these data validate VAN-P assays as a reliable and effective method to assess PDIM levels and heterogeneity in Mtb populations and aid isolation of PDIM(+) clones. However, the data presented also strongly emphasized the need to resolve the underlying issue of PDIM loss.
Increased MMCoA availability restores growth of PDIM(+) Mtb
As PDIM production is tightly coupled to Mtb metabolism17, we reasoned that there may be a metabolic solution to the PDIM problem. Propionyl-CoA, an upstream precursor of PDIM, can be inhibitory to bacterial growth34. The major pathways for propionyl-CoA detoxification are the methylcitrate cycle35, the methylmalonyl pathway22, and the incorporation into PDIM and other virulence-associated lipids36,37 (Fig. 1b). We hypothesized that PDIM-deficient strains would be more sensitive to propionate toxicity without this sink for propionyl-CoA metabolism and that this could be exploited to create a PDIM selective medium. Accordingly, the PDIM(-) strains in our reference strain set were more sensitive to propionate than the PDIM(+) (Fig. 3a). Surprisingly, we also observed that PDIM(+) strains reached higher density at lower propionate concentrations (Fig. 3a), suggesting sub-toxic propionate may provide a growth advantage to PDIM(+) Mtb.
Fig. 3 |. Propionate and vitamin B12 supplementation restore the growth of PDIM(+) Mtb.
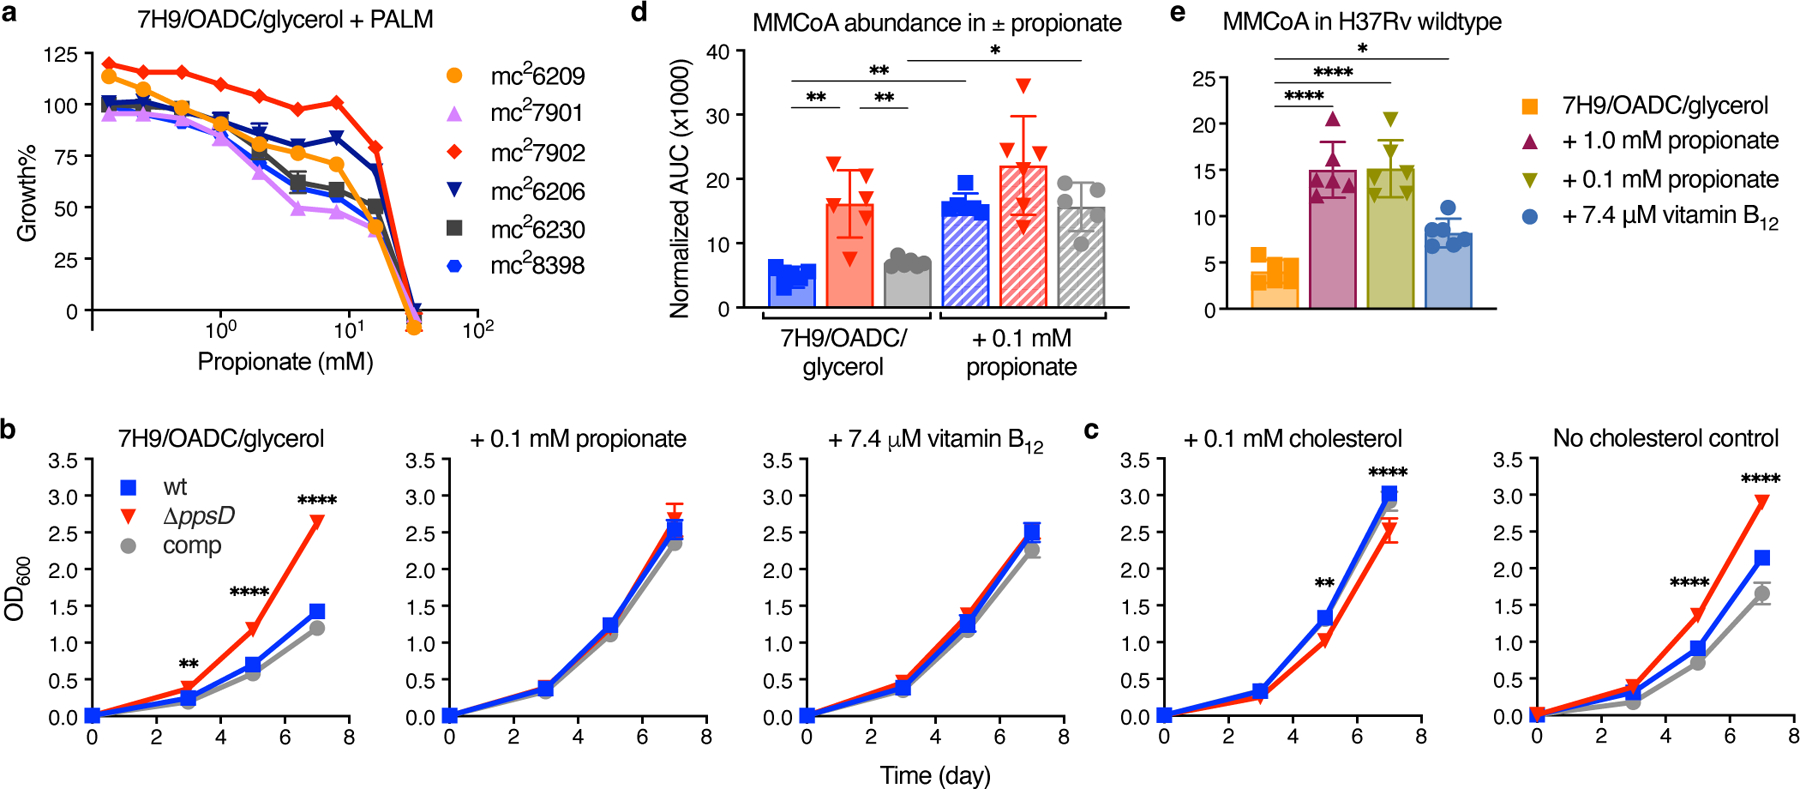
a, Relative growth of the PDIM reference strain set in 7H9/OADC/glycerol/tyloxapol + PALM media with increasing concentrations of propionate compared to no propionate controls. Mean ± SD for n = 3 biological replicates. b, Growth curves of PDIM(+) and PDIM(−) Mtb H37Rv in standard 7H9/OADC/glycerol/tyloxapol media and supplemented with 0.1 mM propionate or 7.4 μM vitamin B12 (10 μg/ml). c, Growth in 7H9/OADC/glycerol/tyloxapol media + 0.1 mM cholesterol and no cholesterol controls (see Methods). The growth of ΔppsD was significantly lower in cholesterol compared to the no cholesterol control (P < 0.0001; days 7 and 10). Mean ± SD for n = 3 biological replicates. **P < 0.01, ****P < 0.0001 for both wt and comp versus ΔppsD; two-way ANOVA with Šidák’s multiple comparison test. Data in (a–c) are representative of at least two independent experiments. For some data points the SD is smaller than the data symbols. d, Abundance of methylmalonyl-CoA (MMCoA) in PDIM(+) and PDIM(-) H37Rv grown in standard 7H9/OADC/glycerol/tyloxapol media ± 0.1 mM propionate, and e, PDIM(+) H37Rv wildtype in standard media and supplemented with either propionate or vitamin B12. The legend for (d) is the same as that for (b–c). Abundances are shown as normalized area under the curve (AUC) (see Methods). Mean ± SD for n = 6 biological replicates from two independent experiments. *P < 0.05, **P < 0.01, ****P < 0.0001; one-way ANOVA with Tukey’s multiple comparison test. Significant differences between ± propionate for each strain and between strains for each condition are indicated in (d), and compared to unsupplemented media in (e).
Next, we compared the growth of PDIM(+) and PDIM(-) Mtb with propionate and other supplements. Notably, we found that the addition of 0.1 or 1.0 mM propionate to standard 7H9/OADC/glycerol/tyloxapol media increased the growth rate of PDIM(+) strains to that of PDIM(-) (Fig. 3b and Extended Data Fig. 6b,c). Again, we did not observe comparable effects when tyloxapol was replaced with Tween 80 (Extended Data Fig. 6k–m). The odd-chain fatty acid valerate also restored PDIM(+) growth, but not the even-chain fatty acids acetate or butyrate, or the three-carbon metabolite pyruvate (Extended Data Fig. 6g–j), demonstrating this effect is specific to propionyl-CoA generating carbon sources. Supplementing with cholesterol not only restored PDIM(+) growth but also significantly reduced the growth of PDIM(-) Mtb (Fig. 3c). The growth reduction of PDIM(-) Mtb is likely related to the reduced ability to maintain redox homeostasis via lipid anabolism37, a mechanism induced during cholesterol catabolism38. Importantly, vitamin B12 also restored PDIM(+) growth analogous to propionate (Fig. 3b). Taken together, these data indicate that in standard media PDIM(+) growth is impaired due to a deficiency of MMCoA. This is consistent with previous work showing that vitamin B12 enhances the growth of wildtype H37Rv but not of a methylmalonyl-CoA mutase deletion mutant22. This was further supported by measuring the intracellular abundance of MMCoA by LC-MS. In unsupplemented media, MMCoA levels in PDIM(+) Mtb were approximately 3-fold lower than in PDIM(-), but increased to similar levels with propionate supplementation (Fig. 3d). Vitamin B12 supplementation also significantly increased MMCoA but not propionyl-CoA levels in PDIM(+) Mtb (Fig. 3e and Extended Data Fig. 7a), supporting the notion that MMCoA deficiency specifically is responsible for the growth retardation in PDIM(+) Mtb.
Propionate and vitamin B12 maintain PDIM production
Based on these findings, we reasoned that propionate supplementation would prevent PDIM loss by eliminating the growth advantage of PDIM(-) cells. Whilst arguably cholesterol could also be used for this purpose, propionate is both more affordable and much simpler to work with as a routine media supplement. To assess this, we performed in vitro experimental evolution using culture stocks with different PDIM(+) to PDIM(-) ratios. First, we serially passaged H37Rv-B – a moderately PDIM(+) mixed population (Fig. 2d), by weekly subculture in 7H9/OADC/glycerol/tyloxapol ± 0.1 or 1.0 mM propionate and assessed PDIM levels by TLC and VAN10-P assays. Considerable PDIM loss was observed in unsupplemented media whereas propionate supplementation fully maintained PDIM production (Fig. 4a). Repeating this experiment starting from a fully PDIM(+) clone, we saw a marked decline in PDIM in unsupplemented media after five passages, whilst 0.1 mM propionate maintained PDIM production for the duration of the experiment (Extended Data Fig. 8c). Strikingly, starting from H37Rv-A – a predominantly PDIM(-) population, PDIM levels progressively increased with propionate (Fig. 4b). VAN10-P screening of single colonies confirmed enrichment of PDIM(+) clones (Fig. 4c), demonstrating 0.1 mM propionate positively selects for PDIM-producing Mtb. We speculated that whilst advantageous for the growth of PDIM(+) Mtb, 0.1 mM propionate selects against PDIM(−) cells due to propionyl-CoA toxicity39 in the absence of a functional PDIM biosynthetic pathway. Indeed, the addition of vitamin B12 to alleviate propionyl-CoA toxicity via activation of the methylmalonyl pathway22,36 considerably slowed the selection process and resembled more cultures with vitamin B12 alone (Fig. 4d and Extended Data Fig. 8d,e). This represents an important advance for the tuberculosis field as it demonstrates that propionate improves the growth of PDIM(+) cells and provides a competitive advantage against spontaneous PDIM(-) mutants, thereby enabling the maintenance of pure PDIM(+) Mtb cultures in vitro.
Fig. 4 |. Propionate and vitamin B12 supplementation prevent PDIM loss in Mtb.
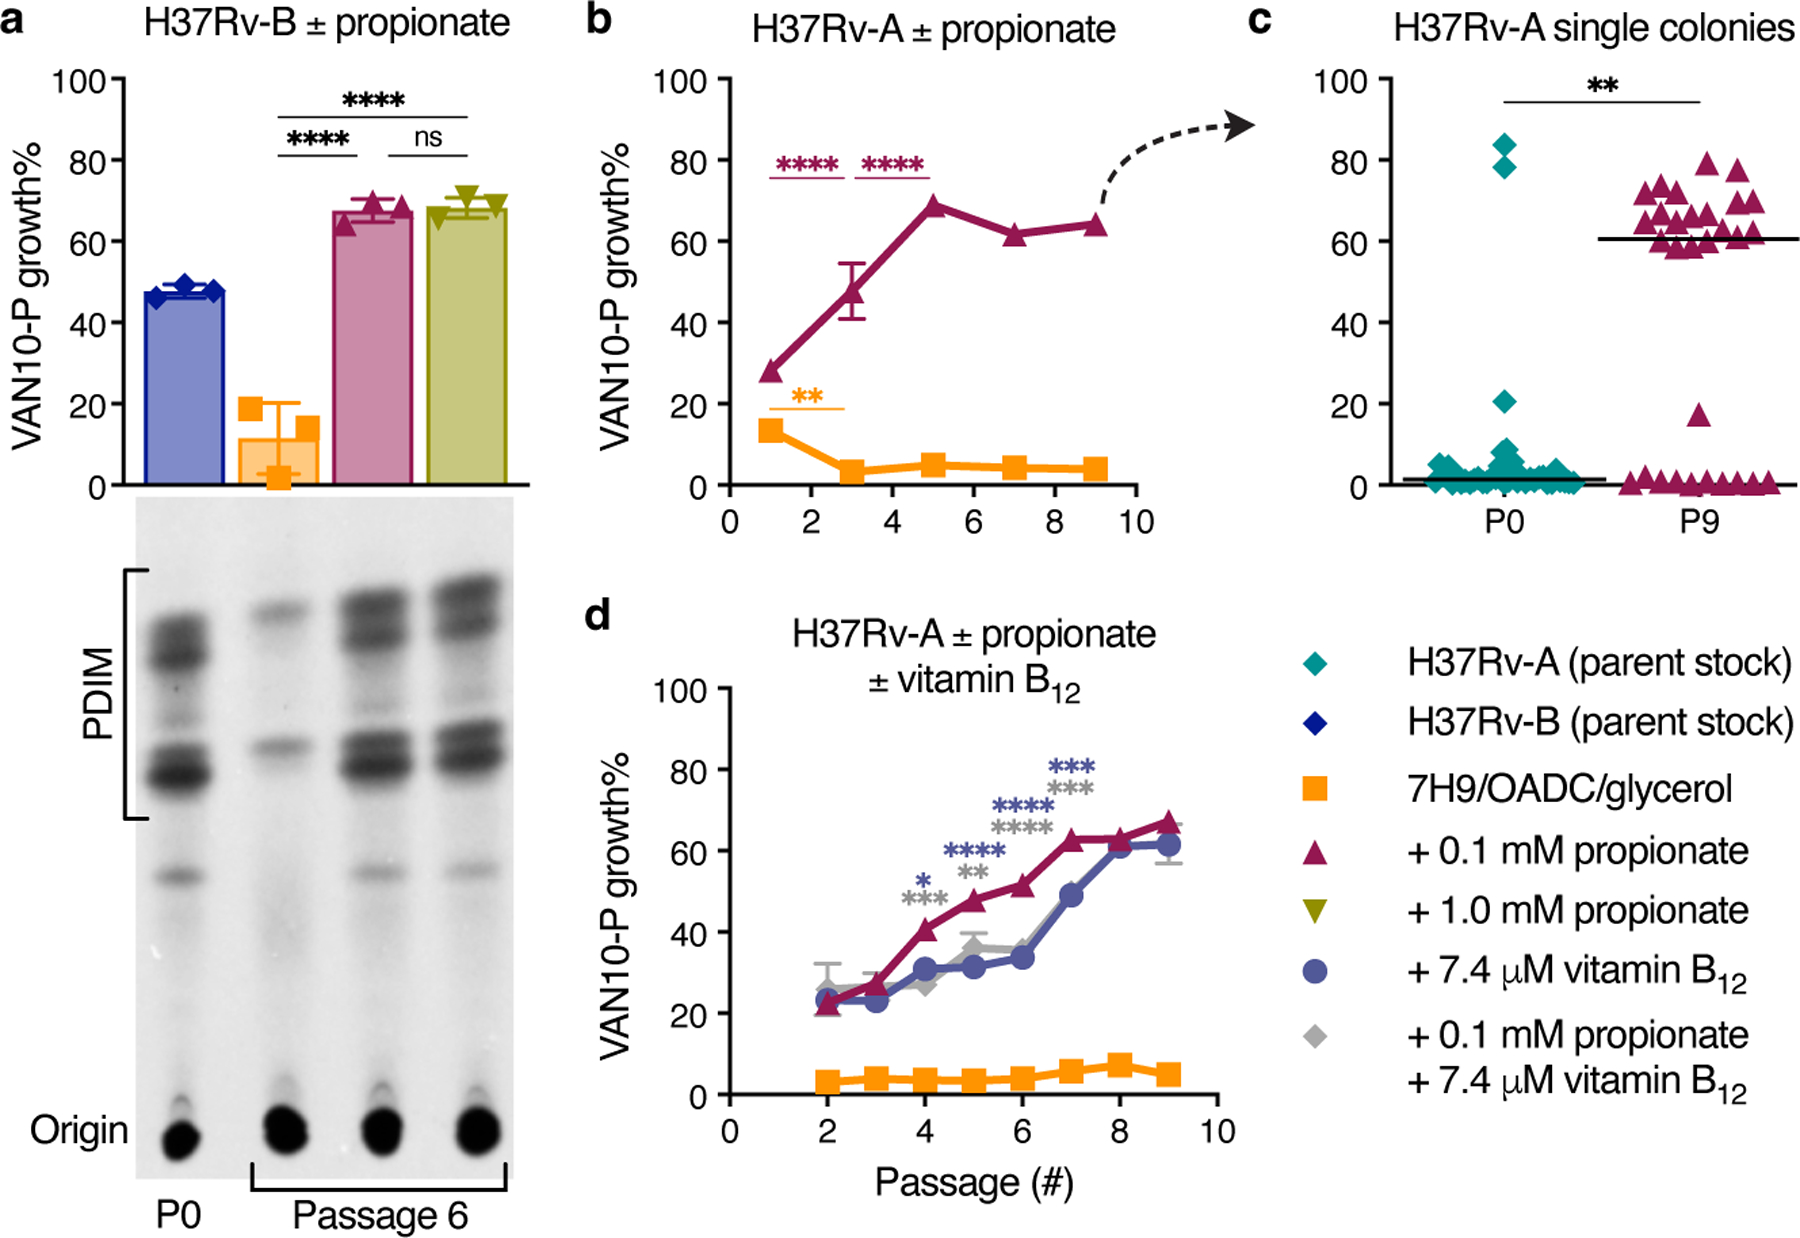
a, VAN10-P and TLC lipid analysis of PDIM levels in Mtb H37Rv-B following serial passage in 7H9/OADC/glycerol/tyloxapol media ± 0.1 or 1.0 mM propionate. ****P < 0.0001; one-way ANOVA with Tukey’s multiple comparison test. A representative result is shown for one of two biological replicates analysed by TLC (see also Extended Data Fig. 8b). b, VAN10-P assays of H37Rv-A passaged in ± 0.1 mM propionate. Significant differences between successive timepoints for each condition are indicated (**P < 0.01, ****P < 0.0001); two-way ANOVA with Tukey’s multiple comparison test. c, VAN10-P screening of single colonies of H37Rv-A before (n = 38; same data as Fig. 2d) and after propionate passage in (b) (n = 30). Each colony was assayed in triplicate and data points represent mean VAN10-P growth%. Lines indicate the median. P = 0.0047; unpaired two-tailed Mann-Whitney test. d, VAN10-P assays of H37Rv-A passaged in media supplemented with ± 0.1 mM propionate and 7.4 μM vitamin B12 (10 μg/ml) alone and in combination. Significant differences compared to + 0.1 mM propionate are indicated (*P < 0.05, **P < 0.01, ***P < 0.001, ****P < 0.0001); two-way ANOVA with Tukey’s multiple comparison test. P > 0.05 for vitamin B12 versus vitamin B12 + propionate and P < 0.0001 for standard media versus each supplemented condition at all timepoints. VAN10-P data in (a,b,d) show mean ± SD for n = 3 biological replicates, each assayed in triplicate. For some data points the SD is smaller than the data symbols.
Propionate increases PDIM-dependent drug resistance
As PDIM levels had such a profound effect on vancomycin resistance, we sought to further explore the impact of propionate supplementation on drug resistance. MIC assays of several first- and second-line antitubercular drugs revealed that propionate significantly increased resistance to rifampicin and bedaquiline in a PDIM-dependent manner, while smaller inhibitors like isoniazid, linezolid, and pretomanid showed no difference (Fig. 5 and Supplementary Figs. 6 and 7). Vitamin B12 mirrored the effects of propionate supplementation on rifampicin and bedaquiline resistance (Fig. 5a,c), consistent with enhanced resistance due to increased PDIM production. Notably, the rifampicin MIC90 for PDIM(+) Mtb in propionate-supplemented media reduced ~30-fold when tyloxapol was replaced with Tween 80 (Fig. 6). These data are also congruent with our earlier results showing greater resistance of PDIM(+) Mtb to large compounds and lower permeability compared to PDIM(−) (Extended Data Fig. 1). One outlier to this trend was capreomycin (668.7 g/mol), which did not exhibit a PDIM-propionate MIC shift (Supplementary Fig. 6a). Wang et al. have also reported PDIM-dependent resistance to the small molecule inhibitor 3bMP1 (229.3 g/mol)12, indicating that the relationship between the PDIM permeability barrier and drug uptake is complex though the uptake of large compounds is more likely to be affected by PDIM.
Fig. 5 |. Propionate and vitamin B12 supplementation increase rifampicin and bedaquiline resistance of Mtb in a PDIM-dependent manner.
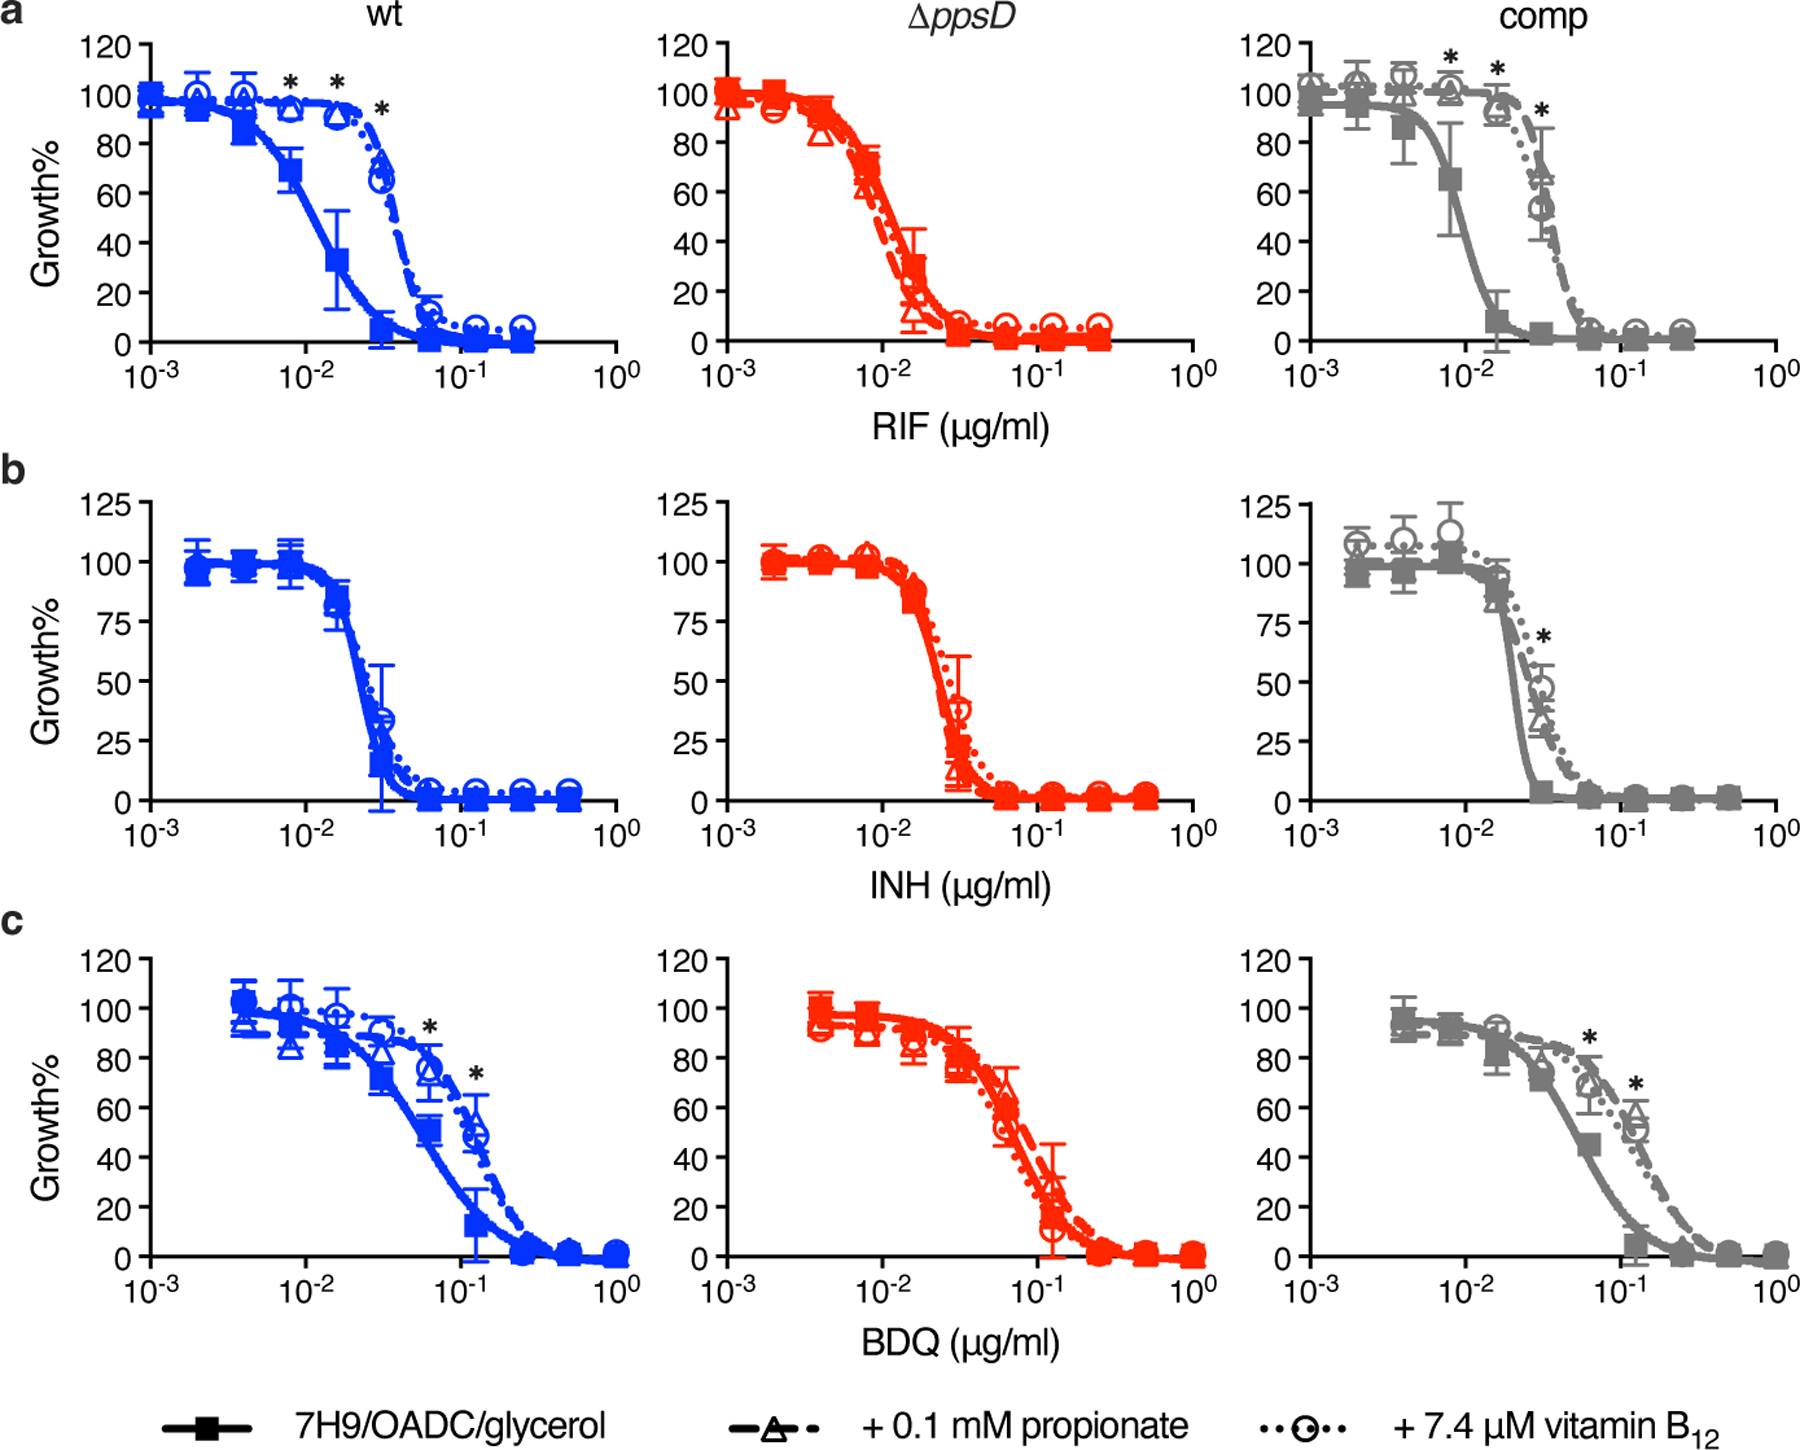
Sensitivity of PDIM(+) and PDIM(-) Mtb H37Rv to a, rifampicin (RIF), b, isoniazid (INH), and c, bedaquiline (BDQ), in standard 7H9/OADC/glycerol/tyloxapol media and supplemented with either 0.1 mM propionate or 7.4 μM vitamin B12 (10 μg/ml). *P < 0.001 for both propionate and vitamin B12 versus unsupplemented; two-way ANOVA with Tukey’s multiple comparison test. Mean ± SD for n = 4 biological replicates from two independent experiments.
Fig. 6 |. Tween 80 increases the sensitivity of Mtb to rifampicin and abolishes PDIM-dependent differences in MIC.

Sensitivity of PDIM(+) and PDIM(-) Mtb H37Rv to rifampicin (RIF) in 7H9/OADC/glycerol media ± 0.1 mM propionate using either tyloxapol or Tween 80 as the culture detergent. Mean ± SD for n = 4 biological replicates from two independent experiments.
Discussion
The mycobacterial cell wall plays a crucial role in the interactions between the pathogen and host40. However, the study of Mtb cell wall biology and pathogenesis has long been impeded by heterogeneity in PDIM production. It has been nearly 50 years since the first report to associate PDIM loss with in vivo virulence attenuation8, and over 20 years since PDIM loss and virulence attenuation were linked at the genetic level6,7. Numerous studies have since reported spontaneous PDIM loss not only in Mtb H37Rv3–5,12, but also in Mtb Erdman41,42, HN8783, CDC155130,43, and in BCG vaccine strains44. This issue of spontaneous loss of PDIM production is thus both long-standing and far-reaching. The number of studies unpublished due to PDIM bias and the time and resources spent chasing PDIM-related phenotypes are likely to be high5,41,42.
We discovered that Mtb metabolism affects the selective pressures to maintain PDIM(+) phenotypes. Mtb growth is impaired in the absence of an exogenous source of MMCoA precursors, which is required to produce PDIM and other methyl-branched lipids. PDIM loss increases the MMCoA pool and confers a growth advantage against PDIM(+) bacilli, providing a selective pressure for PDIM loss. This can be alleviated by supplementing propionyl-CoA-generating carbon sources such as odd-chain fatty acids or cholesterol, or the cofactor vitamin B12, which increase MMCoA pools and restore full growth of PDIM(+) Mtb. The affinity of Mtb for host fatty acids was first described by Segal and Bloch in 195645 and we now know that Mtb also metabolizes host cholesterol18. Cholesterol is thought to be a major source of propionyl-CoA in the host19, and Mtb has evolved to efficiently use this host-derived sterol resource as fuel for cellular metabolism and a building block for virulence lipids18,36. Moreover, starving the bacterium of propionyl-CoA via cholesterol limitation improves macrophage control of Mtb46, demonstrating a crucial role for this metabolite in Mtb during infection. Mtb culture media is, however, devoid of propionyl-CoA precursors. We speculate that the toxicity of high concentrations of odd-chain fatty acids previously discouraged their inclusion, as most Mtb culture media were optimized to promote rapid planktonic growth rather than to reflect the nutrient environment found in the host47,48. Contrary to its negative reputation, we show that 0.1–1.0 mM propionate is advantageous for PDIM(+) growth and selects against PDIM(-) cells, analogous to animal passage, providing an elegant and long-sought solution to prevent loss of PDIM production. Our data also demonstrate that tyloxapol and not Tween 80 should be used in PDIM assays and PDIM selective media, as tyloxapol maintains PDIM-dependent impermeability, whilst Tween 80 strips PDIM and other cell wall components from the Mtb cell envelope28.
Our data also may have ramifications for future drug discovery efforts. During host infection, Mtb survives in a PDIM-rich state17, however, PDIM production is poorly supported in current culture media. We show that PDIM levels affect the potency of rifampicin, bedaquiline and other high molecular weight inhibitors, with reduced PDIM production increasing Mtb sensitivity to these compounds. In concert with the current literature24,49,50, this clearly points to the mycobacterial cell wall as an important factor in drug efficacy and suggests that PDIM loss might lead to overestimation of drug potency.
Furthermore, our observation of increased vancomycin and rifampicin sensitivity of Mtb grown in Tween 80 containing media, confirms previous reports 51,52, and advocates for the use of tyloxapol to maintain the natural permeability barrier in Mtb. Our findings also expand on previous observations associating propionyl-CoA metabolism with rifampicin resistance24,26 by directly linking propionyl-CoA and PDIM production with enhanced rifampicin resistance. The decreased virulence and increased drug sensitivity of PDIM(-) Mtb suggest that inhibitors of PDIM biosynthesis could increase the in vivo potency of current drug regimens. Although speculative, such a therapeutic option would likely be highly specific, as PDIMs are confined to slow-growing, pathogenic mycobacteria. Furthermore, inhibitors targeting propionyl-CoA metabolism could be synergistic with rifampicin due to downstream effects on PDIM.
The main recommendations stemming from our study are to routinely supplement culture media with 0.1–1.0 mM propionate and avoid Tween 80 to prevent PDIM loss and the emergence of populations with heterogeneous PDIM production. In mixed populations, standard media will select for PDIM(-) bacilli while propionate-supplemented media will select for PDIM(+) bacilli. To prevent these dynamic population changes and variation within or between cultures, we recommend always working with purified cultures maintained in the appropriate media. Our discoveries facilitate the maintenance and surveillance of PDIM production and enable efficient re-isolation of PDIM(+) strains from mixed populations. Pure and appropriately maintained PDIM(+) strains will be indispensable for studying bacterial virulence, interactions with host immunity5,53, as well as for pre-clinical work such as vaccine studies. Moreover, today in the emerging era of Mtb systems biology where large pools of genetically modified strains are crucial tools for in vitro and in vivo studies55–56, preventing secondary PDIM mutations is imperative to prevent potential misattribution of phenotypes to genotypes. Importantly, this approach is accessible to everyone, including labs in low-resource settings.
Taken together, our findings resolve the basis for selection of PDIM(−) Mtb. They also reveal how discrepancies between the host and in vitro nutrient environments can influence bacterial pathogenicity, and provide tools and culture conditions to maintain Mtb PDIM production to improve reliability in tuberculosis research.
Methods
Bacterial strains, culture condition and reagents
Mtb strains were obtained from laboratory stocks and are listed in Supplementary Tables 1 and 2. Fresh starter cultures were inoculated from frozen seed stocks and then subcultured once before use in experiments. Subcultures were typically grown for four days to an optical density (OD) at 600 nm (OD600) of ~0.8. For BSL2 strains, OD600 was measured using a GENESYS 140 spectrophotometer (Thermo Fisher Scientific). For BSL3 strains, OD600 was measured on a Biowave WPA CO8000 spectrophotometer (Biochrom Ltd.) and then converted using a calibration curve constructed against a GENESYS 10uv spectrophotometer (Thermo Fisher Scientific). Preculturing steps were performed using Middlebrook 7H9 broth supplemented with 10% (v/v) OADC (0.6 g/l sodium oleate, 50 g/l bovine serum albumin fraction V, 20 g/l dextrose, 40 mg/l catalase, 8.5 g/l sodium chloride), 0.2% (v/v) glycerol, and 0.05% (v/v) tyloxapol. This is referred to as standard 7H9/OADC/glycerol/tyloxapol media. BSL2 strains (Supplementary Table 1) were additionally supplemented with 24 mg/l D-calcium pantothenate, 200 mg/l L-arginine, 50 mg/l L-leucine, and 50 mg/l L-methionine (‘PALM’ supplements). Hygromycin B at 75 μg/ml and kanamycin at 30 μg/ml were added to precultures as indicated (Supplementary Table 2). For supplemented media, 1000 × supplement stocks were prepared in MilliQ water, filter sterilized, then added to standard media and the pH checked. Final supplement concentrations were as follows: 0.1 mM or 1.0 mM sodium propionate, 7.4 μM vitamin B12 (10 μg/ml), and 0.1 mM sodium pyruvate, sodium acetate, sodium butyrate and valeric acid. Cholesterol was prepared at 0.1 M in 1:1 (v/v) EtOH/tyloxapol as previously described36 and then added to detergent-free media to give a final concentration of 0.1 mM cholesterol and 0.05% tyloxapol. Controls were prepared by adding EtOH/tyloxapol in the same manner to provide the detergent. For Tween 80 experiments, 0.05% Tween 80 was used in place of tyloxapol. For growth curve experiments, triplicate inkwells with 5 ml of media were inoculated at a starting OD600 of 0.01. Broth cultures were grown at 37 °C with gentle shaking (100 rpm for BSL2 strains, 80 rpm for BSL3). Middlebrook 7H10 agar supplemented with 10% (v/v) OADC and 0.5% (v/v) glycerol (7H10/OADC/glycerol) was used as a solid media for plating and plates were incubated at 37 °C for three weeks. Supplier information for media components and supplements are listed in Supplementary Table 6.
Mutant generation and complementation
Deletion of the tgs1 (Rv3130c), ppsD (Rv2934) and mas (Rv2940c) genes was carried out by specialized transduction as previously described29. H37Rv-B was used to generate H37Rv Δtgs1 mutants; H37Rv-SC [a single PDIM(+) clone isolated from H37Rv-B by VAN10-P screening] was used to generate H37Rv ΔppsD; and CDC1551-B to generate CDC1551 Δmas (Supplementary Table 2). Transductants were selected on plates containing hygromycin (75 μg/ml) and the deletion was confirmed by 3-primer PCR and whole genome sequencing (WGS). The ΔppsD strain was complemented using the integrative vector pMV36157 containing a copy of the ppsD gene under control of the HSP60 promoter (pMV361-ppsD). The complementation plasmid was constructed by Gibson assembly using the NEBuilder HiFi DNA Assembly Cloning Kit (New England Biolabs). In brief, the plasmid and ppsD insert were amplified by PCR and a Gibson assembly reaction was used to transform Escherichia coli DH5α. The plasmid was isolated, and the nucleotide sequence of the construct was verified by Sanger sequencing. H37Rv ΔppsD cells were electroporated with ~0.5 μg of the complementation plasmid, recovered overnight in 7H9/OADC/glycerol/tyloxapol at 37 °C with shaking and then selected on plates containing hygromycin (75 μg/ml) and kanamycin (30 μg/ml). The H37Rv ΔppsD::comp strain was validated by PCR to confirm both the complementation and presence of the ΔppsD deletion. Primers used for vector construction and PCR confirmation are listed in Supplementary Table 7.
Thin layer chromatography
Mtb cultures were grown to early log phase and then diluted to OD600 0.3 in 10 ml 7H9/OADC/glycerol/tyloxapol and labelled with propionic acid [1-14C] sodium salt (7 μCi) (American Radiolabeled Chemicals, Inc.). Cultures were incubated with shaking at 37 °C for two days and then spun down. Methanol (2.0 ml), 0.3% sodium chloride aqueous solution (0.2 ml) and petroleum ether (2.0 ml) were added to the cell pellets and the suspensions were vortexed for 30 s followed by centrifugation. The petroleum ether phases were moved to new tubes and the extraction with petroleum ether was repeated twice. The petroleum phases were combined, dried with anhydrous sodium sulfate, filtered and evaporated to dryness under nitrogen. The PDIM extracts were resuspended in dichloromethane (0.2 ml). Counts per minute (cpm) were measured to load approximately 5000 cpm for each sample on a silica gel 60 F254 thin layer chromatography (TLC) plate (Sigma-Aldrich). The TLC plate was eluted three times with petroleum ether/ethyl acetate 98/2. PDIMs were detected by autoradiograph after exposure for 48–72h at -80 °C. PDIM band intensity was quantified using ImageJ (v 1.52a) 58.
MIC assays
Resistance of Mtb strains to vancomycin and other inhibitors (Supplementary Table 8) were determined using the microbroth dilution method. Two-fold serial dilutions at 2 × final drug concentration were prepared in standard 7H9/OADC/glycerol/tyloxapol or media supplemented with either 2 × propionate (0.2 or 2.0 mM) or vitamin B12 (14.8 μM) at a volume of 100 μl in the inner wells of flat-bottom 96-well plates. The outer wells were aliquoted with 200 μl PBS or media. Strains were precultured in 7H9/OADC/glycerol/tyloxapol to OD600 of ~0.8 and then diluted to OD600 0.01 in the same media. 100 μl of the cell dilution was added to plate to give a final OD600 of 0.005; 0.1 or 1.0 mM propionate or 7.4 μM vitamin B12 for supplemented assays; and 1 × drug concentration. Plates were incubated with gentle shaking and bacterial growth was measured by OD after 10 days unless otherwise specified. For BSL2 strains, OD600 was measured on a FLUOstar Omega Microplate Reader (BMG LABTECH). For BSL3 strains, OD590 was measured on an Epoch BioTek Microplate Spectrophotometer (BioTek Instruments, Inc.). Data were normalized to drug-free control wells and fit with non-linear regression in Prism (v9.4.1, v10.0.1) (GraphPad Software). MIC90 and MIC50 values were calculated from the curve fit.
VAN10 assay
VAN10 assays were performed in the inner wells of flat-bottom 96-well plates prepared with standard 7H9/OADC/glycerol/tyloxapol or media supplemented with 2 × propionate (0.2 or 2.0 mM) or vitamin B12 (14.8 μM). Triplicate wells were aliquoted with 100 μl drug-free media or media with 20 μg/ml vancomycin. Strains were precultured as for MIC assays and diluted to an OD600 of 0.01 in 7H9/OADC/glycerol/tyloxapol. 100 μl of the cell dilution was added to the plate giving a final vancomycin concentration of 10 μg/ml in treated wells (VAN10); OD600 of 0.005; and 0.1 or 1.0 mM propionate or 7.4 μM vitamin B12 in supplemented assays. Plates were incubated with gentle shaking and bacterial growth was measured by OD after 10 days unless otherwise specified. Relative growth in VAN10 was calculated compared to drug-free wells (VAN0) (VAN10 OD / VAN0 OD × 100 = VAN10 growth%). The VAN10 assay supplemented with 0.1 mM propionate is referred to as the ‘VAN10-P’ assay.
For high throughput screening of single colonies and to isolate PDIM(+) clones, single colonies were picked into 7H9/OADC/glycerol/tyloxapol and grown until dense to synchronize. Outgrowth cultures were then subcultured for a single passage and grown to an OD600 of ~0.5–1.0. Subcultures were diluted 1:50 in 7H9/OADC/glycerol/tyloxapol and 100 μl of this was used to inoculate VAN10-P assay plates prepared as above. Growth was measured after 14 days to obtain an endpoint measurement. mc26230 was additionally supplemented with 24 mg/l pantothenate, and 0.1 mM propionate was included in the plates and outgrowth media used to isolate mc26230 AE1601 (Supplementary Table 1).
Permeability assay
Cell envelope permeability was determined using the Ethidium Bromide (EtBr) uptake assay16. Four replicate cultures of Mtb mc27902 and mc28398 in 10 ml 7H9/OADC/glycerol/ tyloxapol + PALM media were grown to an OD600 of 0.6–1.0. Cultures were washed three times with PBS + 0.4% (w/v) glucose and diluted to an OD600 of 0.5. Five replicate 180 µl aliquots were transferred to a black, clear-bottom, 96-well plate and 20 µl EtBr (50 μg/ml) was added. The plate was incubated at 37 °C in a FLUOstar Omega Microplate Reader (BMG LABTECH) with 300 rpm double-orbital shaking. Fluorescence was measured at an excitation wavelength of 355 nm and emission wavelength of 590 nm every 15 min for one hour.
Evolution experiments
Triplicate inkwells containing 10 ml standard 7H9/OADC/glycerol/tyloxapol or supplemented media as specified were inoculated with 100 μl of frozen Mtb seed stock and incubated for 7–10 days. Cultures were then diluted 1:250 into 10 ml fresh media each week for serial passage. To assess PDIM maintenance over the course of the experiment, at selected passages cultures were input into VAN10-P assays and 1 ml of culture was stocked and stored at -80 °C. VAN10-P assay plates were prepared as above and cultures were diluted 1:100 in 7H9/OADC/glycerol/tyloxapol for input into the assay. Growth was measured after 7 and 14 days of incubation. For TLC lipid analysis of passaged cultures, cultures were first recovered from frozen stocks by growing to an OD600 of ~1.0 in standard 7H9/OADC/glycerol/tyloxapol before 14C-labelling and TLC lipid analysis as above.
Metabolomics extractions
Triplicate inkwells containing 7 ml standard 7H9/OADC/glycerol/tyloxapol or supplemented media as specified were inoculated at OD600 0.01 and grown for five days and then harvested. An equivalent of 3 ml culture at an OD600 of 1.0 was rapidly filtered on 0.45 μm Durapore PVDF membrane filters (MilliporeSigma) using a vacuum manifold (MilliporeSigma). Cultures were quenched by placing the filter paper in 1 ml of extraction solvent containing 20:40:40 (v/v) water/acetonitrile/methanol with approximately 500 μl of 0.1 mm zirconia/silica beads (BioSpec) at -20 °C. Samples were homogenized using a Precellys Cryolys Evolution (Bertin Technologies) cooled to 0 °C for three 20 s cycles at 6800 rpm with a 30 s pause between cycles. Samples were centrifuged and the extracts were filtered through a 0.22 μm Nylon Spin-X microcentrifuge filter (Corning) and stored at -80 °C. For analysis, extract samples were concentrated 5-fold by using a SpeedVac® Plus SC110A (Savant Instruments, Inc.) to evaporate the solvent and then redissolved in 1/5th volume of the extraction solvent.
LC-MS metabolomic profiling
Metabolomics analysis was performed using an Agilent 1290 Infinity II liquid chromatography (LC) system coupled with an Agilent 6545 quadrupole time-of-flight (QTOF) mass spectrometer (MS) equipped with a Dual Agilent Jet Stream Electrospray Ionization (Dual AJS ESI) source operated in negative mode. Metabolites were separated on an InfinityLab Poroshell 120 HILIC-Z, 2.1 × 150 mm, 2.7 µm, 100 Å column (Agilent) based on previously described methods59. The mobile phase consisted of solvent A: water, and solvent B: 15:85 (v/v) water/acetonitrile, both with 10 mM ammonium acetate and 2.5 μM InfinityLab Deactivator Additive (Agilent), pH 9.0. HPLC grade water (Cen-Med Enterprises) and LC-MS grade solvents (Fisher Chemical) were used for both the LC-MS mobile phase and metabolite extraction. The elution gradient used was as follows: 0–2 min 96% B; 2–5.5 min 96 to 88% B; 5.5–8.5 88% B; 8.5–9 min 88 to 86% B; 9–14 min 86% B; 14–17 min 86 to 82% B; 17–23 min 82 to 65% B; 23–24 min 65% B; 24–24.5 min 64 to 96% B; 24.5–26 min 96% B; followed by a 3 min re-equilibration at 96% B. The flow rate was 0.25 ml/min and column temperature 50 °C. The injection volume was 3 μl and the autosampler was maintained at 4 °C during the run. Mass spectra were recorded in profile mode from m/z 60 to 1200 using an acquisition rate of 1 spectra/s in the 2GHz extended dynamic range mode and 1700 m/z low mass range, using the sensitive slicer mode and fragile ions option. The gas temperature was 225 °C and sheath gas temperature 350 °C. The capillary, nozzle, fragmentor, skimmer, and octopole voltages were 3500, 2000, 125, 45 and 750 V, respectively. Dynamic mass axis calibration was achieved by continuous infusion of a reference mass solution using an isocratic pump with a 100:1 splitter.
Data Analysis was performed using the Agilent MassHunter Qualitative (v10) and Quantitative Analysis Software (v10.1). Metabolite identification was based on mass-retention times determined using chemical standards (Supplementary Fig. 8, Supplementary Table 9) and isotope distribution patterns. Calibration curves of standard compound mixtures in extraction buffer and spiked into a homologous mycobacterial extract were run to determine the linear range. Metabolites were quantified using a mass tolerance of 20 ppm with manual curation of peak areas where necessary and the area under the curve (AUC) was determined. AUC was normalized in Microsoft Excel 365 using the median total AUC for a panel of 50 putative metabolites across different metabolic pathways (Supplementary Table 10) to correct for differences in extraction and concentration efficiency.
Mouse experiments
Mouse experiments were performed in accordance with National Institutes of Health guidelines following the recommendations in the Guide for the Care and Use of Laboratory Animals60. The protocols used in this study were approved by the Institutional Animal Care and Use Committee of Albert Einstein College of Medicine (Protocols #00001445 and #00001332). To generate H37Rv-B, female C57BL/6 mice (Jackson Laboratory) were infected with H37Rv-A via the aerosol route using a 1 × 10⁷ cfu/ml Mtb suspension in PBS containing 0.05% tyloxapol and 0.004% antifoam. Mice were sacrificed after 21 days and the lungs homogenized and plated on 7H10/OADC/glycerol plates. All colonies from the lung of a single mouse were harvested and used to inoculate 7H9/OADC/glycerol/tyloxapol in a roller bottle. This was grown to an OD600 of 1.8 and then stocked in 1 ml aliquots and stored at -80 °C. To isolate single PDIM(+) clones of Erdman, HN878 and CDC1551, in-house bred Rag−/− mice were infected with 5 × 10⁶ cfu/mouse via the intravenous route. Mice were killed on day 20 post-infection and the lungs homogenized and plated on 7H10/OADC/glycerol plates. Single colonies were picked and outgrown in 7H9/OADC/glycerol/tyloxapol with 0.1 mM propionate for stocking and then subcultured and screened for PDIM using VAN10-P assays as above.
Whole genome sequencing and analysis
Genomic DNA was isolated using a CTAB extraction method as previously described61 and sequenced in-house on an Illumina MiSeq. Genomic libraries were prepared using the Illumina Nextera XT library preparation kit and sequenced with a 600-cycle v3 reagent kit (2 × 301 bp reads) following the manufacturer’s instructions. Genomes with uneven coverage (< 90% of the genome having > 10 × coverage) for which no PDIM SNPs were detected were additionally sequenced with a 150-cycle v3 kit (2 × 76 bp reads) and the data merged for mapping. Additional sequencing by Illumina NextSeq was performed by SeqCenter (Pittsburgh, PA) using the Illumina DNA Prep kit and sequenced on an Illumina NextSeq 2000 (2 × 151 bp reads).
Raw sequence data quality was assessed by FastQC (v0.11.9). Raw reads were trimmed with Trimmomatic (v0.39)62 using a sliding window quality filter (SLIDINGWINDOW:4:15) and reads less than 25 bp were discarded (MINLEN:25). Trimmed reads were then mapped to the reference genome corresponding to the strain background (H37Rv NC_000962.3, CDC1551 NC_002755.2, Erdman NC_020559.1, HN878 NZ_CM001043.1 and KZN 4207 NC_016768.1) using BWA-MEM (v0.7.17-r1188) (https://github.com/lh3/bwa). Mapping files were sorted and indexed using Samtools (v1.6)63. Duplicates were removed using Picard tools (v2.26.10) (http://broadinstitute.github.io/picard) and local realignment was performed using GATK (v.3.8–0)64. Mapping quality was assessed using Qualimap (v2.2.1)65. Variants were called using Pilon (v1.23)66 using a minimum depth threshold of 5, base quality threshold of 15 and mapping quality threshold of 40 (--variant --mindepth 5 --minqual 15 --minmq 40). Scripts used for reference-guided assembly and variant calling are available at https://github.com/cvmulholland/MtbShortReadWGS. Variants were annotated using SNPeff (v5.1d)67. Geneious Prime® (v2022.2.2) (Biomatters Ltd.) was used to detect low-frequency variants within the PDIM gene region (tesA–Rv2953) using the variation/SNP finder feature with a coverage threshold of 10, minimum variant frequency of 10%, and P value < 1 x 10⁻¹⁰. SeqTK (v1.3-r106) (https://github.com/lh3/seqtk) was used to randomly subsample reads for downsampling analyses.
ppsC homopolymeric tract region Sanger sequencing
To identify and confirm mutations in the ppsC homopolymeric tract region, a 250 bp fragment encompassing this region was amplified by PCR and then sequenced by Sanger sequencing. PCR was performed in 50 μl reactions containing 2.5 units HOT FIREPol® DNA polymerase (Solis BioDyne), the supplied reaction buffer BD at 1 × concentration, 2.0 mM MgCl2, 250 μM dNTPs, 0.3 μM of each primer, and 2.5% (v/v) DMSO. Primers are listed in Supplementary Table 7. Approximately 25 ng of gDNA was used as the PCR template. Thermal cycling consisted of an initial denaturation and enzyme activation step of 15 min at 95 °C, followed by 35 cycles of 30 s at 95 °C, 45 s at 55 °C, and 30 s at 72 °C. This was followed by a final elongation step of 10 min at 72 °C. PCR products were purified using the Wizard® SV Gel and PCR Clean-Up system (Promega) and then sequenced by Sanger sequencing at GENEWIZ (South Plainfield, NJ) in both the forward and reverse direction using the same primers as for amplification.
Statistical analysis
Statistical analyses were performed using Prism (v9.4.1 and v10.0.) (GraphPad Software). Significant differences were calculated by one- or two-way ANOVA using multiple comparison tests as specified, or the nonparametric Mann-Whitney test for skewed data. Correlations between vancomycin MIC and VAN10 growth% with PDIM were assessed by simple linear regression.
Extended Data
Extended Data Fig. 1. Resistance of PDIM(-) and PDIM(+) Mtb to high molecular weight compounds.
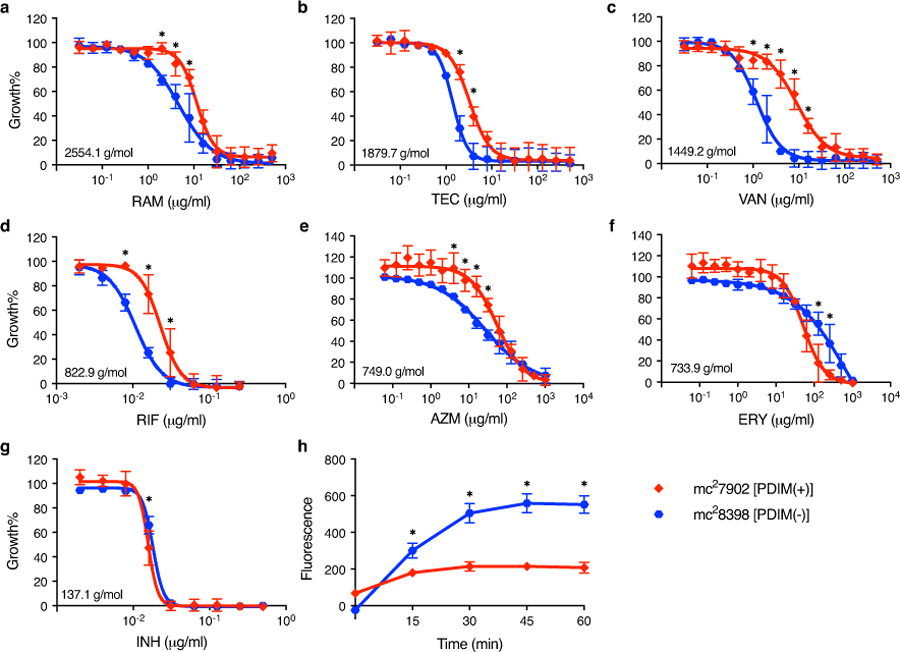
a–g, MIC assays of Mtb mc27902 [PDIM(+)] and mc28398 [PDIM(-)] to (a) ramoplanin (RAM), (b) teicoplanin (TEC), (c) vancomycin (VAN), (d) rifampicin (RIF), (e) azithromycin (AZM), (f) erythromycin (ERY), and (g) isoniazid (INH). Compounds are arranged by descending molecular weight, which is shown on the MIC plots. MICs were performed in 7H9/OADC/glycerol/tyloxapol + PALM media and bacterial growth was measured after 10 days of incubation and normalized to drug-free controls. Mean ± SD for n = 4 biological replicates from two independent experiments. h, Ethidium Bromide uptake of mc27902 and mc28398. Uptake in whole cell suspensions was monitored by fluorescence (Ex 355 nm/Em 590 nm). Mean ± SD for n = 4 biological replicates, each measured in five technical replicates. Uptake data are representative of two independent experiments. *P < 0.001; two-way ANOVA with Šidák’s multiple comparison test.
Extended Data Fig. 2. Propionate and vitamin B12 supplementation selectively increase vancomycin resistance of PDIM(+) Mtb improving assay robustness and reducing time to result.
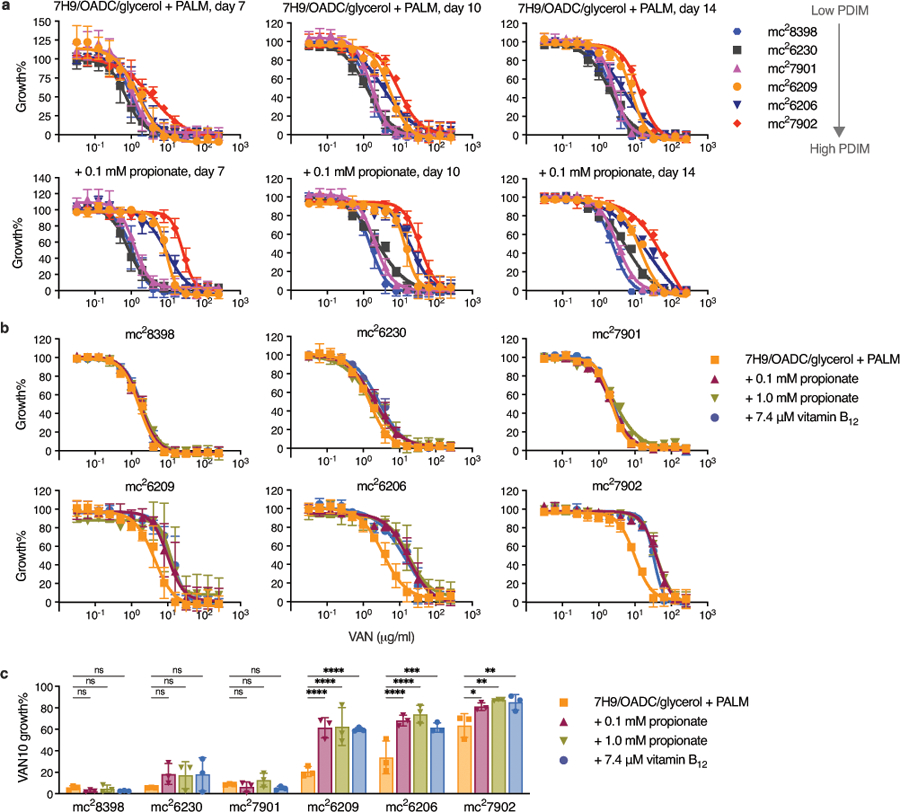
a, Vancomycin MICs for the PDIM reference strain set in standard 7H9/OADC/glycerol/tyloxapol + PALM media and additionally supplemented with 0.1 mM propionate. Growth was measured after 7, 10, and 14 days as indicated. Mean ± SD for n = 4 biological replicates from two independent experiments. b, Vancomycin MICs in standard media and additionally supplemented with 0.1 or 1.0 mM propionate or 7.4 μM vitamin B12. Growth was measured after 10 days. Mean ± SD for n = 4 biological replicates from two independent experiments. c, VAN10 assays in standard and supplemented media. Growth was measured after 10 days. Mean ± SD for n = 3 independent experiments, each performed in triplicate. *P < 0.05, **P < 0.01, ***P < 0.001, ****P < 0.0001; two-way ANOVA with Šidák’s multiple comparison test. The day seven data in (a) are also shown in Fig. 1c and are shown here alongside additional time points. The data in (b) includes one of the same experiments shown in (a), together with data from an independent experiment. The VAN10-P (+ 0.1 mM propionate) data in (c) are also shown in Fig. 1e and are shown here alongside additional conditions.
Extended Data Fig. 3. Tween 80 decreases vancomycin resistance and abolishes PDIM-related differences in MIC.
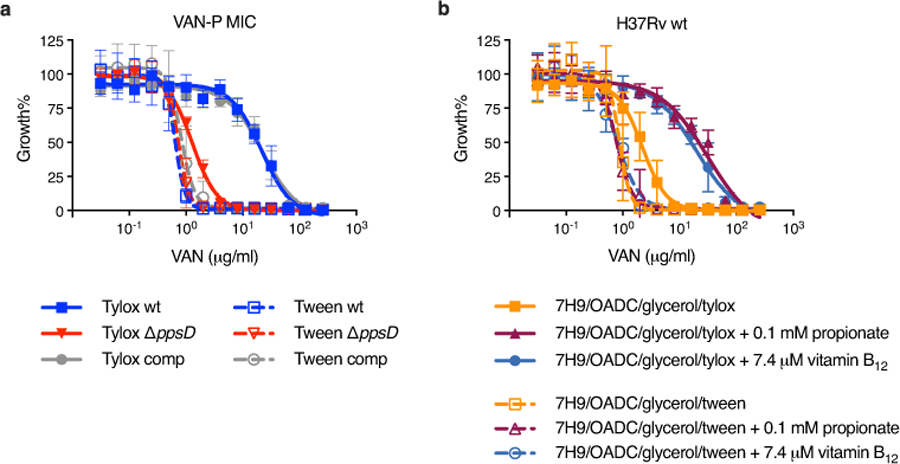
a, VAN-P MICs for PDIM(+) and PDIM(-) Mtb H37Rv using either tyloxapol or Tween 80 as the culture detergent. b, Vancomycin MICs for PDIM(+) H37Rv wildtype in standard 7H9/OADC/glycerol media and supplemented with propionate or vitamin B12 using either tyloxapol or Tween 80 as the detergent. Mean ± SD for n = 4 biological replicates from two independent experiments.
Extended Data Fig. 4. VAN-P assays predict PDIM levels across different Mtb strains and lineages and enable re-isolation of single PDIM(+) clones.
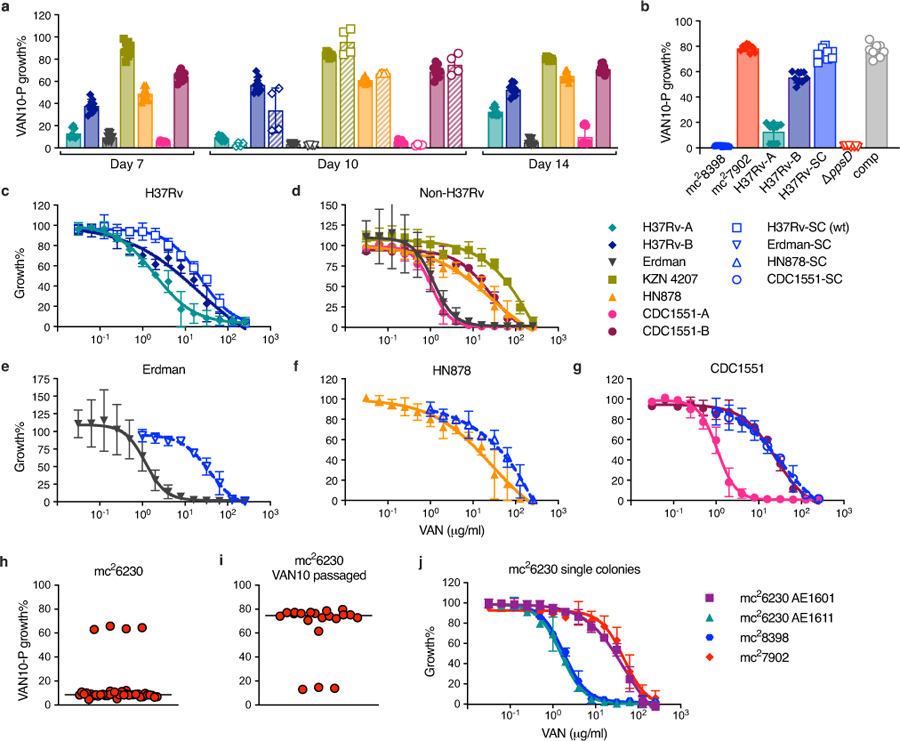
a, VAN10-P assays for a range of virulent Mtb strains belonging to different lineages. Bacterial growth was measured after 7, 10, and 14 days of incubation as indicated. Data are from the same experiment in Fig. 2a and show additional time points plus an independent experimental repeat measured on day 10 (hatched bars with unfilled symbols). b, VAN10-P assays for strains with an H37Rv background including mc27902 and mc28398. H37Rv-SC is a single PDIM(+) clone isolated from H37Rv-B by VAN10-P colony screening. This clone was used as our PDIM(+) H37Rv wildtype strain throughout this work and was used to construct H37Rv ΔppsD and ΔppsD::comp mutants (Supplementary Table 2). Data in (a,b) show mean ± SD for n = 9 pairwise comparisons between triplicate wells, except for the day 10 repeat in (a) where n = 4 pairwise comparisons between duplicate wells. c, VAN-P MICs of H37Rv stocks and H37Rv-SC. d, VAN-P MICs of non-H37Rv strains from (a). e–g, VAN-P MICs of single PDIM(+) clones isolated from Rag-/- mice using VAN10-P colony screening for (e) Erdman, (f) HN878, and (g) CDC1551 (see also Supplementary Table 3). Data are plotted together with MIC data from (d) for comparison. MIC data in (c–g) show mean ± SD for n = 4 biological replicates from two independent experiments. h–j, Determination that our Mtb mc26230 stock is a mixed population and re-isolation of a single PDIM(+) clone by VAN10-P screening. (h) VAN10-P assay of single colonies isolated from our mc26230 stock (n = 40) and (i) following a single passage in 10 μg/ml vancomycin (n = 20). Vancomycin significantly enriched for PDIM(+) bacilli (P < 0.0001 two-tailed Mann-Whitney test), facilitating re-isolation of low-frequency PDIM(+) clones. Each colony was assayed in triplicate and data points represent mean VAN10-P growth%. Lines indicate the median. j, VAN-P MICs of PDIM(+) (AE1601) and PDIM(−) (AE1611) mc26230 clones identified by VAN10-P colony screening (see also Supplementary Table 3). Mean ± SD for n = 6 biological replicates from two independent experiments.
Extended Data Fig. 5. Assessment of ppsC homopolymeric tract mutations.
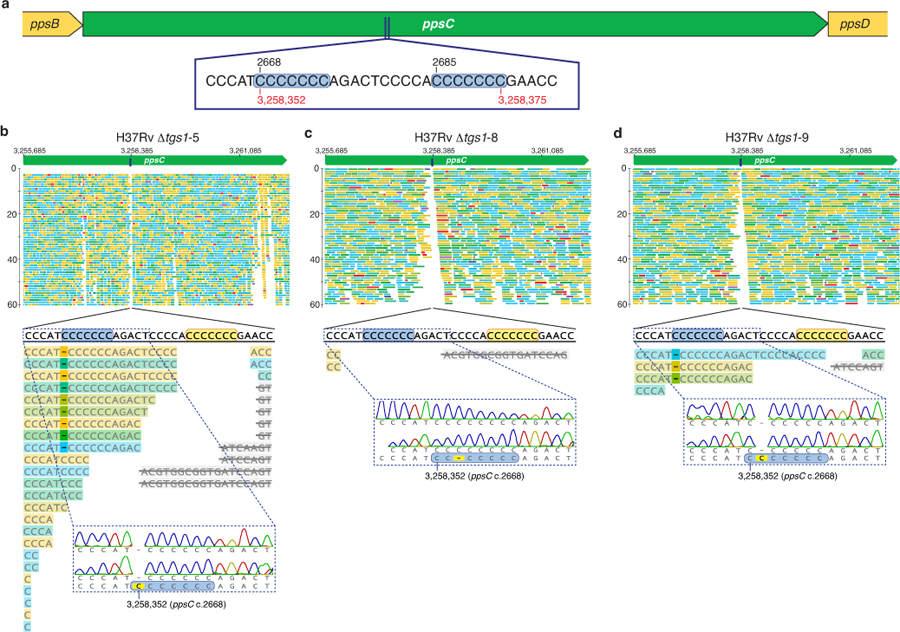
a, Schematic showing the location of a homopolymeric tract region in the ppsC gene. Sequence inserts show two adjacent 7-cytosine homopolymeric tracts (c.2668 and c.2685) ± 5 bp on either side. Numbers in black indicate the position in the ppsC gene and numbers in red the genomic position in the H37Rv genome. b–d, Analysis of the ppsC homopolymeric tract region in Δtgs1 mutants and identification of frameshift mutations. WGS variant calling failed to identify PDIM mutations in Δtgs1-5, Δtgs1-8 and Δtgs1-9 despite a PDIM(-) result in VAN-P MICs (Fig. 2b) and validation of Δtgs1-9 as PDIM(-) by TLC (Fig. 2c). Close manual inspection of WGS reads showed the ppsC homopolymeric tract region is poorly covered by Illumina MiSeq and identified potentially missed variant calls. PCR and Sanger sequencing confirmed the presence of a 2668(C)76 frameshift mutation in both Δtgs1-5 (b) and Δtgs1-9 (d) and identified a 2668(C)78 mutation in Δtgs1-8 that was not covered at all by WGS (c). (b–d) were created with Geneious Prime® 2022.2.2 and Illustrator 26.4.1. Coverage has been cropped to a read depth of 60 ×. See also Supplementary Table 5.
Extended Data Fig. 6. Effect of different media supplements on growth of PDIM(+) and PDIM(−) Mtb.
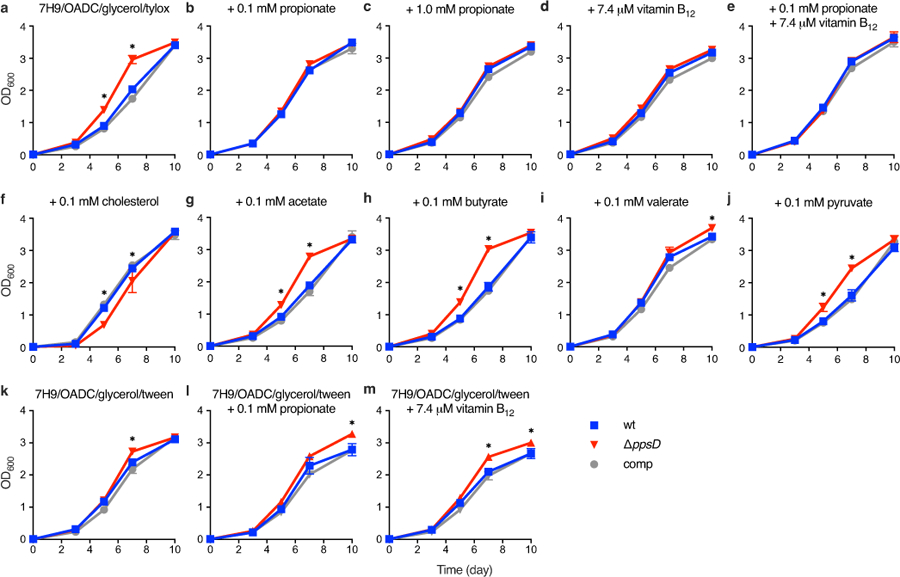
a, Growth of PDIM(+) and PDIM(-) Mtb H37Rv in standard 7H9/OADC/glycerol/tyloxapol and b–j, the same media with additional supplements as indicated. k–m, Growth using Tween 80 instead of tyloxapol as the culture detergent with additional supplements as indicated. Mean ± SD for n = 3 biological replicates. Data are representative of at least two independent experiments. (a,b,d,f) show independent experimental repeats for the conditions in Fig. 3. *P < 0.001 for both wt and comp versus ΔppsD; two-way ANOVA with Tukey’s multiple comparison test. For some data points the SD is smaller than the data symbols.
Extended Data Fig. 7. Effects of propionate and vitamin B12 supplementation on MMCoA and propionyl-CoA metabolic pathways in Mtb.
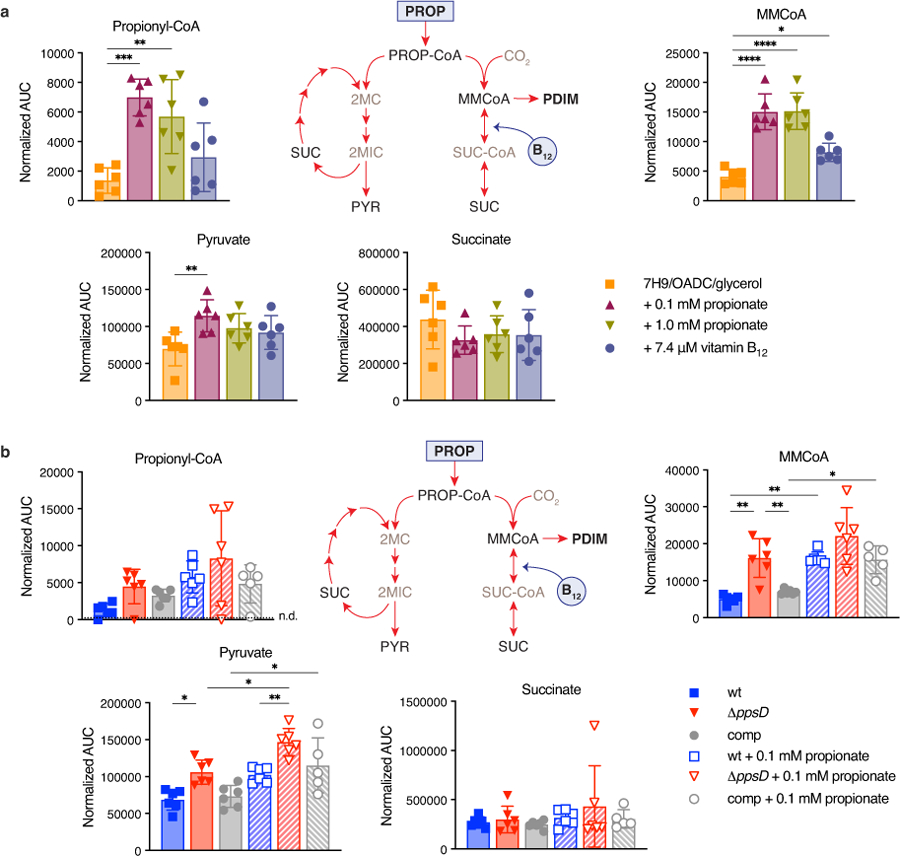
a, Abundance of metabolites in propionyl-CoA and MMCoA metabolism in PDIM(+) Mtb H37Rv wildtype grown in standard 7H9/OADC/glycerol/tyloxapol media and supplemented with propionate or vitamin B12, and b, in PDIM(+) and PDIM(-) H37Rv grown in 7H9/OADC/glycerol/tyloxapol ± 0.1 mM propionate. Abundances are shown as normalized area under the curve (AUC) (see Methods). Mean ± SD for n = 6 biological replicates from two independent experiments. *P < 0.05, **P < 0.01, ***P < 0.001, ****P < 0.0001; one-way ANOVA with Tukey’s multiple comparison test. Significant differences compared to unsupplemented media are indicated in (a), and between ± propionate for each strain and between strains for each condition in (b). PROP, propionate; PROP-CoA, propionyl-CoA; MMCoA, methylmalonyl-CoA; SUC-CoA, succinyl-CoA; SUC, succinate; 2MC/2MIC, 2-methyl(iso)citrate; and PYR, pyruvate. Succinyl-CoA and methyl(iso)citrate were not able to be detected in samples by our method. Propionyl-CoA was close to the detection limit and was not detected in all samples (n.d. = not detected). The data for MMCoA are also shown in Fig. 3d,e. See also Supplementary Fig. 8.
Extended Data Fig. 8. Propionate and vitamin B12 supplementation prevent PDIM loss in Mtb.
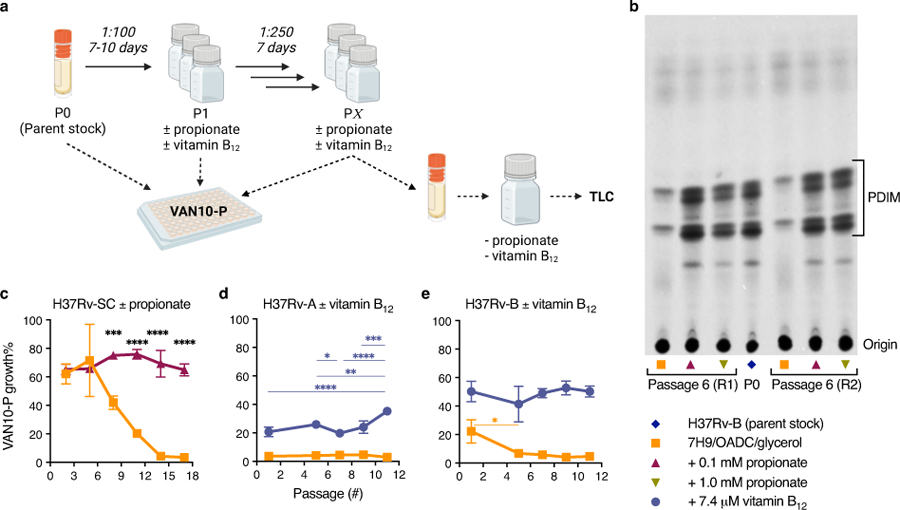
a, Schematic overview of in vitro evolution experiments. Triplicate inkwells containing standard 7H9/OADC/glycerol/tyloxapol or media supplemented with propionate or vitamin B12 were inoculated with frozen Mtb culture stock (P0) and incubated for 7–10 days (P1). Cultures were then diluted into fresh media every 7 days for serial passage (P2 to PX). Selected passages were input into VAN10-P assays at the time of passage to assess PDIM production over the course of the experiment. For TLC lipid analysis, frozen stocks were first outgrown in media without propionate or vitamin B12 for a single passage to allow the strains to recover before 14C-labelling. Figure created with BioRender.com. b, TLC lipid analysis of H37Rv-B before and after six serial passages in ± 0.1 or 1.0 mM propionate. This figure shows the full TLC plate from Fig. 4a with results for both biological replicates analysed by TLC. c, VAN10-P assays for H37Rv-SC [PDIM(+) H37Rv wildtype] passaged in ± 0.1 mM propionate. d, H37Rv-A and e, H37Rv-B passaged in ± 7.4 μM vitamin B12. Mean ± SD for n = 3 biological replicates, each assayed in triplicate. *P < 0.05, **P < 0.01, ***P < 0.001, ****P < 0.0001; two-way ANOVA with Šidák’s (c) or Tukey’s (d,e) multiple comparison test. Significant differences between conditions are indicated in (c) and between timepoints in (d,e).
Supplementary Material
Acknowledgments
We thank Bing Chen, John Kim, and Mei Chen for assistance with animal experiments; Annie Zhi Dai for technical support; Sangeeta Tiwari who constructed the mc28398 mutant; and the labs of Jeremy Rock, Rockefeller University, NY, and John Chan, Rutgers University, NJ, for their feedback and independent validation of VAN-P PDIM assays. C.V.M., T.J.W., J.C., E.Z.R., and M.B. The authors acknowledge support from the following grants: National Institutes of Health/National Institute of Allergy and Infectious Diseases R01 AI139465 for C.V.M., T.J.W., J.C., E.Z.R., and M.B. , R01 AI175972 for C.V.M., T.J.W., J.C., E.Z.R. and M.B. and AI026170 for C.V., S.R., and W.J.R., the Potts Memorial Foundation for C.V.M., E.Z.R. and M.B., Albert Einstein College of Medicine internal funding for E.Z.R. and M.B., the Institutional AIDS training grant, Training in HIV/AIDS Pathogenesis; Basic and Translational Research (T32 AI007501) for M.W.S., and the Albert Einstein College of Medicine MSTP training grant T32GM149364 for M.W.S..
Footnotes
Code availability statement
WGS data were processed on the Albert Einstein College of Medicine High-Performance Computing Core (HPC). Scripts used for reference-guided assembly and variant calling are available at https://github.com/cvmulholland/MtbShortReadWGS.
Competing interests
C.V.M. and M.B. are inventors on a pending patent related to this work (U.S. Patent Application No. 63/527,831, filed 20 July 2023). The authors declare that they have no other competing interests. The remaining authors declare no competing interests.
Additional information
Supplementary Information is available for this paper.
Correspondence and requests for materials should be addressed to Michael Berney.
Data availability statement
Whole genome sequence data have been deposited in the NCBI Sequence Read Archive (SRA) under the BioProject accession number PRJNA923717. A complete list of strains sequenced in this study and SRA accession numbers are given in Supplementary Table 11. Raw metabolomics data are provided as a supplementary data file (Supplementary Data 1). Source data are provided for all Figures and Extended Data Figures.
References
- 1.Daffe M & Laneelle MA Distribution of phthiocerol diester, phenolic mycosides and related compounds in mycobacteria. J Gen Microbiol 134, 2049–2055 (1988). [DOI] [PubMed] [Google Scholar]
- 2.Rens C, Chao JD, Sexton DL, Tocheva EI & Av-Gay Y Roles for phthiocerol dimycocerosate lipids in Mycobacterium tuberculosis pathogenesis. Microbiology (Reading) 167 (2021). [DOI] [PubMed] [Google Scholar]
- 3.Domenech P & Reed MB Rapid and spontaneous loss of phthiocerol dimycocerosate (PDIM) from Mycobacterium tuberculosis grown in vitro: implications for virulence studies. Microbiology (Reading) 155, 3532–3543 (2009). [DOI] [PMC free article] [PubMed] [Google Scholar]
- 4.Manjunatha UH et al. Identification of a nitroimidazo-oxazine-specific protein involved in PA-824 resistance in Mycobacterium tuberculosis. Proc Natl Acad Sci U S A 103, 431–436 (2006). [DOI] [PMC free article] [PubMed] [Google Scholar]
- 5.Kirksey MA et al. Spontaneous phthiocerol dimycocerosate-deficient variants of Mycobacterium tuberculosis are susceptible to gamma interferon-mediated immunity. Infect Immun 79, 2829–2838 (2011). [DOI] [PMC free article] [PubMed] [Google Scholar]
- 6.Cox JS, Chen B, McNeil M & Jacobs WR Jr. Complex lipid determines tissue-specific replication of Mycobacterium tuberculosis in mice. Nature 402, 79–83 (1999). [DOI] [PubMed] [Google Scholar]
- 7.Camacho LR, Ensergueix D, Perez E, Gicquel B & Guilhot C Identification of a virulence gene cluster of Mycobacterium tuberculosis by signature-tagged transposon mutagenesis. Mol Microbiol 34, 257–267 (1999). [DOI] [PubMed] [Google Scholar]
- 8.Goren MB, Brokl O & Schaefer WB Lipids of putative relevance to virulence in Mycobacterium tuberculosis: phthiocerol dimycocerosate and the attenuation indicator lipid. Infect Immun 9, 150–158 (1974). [DOI] [PMC free article] [PubMed] [Google Scholar]
- 9.Murry JP, Pandey AK, Sassetti CM & Rubin EJ Phthiocerol dimycocerosate transport is required for resisting interferon-gamma-independent immunity. J Infect Dis 200, 774–782 (2009). [DOI] [PMC free article] [PubMed] [Google Scholar]
- 10.Day TA et al. Mycobacterium tuberculosis strains lacking surface lipid phthiocerol dimycocerosate are susceptible to killing by an early innate host response. Infect Immun 82, 5214–5222 (2014). [DOI] [PMC free article] [PubMed] [Google Scholar]
- 11.Rousseau C et al. Production of phthiocerol dimycocerosates protects Mycobacterium tuberculosis from the cidal activity of reactive nitrogen intermediates produced by macrophages and modulates the early immune response to infection. Cell Microbiol 6, 277–287 (2004). [DOI] [PubMed] [Google Scholar]
- 12.Wang Q et al. PE/PPE proteins mediate nutrient transport across the outer membrane of Mycobacterium tuberculosis. Science 367, 1147–1151 (2020). [DOI] [PMC free article] [PubMed] [Google Scholar]
- 13.Camacho LR et al. Analysis of the phthiocerol dimycocerosate locus of Mycobacterium tuberculosis. Evidence that this lipid is involved in the cell wall permeability barrier. J Biol Chem 276, 19845–19854 (2001). [DOI] [PubMed] [Google Scholar]
- 14.Tran V, Ahn SK, Ng M, Li M & Liu J Loss of Lipid Virulence Factors Reduces the Efficacy of the BCG Vaccine. Sci Rep 6, 29076 (2016). [DOI] [PMC free article] [PubMed] [Google Scholar]
- 15.Soetaert K et al. Increased Vancomycin Susceptibility in Mycobacteria: a New Approach To Identify Synergistic Activity against Multidrug-Resistant Mycobacteria. Antimicrob Agents Chemother 59, 5057–5060 (2015). [DOI] [PMC free article] [PubMed] [Google Scholar]
- 16.Rodrigues L, Viveiros M & Ainsa JA Measuring efflux and permeability in mycobacteria. Methods Mol Biol 1285, 227–239 (2015). [DOI] [PubMed] [Google Scholar]
- 17.Jain M et al. Lipidomics reveals control of Mycobacterium tuberculosis virulence lipids via metabolic coupling. Proc Natl Acad Sci U S A 104, 5133–5138 (2007). [DOI] [PMC free article] [PubMed] [Google Scholar]
- 18.Pandey AK & Sassetti CM Mycobacterial persistence requires the utilization of host cholesterol. Proc Natl Acad Sci U S A 105, 4376–4380 (2008). [DOI] [PMC free article] [PubMed] [Google Scholar]
- 19.Griffin JE et al. Cholesterol catabolism by Mycobacterium tuberculosis requires transcriptional and metabolic adaptations. Chem Biol 19, 218–227 (2012). [DOI] [PMC free article] [PubMed] [Google Scholar]
- 20.Gopinath K, Moosa A, Mizrahi V & Warner DF Vitamin B12 metabolism in Mycobacterium tuberculosis. Future Microbiol 8, 1405–1418 (2013). [DOI] [PubMed] [Google Scholar]
- 21.Gopinath K et al. A vitamin B12 transporter in Mycobacterium tuberculosis. Open Biol 3, 120175 (2013). [DOI] [PMC free article] [PubMed] [Google Scholar]
- 22.Savvi S et al. Functional characterization of a vitamin B12-dependent methylmalonyl pathway in Mycobacterium tuberculosis: implications for propionate metabolism during growth on fatty acids. J Bacteriol 190, 3886–3895 (2008). [DOI] [PMC free article] [PubMed] [Google Scholar]
- 23.Yang X, Nesbitt NM, Dubnau E, Smith I & Sampson NS Cholesterol metabolism increases the metabolic pool of propionate in Mycobacterium tuberculosis. Biochemistry 48, 3819–3821 (2009). [DOI] [PMC free article] [PubMed] [Google Scholar]
- 24.Koh EI et al. Chemical-genetic interaction mapping links carbon metabolism and cell wall structure to tuberculosis drug efficacy. Proc Natl Acad Sci U S A 119, e2201632119 (2022). [DOI] [PMC free article] [PubMed] [Google Scholar]
- 25.Quinonez CG et al. The Role of Fatty Acid Metabolism in Drug Tolerance of Mycobacterium tuberculosis. mBio 13, e0355921 (2022). [DOI] [PMC free article] [PubMed] [Google Scholar]
- 26.Hicks ND et al. Clinically prevalent mutations in Mycobacterium tuberculosis alter propionate metabolism and mediate multidrug tolerance. Nat Microbiol 3, 1032–1042 (2018). [DOI] [PMC free article] [PubMed] [Google Scholar]
- 27.Wang H et al. An essential bifunctional enzyme in Mycobacterium tuberculosis for itaconate dissimilation and leucine catabolism. Proc Natl Acad Sci U S A 116, 15907–15913 (2019). [DOI] [PMC free article] [PubMed] [Google Scholar]
- 28.Ortalo-Magne A et al. Identification of the surface-exposed lipids on the cell envelopes of Mycobacterium tuberculosis and other mycobacterial species. J Bacteriol 178, 456–461 (1996). [DOI] [PMC free article] [PubMed] [Google Scholar]
- 29.Jain P et al. Specialized transduction designed for precise high-throughput unmarked deletions in Mycobacterium tuberculosis. mBio 5, e01245–01214 (2014). [DOI] [PMC free article] [PubMed] [Google Scholar]
- 30.Dechow SJ, Baker JJ, Murto M & Abramovitch RB ppe51 Variants Enable Growth of Mycobacterium tuberculosis at Acidic pH by Selectively Promoting Glycerol Uptake. J Bacteriol, e0021222 (2022). [DOI] [PMC free article] [PubMed] [Google Scholar]
- 31.Gopal P et al. Pyrazinamide Resistance Is Caused by Two Distinct Mechanisms: Prevention of Coenzyme A Depletion and Loss of Virulence Factor Synthesis. ACS Infect Dis 2, 616–626 (2016). [DOI] [PMC free article] [PubMed] [Google Scholar]
- 32.Orsi RH, Bowen BM & Wiedmann M Homopolymeric tracts represent a general regulatory mechanism in prokaryotes. BMC Genomics 11, 102 (2010). [DOI] [PMC free article] [PubMed] [Google Scholar]
- 33.Mizrahi V & Andersen SJ DNA repair in Mycobacterium tuberculosis. What have we learnt from the genome sequence? Mol Microbiol 29, 1331–1339 (1998). [DOI] [PubMed] [Google Scholar]
- 34.Dolan SK et al. Loving the poison: the methylcitrate cycle and bacterial pathogenesis. Microbiology (Reading) 164, 251–259 (2018). [DOI] [PubMed] [Google Scholar]
- 35.Munoz-Elias EJ, Upton AM, Cherian J & McKinney JD Role of the methylcitrate cycle in Mycobacterium tuberculosis metabolism, intracellular growth, and virulence. Mol Microbiol 60, 1109–1122 (2006). [DOI] [PubMed] [Google Scholar]
- 36.Lee W, VanderVen BC, Fahey RJ & Russell DG Intracellular Mycobacterium tuberculosis exploits host-derived fatty acids to limit metabolic stress. J Biol Chem 288, 6788–6800 (2013). [DOI] [PMC free article] [PubMed] [Google Scholar]
- 37.Singh A et al. Mycobacterium tuberculosis WhiB3 maintains redox homeostasis by regulating virulence lipid anabolism to modulate macrophage response. PLoS Pathog 5, e1000545 (2009). [DOI] [PMC free article] [PubMed] [Google Scholar]
- 38.Lu R et al. Catabolism of the Cholesterol Side Chain in Mycobacterium tuberculosis Is Controlled by a Redox-Sensitive Thiol Switch. ACS Infect Dis 3, 666–675 (2017). [DOI] [PMC free article] [PubMed] [Google Scholar]
- 39.Eoh H & Rhee KY Methylcitrate cycle defines the bactericidal essentiality of isocitrate lyase for survival of Mycobacterium tuberculosis on fatty acids. Proc Natl Acad Sci U S A 111, 4976–4981 (2014). [DOI] [PMC free article] [PubMed] [Google Scholar]
- 40.Dulberger CL, Rubin EJ & Boutte CC The mycobacterial cell envelope - a moving target. Nat Rev Microbiol 18, 47–59 (2020). [DOI] [PubMed] [Google Scholar]
- 41.Marrero J, Rhee KY, Schnappinger D, Pethe K & Ehrt S Gluconeogenic carbon flow of tricarboxylic acid cycle intermediates is critical for Mycobacterium tuberculosis to establish and maintain infection. Proc Natl Acad Sci U S A 107, 9819–9824 (2010). [DOI] [PMC free article] [PubMed] [Google Scholar]
- 42.Block AM et al. Mycobacterium tuberculosis Requires the Outer Membrane Lipid Phthiocerol Dimycocerosate for Starvation-Induced Antibiotic Tolerance. mSystems 8, e0069922 (2023). [DOI] [PMC free article] [PubMed] [Google Scholar]
- 43.Maksymiuk C et al. Comparison of transposon and deletion mutants in Mycobacterium tuberculosis: The case of rv1248c, encoding 2-hydroxy-3-oxoadipate synthase. Tuberculosis (Edinb) 95, 689–694 (2015). [DOI] [PMC free article] [PubMed] [Google Scholar]
- 44.Chen JM, Islam ST, Ren H & Liu J Differential productions of lipid virulence factors among BCG vaccine strains and implications on BCG safety. Vaccine 25, 8114–8122 (2007). [DOI] [PubMed] [Google Scholar]
- 45.Bloch H & Segal W Biochemical differentiation of Mycobacterium tuberculosis grown in vivo and in vitro. J Bacteriol 72, 132–141 (1956). [DOI] [PMC free article] [PubMed] [Google Scholar]
- 46.Babunovic GH et al. CRISPR Interference Reveals That All-Trans-Retinoic Acid Promotes Macrophage Control of Mycobacterium tuberculosis by Limiting Bacterial Access to Cholesterol and Propionyl Coenzyme A . mBio 13, e0368321 (2022). [DOI] [PMC free article] [PubMed] [Google Scholar]
- 47.Dubos RJ & Middlebrook G Media for tubercle bacilli. Am Rev Tuberc 56, 334–345 (1947). [PubMed] [Google Scholar]
- 48.Dubos RJ Rapid and submerged growth of mycobacteria in liquid media. Proc Soc Exp Biol Med 58, 361–362 (1945). [Google Scholar]
- 49.Li S et al. CRISPRi chemical genetics and comparative genomics identify genes mediating drug potency in Mycobacterium tuberculosis. Nat Microbiol 7, 766–779 (2022). [DOI] [PMC free article] [PubMed] [Google Scholar]
- 50.Xu W et al. Chemical Genetic Interaction Profiling Reveals Determinants of Intrinsic Antibiotic Resistance in Mycobacterium tuberculosis. Antimicrob Agents Chemother 61 (2017). [DOI] [PMC free article] [PubMed] [Google Scholar]
- 51.Chengalroyen MD et al. DNA-Dependent Binding of Nargenicin to DnaE1 Inhibits Replication in Mycobacterium tuberculosis. ACS Infect Dis 8, 612–625 (2022). [DOI] [PMC free article] [PubMed] [Google Scholar]
- 52.Wang Q & Boshoff HI M. Determining Minimum Inhibitory Concentrations in Liquid Cultures or on Solid Medium. Methods Mol Biol 2314, 595–609 (2021). [DOI] [PMC free article] [PubMed] [Google Scholar]
- 53.Chandra P, Grigsby SJ & Philips JA Immune evasion and provocation by Mycobacterium tuberculosis. Nat Rev Microbiol 20, 750–766 (2022). [DOI] [PMC free article] [PubMed] [Google Scholar]
- 54.DeJesus MA et al. Comprehensive Essentiality Analysis of the Mycobacterium tuberculosis Genome via Saturating Transposon Mutagenesis. mBio 8 (2017). [DOI] [PMC free article] [PubMed] [Google Scholar]
- 55.Bosch B et al. Genome-wide gene expression tuning reveals diverse vulnerabilities of M. tuberculosis. Cell 184, 4579–4592 e4524 (2021). [DOI] [PMC free article] [PubMed] [Google Scholar]
- 56.Zhang YJ et al. Tryptophan biosynthesis protects mycobacteria from CD4 T-cell-mediated killing. Cell 155, 1296–1308 (2013). [DOI] [PMC free article] [PubMed] [Google Scholar]
- 57.Stover CK et al. New use of BCG for recombinant vaccines. Nature 351, 456–460 (1991). [DOI] [PubMed] [Google Scholar]
- 58.Schneider CA, Rasband WS & Eliceiri KW NIH Image to ImageJ: 25 years of image analysis. Nat Methods 9, 671–675 (2012). [DOI] [PMC free article] [PubMed] [Google Scholar]
- 59.Dai Y & Hsiao JJ Discovery Metabolomics LC/MS Methods Optimized for Polar Metabolites. Application note, Agilent Technologies, Inc (2019). [Google Scholar]
- 60.National Research Council of the National Academies. Guide for the Care and Use of Laboratory Animals: Eighth Edition. (National Academies Press, 2011). [Google Scholar]
- 61.Wilson K Preparation of genomic DNA from bacteria. Curr Protoc Mol Biol 56, 2.4.1–2.4.5 (2001). [DOI] [PubMed] [Google Scholar]
- 62.Bolger AM, Lohse M & Usadel B Trimmomatic: a flexible trimmer for Illumina sequence data. Bioinformatics 30, 2114–2120 (2014). [DOI] [PMC free article] [PubMed] [Google Scholar]
- 63.Danecek P et al. Twelve years of SAMtools and BCFtools. Gigascience 10 (2021). [DOI] [PMC free article] [PubMed] [Google Scholar]
- 64.DePristo MA et al. A framework for variation discovery and genotyping using next-generation DNA sequencing data. Nat Genet 43, 491–498 (2011). [DOI] [PMC free article] [PubMed] [Google Scholar]
- 65.Okonechnikov K, Conesa A & Garcia-Alcalde F Qualimap 2: advanced multi-sample quality control for high-throughput sequencing data. Bioinformatics 32, 292–294 (2016). [DOI] [PMC free article] [PubMed] [Google Scholar]
- 66.Walker BJ et al. Pilon: an integrated tool for comprehensive microbial variant detection and genome assembly improvement. PLoS One 9, e112963 (2014). [DOI] [PMC free article] [PubMed] [Google Scholar]
- 67.Cingolani P et al. A program for annotating and predicting the effects of single nucleotide polymorphisms, SnpEff: SNPs in the genome of Drosophila melanogaster strain w1118; iso-2; iso-3. Fly (Austin) 6, 80–92 (2012). [DOI] [PMC free article] [PubMed] [Google Scholar]
- 68.Sambandamurthy VK et al. Mycobacterium tuberculosis DeltaRD1 DeltapanCD: a safe and limited replicating mutant strain that protects immunocompetent and immunocompromised mice against experimental tuberculosis. Vaccine 24, 6309–6320 (2006). [DOI] [PubMed] [Google Scholar]
- 69.Jain P et al. phi(2)GFP10, a high-intensity fluorophage, enables detection and rapid drug susceptibility testing of Mycobacterium tuberculosis directly from sputum samples. J Clin Microbiol 50, 1362–1369 (2012). [DOI] [PMC free article] [PubMed] [Google Scholar]
- 70.Vilcheze C et al. Rational Design of Biosafety Level 2-Approved, Multidrug-Resistant Strains of Mycobacterium tuberculosis through Nutrient Auxotrophy. mBio 9 (2018). [DOI] [PMC free article] [PubMed] [Google Scholar]
- 71.Jacobs WR Jr. & Tiwari S Double auxotrophic and uses thereof. U.S. patent 11666648 (2023). [Google Scholar]
Associated Data
This section collects any data citations, data availability statements, or supplementary materials included in this article.
Supplementary Materials
Data Availability Statement
Whole genome sequence data have been deposited in the NCBI Sequence Read Archive (SRA) under the BioProject accession number PRJNA923717. A complete list of strains sequenced in this study and SRA accession numbers are given in Supplementary Table 11. Raw metabolomics data are provided as a supplementary data file (Supplementary Data 1). Source data are provided for all Figures and Extended Data Figures.


