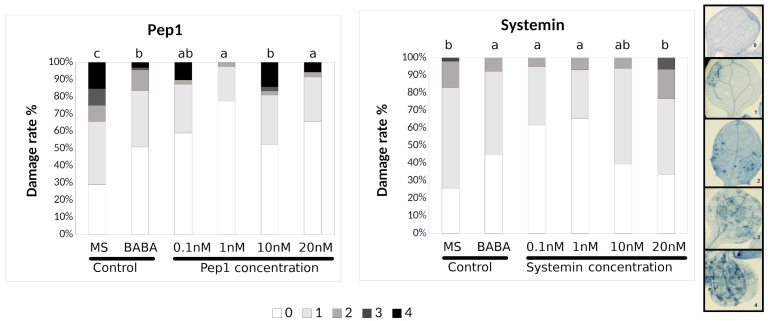
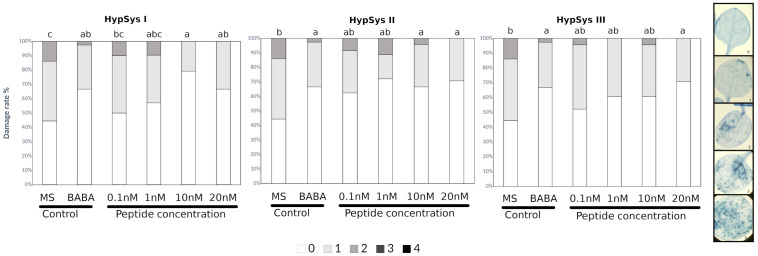
In the published article, in Figures 1 and 2 as well as Supplementary Figures 1, 2 and 3 the picture legend on the right side of the figures shows an example of the % of damage in the leaves. We have updated the independent scale of diseased leaves for Figures 1 and 2 and we have deleted the scale legend in the Supplementary Figures 1, 2 and 3. The corrected legend appears now in the updated Figures 1 and 2 below, and in the Supplementary Material in the original files.
Figure 1.
Pep1 and Systemin induced-resistance assays against Plectosphaerella cucumerina in Arabidopsis plants. Infection levels 5 days after inoculation quantified by a disease rating in trypan blue stained leaves, measured as a percentage of the infected leaf surface. Arabidopsis Col-0 plants were treated with increasing concentrations of Pep1 or Systemin (0.1, 1, 10, and 20 nM) 24 h before infection with 1 μl droplets of 5 × 10E3 spores/ml of P. cucumerina BMM. ß-amino butyric acid (BABA) at 1 ppm was used as a positive control. Colors mean % of diseased leaves in a scale (0 = healthy leaves; 1 = leaves with less than 25% of diseased surface; 2 = leaves with 25–50%; 3 = leaves with 50–75% of the diseased surface, 4 = leaves with more than 75% of the surface diseased). Different letters indicate statistically significant differences (ANOVA, Fisher’s Least Significant Difference (LSD) test; P < 0.05, n = 24). The experiment had 6 plants per treatment and was repeated at least three times with similar results.
Figure 2.
HypSys peptides induced-resistance assays against Plectosphaerella cucumerina in Arabidopsis plants. Infection levels 5 days after inoculation quantified by a disease rating in trypan blue stained leaves, measured as a percentage of the infected leaf surface. Arabidopsis Col-0 plants were treated with increasing concentrations of HypSysI, HypSysII, and HypSysII (0.1, 1, 10, and 20 nM) 24 h before infection with 1 μl droplets of 5 × 10E3 spores/ml of P. cucumerina BMM. ß-amino butyric acid (BABA) at 1 ppm was used as a positive control. Colors mean % of diseased leaves in a scale (0 = healthy leaves; 1 = leaves with less than 25% of diseased surface; 2 = leaves with 25–50%; 3 = leaves with 50–75% of the diseased surface, 4 = leaves with more than 75% of the surface diseased). Different letters indicate statistically significant differences (ANOVA, Fisher’s Least Significant Difference (LSD) test; P < 0.05, n = 24). The experiment had 6 plants per treatment and was repeated at least three times with similar results.
The authors apologize for this error and state that this does not change the scientific conclusions of the article in any way. The original article has been updated.
Publisher’s note
All claims expressed in this article are solely those of the authors and do not necessarily represent those of their affiliated organizations, or those of the publisher, the editors and the reviewers. Any product that may be evaluated in this article, or claim that may be made by its manufacturer, is not guaranteed or endorsed by the publisher.


