Abstract
Objectives
To validate a novel stepwise strategy in which computed tomography–derived fractional flow reserve (FFRCT) is restricted to intermediate stenosis on coronary computed tomography angiography (CCTA) and computed tomography myocardial perfusion imaging (CT-MPI) was reserved for vessels with gray zone FFRCT values.
Materials and methods
This retrospective study included 87 consecutive patients (age, 58 ± 10 years; 70% male) who underwent CCTA, dynamic CT-MPI, interventional coronary angiography (ICA), and fractional flow reserve (FFR) for suspected or known coronary artery disease. FFRCT was computed using a deep learning–based platform. Three stepwise strategies (CCTA + FFRCT + CT-MPI, CCTA + FFRCT, CCTA + CT-MPI) were constructed and their diagnostic performance was evaluated using ICA/FFR as the reference standard. The proportions of vessels requiring further ICA/FFR measurement based on different strategies were noted. Furthermore, the net reclassification index (NRI) was calculated to ascertain the superior model.
Results
The CCTA + FFRCT + CT-MPI strategy yielded the lowest proportion of vessels requiring additional ICA/FFR measurement when compared to the CCTA + FFRCT and CCTA + CT-MPI strategies (12%, 22%, and 24%). The CCTA + FFRCT + CT-MPI strategy exhibited the highest accuracy for ruling-out (91%, 84%, and 85%) and ruling-in (90%, 85%, and 85%) functionally significant lesions. All strategies exhibited comparable sensitivity for ruling-out functionally significant lesions and specificity for ruling-in functionally significant lesions (p > 0.05). The NRI indicated that the CCTA + FFRCT + CT-MPI strategy outperformed the CCTA + FFRCT strategy (NRI = 0.238, p < 0.001) and the CCTA + CT-MPI strategy (NRI = 0.233%, p < 0.001).
Conclusions
The CCTA + FFRCT + CT-MPI stepwise strategy was superior to the CCTA + FFRCT strategy and CCTA+ CT-MPI strategy by minimizing unnecessary invasive diagnostic catheterization without compromising the agreement rate with ICA/FFR.
Clinical relevance statement
Our novel stepwise strategy facilitates greater confidence and accuracy when clinicians need to decide on interventional coronary angiography referral or deferral, reducing the burden of invasive investigations on patients.
Key Points
• A stepwise CCTA + FFR CT + CT-MPI strategy holds promise as a viable method to reduce the need for invasive diagnostic catheterization, while maintaining a high level of agreement with ICA/FFR.
• The CCTA + FFR CT + CT-MPI strategy performed better than the CCTA + FFR CT and CCTA + CT-MPI strategies.
• A stepwise CCTA + FFR CT + CT-MPI strategy allows to minimize unnecessary invasive diagnostic catheterization and helps clinicians to referral or deferral for ICA/FFR with more confidence.
Supplementary Information
The online version contains supplementary material available at 10.1007/s00330-023-10562-x.
Keywords: Coronary artery disease, Computed tomography myocardial perfusion imaging, Myocardial blood flow, Computed tomography–derived flow fractional reserve, Stepwise strategy
Introduction
Accurate diagnostic tests are prerequisite for identifying patients suitable for revascularization. Fractional flow reserve (FFR) is the gold standard for guiding revascularization [1, 2]. However, the use of FFR remains low due to its invasive nature and prohibitive costs [3, 4]. Guidelines recommend noninvasive testing for patients with suspected myocardial ischemia before invasive procedures [5–7].
Coronary computed tomography angiography (CCTA) has become a robust tool in ruling-out coronary artery disease (CAD) given its high negative predictive value (NPV) [8–11]. Recently, updated guidelines recommend CCTA as the first-line test for patients with suspected CAD [5–7]. However, CCTA cannot assess the physiological significance of coronary artery stenosis. Hence, computed tomography–derived fractional flow reserve (FFRCT) and computed tomography myocardial perfusion imaging (CT-MPI) have been introduced as novel functional imaging tools to overcome the inherent CCTA drawbacks.
Benefiting from the fact that it can compute from standard CCTA images without requiring additional image acquisition or vasodilator application, FFRCT holds the potential to be the first choice for hemodynamic assessment after CCTA. Moreover, on-site FFRCT (machine learning– or deep learning–based algorithms) computation requires only several minutes, and has shown good agreement with invasive FFR and HeartFlow FFRCT [12, 13]. Multicenter clinical trials have confirmed that FFRCT can improve the accuracy of diagnosis for vessel-specific ischemia [14–17], and reduce the need for further noninvasive and invasive testing [17, 18]. However, several unresolved issues for clinical implementation of FFRCT persist. Several studies confirmed that the accuracy of FFRCT is disturbingly low (46 to 68%) within a gray zone (approximately 0.80), and the proportion of patients exhibiting such gray zone FFRCT values is non-trivial [19–22]. Despite those facts, few studies have addressed how to deal with such ambiguous situation when the FFRCT value fell within the gray zone in clinical practice. Additionally, meta-analyses and reviews based on HeartFlow FFRCT and reduced-order computational fluid dynamic–based FFRCT have reported FFRCT gray zone ranges of 0.74–0.82 and 0.75–0.84 [21, 23]. Currently, there is no report on the gray zone of deep learning–based FFRCT.
CT-MPI showed comparable diagnostic accuracy to that of FFRCT in detecting vessel-specific ischemia [22, 24]. CCTA + CT-MPI–guided patient management is a promising approach for reducing unnecessary invasive procedures [25]. However, CT-MPI is time-consuming and requires additional radiation exposure and contrast agent. The place of CT-MPI in the diagnostic workflow of CAD remains to be discussed.
Based on the above evidence, we here proposed a CCTA + FFRCT + CT-MPI stepwise strategy, in which FFRCT was performed only in intermediate coronary stenosis on CCTA, and CT-MPI was subsequently used to identify vessel-specific ischemia when FFRCT values fell within the gray zone. This stepwise strategy is potentially to provide a solution for FFRCT “gray zone.” Therefore, we hypothesized that the CCTA + FFRCT + CT-MPI stepwise strategy would be superior to the CCTA + FFRCT and CCTA + CT-MPI strategies by minimizing unnecessary invasive procedures.
Materials and methods
Study population
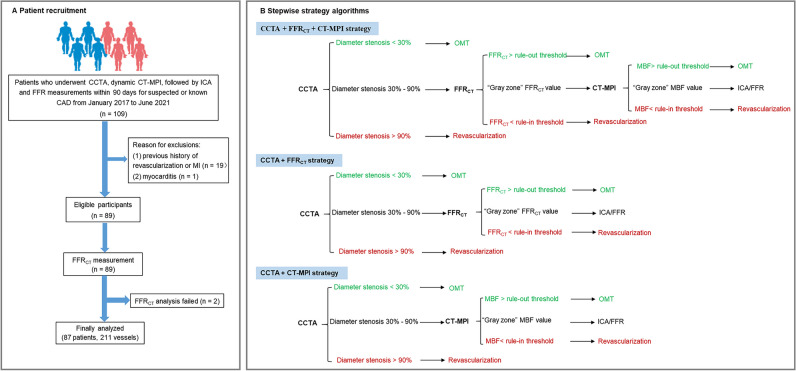
This study complies with the Declaration of Helsinki. The study protocol was approved by the local hospital ethical committees. We retrospectively enrolled 87 consecutive patients with suspected or known CAD from a single center between January 2017 and June 2021. The inclusion criteria were as follows: (1) patients with suspected or known CAD who underwent CCTA, stress dynamic CT-MPI, and FFRCT ≤ 90 days before interventional coronary angiography (ICA); (2) clinically indicated ICA was performed according to current clinical standards and guidelines, regardless of CT-MPI and FFRCT findings; (3) availability of complete imaging and clinical data. The exclusion criteria included the following: (1) low pre-test likelihood of CAD (< 15%); (2) previous history of coronary revascularization or myocardial infarction; (3) acute coronary syndrome or clinical instability; (4) nonischemic cardiomyopathy; (5) atrial fibrillation; (6) nondiagnostic CT image quality. Fig. 1A shows the flow diagram of the study.
Fig. 1.
A, B Flowchart of patient recruitment and stepwise strategy algorithms. CAD, coronary artery disease; CCTA, coronary computed tomography angiography; CT-MPI, computed tomography myocardial perfusion imaging; FFRCT, computed tomography–derived flow fractional reserve; FFR, fractional flow reserve; ICA, invasive coronary angiography; MI, myocardial infarction; OMT, optimal medical treatment
CCTA and CT-MPI protocol
All participants were tested with a comprehensive protocol integrating CCTA and dynamic CT-MPI by using a third-generation dual-source computed tomography scanner (SOMATOM Force; Siemens). The detailed protocol and scan parameters are provided in the Supplemental Methods. In brief, dynamic CT-MPI was started after a 3-min continuous adenosine infusion at a rate of 140 µg/kg/min. Dynamic CT-MPI images were acquired in the end-systolic phase in shuttle mode. Nitroglycerin was given sublingually to all participants 5 min after CT-MPI. Subsequently, a bolus of contrast media was injected into the antecubital vein at a rate of 4–5 mL/s. CCTA image was acquired using the retrospective electrocardiography-triggered acquisition mode. Using a constant conversion coefficient of 0.026 [26], the effective radiation dose was 13.79 (11.31–16.29) mSv for CCTA and 7.74 (5.70–9.30) mSv for dynamic CT-MPI.
CCTA and CT-MPI analysis
The details of CCTA and CT-MPI image analysis are provided in the Supplemental Methods. All the CCTA and CT-MPI images were evaluated by independent readers who were blinded to other examination results and clinical information. The CCTA images were independently analyzed on an offline workstation (Syngo Via, Siemens) by two experienced radiologists. Segmental analysis of the coronary arteries was performed for arteries > 1.5 mm in diameter. The degree of stenosis was reported as the percentage decrease in lumen diameter.
The CT-MPI images were processed with the CT-MPI software package (VPCT, Siemens). Quantification of myocardial blood flow (MBF) was performed using a hybrid deconvolution model, as previously reported [22]. To calculate the MBF, a region of interest (ROI) was manually placed on a short-axis view on a per-segment basis according to the American Heart Association (AHA) 17-segment model [27].
Machine learning–based FFRCT assessments
FFRCT were calculated using commercially available software (DEEPVESSEL FFR, Keya Medical), which was based on machine learning (ML) methods that trained using a deep learning framework. Details of the FFRCT algorithm are provided in the Supplemental Methods. Computation of FFRCT was performed in a blinded manner by the core laboratory of Keya Medical. FFRCT results were returned to researchers for blinded analysis. Clinicians were blinded to FFRCT results so as not to interfere with decision-making. The lesion-specific FFRCT values were measured 20 mm distal to the stenosis. For multiple lesions of the same vessel, the lesion with the lowest FFRCT value was recorded.
ICA and invasive FFR assessments
ICA was performed with standard methods. All coronary arteries and main branches were evaluated by two interventional cardiologists. Lesions with luminal stenosis between 30 and 90% were referred for invasive FFR measurements. During steady-state hyperemia, FFR was measured using a 0.014-inch pressure guidewire (Prime Wire Prestige PLUS, Volcano Corporation). Hyperemia was induced by an intravenous infusion of adenosine at 140 mg/kg/min. Functionally ischemic lesions were defined as lesions with more than 90% stenosis or an FFR ≤ 0.80. Nonischemic lesions were defined as lesions with less than 30% stenosis or an FFR > 0.80.
“Gray zone”for FFRCT and MBF
Gray zone thresholds for FFRCT and MBF were calculated through receiver-operating characteristic (ROC) analysis. The rule-out threshold was derived from a predefined NPV > 95% and rule-in threshold from a predefined positive predictive value (PPV) > 95% for the gold standard diagnosis of functional ischemia. The “gray zone” was defined as values between the rule-in and rule-out thresholds.
CCTA + FFRCT + CT-MPI stepwise strategy
As shown in Fig. 1B, if all coronary stenoses were < 30% on CCTA, optimal medical treatment (OMT) was indicated; while if at least one coronary stenosis was > 90%, ICA and revascularization were indicated. FFRCT was indicated if at least one coronary stenosis was between 30 and 90% on CCTA. Further triage will follow FFRCT: (a) FFRCT > the rule-out threshold, OMT was indicated; (b) FFRCT < the rule-in threshold, revascularization was indicated; (c) FFRCT fell within the “gray zone,” CT-MPI was indicated before invasive assessment. Triage was based on CT-MPI: (a) MBF > the rule-out threshold, OMT was indicated; (b) MBF < the rule-in threshold, revascularization was indicated; (c) MBF fell within the “gray zone,” invasive assessment was indicated before revascularization.
CCTA + FFRCT and CCTA + CT-MPI stepwise strategy
CCTA + FFRCT and CCTA + CT-MPI strategies were similar to the diagnostic algorithm proposed by Hecht et al [26]. As depicted in Fig. 1B, OMT was prescribed in cases with all coronary stenoses < 30% and revascularization was prescribed in cases with at least one coronary stenosis > 90%. When at least one coronary stenosis was between 30 and 90%, FFRCT (or CT-MPI) was prescribed. OMT was indicated for cases with FFRCT (or MBF) > the rule-out threshold, and revascularization was indicated for cases with FFRCT (or MBF) < the rule-out threshold. Invasive FFR was indicated before revascularization if FFRCT (or MBF) fell within the “gray zone.”
Statistical analysis
Normality of the data distribution was tested by the Kolmogorov–Smirnov test. Normally distributed continuous variables are described as mean ± standard deviation and were compared using Student’s t-test. Non-normally distributed continuous variables are described as medians (interquartile range [IQR]) and compared using the Mann–Whitney U test. Categorical variables were described as number (proportion) and were compared using the χ2 test or Fisher’s exact test. Correlation between FFRCT and invasive FFR was evaluated using Spearman’s correlation coefficients, and the agreement between FFRCT and invasive FFR was assessed by a Bland–Altman plot. For the stepwise strategy, the sensitivity, specificity, PPV, and NPV were calculated using two approaches: (i) rule-out approach of considering both the gray zone and ischemia categories as “positive,” and (ii) rule-in approach of considering only the ischemia category as “positive.” ROC curve analysis was performed for each stepwise strategy using ICA/FFR as the reference standard, and the area under ROC curve (AUC) and partial AUC were used to evaluate the performance of each strategy based on the rule-in and rule-out criteria. AUCs were compared using the Delong test. The net reclassification improvement (NRI) was calculated to ascertain the superior model [28, 29]. The 95% confidence intervals of the NRI were estimated by bootstrapping with 1000 iterations.
A two-sided p < 0.05 was considered statistically significant. Statistical analyses were performed using the MedCalc software package (MedCalc 15.2.0) and R (R statistics), version 4.0.4.
Results
Baseline characteristics
A total of 87 patients (age, 58 ± 10 years; 70% male) with 211 vessels were included in the study (Fig. 1A; Table 1). Seventy-nine vessels (37%) were identified as hemodynamically significant by ICA/FFR.
Table 1.
Baseline characteristics of the study population
| Parameter | |
|---|---|
| Number of patients, n | 87 |
| Number of vessels, n | 211 |
| LAD, n (%) | 70 (33) |
| LCX, n (%) | 70 (33) |
| RCA, n (%) | 71 (34) |
| Age, years (mean ± SD) | 58.1 ± 9.7 |
| Male gender (%) | 61 (70) |
| BMI, kg/m2 (mean ± SD) | 26.0 ± 2.9 |
| Coronary risk factors | |
| Hypertension, n (%) | 60 (69) |
| Dyslipidemia, n (%) | 78 (90) |
| Diabetes, n (%) | 18 (21) |
| Smoking, n (%) | 48 (55) |
| Family history of CAD, n (%) | 16 (18) |
| Pre-test likelihood of CAD (%) † | |
| 15–65, n (%) | 50 (57) |
| 65–85, n (%) | 34 (39) |
| > 85, n (%) | 3 (3) |
| Diameter stenosis by CCTA (%) | |
| < 30, n (%) | 76 (36) |
| 30–90, n (%) | 119 (56) |
| ≥ 90, n (%) | 16 (8) |
| Prevalence of obstructive CAD (≥ 50%) at ICA | |
| No disease, n (%) | 16 (18) |
| 1-vessel disease, n (%) | 39 (45) |
| 2-vessel disease, n (%) | 17 (20) |
| 3-vessel disease, n (%) | 15 (17) |
| Patients, n (%) | 71 (82) |
| Functionally Ischemic vessels* | 79 (37) |
SD, standard deviations; BMI, body mass index; CAD, coronary artery disease; CCTA, coronary computed tomography angiography; ICA, invasive coronary angiography; LAD, left anterior descending coronary artery; LCX, left circumflex coronary artery; RCA, right coronary artery. †Calculated by using the Diamond and Forrester Chest Pain Prediction Rule. *Diameter stenosis > 90% by ICA or invasive FFR < 0.8 in intermediate stenosis of 30 to 90%
Characteristics of FFRCT and dynamic CT-MPI
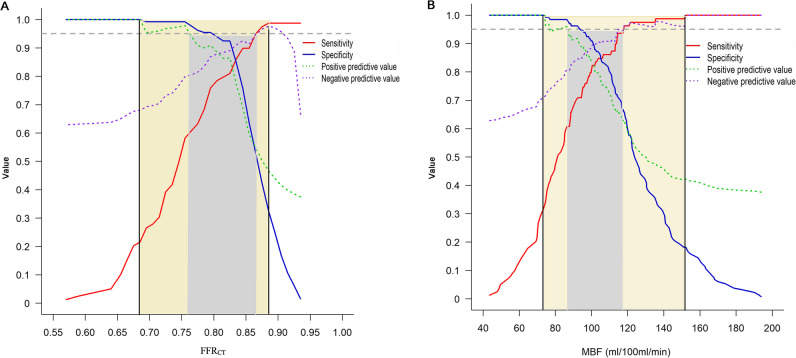
In the per-vessel analysis, for each imaging modality, the highest frequency of false-positive and false-negative cases was clustered around the cutoff value (Figure S1). For vessels with invasive FFR measurements, FFRCT was moderately correlated with FFR, with a Spearman correlation coefficient of 0.67 (95%CI 0.43 to 0.84; p < 0.001) (Supplementary Figure S2A). Bland–Altman plots showed slightly systematic overestimation of FFR by FFRCT with a mean difference of 0.03 (limits of agreement, − 0.20 to 0.26) (Supplementary Figure S2B). To achieve a PPV and NPV of at least 95% at each extreme, the gray zone of FFRCT and MBF values were 0.76–0.86 and 86–118 mL/100 mL/min, respectively (Fig. 2A, B).
Fig. 2.
Sensitivity, specificity, NPV, and PPV of FFRCT and MBF for prediction of functional ischemia. A To achieve a PPV and NPV of at least 95% at each extreme, the overall FFRCT range was restricted to ≤ 0.75 and > 0.87 (gray area). FFRCT values lower than 0.68 resulted in a PPV of 100%, and FFRCT values higher than 0.88 resulted in an NPV of 98% (yellow area). B With the threshold for PPV and NPV set at 95%, the MBF range was restricted to < 86 mL/100 mL/min and > 118 mL/100 mL/min (gray area). To achieve a PPV and NPV of 100% at each extreme, the MBF values were restricted to ≤ 74 mL/100 mL/min and > 152 mL/100 mL/min (yellow area). FFRCT, computed tomography–derived flow fractional reserve; MBF, myocardial blood flow; NPV, negative predictive value; PPV, positive predictive value
Diagnostic performance of the CCTA + FFRCT + CT-MPI stepwise strategy
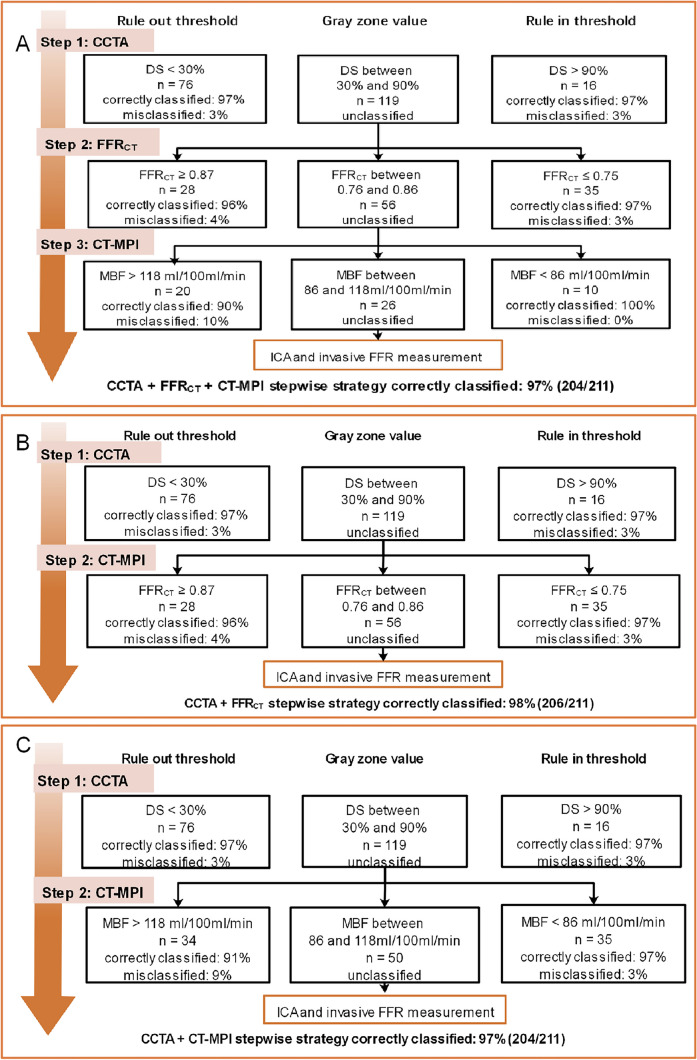
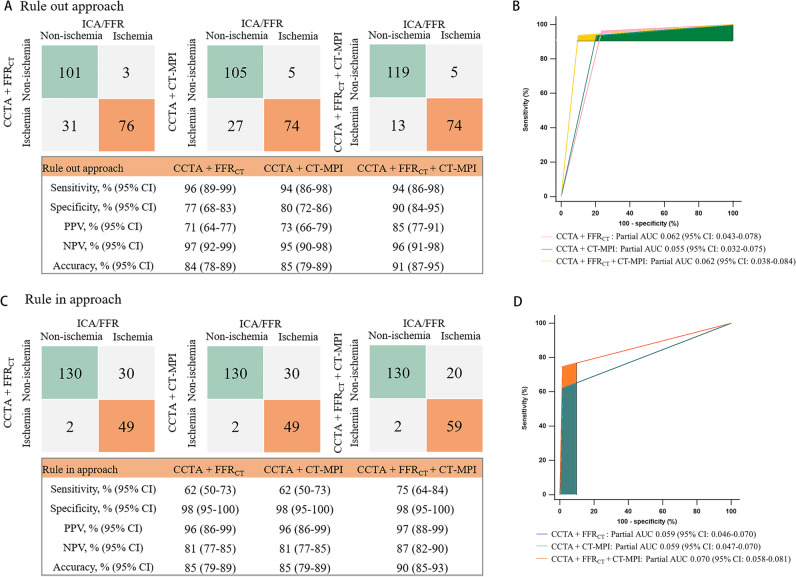
The CCTA + FFRCT + CT-MPI stepwise diagnostic algorithm is illustrated in Fig. 3A. The CCTA + FFRCT + CT-MPI stepwise strategy noninvasively diagnosed 88% (185/211) of the stenoses, leaving 12% (26/211) of vessels referring for ICA/FFR. Overall, the diagnostic accuracy was 97% (204/211). For the rule-out approach, the sensitivity and NPV were 94% (95%CI 86–98%) and 96% (95%CI 91–98%), respectively (Fig. 4A). For the rule-in approach, the specificity and PPV were 98% (95%CI 95–100%) and 97% (95%CI 88–99%), respectively (Fig. 4C). This stepwise CCTA + FFRCT + CT-MPI algorithm theoretically avoided invasive FFR measurement in 78% (93/119) of vessels and avoided CT-MPI examinations in 53% (63/119) of vessels.
Fig. 3.
A–C Algorithm flowchart of the stepwise strategy. CCTA, coronary computed tomography angiography; CT-MPI, computed tomography myocardial perfusion imaging; DS, diameter stenosis; FFRCT, computed tomography–derived flow fractional reserve; FFR, fractional flow reserve; ICA, invasive coronary angiography
Fig. 4.
Comparison of diagnostic ability of stepwise strategies for ruling-out and ruling-in functional ischemia. A, B Confusion matrix and partial AUC of stepwise strategies for ruling-out functional ischemia. C, D Confusion matrix and partial AUC of stepwise strategies for ruling-in functional ischemia. AUC, area under the receiver-operating characteristic curve; CCTA, coronary computed tomography angiography; CT-MPI, computed tomography myocardial perfusion imaging; FFRCT, computed tomography–derived flow fractional reserve; ICA, invasive coronary angiography; FFR, fractional flow reserve; FN, false negative; FP, false positive; TN, true negative; TP, true positive; NPV, negative predictive value; PPV, positive predictive value
Diagnostic performance of the CCTA + FFRCT strategy
The stepwise CCTA + FFRCT strategy (Fig. 3B) diagnosed 73% (155/211) of the vessels. Twenty-seven percent (56/211) of the vessels with gray zone FFRCT values would require invasive FFR measurement. Overall, the accuracy was 98%. This stepwise approach theoretically avoided invasive FFR examinations in 53% (63/119) of cases.
Diagnostic performance of the CCTA + CT-MPI strategy
The stepwise CCTA + CT-MPI strategy (Fig. 3C) could identify 76% (161/211) of vessels noninvasively. Twenty-four percent (50/211) of the vessels with gray zone MBF values are needed for further invasive FFR measurement. The overall accuracy was 97%. This stepwise algorithm avoided invasive FFR examinations in 58% (69/119) of cases.
Comparison of CCTA + FFRCT, CCTA + CT-MPI, and CCTA + FFRCT + CT-MPI stepwise strategy
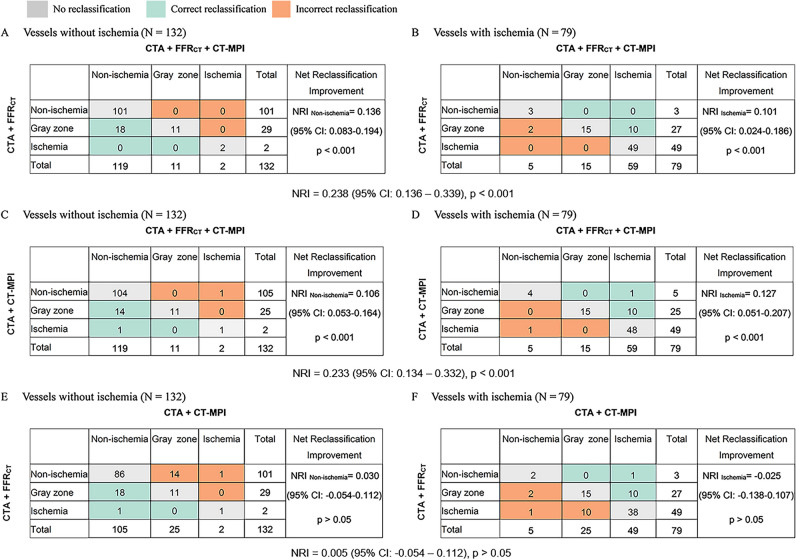
The CCTA + FFRCT + CT-MPI strategy yielded a higher partial AUC for ruling-in functionally significant lesions than did the CCTA + FFRCT and CCTA + CT-MPI strategies (0.070 [95%CI 0.058–0.081] vs. 0.059 [95%CI 0.046–0.070] vs. 0.059 [95%CI 0.047–0.070], p > 0.05) (Fig. 4B). However, the partial AUC did not differ among the ruling-out approach (Fig. 4D). The stepwise CCTA + FFRCT + CT-MPI strategy was superior to CCTA + FFRCT, with an NRI of 0.238 (NRI non-ischemia + 0.136, NRI ischemia + 0.101; p < 0.001) (Fig. 5A, B), and CCTA + CT-MPI, with an NRI of 0.233 (NRI non-ischemia + 0.106, NRI ischemia + 0.127; p < 0.001) (Fig. 5C, D). The NRI between the CCTA + FFRCT and CCTA + CT-MPI strategies was not statistically significant (Fig. 5E, F).
Fig. 5.
Net reclassification improvement. Reclassification tables: A, B CCTA + FFRCT + CT-MPI strategy vs CCTA + FFRCT strategy and (C, D) CCTA + FFRCT + CT-MPI strategy vs CCTA + CT-MPI strategy and (E, F) CCTA + CT-MPI strategy vs CCTA + FFRCT strategy. The numbers represent the counts of vessels assigned to the indicated risk category. CCTA, coronary computed tomography angiography; CT-MPI, computed tomography myocardial perfusion imaging; FFRCT, computed tomography–derived flow fractional reserve; NRI, net reclassification improvement
Sensitivity analyses
Two sensitivity analyses were performed to assess the versatility of the results: (1) The pre-specified algorithm was followed, but the definition of intermediate stenosis on CCTA was set at 40–90% according to the 2021 AHA chest pain guideline. (2) To assess the limitations of vendor-specific FFRCT analysis, sensitivity analysis was performed using a more universal, vendor-independent FFRCT gray zone range (0.75–0.85) based on the literature. Sensitivity analyses produced results basically consistent with main analysis results (Supplementary Table S1, Table S2, Fig. 3, Figure S4).
Discussion
In summary, a novel CCTA + FFRCT + CT-MPI stepwise strategy (Fig. 6) was validated with clinical patient data. We found that the CCTA + FFRCT + CT-MPI stepwise strategy was superior to the CCTA + FFRCT and CCTA + CT-MPI strategies by minimizing unnecessary invasive diagnostic catheterization without compromising the agreement rate with ICA/FFR. Moreover, the CCTA + FFRCT and CCTA + CT-MPI strategies exhibited comparable performance.
Fig. 6.
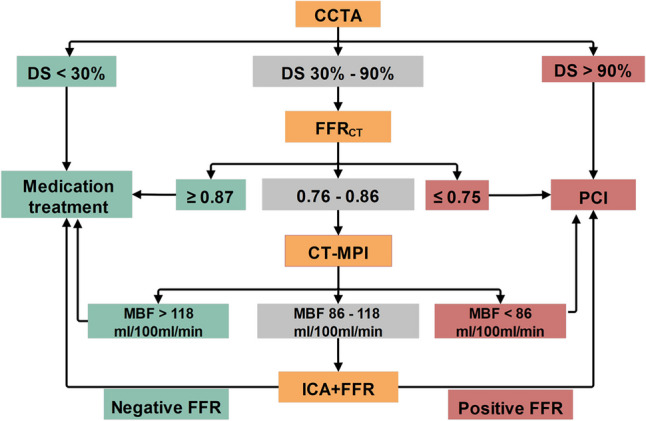
A stepwise strategy based on “one-stop” noninvasive imaging as a gatekeeper of cardiac catheterization. Green color indicates ICA could be delayed safely. Yellow color indicates revascularization is reasonable. Gray color indicates more information is need before revascularization. CCTA, coronary computed tomography angiography; CT-MPI, computed tomography myocardial perfusion imaging; DS, diameter stenosis; FFRCT, computed tomography–derived flow fractional reserve; FFR, fractional flow reserve; ICA, invasive coronary angiography; PCI, percutaneous coronary intervention
Our findings demonstrated a moderate correlation between FFRCT and invasive FFR (r = 0.69, p < 001), in accordance with previous studies [12–16]. On average, FFRCT exceeded invasive FFR by 0.03, indicating a low systematic error. Moreover, we reported an FFRCT gray zone of 0.76–0.86, which was generally consistent with that reported in previous studies. Two studies using machine learning–based software reported a FFRCT gray zone range of 0.74–0.85 and 0.74–0.87, respectively [19, 22]. Meta-analyses and reviews have documented more universal, vendor-independent FFRCT gray zone ranges of 0.74–0.82 and 0.75–0.84 [21, 23]. The above evidence may indicate that the concept of the FFRCT gray zone has good generalizability.
We found an MBF gray zone of 86–118 mL/100 mL/min, with an optimal cutoff value of 100 mL/100 mL/min. No literature has reported the gray zone value of MBF, but the cutoff value of MBF observed in our study aligns with previous findings [24, 30]. Of note, many factors contribute to the variability of MBF values, such as heterogeneity of included patients, type of CT scanner, and post-processing software. Accordingly, the range of MBF gray zone reported by our study may only be applicable to scenarios with similar patients and examination protocols.
Each strategy has advantages and disadvantages. Among the three stepwise strategies, the CCTA + FFRCT + CT-MPI stepwise strategy yielded fewer vessels requiring further invasive measurement (12%), whereas the other two strategies yielded similar larger proportions (27%, 24%). The CCTA + CT-MPI strategy was associated with the highest radiation exposure, contrast agent dose, and vasodilator application, whereas the advantage of the CCTA + FFRCT strategy is the no additional imaging acquisitions or administration of vasodilators. The additional time (including image acquisition and post-processing) and expense (including examination and medication cost) for FFRCT and CT-MPI are 5 min and 2000 RMB, and 25 min and 2250 RMB, respectively. As this was a retrospective study, we were unable to perform cost-effectiveness analysis. As is well known, ICA and FFR are associated with high radiation, contrast exposure, and costs. The CCTA + FFRCT + CT-MPI stepwise strategy could potentially improve cost-effectivity by minimizing the need for ICA/FFR.
Clinical implications
When confronted with CAD, clinicians have difficulty in making correct binary decisions when FFRCT or CT-MPI-derived MBF fell within gray zone threshold. We propose a novel stepwise strategy by which clinicians can better integrate FFRCT, CT-MPI, and CCTA. The CCTA + FFRCT + CT-MPI stepwise strategy exhibited high sensitivity, specificity, NPV, and PPV at each step, facilitating greater confidence and accuracy in ICA referral or deferral.
Limitations
Our study had several limitations. First, our findings are limited by the small cohort sizes and retrospective nature of the analysis in this single-center study. Second, a significant proportion of the participants included in the study exhibited a substantial burden of CAD. Our findings may not be applicable in patients with different prevalence of hemodynamically significant stenosis. Third, since invasive FFR was not performed in all vessels, we could not provide per-patient level analysis and cost-effective analysis. Our findings suggest potential avenues for future research. Further adequately powered prospective randomized studies will be required to validate the proposed stepwise strategy and to determine the cost‐effectiveness of this strategy.
Conclusions
A CCTA + FFRCT + CT-MPI stepwise strategy is superior to CCTA + FFRCT strategy and CCTA + CT-MPI strategy by minimizing unnecessary invasive diagnostic catheterization while maintaining high rate of agreement with ICA/FFR.
Supplementary Information
Below is the link to the electronic supplementary material.
Acknowledgements
This work was supported by the National Key Research and Development Program of China (2022YFC3602403 and 2016YFC1300302) and the Fundamental Research Funds of Shandong University (2018JC009) and the Non-profit Central Research Institute Fund of Chinese Academy of Medical Sciences (2023-PT320-06). The authors thank Dr. Chongqi Jia for his assistance in statistical analysis. We are grateful to American Journal Experts for professional English language editing support.
Abbreviations
- AUC
Area under the receiver-operating characteristic curve
- CAD
Coronary artery disease
- CCTA
Coronary computed tomography angiography
- CT-MPI
Computed tomography myocardial perfusion imaging
- FFR
Fractional flow reserve
- FFRCT
Computed tomography–derived flow fractional reserve
- ICA
Interventional coronary angiography
- MBF
Myocardial blood flow
- NPV
Negative predictive value
- OMT
Optimal medical treatment
- PPV
Positive predictive value
Funding
This study has received funding by Mei Zhang (2022YFC3602403 and 2016YFC1300300) and Pengfei Zhang (2018JC009).
Declarations
Guarantor
The scientific guarantor of this publication is Mei Zhang.
Conflict of interest
The authors of this manuscript declare no relationships with any companies, whose products or services may be related to the subject matter of the article.
Statistics and biometry
Dr. Chongqi Jia from Shandong University kindly provided statistical advice for this manuscript.
Informed consent
Written informed consent was obtained from all subjects (patients) in this study.
Ethical approval
Institutional Review Board approval form the Ethics Committee on Scientific Research of Shandong University Qilu Hospital was obtained.
Study subjects or cohorts overlap
No study subjects or cohorts have been previously reported.
Methodology
• retrospective
• diagnostic or prognostic study
• performed at one institution
Footnotes
Publisher's Note
Springer Nature remains neutral with regard to jurisdictional claims in published maps and institutional affiliations.
Mei Zhang and Pengfei Zhang contributed equally.
Contributor Information
Pengfei Zhang, Email: pengf-zhang@163.com.
Mei Zhang, Email: daixh@vip.sina.com.
References
- 1.Pijls NH, De Bruyne B, Peels K, et al. Measurement of fractional flow reserve to assess the functional severity of coronary-artery stenoses. N Engl J Med. 1996;334:1703–1708. doi: 10.1056/NEJM199606273342604. [DOI] [PubMed] [Google Scholar]
- 2.Xaplanteris P, Fournier S, Pijls NHJ, et al. Five-year outcomes with PCI guided by fractional flow reserve. N Engl J Med. 2018;379:250–259. doi: 10.1056/NEJMoa1803538. [DOI] [PubMed] [Google Scholar]
- 3.Härle T, Zeymer U, Hochadel M, et al. Real-world use of fractional flow reserve in Germany: results of the prospective ALKK coronary angiography and PCI registry. Clin Res Cardiol. 2017;106:140–150. doi: 10.1007/s00392-016-1034-5. [DOI] [PubMed] [Google Scholar]
- 4.Desai NR, Bradley SM, Parzynski CS, et al. Appropriate use criteria for coronary revascularization and trends in utilization, patient selection, and appropriateness of percutaneous coronary intervention. JAMA. 2015;314:2045–2053. doi: 10.1001/jama.2015.13764. [DOI] [PMC free article] [PubMed] [Google Scholar]
- 5.Knuuti J, Wijns W, Saraste A, et al. 2019 ESC Guidelines for the diagnosis and management of chronic coronary syndromes. Eur Heart J. 2020;41:407–477. doi: 10.1093/eurheartj/ehz425. [DOI] [PubMed] [Google Scholar]
- 6.National Institute for Health and Clinical Excellence (2016) Chest pain of recent onset: assessment and diagnosis of recent onset chest pain or discomfort of suspected cardiac origin (update). Clinical guideline 95. Available via https://www.nice.org.uk/guidance/cg95. (Accessed 24 Aug 2022)
- 7.Gulati M, Levy PD, Mukherjee D, et al. 2021 AHA/ACC/ASE/CHEST/SAEM/SCCT/SCMR Guideline for the evaluation and diagnosis of chest pain: executive summary: a report of the American College of Cardiology/American Heart Association Joint Committee on Clinical Practice Guidelines. Circulation. 2021;144:e368–e454. doi: 10.1161/CIR.0000000000001030. [DOI] [PubMed] [Google Scholar]
- 8.Budoff MJ, Dowe D, Jollis JG, et al. Diagnostic performance of 64-multidetector row coronary computed tomographic angiography for evaluation of coronary artery stenosis in individuals without known coronary artery disease: results from the prospective multicenter ACCURACY (Assessment by Coronary Computed Tomographic Angiography of Individuals Undergoing Invasive Coronary Angiography) trial. J Am Coll Cardiol. 2008;52:1724–1732. doi: 10.1016/j.jacc.2008.07.031. [DOI] [PubMed] [Google Scholar]
- 9.de Graaf FR, Schuijf JD, van Velzen JE, et al. Diagnostic accuracy of 320-row multidetector computed tomography coronary angiography in the non-invasive evaluation of significant coronary artery disease. Eur Heart J. 2010;31:1908–1915. doi: 10.1093/eurheartj/ehp571. [DOI] [PubMed] [Google Scholar]
- 10.Meijboom WB, Meijs MF, Schuijf JD, et al. Diagnostic accuracy of 64-slice computed tomography coronary angiography: a prospective, multicenter, multivendor study. J Am Coll Cardiol. 2008;52:2135–2144. doi: 10.1016/j.jacc.2008.08.058. [DOI] [PubMed] [Google Scholar]
- 11.Raff GL. Interpreting the evidence: how accurate is coronary computed tomography angiography? J Cardiovasc Comput Tomogr. 2007;1:73–77. doi: 10.1016/j.jcct.2007.04.014. [DOI] [PubMed] [Google Scholar]
- 12.Tesche C, De Cecco CN, Baumann S, et al. Coronary CT angiography-derived fractional flow reserve: machine learning algorithm versus computational fluid dynamics modeling. Radiology. 2018;288:64–72. doi: 10.1148/radiol.2018171291. [DOI] [PubMed] [Google Scholar]
- 13.Coenen A, Kim Y-H, Kruk M, et al. Diagnostic accuracy of a machine-learning approach to coronary computed tomographic angiography-based fractional flow reserve: result from the MACHINE Consortium. Circ Cardiovasc Imaging. 2018;11:e007217. doi: 10.1161/CIRCIMAGING.117.007217. [DOI] [PubMed] [Google Scholar]
- 14.Nørgaard BL, Leipsic J, Gaur S, et al. Diagnostic performance of noninvasive fractional flow reserve derived from coronary computed tomography angiography in suspected coronary artery disease: the NXT trial (Analysis of Coronary Blood Flow Using CT Angiography: Next Steps) J Am Coll Cardiol. 2014;63:1145–1155. doi: 10.1016/j.jacc.2013.11.043. [DOI] [PubMed] [Google Scholar]
- 15.Nakazato R, Park H-B, Berman DS, et al. Noninvasive fractional flow reserve derived from computed tomography angiography for coronary lesions of intermediate stenosis severity: results from the DeFACTO study. Circ Cardiovasc Imaging. 2013;6:881–889. doi: 10.1161/CIRCIMAGING.113.000297. [DOI] [PubMed] [Google Scholar]
- 16.Koo BK, Erglis A, Doh JH, et al. Diagnosis of ischemia-causing coronary stenoses by noninvasive fractional flow reserve computed from coronary computed tomographic angiograms. Results from the prospective multicenter DISCOVER-FLOW (Diagnosis of Ischemia-Causing Stenoses Obtained Via Noninvasive Fractional Flow Reserve) study. J Am Coll Cardiol. 2011;58:1989–1997. doi: 10.1016/j.jacc.2011.06.066. [DOI] [PubMed] [Google Scholar]
- 17.Patel MR, Nørgaard BL, Fairbairn TA, et al. 1-year impact on medical practice and clinical outcomes of FFR: the ADVANCE Registry. JACC Cardiovasc Imaging. 2020;13(1 Pt 1):97–105. doi: 10.1016/j.jcmg.2019.03.003. [DOI] [PubMed] [Google Scholar]
- 18.Yang J, Shan D, Wang X, et al. On-site computed tomography-derived fractional flow reserve to guide management of patients with stable coronary artery disease: the TARGET randomized trial. Circulation. 2023;147:1369–1381. doi: 10.1161/CIRCULATIONAHA.123.063996. [DOI] [PubMed] [Google Scholar]
- 19.Kruk M, Wardziak Ł, Demkow M, et al. Workstation-based calculation of CTA-based FFR for intermediate stenosis. JACC Cardiovasc Imaging. 2016;9:690–699. doi: 10.1016/j.jcmg.2015.09.019. [DOI] [PubMed] [Google Scholar]
- 20.Cook CM, Petraco R, Shun-Shin MJ, et al. Diagnostic accuracy of computed tomography-derived fractional flow reserve: a systematic review. JAMA Cardiol. 2017;2:803–810. doi: 10.1001/jamacardio.2017.1314. [DOI] [PubMed] [Google Scholar]
- 21.Celeng C, Leiner T, Maurovich-Horvat P, et al. Anatomical and functional computed tomography for diagnosing hemodynamically significant coronary artery disease: a meta-analysis. JACC Cardiovasc Imaging. 2019;12:1316–1325. doi: 10.1016/j.jcmg.2018.07.022. [DOI] [PubMed] [Google Scholar]
- 22.Coenen A, Rossi A, Lubbers MM, et al. Integrating CT myocardial perfusion and CT-FFR in the work-up of coronary artery disease. JACC Cardiovasc Imaging. 2017;10:760–770. doi: 10.1016/j.jcmg.2016.09.028. [DOI] [PubMed] [Google Scholar]
- 23.Hecht HS, Narula J, Fearon WF. Fractional flow reserve and coronary computed tomographic angiography: a review and critical analysis. Circ Res. 2016;119:300–316. doi: 10.1161/CIRCRESAHA.116.307914. [DOI] [PubMed] [Google Scholar]
- 24.Pontone G, Baggiano A, Andreini D, et al. Dynamic stress computed tomography perfusion with a whole-heart coverage scanner in addition to coronary computed tomography angiography and fractional flow reserve computed tomography derived. JACC Cardiovasc Imaging. 2019;12:2460–2471. doi: 10.1016/j.jcmg.2019.02.015. [DOI] [PubMed] [Google Scholar]
- 25.Yu M, Shen C, Dai X, et al. Clinical outcomes of dynamic computed tomography myocardial perfusion imaging combined with coronary computed tomography angiography versus coronary computed tomography angiography-guided strategy. Circ Cardiovasc Imaging. 2020;13:e009775. doi: 10.1161/CIRCIMAGING.119.009775. [DOI] [PubMed] [Google Scholar]
- 26.Trattner S, Halliburton S, Thompson CM, et al. Cardiac-specific conversion factors to estimate radiation effective dose from dose-length product in computed tomography. JACC Cardiovasc Imaging. 2018;11:64–74. doi: 10.1016/j.jcmg.2017.06.006. [DOI] [PMC free article] [PubMed] [Google Scholar]
- 27.Cerqueira MD, Weissman NJ, Dilsizian V, et al. Standardized myocardial segmentation and nomenclature for tomographic imaging of the heart. A statement for healthcare professionals from the Cardiac Imaging Committee of the Council on Clinical Cardiology of the American Heart Association. Circulation. 2002;105:539–542. doi: 10.1161/hc0402.102975. [DOI] [PubMed] [Google Scholar]
- 28.Alba AC, Agoritsas T, Walsh M, et al. Discrimination and calibration of clinical prediction models: users’ guides to the medical literature. JAMA. 2017;318:1377–1384. doi: 10.1001/jama.2017.12126. [DOI] [PubMed] [Google Scholar]
- 29.Pencina MJ, D’Agostino RB, Steyerberg EW. Extensions of net reclassification improvement calculations to measure usefulness of new biomarkers. Stat Med. 2011;30:11–21. doi: 10.1002/sim.4085. [DOI] [PMC free article] [PubMed] [Google Scholar]
- 30.Li Y, Yu M, Dai X, et al. Detection of hemodynamically significant coronary stenosis: CT myocardial perfusion versus machine learning CT fractional flow reserve. Radiology. 2019;293:305–314. doi: 10.1148/radiol.2019190098. [DOI] [PubMed] [Google Scholar]
Associated Data
This section collects any data citations, data availability statements, or supplementary materials included in this article.


