Abstract
Physiologically based pharmacokinetic (PBPK) models are commonly used in risk assessments to perform inter- and intraspecies extrapolations as well as to extrapolate between different dosing scenarios; however, they must first undergo quality assurance review, which can be a time-consuming process, especially when model code is not readily available. We developed and implemented (using R and MCSim) a PBPK model template capable of replicating published model results for several chemical-specific PBPK models. This model template allows for faster quality assurance (QA) review since the general model equations only need to be reviewed once, and application to a specific chemical then only requires reviewing input parameters. The model template can implement PBPK models with oral and intravenous exposure routes, varying numbers of tissue compartments, renal reabsorption, and multiple elimination pathways, including fecal, urinary, and biliary. Using the model template, we reproduced published model simulation results for perfluorohexanesulfonic acid (PFHxS), perfluorononanoic acid (PFNA), perfluorodecanoic acid (PFDA), perfluorooctanoate (PFOA), and perflouorooctane sulfonate (PFOS). We also show that the template can be a useful tool for identifying potential model errors. Thus, the model template allows for faster evaluation and review of published PBPK models and provides a proof of concept for using this approach with broader classes of chemical-specific PBPK models.
Keywords: PBPK model, template model, risk assessment, PFAS, pharmacokinetics
Introduction
Physiologically based pharmacokinetic (PBPK) models predict the concentration of a chemical in the blood and tissues of different species as a function of dose and route of exposure. They include mathematical descriptions of the absorption, distribution, metabolism, and elimination of the chemical based on biological, physical, and chemical processes. Chemical risk assessments use these models to extrapolate between different species and dosing scenarios. Modelers and risk assessors frequently rely on previously published PBPK models to perform risk assessment dosimetry calculations or to serve as the basis for new PBPK models that can be used for that purpose. However, prior to use in risk assessment, a model must be evaluated using quality assurance (QA) standards (McLanahan et al. 2012). This includes assessing the model’s purpose, structure, mathematical descriptions, and computer implementation as well as evaluating the model parameters and how well the model describes experimental data (Clark et al. 2004; IPCS 2010; U.S. EPA 2018; 2020).
Outside of risk assessment, a modeler may wish to change a published PBPK model for specific applications, such as adding an exposure route, a new metabolic pathway, or dose- and time-dependent features, or perhaps modifying the model to describe a different but related chemical. In this case, too, one should ensure that model results generated by the original authors can be reproduced before making modifications to the model. When one uses a new implementation of a published model and is unable to reproduce published results for that model (e.g., calculated values based on simulations), the explanation must fall into one of two categories: (1) the new implementation contains one or more errors so that it is not a faithful representation of the published model, or (2) the original model authors made some error in describing their model (in writing), in implementing their model (in code), and/or in reporting their results. In such a situation, it can be challenging to decide which of these two categories of explanations should be thoroughly explored first.
We have created a PBPK model template that can be used to quickly implement PBPK models. We subjected the template code to a rigorous QA review and demonstrated how to use the template to replicate published model results for five specific chemicals. The template is currently focused on per- and polyfluoroalkyl substances (PFAS) but will subsequently be extended to address other classes of chemicals. The model template contains many commonly used equations and logic needed to perform PBPK simulations, and users of the model only need to select the appropriate equations and logic from the template and provide chemical-specific parameters and dosing scenario information. Since QA review of the model template equations and logic has already been performed, users of the template do not need to review the general equations for each chemical-specific model they implement. Instead, a user’s review can focus on verifying the chemical- and model-specific input parameters for a given model and ensuring that the equations and logic selected from the template options are appropriate for the particular chemical. Whether the objective is to create a new model or to reproduce or modify an existing model, the template provides an efficient way to implement a PBPK model. It is important to note, however, that when evaluating the quality of a modified PBPK model, the final measure of “quality” should be based on comparisons of model predictions with observed data rather than with the originally published model simulation results.
Other generic PBPK models have been developed, but these tools do not meet the same needs as our model template. Most generic models have either been created in order to approximate published models (Mumtaz et al. 2012a; Mumtaz et al. 2012b; Ruiz et al. 2011) or to perform PBPK simulations for chemicals for which PBPK models are otherwise unavailable based on a relatively small number of parameters (Brightman et al. 2006; Jongeneelen and ten Berge 2012; Jongeneelen and Ten Berge 2011; Pearce et al. 2017). Many of these generic models are intended for screening purposes and they do not have all the model features that may be necessary for replicating the results of a full, chemical-specific PBPK model.
The Agency for Toxic Substances and Disease Registry (ATSDR) has developed a human “PBPK model tool kit” that contains a selection of published models for environmental contaminants (Mumtaz et al. 2012a; Mumtaz et al. 2012b; Ruiz et al. 2010; Ruiz et al. 2011). Much of their work has focused on re-coding published models in a single common programming language to allow for easier use, particularly by risk assessors who are not necessarily trained in PBPK modeling. They have also created a generic seven-compartment PBPK model that they have applied to six volatile organic compounds (Mumtaz et al. 2012b). However, ATSDR’s goal was not to reproduce specific model results; rather, they approximated existing data sets and model simulations using a simpler model structure. In contrast, our goal is to create a model template that can be used to create new implementations of published models that are essentially identical to the implementations created and used by the model authors for applications in risk assessment.
Other generic PBPK models are accompanied by databases of physicochemical data to create parameterizations for models in the absence of in vivo data. The R package httk (“High-Throughput Toxicokinetics”), for example, contains a generic PBPK model and a collection of high-throughput in vitro data for hundreds of chemicals that can be used to parameterize and run simulations for each (Pearce et al. 2017). Similarly, IndusChemFate is a generic PBPK model that can predict pharmacokinetic behavior of volatile and semi-volatile chemicals using a database of physicochemical properties for parameterization (Jongeneelen and ten Berge 2012; Jongeneelen and Ten Berge 2011). Our PBPK model template does not include a similar database. Furthermore, both httk and IndusChemFate are screening-level tools for risk assessment and are not intended to reproduce published models.
As a proof of concept, we developed a PBPK model template by focusing on the features included in published PFAS PBPK models. There is currently considerable interest in evaluating the risk of PFAS because of their ubiquitous presence in the environment and the corresponding extent of human exposure. We identified five PBPK models for PFAS (Fàbrega et al. 2015; Kim et al. 2019; Kim et al. 2018; Loccisano et al. 2012) that have similar structures but also a few substantive differences; as such, these models provided a useful basis for an initial version of the PBPK model template. We tested our model template by comparing published PBPK model results for perfluorohexanesulfonic acid (PFHxS), perfluorononanoic acid (PFNA), perfluorodecanoic acid (PFDA), perfluorooctanoate (PFOA), and perflouorooctane sulfonate (PFOS) to those generated using template versions of those models. We were successful in reproducing results for each model and identified an error in one of the blood flow rates in the models for PFHxS, PFNA, and PFDA.
Materials and Methods
All data processing and analyses described herein were performed using R version 3.6.1 (R Core Team 2019) on a Dell Latitude E6440 computer running Microsoft Windows 10. The PBPK model template was implemented using the MCSim model specification language (Bois 2009) and was subsequently translated into C and compiled for use in R. Input parameters for specific models are provided via Microsoft Excel files. Scripts and relevant data files are available through the U.S. Environmental Protection Agency’s Environmental Dataset Gateway (DOI: 10.23719/1520081).
A QA review was applied to the model template as well as the template versions of each of the considered published models. This review was performed according to the process described in the U.S. EPA’s quality assurance project plan found online at https://hero.epa.gov/hero/index.cfm/reference/details/reference_id/7326125 (U.S. EPA 2020). This document covers the basic data collection and modeling methodologies for dosimetry and mechanism-based models, including PBPK models, and describes the necessary steps and documentation used to perform the QA review. The documentation of the QA review for this project can be found in the supplementary materials.
Model Structure
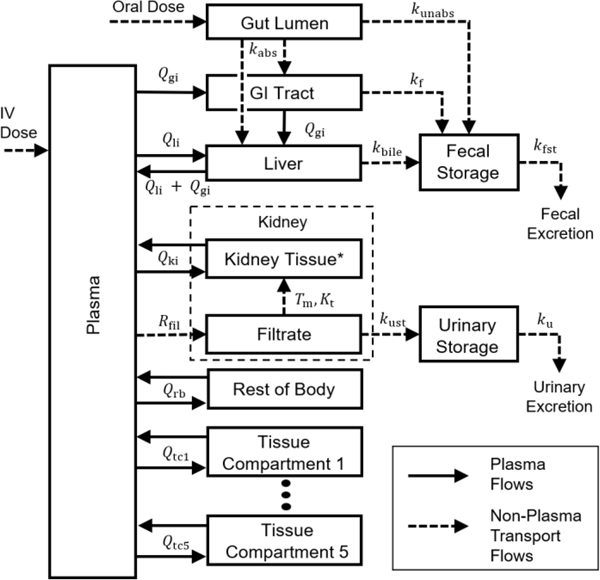
We created a PBPK model template by designing a generic PBPK model structure that includes features of the PFAS PBPK models of Kim et al. (2018), Kim et al. (2019), Fàbrega et al. (2015), and Loccisano et al. (2012). This model structure, which is shown in Figure 1, contains tissue compartments corresponding to the gastrointestinal (GI) tract, liver, kidney tissue, and kidney filtrate, as well as five general tissue compartments and a lumped compartment for any remaining body tissues. (See discussion below.) There are also compartments representing the plasma, gut lumen, fecal storage, and urinary storage. The general tissue compartments can represent additional tissues included in a given model, provided they do not involve metabolism, facilitated transport, or saturable binding processes. (Non-saturable binding can be effectively included by appropriate selection of tissue-to-blood partition coefficients.) For each tissue compartment, we assume that only the free fraction of chemical in the plasma can partition into the tissue.
Figure 1.
Model template structure for PBPK models applicable to PFAS. Chemical is introduced into the plasma (IV) or the gut lumen (oral).The absorbed fraction of an oral dose enters the GI tract or the liver by a first-order absorption rate constant , and the unabsorbed fraction enters the fecal storage compartment by a first order rate constant . Chemical can also pass to the fecal storage compartment from the GI tract by the first order rate constant or from the liver by the first order rate constant . The kidney is separated into the filtrate compartment and the tissue compartment. Chemical enters the filtrate from the plasma by a first order rate constant , and, once in the filtrate compartment, chemical can be reabsorbed by a saturable process with maximum transport rate and affinity constant or eliminated to the urinary storage compartment by a first order rate constant . *See the Discussion section for more information on the biology of kidney filtration and reabsorption. Chemical is eliminated from the fecal and urinary storage compartments by first order rate constants and , respectively. is the plasma flow rate between plasma and tissue i. Tissue compartments 1–5 are basic tissue compartments without metabolism, facilitated transport, or saturable binding processes. Additional information and a listing of all parameters included in the template are available in the supplementary materials (DOI: 10.23719/1520081).
The model template can simulate chemical exposures either via intravenous (IV) doses, which are assumed to enter the plasma compartment, or via oral doses, which are assumed to enter the gut lumen compartment. The model template allows chemical in the gut lumen to be either (1) passed to the GI tissue compartment (from which it is then distributed via hepatic portal flow to the liver), or (2) passed directly to the liver compartment. In the latter case, the GI tract can optionally be excluded from the model as a specific compartment by setting the blood flow rate and mass for the GI compartment to zero and including the GI tissue mass and blood flow in the “rest of body” lumped tissue compartment (cf. Figure 1). The fraction of an oral bolus dose that does not pass to the gut can be handled in one of two ways. The unabsorbed fraction of the dose can be sent directly to the fecal storage compartment such that it never enters systemic distribution by setting the initial amounts in the gut lumen and the fecal storage compartments to be
where is the amount of chemical in the gut lumen (mg), is the amount of chemical in the fecal storage compartment (mg), is the oral bolus dose (mg/kg), is the body weight (kg), and is the unabsorbed fraction. The other option is to allow the entire dose to enter the gut lumen by setting to zero and using a first order rate to describe the transport of chemical from the gut lumen to the fecal storage compartment.
The model template includes three potential paths for fecal excretion: (1) a direct path from the GI lumen for the unabsorbed portion of an oral dose, with the rate of excretion based on the amount in the gut lumen; (2) a path from the GI tissue, with the rate of excretion based on the amount of chemical in the GI tract tissue; and (3) a biliary excretion path, with the rate based on the amount of chemical in the liver. We model each of these paths for fecal elimination as first order rates, and any of the paths may be effectively excluded by setting the corresponding rate constant to zero. In all cases, a fecal storage compartment is included in the model to allow a delay between the time when a chemical is removed from the GI lumen, the GI tract tissue, or the liver and the time it leaves the body.
Renal reabsorption is a common feature of PBPK models for PFAS and is also included in the template. In the model template, as in the models of Kim et al. (2018), Kim et al. (2019), Fàbrega et al. (2015), and Loccisano et al. (2012), chemical passes from the plasma to the renal filtrate compartment via a first order flow rate, , presumed to be the glomerular filtration rate, and can then be reabsorbed via a concentration-dependent saturable rate (mg/h) with maximum rate of transport (mg/h) and affinity constant (mg/L) given by
where is the concentration in the kidney filtrate (mg/L) at simulation time . We compare and contrast reabsorption biology and the model representations of this biology in the Discussion section. Chemical mass can also pass from the filtrate to a urine storage compartment at a first-order rate. The urine storage compartment accounts for the delay in the appearance of the chemical in excreted urine while it transits the ureter and is held in the bladder.
We included additional features from the PBPK models for specific PFAS in the model template to allow recreation of published model simulation results. For example, the model of Loccisano et al. (2012) for PFOS included a rate (mg/h) of saturable binding in the liver compartment given by
where is the concentration in the liver (mg/L) at simulation time is the free fraction of chemical in plasma, is the equilibrium ratio (partition coefficient) for concentrations in liver tissue versus plasma, is the maximum rate of binding (mg/h), and (mg/L) is an affinity constant. Bound chemical then unbinds at a first order rate , where is the amount of chemical bound in the liver (mg) at time . In order to reproduce the Loccisano et al. (2012) model for PFOS, we also included the authors’ expression describing time-dependent changes in the free fraction of chemical in the plasma used by Loccisano et al. (2012), which they calculated as
where is the initial free fraction, is a unitless constant that determines the reduction in free fraction over time, is a rate constant (1/h), and is the time (h) (Loccisano et al. 2012). To implement this expression in the model template, we approximated using linear interpolation with evenly-spaced time increments of 0.00001 h on the interval from 0 to 10 hours and evenly-spaced increments of 0.001 h on the interval from 10 to 2880 hours. Higher resolution was used on the interval from 0 to 10 hours to approximate the exponential function with sufficient accuracy during the time of fastest decrease and a lower resolution was used outside that interval when the decrease was not so rapid. For all other PFAS model implementations we define , where is a constant.
Table 1 lists the input parameters that are allometrically scaled within the model equations. Note the template allows the user to assign a constant body weight or one that varies with respect to time throughout the simulation, and allometric scaling of parameters (based on body weight) will be performed appropriately based on this choice.
Table 1.
Allometrically scaled parameters are computed as , where is a fixed scaling coefficient defined for the parameter in question and is the allometrically adjusted body weight used for that parameter. Scaling coefficient values () and body weight (BW) are provided by the user in input files.
| Parameter Name (units) | Symbol | Allometrically Adjusted Body Weight () |
|---|---|---|
| Renal reabsorption transporter maximum (mg/h) | BW0.75 | |
| Urinary elimination rate (1/h) | BW−0.25 | |
| Transfer rate constant to urinary storage compartment (1/h) | BW−0.25 | |
| Biliary excretion rate constant (1/h) | BW−0.25 | |
| Transfer rate constant from fecal storage to fecal elimination (1/h) | BW−0.25 | |
| Free fraction variation rate constant (1/h) | BW−0.25 | |
| Cardiac output (L/h) | BW0.75 |
Reproducing Published Results
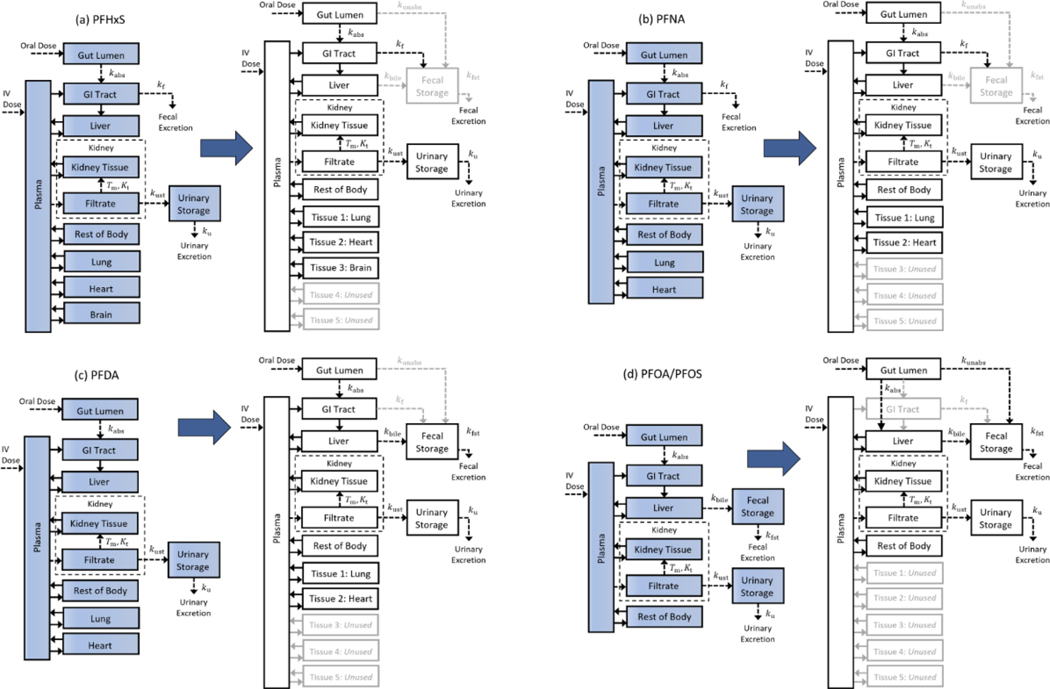
Using the model template, we performed simulations comparable to those described by Kim et al. (2018) for PFHxS, by Kim et al. (2019) for PFNA and PFDA, and by Loccisano et al. (2012) for PFOA and PFOS. Our simulations may differ slightly from those performed by the original authors due to missing details of their simulation parameters as well as differences in the software platforms used. To create the template version of a given model, we compared the equations in the published model (provided in the main text or supplemental materials of the corresponding publication) to the model template equations to determine the relationship between the parameters used in the corresponding equations. We also requested and obtained the model source code from Kim et al. (2018) and Kim et al. (2019) and the source code of Loccisano et al. (2012) was available in their supplementary materials. Using the source code, we compared the parameter values listed in each model paper to those in the corresponding code and used the values given in the source code whenever there was a discrepancy or when parameter values were not provided in the paper. For model features, tissues, or chemical pathways available in the template but not present in the original model, we set the corresponding first order rate constants or blood flow rates to zero. This mapping of the published model to the template is shown in Figure 2 for each of the published models considered, with lighter colored arrows, boxes, and corresponding text showing the first order rate constants and compartments for which blood flow rates were set to zero.
Figure 2.
Mapping published PBPK model structures to the model template structure. In order to implement a published model using the PBPK model template, the existing structure must be mapped onto the model template structure by setting the appropriate parameters. For each of the published models, we set unused parameters to zero, and for unused compartments we set the blood flow for that compartment to zero. Each mapping is shown here by using lighter colored arrows, boxes, and text for parameters and compartments that are “switched off” or set to zero for (a) the PFHxS model of Kim et al. (2018), (b) the PFNA model of Kim et al. (2019), (c) the PFDA model of Kim et al. (2019), and (d) the PFOA/PFOS model of Loccisano et al. (2012), which used the same model structure for both PFOA and PFOS.
To compare the model template simulations to the published results, we digitized the published model simulation output and data points using WebPlotDigitizer (Rohatgi 2019). (The digitization process may also result in small discrepancies between template predictions and the original model.) To evaluate the ability of the template versions of the models to reproduce the published results, we considered the percent difference in blood plasma concentration relative to the maximum ordinate (“y”) value of a given digitized figure from published simulation results. We compute this as
where is the blood plasma concentration digitized from the published simulation results, is the blood plasma concentration from the template version of the model, and is the largest labeled value on the ordinate axis of the digitized figure.
PFHxS Model
The PBPK model for PFHxS of Kim et al. (2018) was mapped to the model template by setting the parameters for three of the general tissue compartments to values given for the lung, heart, and brain (cf. Figure 2a). The remaining two unused tissue compartments were “turned off” by setting the blood flows to them to zero. In the published model, the rate of fecal elimination is based on the amount of chemical in the blood leaving the GI tract tissue. For fecal elimination in the template version of this model, we set the first order rate constants for the unabsorbed dose to appear in feces, , and for biliary excretion, , to zero so that no chemical would transfer directly from the gut lumen or the liver to fecal storage.
PFNA Model
We mapped the PFNA PBPK model of Kim et al. (2019) to the model template by setting two of the general tissue compartments to have the parameter values for the lung and heart (cf. Figure 2b). The remaining three general tissue compartments were turned off by setting the associated blood flow rates to zero. In the published model, the rate of fecal elimination is based on the amount of chemical in the blood leaving the GI tract tissue. We implemented the fecal elimination in the template version of this model by setting the values for the first order rate constants and to zero so that no chemical was transferred directly from the gut lumen or the liver to the fecal storage compartment.
PFDA Model
The PFDA PBPK model of Kim et al. (2019) was mapped to the model template by setting the parameters of two of the general tissue compartments to the values for the lung and heart and turning off the remaining three general tissue compartments by setting the associated blood flow rates to zero (cf. Figure 2c). In the published model, the rate of fecal elimination is based on the amount of chemical in the blood leaving the liver. To implement fecal elimination within the template version of this model, we set the first order rate constants describing chemical transport to fecal storage from the gut lumen and the GI tract, and , to zero.
PFOA Model
We mapped the Loccisano et al. (2012) PBPK model for PFOA to the model template by setting the blood flows to all the general tissue compartments to zero (cf. Figure 2d). To map the gut and liver compartments to the model template, we used the option to have the gut lumen directly connected to the liver compartment and set the blood flow to the GI tract to zero.
PFOS Model
Mapping the Loccisano et al. (2012) PBPK model for PFOS to the model template was the same as for PFOA. Additionally, the PFOS model includes saturable protein binding in the liver so this feature was enabled by setting the appropriate parameter values. We also included the exponential time-dependent model for the free fraction of PFOS in plasma used by Loccisano et al. (2012) in order to replicate their results.
Results
PFHxS Model
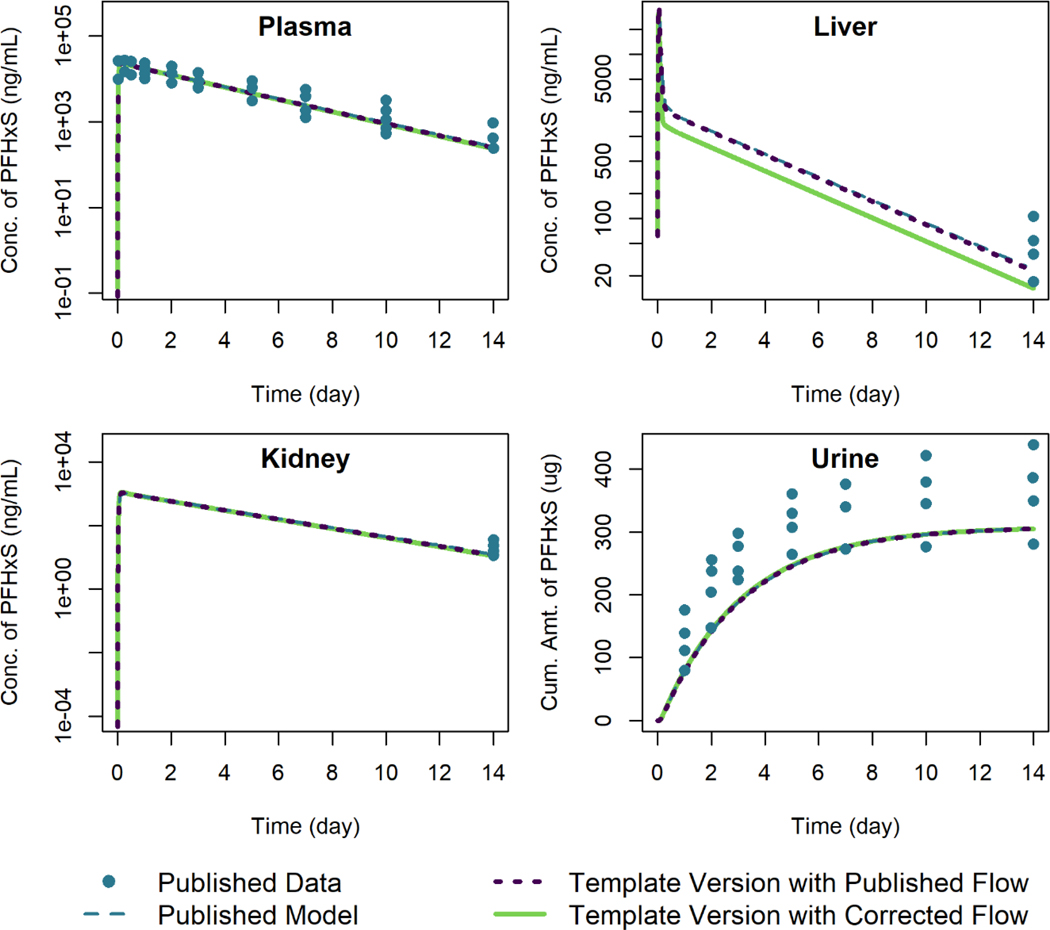
Figure 3 shows the model template simulations for female rats given a single oral dose of 4 mg/kg of PFHxS, plotted alongside the published model simulation results of Kim et al. (2018).The published model equations included a term for blood flow to the liver from the GI tract but did not include an appropriate increase in the term describing blood flow leaving the liver; i.e., blood flow from the liver to the central plasma compartment was set to rather than . The “corrected flow” template version of the model (cf. Figure 3) sets the blood flow from the liver to plasma to the sum . Output generated using the template version of the model with corrected flow, which is shown with a solid line in Figure 3, matches the published model results well, except for the output for the liver compartment (in which the published simulated concentration is higher). The discrepancy between predictions with the template version of the model and the published results encouraged us to examine the model equations and parameters for the liver compartment for possible errors. The specific error in the exiting blood flow term was then identified by examining the model equations listed in the supplementary materials of Kim et al. (2018). We also performed the simulations using the published blood flow leaving the liver (i.e., with the blood flow leaving the liver set to just Qli) and these are shown with a dotted line in Figure 3; the simulation concentration-vs.-time results obtained using the template version of the model were within 0.1% of the published simulation values relative to the maximum digitized figure scale when this reduced exiting flow rate was used.
Figure 3.
Comparison of published model simulations (dashed lines) and template version of the model simulations (solid and dotted lines) for the concentration of PFHxS in plasma, liver, and kidney, and the amount of PFHxS in urine for female rats given a single oral dose of 4 mg/kg of PFHxS. Published model simulations and published data (points) were digitized from Figures 8a, 8b, 8c, and 8f of Kim et al. (2018). Model parameters were not recalibrated for the template version of the model with the corrected flow in order to fit the published data.
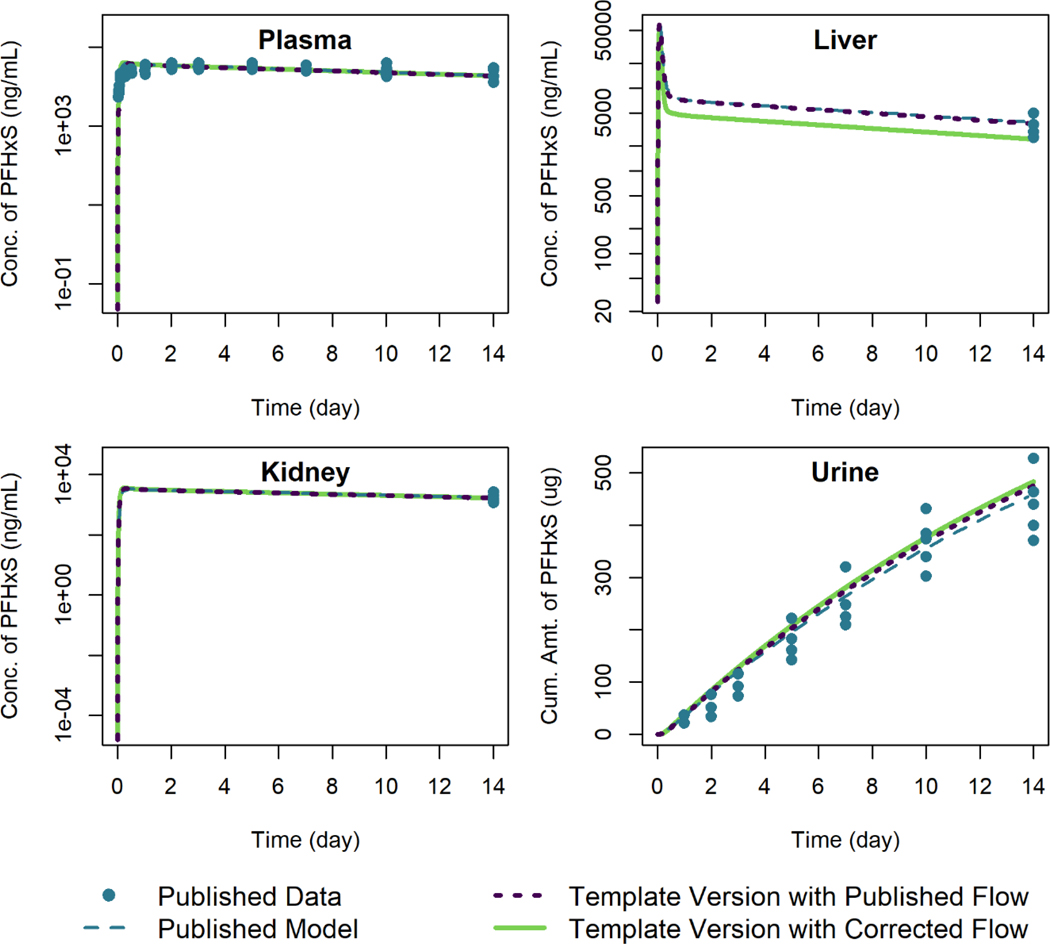
Figure 4 shows simulation output from both the published model and template version of the model for male rats given an oral dose of 10 mg/kg of PFHxS. Using the published equation to calculate the rate of PFHxS exiting the liver, the template results match the results shown in the published figures to within 0.3% of the maximum digitized figure scale. Using the corrected exiting liver blood flow term in the equation results in a lower concentration of PFHxS in the liver but little change in predicted levels in the other tissues.
Figure 4.
Comparison of published model simulations (dashed lines) and template version of the model simulations (solid and dotted lines) for the concentration of PFHxS in plasma, liver, and kidney, and the amount of PFHxS in urine for male rats given a single oral dose of 10 mg/kg of PFHxS. Published model simulations and published data (points) were digitized from Figures 7a, 7b, 7c, and 7f of Kim et al. (2018). Model parameters were not recalibrated for the template version of the model with the corrected flow in order to fit the published data.
PFNA Model
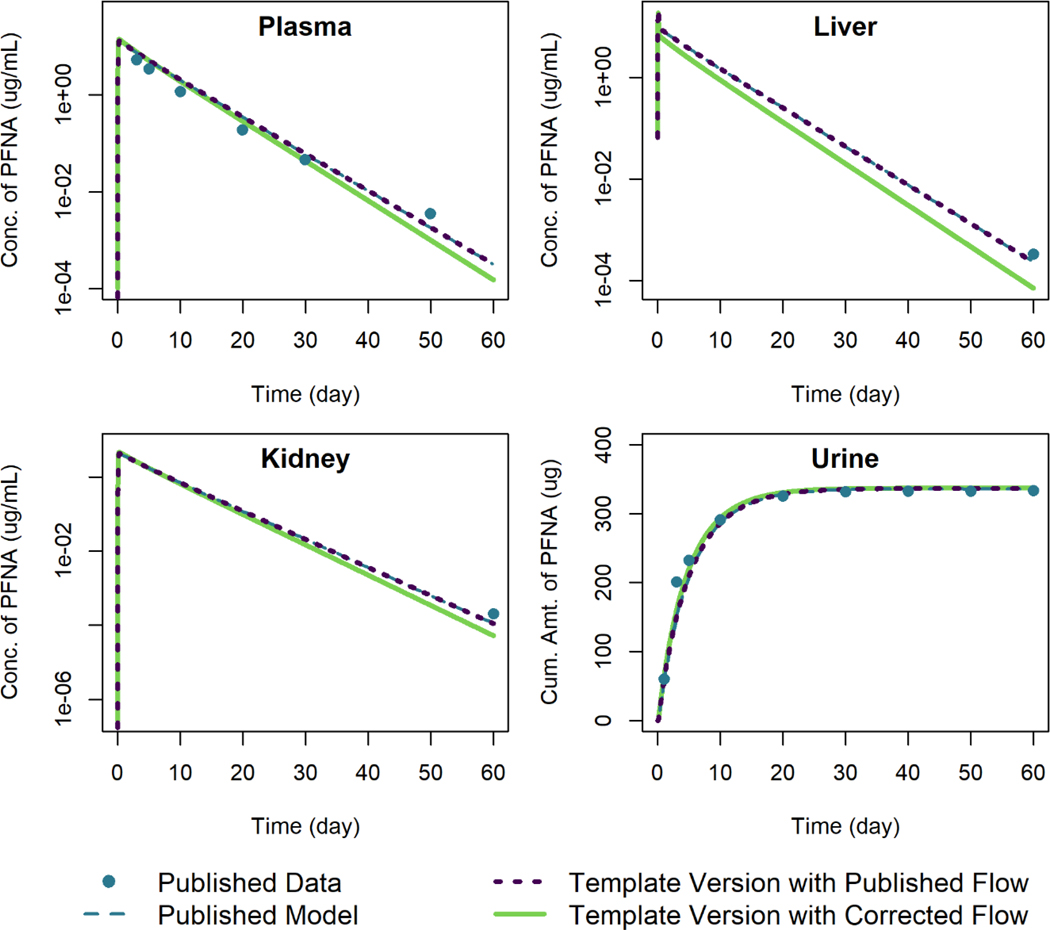
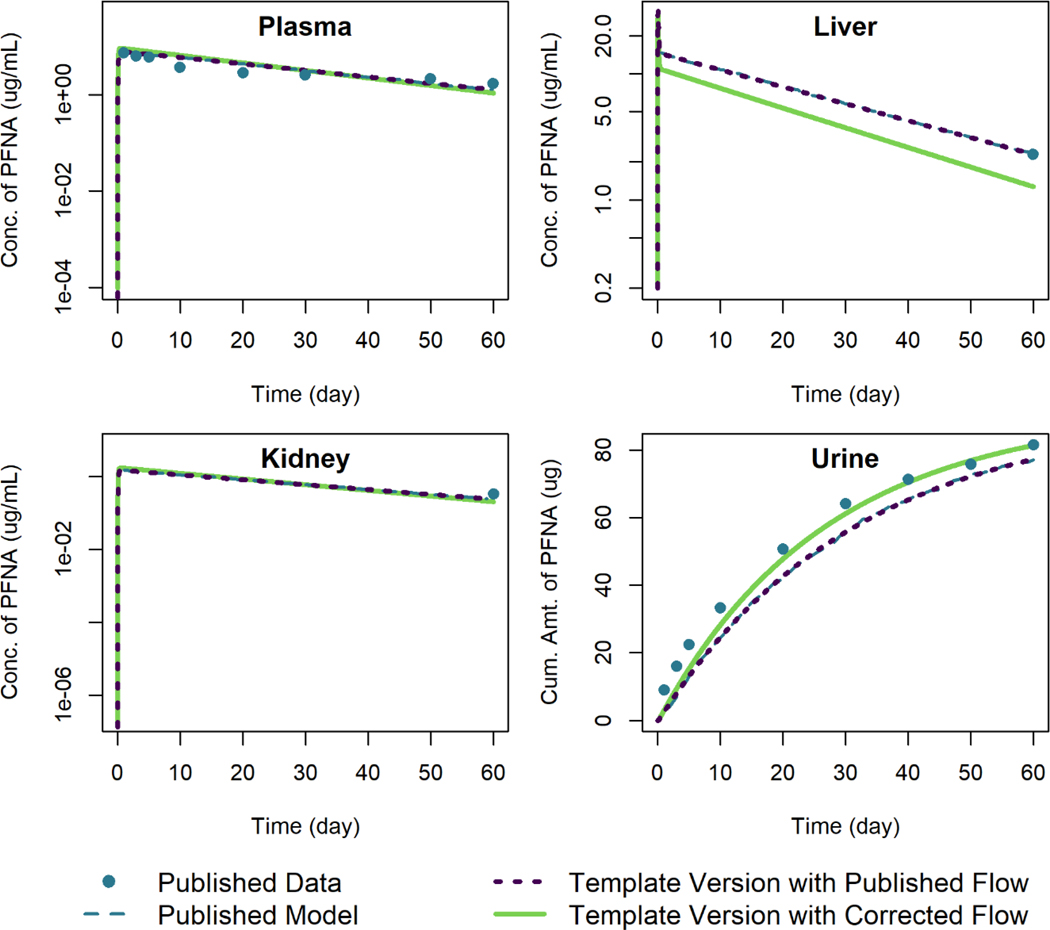
We used the model template to reproduce simulation results of Kim et al. (2019) for male and female rats given a single oral dose of 3 mg/kg PFNA. The error in blood flow out of the liver compartment that we identified in the Kim et al. (2018) model for PFHxS was also present in this model. Figure 5 shows the model simulations for female rats, and Figure 6 shows the model simulations for male rats. In both cases, when using the published blood flow rates from the liver to the central plasma compartment, the results from the template version of the model are within 0.3% of the published simulation values relative to the maximum digitized figure scale. When the corrected exiting liver blood flow rate is used, the tissue concentrations of PFNA are lower, particularly in the liver, and the elimination amounts are larger (cf. Figure 6).
Figure 5.
Comparison of published model simulations (dashed lines) and template version of the model simulations (solid and dotted lines) for the concentration of PFNA in plasma, liver, and kidney, and the amount of PFNA in urine for female rats given a single oral dose of 3 mg/kg of PFNA. Published model simulations and published data (points) were digitized from Figure 7 of Kim et al. (2019). Model parameters were not recalibrated for the template version of the model with the corrected flow in order to fit the published data.
Figure 6.
Comparison of published model simulations (dashed lines) and template version of the model simulations (solid and dotted lines) for the concentration of PFNA in plasma, liver, and kidney, and the amount of PFNA in urine for male rats given a single oral dose of 3 mg/kg of PFNA. Published model simulations and published data (points) were digitized from Figure 7 of Kim et al. (2019). Model parameters were not recalibrated for the template version of the model with the corrected flow in order to fit the published data.
PFDA Model
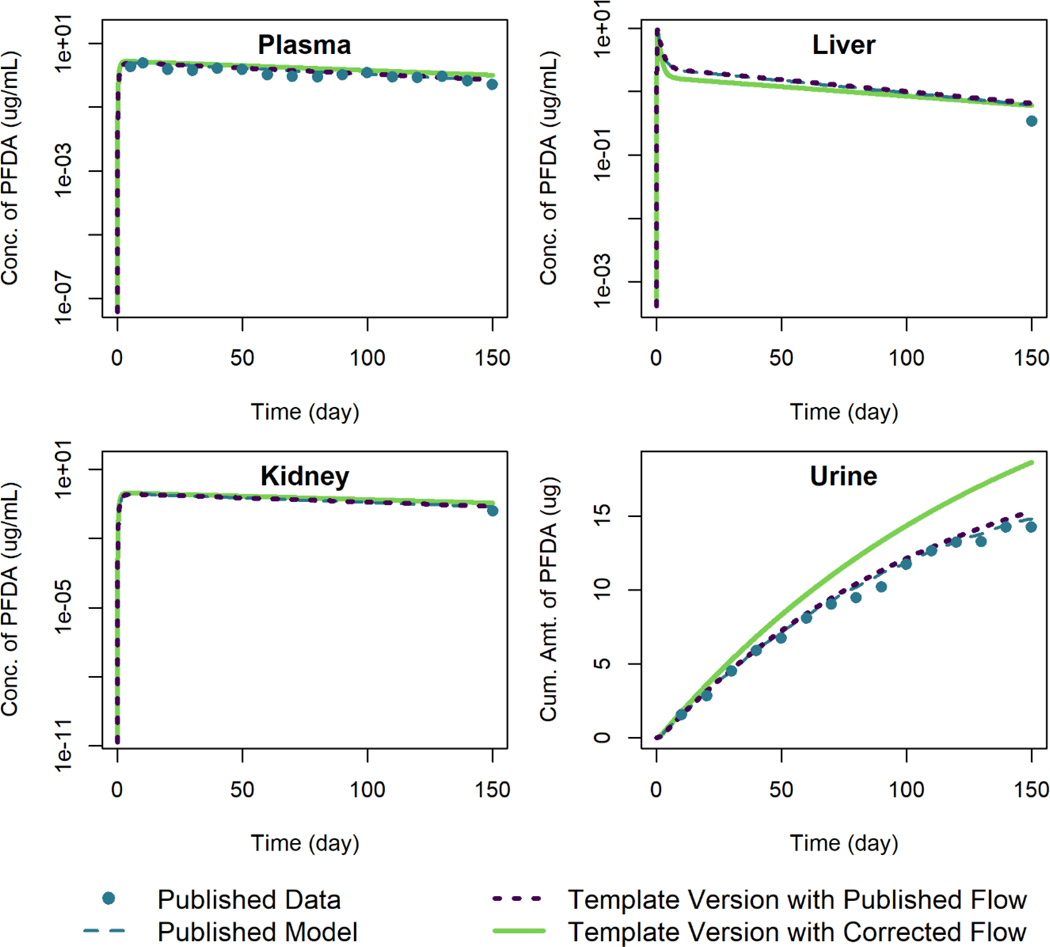
We compared the output of simulations using the template version of the PFDA model with the published model simulation output and data of Kim et al. (2019) for female rats given an oral dose of 1 mg/kg of PFDA in Figure 7. The same error in blood flow out of the liver compartment that we identified in the models for PFHxS and PFNA was also present here. When using the template version of the model with the published blood flow exiting the liver, the simulation output is within 0.6% of the published model simulation output relative to the maximum digitized figure scale. Using the corrected model blood flow exiting the liver results in lower predicted concentrations of PFDA in the liver tissue and higher predicted concentrations in the other compartments as well as higher amounts excreted in urine. The parameters related to urinary excretion were estimated by the original model authors by calibrating their model to the urine concentration data, and when we corrected the blood flow term for the liver compartment we did not adjust any parameters provided by the original authors other than the blood flow rate. This contributes to the discrepancy in the cumulative amount of PFDA excreted in urine seen in Figure 7. Before using this model for risk assessment, we would recommend re-estimating any parameters by calibrating the model to the data using the corrected equations.
Figure 7.
Comparison of published model simulations (dashed lines) and template version of the model simulations (solid and dotted lines) for the concentration of PFDA in plasma, liver, and kidney, and the amount of PFDA in urine for female rats given a single oral dose of 1 mg/kg of PFDA. Published model simulations and published data (points) were digitized from Figure 8 of Kim et al. (2019). Model parameters were not recalibrated for the template version of the model with the corrected flow in order to fit the published data.
PFOA Model
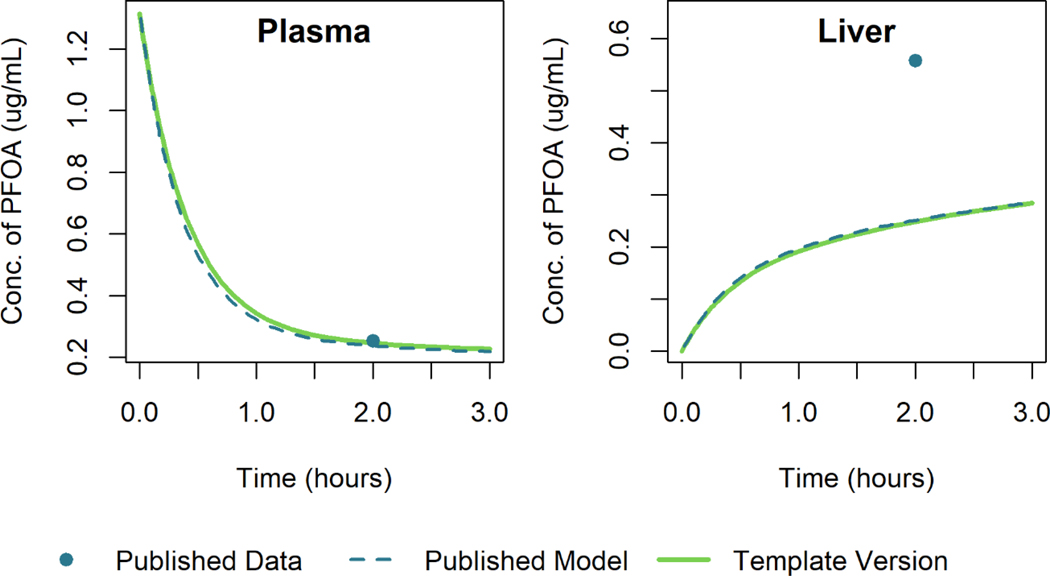
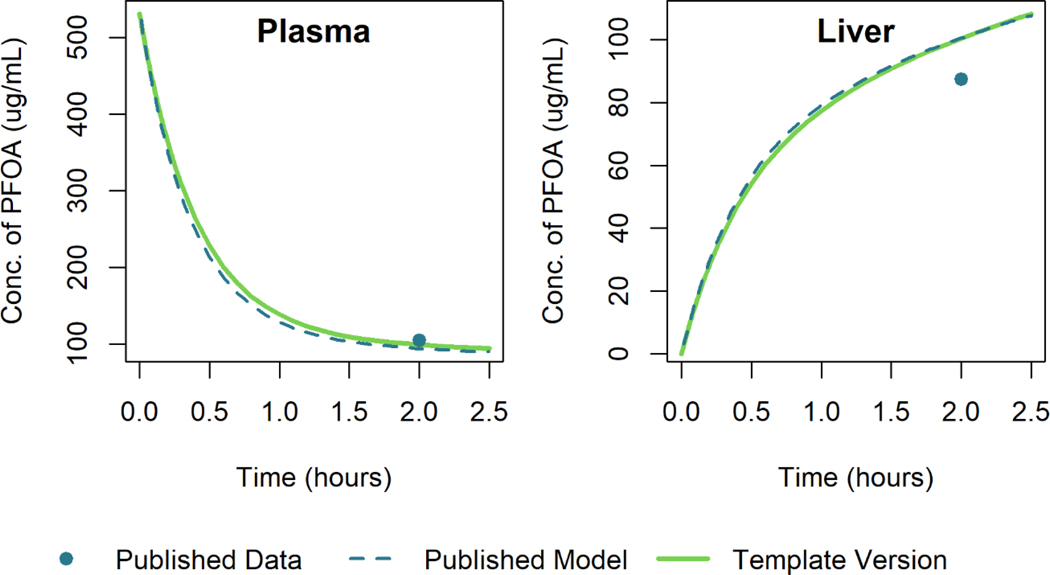
Using the model template, we recreated the model simulations of Loccisano et al. (2012) that were based on data from Kudo et al. (2007). Figure 8 and Figure 9 show the simulation output for the template version of the model along with that of Loccisano et al. (2012) for male rats given a single small (0.041 mg/kg) or large (16.56 mg/kg) IV dose of PFOA. The simulation output of the template version of the model matched the published model simulation output within 3% of the maximum digitized figure scale for both the low and high dose levels. A specific cause of the discrepancy was not determined.
Figure 8.
Comparison of published model simulations (dashed lines) and template version of the model simulations (solid lines) for the concentration of PFOA in plasma and liver for male rats given a single IV dose of 0.041 mg/kg of PFOA. Published model simulations and published data (Kudo et al. 2007) (points) were digitized from Figure 8 of Loccisano et al. (2012).
Figure 9.
Comparison of published model simulations (dashed lines) and template version of the model simulations (solid lines) for the concentration of PFOA in plasma and liver for male rats given a single IV dose of 16.56 mg/kg of PFOA. Published model simulations and published data (Kudo et al. 2007) (points) were digitized from Figure 8 of Loccisano et al. (2012).
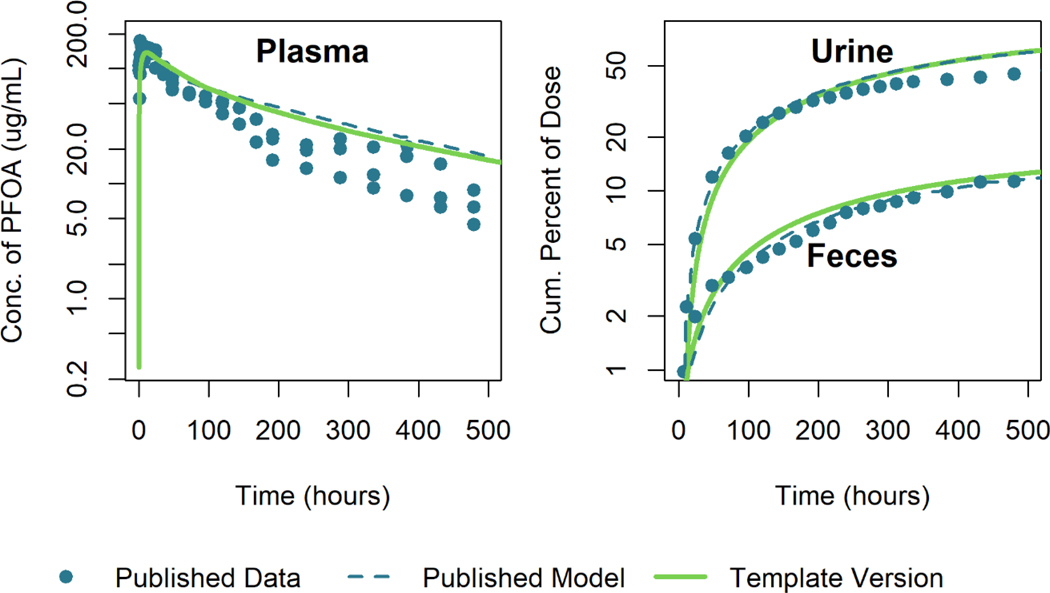
We also attempted to reproduce the model simulation results of Loccisano et al. (2012) that were calibrated to plasma concentration data of Kemper (2003). Figure 10 shows a comparison between the model template simulation results and the published model results and data. Note that the output of the template version of the model differs from the published results at least in part because the body weight parameters used to create this simulation were not provided in the original publication. However, using body weight parameters provided for another simulation (i.e., tabulated body weight data from Perkins et al. (2004) for a dose of 1ppm) found in the paper allowed us to produce results similar to those shown in Figure 9 of (Loccisano et al. 2012). The model template simulation results are within 17% of the published model simulation values relative to the maximum digitized figure scale near the peak plasma concentration and within 3% of the maximum digitized figure scale for simulation times after 70 hours.
Figure 10.
Comparison of published model simulations (dashed lines) and template version of the model simulations (solid lines) for the concentration of PFOA in plasma and the cumulative percent of the dose excreted in urine and feces for male rats given a single oral dose of 25 mg/kg of PFOA. Published model simulations and published data (Kemper 2003) (points) were digitized from Figure 9 of Loccisano et al. (2012).
PFOS Model
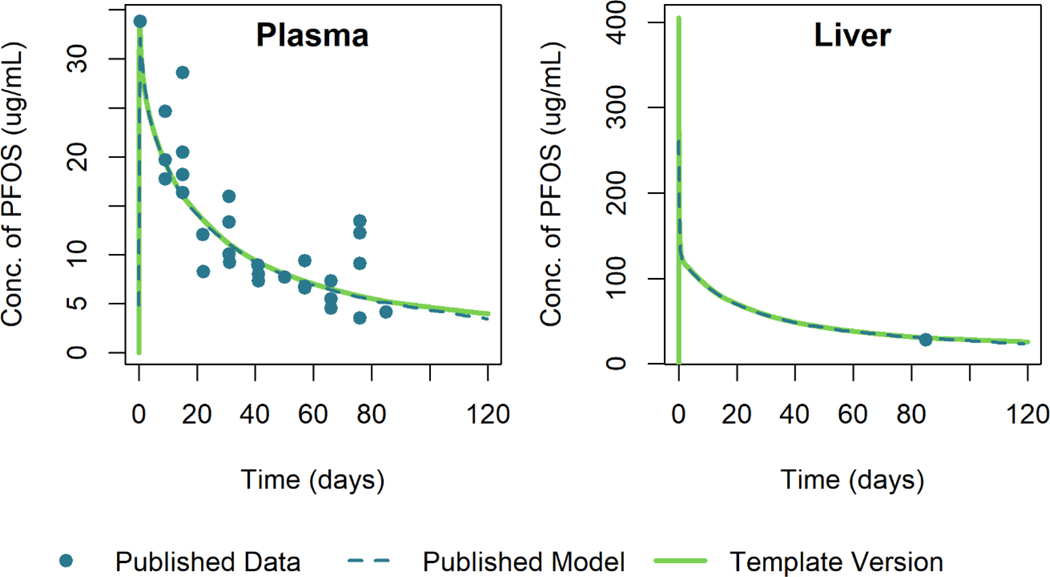
Figure 11 shows the simulation results of the template version of the model and the published model simulation results for male rats given a single oral dose of 15 mg/kg of PFOS. The simulation output of the template version of the model matched the published model simulation output within 1% relative to the maximum digitized figure scale, indicating that the template version is an accurate reproduction of the published model.
Figure 11.
Comparison of published model simulations (dashed lines) and template version of the model simulations (solid lines) for the concentration of PFOS in plasma and liver for male rats given a single oral dose of 15 mg/kg of PFOS. Published model simulations and published data (points) were digitized from Figure 4 of Loccisano et al. (2012). (Data were collected by 3M).
Discussion
Purpose and Use of the Template
The model template allows users to quickly implement PBPK models and simplifies and accelerates QA review of these models. It can be used any time a modeler wants to apply or review a PBPK model. This includes review of previously published models for use in risk assessment but also the development of new models. When developing a new model, model developers should consider which features and equations are appropriate for the chemical and exposure scenario they are addressing. They can then create the model by setting the necessary parameter values. If the new model is built from the template structure, the modelers do not need to perform a QA review of the template equations but can instead focus their review on the appropriateness of the features they selected for inclusion and the corresponding parameter values. This will help prevent errors during the development of a new model.
While the template was not specifically designed to perform extrapolations or other standard types of PBPK calculations, once a template version of a specific PBPK model has been created it can be used for such purposes. For example, in order to perform an animal-to-human dose extrapolation, a modeler should first implement two template versions of the model: one using parameter values for the relevant animal species and one using parameter values for humans. This can be accomplished by changing the species-specific parameter values in the model template input files. Then the modeler can select an applied external dose regimen for the animal and calculate an internal dose metric by conducting a simulation with the animal PBPK model. The modeler would then use the model version parameterized with human values to compute an external dose that results in the same internal dose metric for a human. Similarly, other extrapolations can be performed using template versions of appropriately parameterized PBPK models. However, it is important to note that just as with any other PBPK model, prior to utilizing a template-based model in risk assessment, care should be taken to ensure that the model is fit for purpose. For example, a modeler who wishes to utilize a PBPK model for a point of departure (POD) derivation as part of an animal-to-human extrapolation must first consider whether the model simulates a dose metric closely associated with the endpoint of interest. Using a template implementation of a PBPK model does not guarantee that the model is appropriate for any particular purpose and the model’s suitability must still be evaluated prior to application.
Quality Assurance for Models Implemented Using the PBPK Model Template
When performing quality assurance (QA) review of a PBPK model that is being considered for use in risk assessment, both the model equations and the model parameters must be reviewed for accuracy and scientific soundness (Clark et al. 2004; IPCS 2010; Loizou et al. 2008; McLanahan et al. 2012; U.S. EPA 2018; 2020). The fact that errors have been found in the model code for a peer-reviewed, published model, as described in this paper, makes it extremely clear that a rigorous QA is needed before a model is accepted for regulatory use. Using our PBPK model template, one can streamline the process of QA review for the model equations. Once the source code that defines the equations and logic of the model template has been reviewed a single time, it can be used to implement any number of PBPK models, as long as those models do not include features unavailable in the template. That is, only the model template input files containing parameter values need to be reviewed for QA review of individual PBPK models. This decreases the overall quantity of model implementation information (i.e., source code) that must be reviewed before using a PBPK model in a chemical risk assessment.
Assessing the accuracy of model equations and their computer implementation is just one aspect of the complete QA review that should be conducted when using a PBPK model in risk assessment (IPCS 2010; U.S. EPA 2018; 2020). In order to improve the overall QA process, Tan et al. (2020) proposed a reporting template for submitting PBPK model analyses to public health agencies or for publication in journals. The reporting template includes standardized content and formats for describing a PBPK model and related analyses, but it does not give any explicit template for reporting model equations or specify recommended style guidelines for computer implementation. Our proposed model template complements this reporting template since it provides a specific set of model equations and computer code that have already undergone QA review and that fulfill the reporting template’s requirements concerning provision of model equations and software.
Quality Evaluation and Reproducibility of Published Models
Using the model template allows modelers to easily identify errors in published model equations. For the models for PFHxS, PFNA, and PFDA from Kim et al. (2018) and Kim et al. (2019), we were initially unable to replicate the published model simulations using the template code; we obtained concentration time courses of chemical in the liver that were too low. This led us to quickly discover that the blood flow from the GI tract to the liver compartment, , was not included in the blood flow leaving the liver in the original model implementations. We were then able to adjust the equations in the template versions of those models to match the published model simulation output and confirm that the incorrect outgoing liver blood flow rate was the source of the discrepancy in our results.
Even if one replicates the equations for a published model correctly, the values of all model parameters and other inputs must be known and applied in order to reproduce published model simulation results. Papers describing PBPK models often do not include all such details and, furthermore, a parameter value listed in the paper may not match that used by the authors (in their source code) to generate a given result. Therefore, in addition to the paper describing a given PBPK model, source code is usually required by modelers tasked with assuring that they have replicated a model before applying it to a chemical risk assessment. Because many authors of PBPK models have not (historically) included model code and scripts with their publications (e.g., as supplemental material), risk assessors frequently need to contact authors to request their model code. This can be a time-consuming process, and, in some cases, it is not possible to obtain the code.
Even when the primary code is available for a published model, it often does not include all the parameter values used to perform each simulation. For example, Loccisano et al. (2012) used a common model for both PFOS and PFOA, but their supplementary materials only included a full parameter description for the PFOS exposure simulations for male rats. However, they also showed simulations for female rats exposed to PFOS and simulations for both male and female rats exposed to PFOA. For the scenarios involving doses of PFOA, body weight data is missing from the information describing the simulations in the paper, making it difficult to reproduce their results. Presumably these details are in model scripts (i.e., the sets of commands written in files that supplement the primary model file) that are not provided in the supplemental material. Figure 10 illustrates this point, as it shows a considerably larger discrepancy between published model output (Loccisano et al. 2012) and the output of our template implementation than was seen for the other models we examined (for which source code and full listings of parameter values were available).
When attempting to reproduce model results, one will often find that there are discrepancies between published and reproduced results. (We saw this, for example, when we used our model template to reproduce the results of the Loccisano et al. (2012) PFOA plasma concentration simulations (cf. Figure 10).) Generally, these small discrepancies would not be a reason for disqualifying the model. Even larger discrepancies such as those seen with the models for PFHxS, PFNA, and PFDA from Kim et al. (2018) and Kim et al. (2019) (due to the error in liver blood flow) might not remove a model from consideration if it can be easily recalibrated to correct the error. Peer-reviewed PBPK models can be valuable tools for chemical risk assessment (IPCS 2010; U.S. EPA 2006), so we contend that it is worthwhile to expend some effort correcting minor errors that might be identified in such models. However, if the error is such that the model cannot be adjusted to adequately represent the data in a timely manner, then it might be considered insufficient for regulatory use. In that situation, one could ask whether the corrected model meets the criteria for use (IPCS 2010; U.S. EPA 2018; 2020) given the fact that it fits some or all of the data poorly when applied in its “corrected” form.
Limitations of the Template
When performing QA review of models, risk assessors must consider both the model equations and structure as well as the input parameter values. The template approach decreases the time needed to review the model equations by having a pre-reviewed set of equations available for use. Risk assessors must still provide the input parameter values, and those values must be reviewed as part of the QA process. If inaccurate or incorrect parameter values are supplied, simulation results produced through the template approach will be flawed. Also, the model template does not enforce any restrictions on the parameter values supplied by users, and so the template approach does not protect against use of parameter values that are not physically or biologically appropriate. Similarly, the template approach does not prevent modelers from using insufficient data to estimate parameter values (i.e., more than one set of estimated parameter values may fit the data equally well, so the parameters are not uniquely identified) and these aspects of model development must still be assessed as part of a QA process.
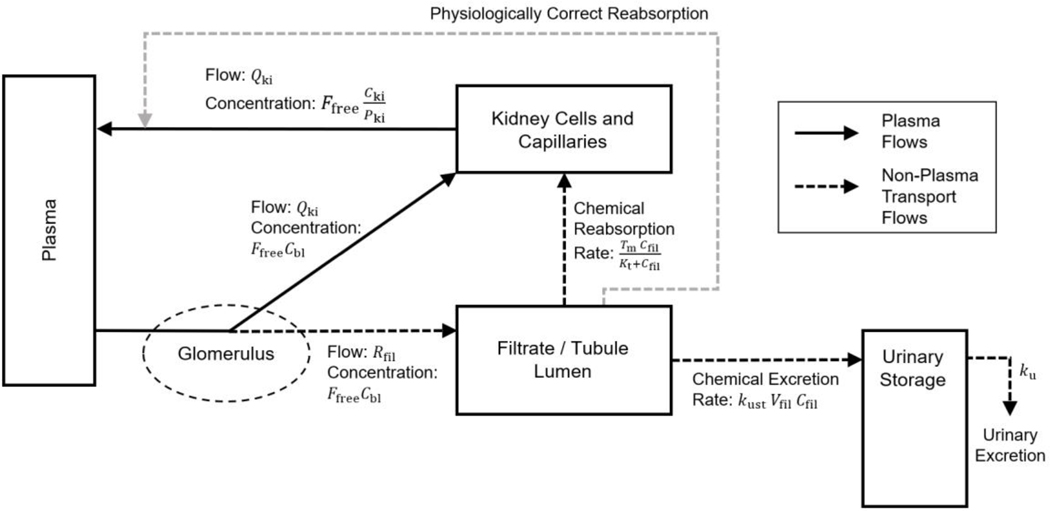
The model of the kidney currently used in the template is structured to match (encompass) all the PBPK models we sought to replicate. However, that mathematical description does not appear to be completely accurate. A more physiologically accurate model of filtration and reabsorption in the kidney is shown in Figure 12. In the kidney, blood flows from the renal artery through the glomerulus, where water and other substances are filtered into the tubule lumen. This filtrate then flows through the tubule lumen where much of the water and some substances are reabsorbed out of tubular urine and returned to capillary blood surrounding the tubule. Tubular secretion, in which substances are transported into the tubular urine from surrounding blood and tubular cells, may also occur in this region (Tanner 2009), however none of the existing PFAS models include such secretion (Fàbrega et al. 2015; Kim et al. 2019; Kim et al. 2018; Loccisano et al. 2012), and therefore it is not indicated in the figure.
Figure 12.
A schematic diagram depicting flows of material through the kidney. This schematic compares what is implemented in the model template (shown by the darker arrows) with a more accurate description of the physiology (shown by the lighter arrows). Chemical in the plasma compartment passes through the glomerulus which filters out water and other substances into the tubule lumen with a flow rate while the remaining blood plasma flows to the kidney cells and capillaries at blood flow rate . From the tubule lumen, the filtrate can be reabsorbed by a saturable process with maximum transport rate and affinity constant or eliminated to the urinary storage compartment by a first-order process with a rate constant . In the model template, this reabsorbed chemical is added to the amount in the kidney cells and capillaries compartment, as shown by the darker dashed arrow. A more biologically accurate description would have this reabsorbed chemical flow into venous capillaries not the kidney cells, as shown by the lighter dashed arrow from the filtrate/tubular lumen to the solid arrow representing blood plasma leaving the kidney cells and capillaries.
The published models for PFAS, as well as the model template we created to reproduce them, all assume that chemical mass reabsorbed from the filtrate enters the “kidney cells and capillaries” compartment. This representation of reabsorption is shown with the darker dashed arrow in Figure 12 from the “filtrate / tubular lumen” compartment to the “kidney cells and capillaries” compartment. However, reabsorbed tubular fluid (and actively transported substances) actually flow into venous capillaries and thus, for complete biological realism, should not be treated as traveling to the kidney tissue but instead as joining with the renal venous blood flow on its way to the central plasma compartment. In Figure 12, the lighter dashed arrow from the “filtrate / tubular lumen” compartment to the solid arrow representing blood plasma leaving the “kidney cells and capillaries” compartment therefore represents the correct physiology.
Some PBPK models also include empirical time-dependent functions in order to test hypotheses or allow models to match pharmacokinetic data, such as the expression Loccisano et al. (2012) included for the free fraction in the PFOS model. It would be impossible to code all possible variations of such expressions; rather, such parameters can be treated as input parameters and provided as tables of values. This method uses an approximation of the time-dependent function, so care must be taken to ensure that a given table has sufficient resolution (i.e., a large enough number of time points) to provide a good approximation. Furthermore, this method can only be used for functions that are dependent on time, and not dependent on any of the other state variables within the model.
Future Development of the Template
The PBPK model template described herein currently has equations relevant to the pharmacokinetic behavior of perfluorinated chemicals, but we plan to add features to the template to accommodate published PBPK models for other classes of chemicals. The current model template does not include metabolic pathways because these are not a major route of elimination for PFAS, but for many substances metabolism in liver, lung, and other tissues is an important determinant of pharmacokinetic behavior and toxicity prediction. Therefore, we intend to extend the model by adding metabolic pathways, as well as the capability to track both a parent compound and one or more metabolites. Similarly, our model template equations for the liver and GI tract do not include expressions for enterohepatic recirculation, a process that is represented in some PBPK models, nor does the current template include equations and logic to allow for menstruation and lactation, which are excretion pathways that have been included in other PBPK models, including for some PFAS models. We plan to include enterohepatic recirculation, menstruation, and lactation processes in a future version of our model template. Extending the model template to describe life-stage-related (time-dependent) variation in physiology (e.g., changes related to pregnancy) will require a significant effort, while terms for blood loss or lactational transfer should be relatively simple to implement. Finally, the model template currently only allows for oral and IV dosing, but inhalation is a critical exposure route for many PBPK models. In the future, we plan to implement inhalation and dermal absorption as routes of exposure in the PBPK model template.
The source code for the model template is currently available through the U.S. Environmental Protection Agency’s Environmental Dataset Gateway (DOI: 10.23719/1520081) along with the scripts and data files necessary to perform the simulations described herein. This model code can be downloaded, used, and modified by modelers who wish to use the template for their own applications. We have included instructional files with the code and the simulation scripts can be used as examples. We will continue to make updates to the template structure and accompanying scripts to implement additional features and release new versions via a series of future publications. Each iteration of the model template will undergo an extensive internal QA process before release. Additionally, models that are used in published risk assessments undergo review by external review panels and review by scientific advisory boards. We invite users to suggest features they would like to see implemented. Over time we want to make the model template more adaptable by adding a sufficiently complete set of common PBPK model features so that modelers can focus on identifying parameters rather than revising the model template structure to meet their needs.
Conclusions
The PBPK model template we have presented allows risk assessors to quickly implement a set of published models because review of the general model equations underlying all the models only needs to occur once. We have shown that we can successfully recreate the published results for four different PFAS PBPK models with high accuracy and a fifth PFAS PBPK model (PFOA) with moderate accuracy using our model template, and furthermore, the model template allowed us to quickly identify errors in some of the published models. Continued improvements to the model template will extend our ability to recreate published PBPK models, and this will accelerate QA review for PBPK models describing a wider variety of substances.
Supplementary Material
Acknowledgements
This project was supported in part by an appointment (A.S.B.) to the Research Participation Program at the Center for Public Health and Environmental Assessment, U.S. Environmental Protection Agency, administered by the Oak Ridge Institute for Science and Education through an interagency agreement between the U.S. Department of Energy and EPA. The authors would like to acknowledge Alan Sasso and John Wambaugh for their careful review of an early draft of this manuscript.
Footnotes
Conflicts of Interest
The authors declared no potential conflicts of interest with respect to the research, authorship, and/or publication of this article.
Disclaimer: The views expressed in this manuscript are those of the authors and do not necessarily represent the views or policies of the U.S. Environmental Protection Agency.
References
- Bois FY. 2009. Gnu mcsim: Bayesian statistical inference for sbml-coded systems biology models. Bioinformatics. 25(11):1453–1454. [DOI] [PubMed] [Google Scholar]
- Brightman FA, Leahy DE, Searle GE, Thomas S. 2006. Application of a generic physiologically based pharmacokinetic model to the estimation of xenobiotic levels in rat plasma. Drug Metab Dispos. 34(1):84–93. [DOI] [PubMed] [Google Scholar]
- Clark LH, Setzer RW, Barton HA. 2004. Framework for evaluation of physiologically-based pharmacokinetic models for use in safety or risk assessment. Risk Anal. 24(6):1697–1717. [DOI] [PubMed] [Google Scholar]
- Fàbrega F, Kumar V, Benfenati E, Schuhmacher M, Domingo JL, Nadal M. 2015. Physiologically based pharmacokinetic modeling of perfluoroalkyl substances in the human body. Toxicol Environ Chem. 97(6):814–827. [Google Scholar]
- IPCS. 2010. Characterization and application of physiologically based pharmacokinetic models in risk assessment. Geneva, Switzerland: World Health Organization. No. Harmonization Project Document No 9. [Google Scholar]
- Jongeneelen F, ten Berge W. 2012. Simulation of urinary excretion of 1-hydroxypyrene in various scenarios of exposure to polycyclic aromatic hydrocarbons with a generic, cross-chemical predictive pbtk-model. Int Arch Occup Environ Health. 85(6):689–702. [DOI] [PubMed] [Google Scholar]
- Jongeneelen FJ, Ten Berge W. 2011. A generic, cross-chemical predictive pbtk model with multiple entry routes running as application in ms excel; design of the model and comparison of predictions with experimental results. Ann Occup Hyg. 55(8):841–864. [DOI] [PubMed] [Google Scholar]
- Kemper R. 2003. Perfluooctanoic acid: Toxicokinetics in the rat. Kemper R. No. DuPont 7473. [Google Scholar]
- Kim SJ, Choi EJ, Choi GW, Lee YB, Cho HY. 2019. Exploring sex differences in human health risk assessment for pfna and pfda using a pbpk model. Arch Toxicol. 93(2):311–330. [DOI] [PubMed] [Google Scholar]
- Kim SJ, Shin H, Lee YB, Cho HY. 2018. Sex-specific risk assessment of pfhxs using a physiologically based pharmacokinetic model. Arch Toxicol. 92(3):1113–1131. [DOI] [PubMed] [Google Scholar]
- Kudo N, Sakai A, Mitsumoto A, Hibino Y, Tsuda T, Kawashima Y. 2007. Tissue distribution and hepatic subcellular distribution of perfluorooctanoic acid at low dose are different from those at high dose in rats. Biol Pharm Bull. 30(8):1535–1540. [DOI] [PubMed] [Google Scholar]
- Loccisano AE, Campbell JL Jr, Butenhoff JL, Andersen ME, Clewell HJ III. 2012. Comparison and evaluation of pharmacokinetics of pfoa and pfos in the adult rat using a physiologically based pharmacokinetic model. Reprod Toxicol. 33(4):452–467. [DOI] [PubMed] [Google Scholar]
- Loizou G, Spendiff M, Barton HA, Bessems J, Bois FY, d’Yvoire MB, Buist H, Clewell HJ, Meek B, Gundert-Remy U et al. 2008. Development of good modelling practice for physiologically based pharmacokinetic models for use in risk assessment: The first steps. Regul Toxicol Pharmacol. 50(3):400–411. [DOI] [PubMed] [Google Scholar]
- McLanahan ED, El-Masri HA, Sweeney LM, Kopylev LY, Clewell HJ, Wambaugh JF, Schlosser PM. 2012. Physiologically based pharmacokinetic model use in risk assessment--why being published is not enough. Toxicol Sci. 126(1):5–15. [DOI] [PubMed] [Google Scholar]
- Mumtaz M, Fisher J, Blount B, Ruiz P. 2012a. Application of physiologically based pharmacokinetic models in chemical risk assessment. J Toxicol. 2012:11. [DOI] [PMC free article] [PubMed] [Google Scholar]
- Mumtaz MM, Ray M, Crowell SR, Keys D, Fisher J, Ruiz P. 2012b. Translational research to develop a human pbpk models tool kit-volatile organic compounds (vocs). J Toxicol Environ Health A. 75(1):6–24. [DOI] [PMC free article] [PubMed] [Google Scholar]
- Pearce RG, Setzer RW, Strope CL, Sipes NS, Wambaugh JF. 2017. Httk: R package for high-throughput toxicokinetics. J Stat Softw. 79(4):1–26. [DOI] [PMC free article] [PubMed] [Google Scholar]
- Perkins RG, Butenhoff JL, Kennedy GL, Palazzolo MJ. 2004. 13-week dietary toxicity study of ammonium perfluorooctanoate (apfo) in male rats. Drug Chem Toxicol. 27(4):361–378. [DOI] [PubMed] [Google Scholar]
- R Core Team. 2019. R: A language and environment for statistical computing. Vienna, Austria: R Foundation for Statistical Computing. [Google Scholar]
- Rohatgi A. 2019. Webplotdigitizer. 4.2 ed. Austin, TX. [Google Scholar]
- Ruiz P, Fowler BA, Osterloh JD, Fisher J, Mumtaz M. 2010. Physiologically based pharmacokinetic (pbpk) tool kit for environmental pollutants–metals. SAR QSAR Environ Res. 21(7–8):603–618. [DOI] [PubMed] [Google Scholar]
- Ruiz P, Ray M, Fisher J, Mumtaz M. 2011. Development of a human physiologically based pharmacokinetic (pbpk) toolkit for environmental pollutants. International Journal of Molecular Sciences. 12(11):7469–7480. [DOI] [PMC free article] [PubMed] [Google Scholar]
- Tan YM, Chan M, Chukwudebe A, Domoradzki J, Fisher J, Hack CE, Hinderliter P, Hirasawa K, Leonard J, Lumen A et al. 2020. Pbpk model reporting template for chemical risk assessment applications. Regul Toxicol Pharmacol. 115:104691. [DOI] [PMC free article] [PubMed] [Google Scholar]
- Tanner G. 2009. Kidney function. In: Rhoades RA, Bell DR, editors. Medical physiology: Principles for clinical medicine. 3 ed. Philadelphia, PA: Lippincott Williams & Wilkins. p. 391–418. [Google Scholar]
- U.S. EPA. 2006. Approaches for the application of physiologically based pharmacokinetic (pbpk) models and supporting data in risk assessment (final report). Washington, DC: U.S. Environmental Protection Agency, Office of Research and Development, National Center for Environmental Assessment. EPA Report No. EPA/600/R-05/043F. [Google Scholar]
- U.S. EPA. 2018. An umbrella quality assurance project plan (qapp) for pbpk models. Research Triangle Park, NC. EPA Report No. ORD QAPP ID No: B-0030740-QP-1–1. [Google Scholar]
- U.S. EPA. 2020. Umbrella quality assurance project plan (qapp) for dosimetry and mechanism-based models. Research Triangle Park, NC. No. EPA QAPP ID Number: L-CPAD-0032188-QP-1–2. [Google Scholar]
Associated Data
This section collects any data citations, data availability statements, or supplementary materials included in this article.


