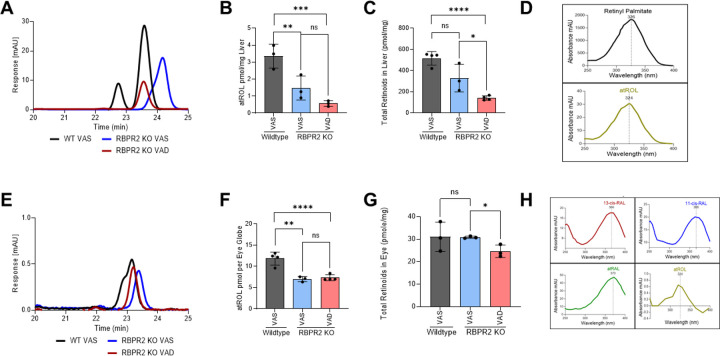
Figure 2: Quantification of all-trans ROL and total retinoids in mice tissue at 3-months of age.
High performance liquid chromatography (HPLC) analysis and quantification of all-trans ROL and total retinoid content in the liver (A-C), and eyes (E-G), isolated from WT and Rbpr2−/− mice at 3-months of age on VAS or VAD diets. Absorbance peaks of individual retinoids in the liver (D) and eye (H). Values are presented as ±SD. Student t-test, *p<0.05; **p<0.005; ***p<0.001; ****p<0.0001. VAS, vitamin A sufficient diet; VAD, vitamin A deficient diet; WT, wild-type mice. n=3–4 animals per group.

