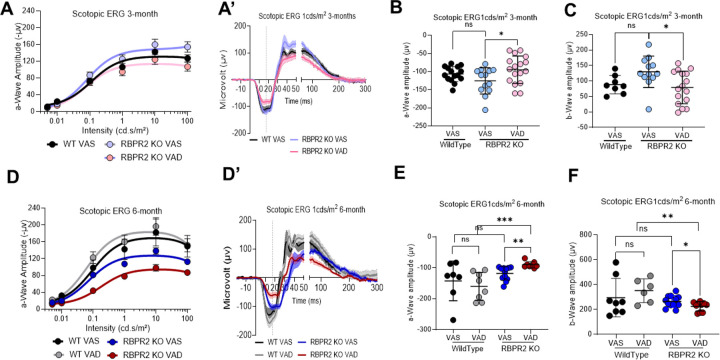
Figure 5: Rod photoreceptor cell functional analysis by Electroretinogram (ERG).
Photopic ERG responses of WT and Rbpr2−/− mice at 3-months (A-C) and 6-months (D-F) of age fed either a VAS or VAD diet, showing the dark-adapted ERG responses of rod photoreceptor cell function by a-wave amplitudes (B, E) and inner neuronal bipolar cell function by b-wave amplitude (C, F). Values are presented as ±SD. Student t-test, *p<0.05; **p<0.005; ***p<0.001. VAS, vitamin A sufficient diet; VAD, vitamin A deficient diet; WT, wild-type mice. n=8–17 animals per group at 3-months of age; n=6–11 animals per group at 6-months of age.

