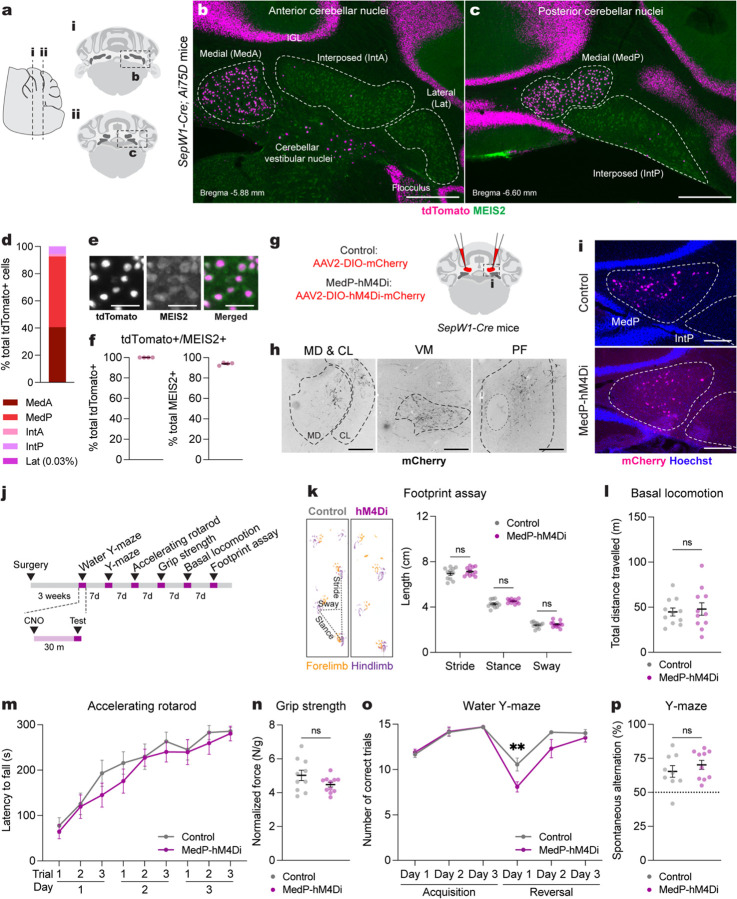
Fig. 1 |. Acute adult chemogenetic inhibition of MedP eCN impairs reversal learning and not motor behaviors.
a, Schematic representation of a lateral sagittal plane of the mouse cerebellum on the left with vertical lines (i and ii) indicating the location of the anterior and posterior coronal schematics shown to right.
b,c, Representative coronal images of tdTomato expression in the anterior CN (b) and posterior (c) CN of SepW1-Cre; Ai75D mice. CN were subdivided into five subregions based on histological distinctions (Paxinos and Franklin, 2007) and MEIS2 immunostaining. Abbreviations: MedA=Anterior medial; MedP=Posterior medial; IntA=Anterior interposed; IntP=Posterior interposed; Lat=Lateral. Scale bars = 500 um.
d, Quantification of tdTomato+ cells on every second coronal section of SepW1-Cre; Ai75D mice (n=4) in the lateral CN (Lat) and subregions of the intermediate (Int) and medial (Med) CN (n=4 mice).
e, Representative image of tdTomato (magenta) and MEIS2 (green) co-expressing eCN in SepW1-Cre; Ai75D mice. Scale bars = 50 um.
f, Quantification of tdTomato+ cells that co-express MEIS2 and the reverse in SepW1-Cre; Ai75D mice (n=4 mice).
g, Schematic of viral injection to express mCherry (control) or hM4Di-mCherry (MedP-hM4Di) in adult MedP eCN. Dashed line indicates region shown in (i).
h, Representative images of MedP eCN mCherry+ axon terminals (black) in four thalamic nuclei of control mice. Fluorescent images were inverted using the look up table in Fiji. Abbreviations: MD=mediodorsal; CL=centrolateral; VM=ventromedial; PF=parafascicular. Scale bars = 250 um.
i, Representative images of viral mCherry expression in MedP eCN in control (top, AAV-DIO-mCherry) and MedP-hM4Di (bottom, AAV-DIO-hM4Di-mCherry) mice. Scale bars = 250 um.
j, Experimental timeline of surgery, CNO injection and behavioral tests.
k, (left) Representative images of footprints from control and MedP-hM4Di mice. (right) quantification of stride, stance, and sway (n=11 per group). Multiple Mann-Whitney U tests for effect of genotype on stride (U = 48, P = 0.4385), stance (U = 34, P = 0.0843) and sway (U = 58, P = 0.8851).
l, Total distance travelled during basal locomotion (n=11 per group; t20 = 0.3910, P = 0.7000).
m, Latency to fall during the accelerating rotarod test (MedP-hM4Di: n=11, control: n=10). Repeated measure two-way ANOVA: main effect of time (F4.750,90.25 = 27.51, P < 0.0001), but not of chemogenetics (F1,19 = 0.9367, P = 0.3453) or interaction (F5,152 = 0.3699, P = 0.9351).
n, Forelimb grip strength normalized to body weight (MedP-hM4Di: n=11, control: n=10; two-tailed unpaired t-test: t19 = 1.677, P = 0.1099).
o, Total number of correct trials during the water Y-maze test (MedP-hM4Di: n=10, control: n=9). Repeated measure two-way ANOVA: main effect of time (F5,85 = 27.65, P < 0.0001) and chemogenetics (F1,17 = 9.855, P = 0.006), but not of interaction (F5,85 = 2.257, P = 0.0559); with post hoc two-tailed t-tests with Šídák correction for effect of chemogenetics on Reversal Day 1 (t102 = 3.386, P = 0.006), and not other comparisons (P ≥ 0.05).
p, Percentage spontaneous alternations in the Y-maze (MedP-hM4Di: n=10, control: n=9; two-tailed unpaired t-test: t17 = 0.9024, P = 0.3794).
ns, not significant: P ≥ 0.05. Data are presented as mean values ± SEM.

