

Abstract
Background
The running performance of middle-distance and long-distance runners is determined by factors such as maximal oxygen uptake (VO2max), velocity at VO2max (vVO2max), maximum metabolic steady state (MMSS), running economy, and sprint capacity. Strength training is a proven strategy for improving running performance in endurance runners. However, the effects of different strength training methods on the determinants of running performance are unclear.
Objective
The aim of this systematic review with meta-analysis was to compare the effect of different strength training methods (e.g., high load, submaximal load, plyometric, combined) on performance (i.e., time trial and time until exhaustion) and its determinants (i.e., VO2max, vVO2max, MMSS, sprint capacity) in middle-distance and long-distance runners.
Methods
A systematic search was conducted across electronic databases (Web of Science, PubMed, SPORTDiscus, SCOPUS). The search included articles indexed up to November 2022, using various keywords combined with Boolean operators. The eligibility criteria were: (1) middle- and long-distance runners, without restriction on sex or training/competitive level; (2) application of a strength training method for ≥ 3 weeks, including high load training (≥ 80% of one repetition maximum), submaximal load training (40–79% of one repetition maximum), plyometric training, and combined training (i.e., two or more methods); (3) endurance running training control group under no strength training or under strength training with low loads (< 40% of one repetition maximum); (4) running performance, VO2max, vVO2max, MMSS and/or sprint capacity measured before and after a strength training intervention program; (5) randomized and non-randomized controlled studies. The certainty of evidence was assessed using the GRADE (Grading of Recommendations Assessment, Development and Evaluation) approach. A random-effects meta-analysis and moderator analysis were performed using Comprehensive meta-analysis (version 3.3.0.70).
Results
The certainty of the evidence was very low to moderate. The studies included 324 moderately trained, 272 well trained, and 298 highly trained athletes. The strength training programs were between 6 and 40 weeks duration, with one to four intervention sessions per week. High load and combined training methods induced moderate (effect size = − 0.469, p = 0.029) and large effect (effect size = − 1.035, p = 0.036) on running performance, respectively. While plyometric training was not found to have a significant effect (effect size = − 0.210, p = 0.064). None of the training methods improved VO2max, vVO2max, MMSS, or sprint capacity (all p > 0.072). Moderators related to subject (i.e., sex, age, body mass, height, VO2max, performance level, and strength training experience) and intervention (i.e., weeks, sessions per week and total sessions) characteristics had no effect on running performance variables or its determinants (all p > 0.166).
Conclusions
Strength training with high loads can improve performance (i.e., time trial, time to exhaustion) in middle-distance and long-distance runners. A greater improvement may be obtained when two or more strength training methods (i.e., high load training, submaximal load training and/or plyometric training) are combined, although with trivial effects on VO2max, vVO2max, MMSS, or sprint capacity.
Supplementary Information
The online version contains supplementary material available at 10.1007/s40279-024-02018-z.
Key Points
| Strength training with high loads (≥ 80% of one repetition maximum) can improve time trial and time to exhaustion running performance. |
| The combination in a program of two or more strength training methods (i.e., high loads, submaximal loads [40–79% of one repetition maximum], and/or plyometric training) may induce greater running performance improvement compared with one method alone. |
| Maximal oxygen consumption, velocity at maximal oxygen consumption, maximum metabolic steady state, and sprint capacity exhibited trivial changes after strength training. |
| The results are based on 38 studies and 894 (651 male individuals and 243 female individuals) middle-distance and long-distance runners, aged between 17 and 40 years, with a very low to moderate certainty of evidence. |
Introduction
In middle-distance (800–3000 m) and long-distance running (5000 m to marathon) races, performance is determined by factors such as maximal oxygen uptake (VO2max), velocity at VO2max (vVO2max), maximum metabolic steady state (MMSS), running economy [1–3], and sprint capacity [4]. Indeed, VO2max has long been used as a primary measure of an individual’s cardiorespiratory fitness, and as a marker of training effect [5]. The interplay between VO2max and running economy determines vVO2max [2, 6], whereas the MMSS (e.g., second lactate threshold) establishes the limit of steady-state muscle metabolism [20]. Running economy, defined as the amount of energy required for running at submaximal speeds [7], may differentiate running performance in athletes with similar VO2max levels [8], and sprint capacity can influence races that require changes of pace [9] or a final sprint [4].
The implementation of strength training (ST) can improve the performance in middle-distance and long-distance runners [10–14]. However, previous meta-analyses have focused mainly on running economy [11–13] and time trial running performance [13], without exploring the effects of ST on other determinants of performance (i.e., VO2max, vVO2max, and sprint capacity). For example, it has been found that ST could induce a trivial effect on VO2max in endurance athletes [15]. In addition, the incorporation of diverse ST methods has demonstrated improvements in running economy among endurance runners [10–13, 16]. Moreover, ST may improve anaerobic and neuromuscular characteristics (e.g., sprint capacity) [3]. These changes may be manifested in factors influenced by these variables, such as vVO2max [2, 6].
Strength training is a versatile method of exercise that can be customized by the manipulation of factors such as intensity, volume, inter-set rest, frequency, type and sequence of exercise, and speed of movement [17]. For instance, by manipulating the load (i.e., intensity) ST may be classified as high load training (HL, i.e., ≥ 80% of 1 repetition maximum [1RM]), submaximal load training (SubL, i.e., 40–79% 1RM), or plyometric training (PL, i.e., jump-based training with light or no loads) [18, 19]. Each of these ST methods target a specific outcome such as maximal strength, strength at submaximal loads with higher speed of movements, or stretch–shortening cycle and muscle–tendon stiffness, respectively [18]. Therefore, the effect of ST on performance and its determinants may vary depending on the specific characteristics of each ST method [14, 19]. For example, ST has shown improvements in fixed blood lactate after PL [20] and blood lactate concentration at 16 km/h after a combined HL and PL intervention [21]. However, some studies have not shown any improvement in MMSS [22–24].
The concerns described above may be related to the small number of studies that have compared ST methods, with most studies simply comparing standard running training protocols to ST. A comparison of different ST methods can entail highly complex logistical planning for researchers, meaning it is not always feasible to carry out. However, a systematic review with meta-analyses may offer a viable alternative to addressing such methodological challenges by combining studies that utilise different ST methods, thus enabling their comparison. Although some systematic reviews with meta-analyses have been published involving runners [10–14], a more comprehensive understanding of the effects of ST methods on endurance running performance (i.e., time trial and time to exhaustion) and its other determinants (e.g., VO2max, vVO2max, MMSS, sprint capacity) is needed.
Based on the above, the aim of this systematic review with meta-analysis was to analyze the effect of different ST methods (e.g., HL, SubL, PL, combined training) on running performance (i.e., time trial and time until exhaustion) and its determinants (i.e., VO2max, vVO2max, MMSS, sprint capacity) in middle-distance and long-distance runners.
Methods
The 2020 PRISMA (Preferred Reporting Items for Systematic Reviews and Meta-Analyses) guidelines [25] were followed for this systematic review and meta-analysis. The original protocol was registered on the Open Science Framework before the data analysis (https://osf.io/gyeku).
Information Sources and Search Strategy
Multiple databases including PubMed, Web of Science (all databases), Scopus, and SPORTDiscus were searched using various search terms and Boolean operators (Table S1 of the Electronic Supplementary Material [ESM]). All articles indexed up to January 2022 were included for selection. The search was updated in November 2022 with notifications of new studies found in the previously searched databases. No restrictions were placed on databases regarding study design, date, language, age, or sex of the participants. Additionally, the reference lists of relevant reviews, systematic reviews, and meta-analyses were reviewed, as well as the reference lists of the articles included in the analysis.
Selection Process
Two reviewers (LL and SV) reviewed all titles and abstracts obtained from the databases. When the titles and abstracts suggested that the article might meet the inclusion criteria (Table 1), the full article was reviewed. In the case of disagreement between the two reviewers, a third reviewer (RC) was consulted.
Table 1.
Inclusion and exclusion criteria for meta-analysis
| Category | Inclusion criteria | Exclusion criteria |
|---|---|---|
| Population | Amateur and competitive middle-distance and long-distance runners (i.e., running distances ≥ 1500 m), aged > 16 years, without restriction to sex or training/competitive level | Subject with injuries, comorbidities, or non-runner endurance athletes |
| Intervention | A strength training program (i.e., HL, SubL, PL, or a combination of them) which was in addition to, or in partial replacement (i.e., matched training load) of endurance running training, lasting ≥ 3 weeks, with ≥ 1 weekly session | The program includes alternative methods in addition to strength training (e.g., electrical stimulation or body vibration), and/or nutritional supplements (e.g., creatine) |
| Comparator | Control group that performed endurance running training but did not receive strength training or received it with low loads (< 40% 1RM or > 20RM) | Absence of control group |
| Outcome | VO2max, vVO2max, maximum metabolic steady state, sprint capacity and/or running performance was recorded before and after the strength training intervention | Baseline and/or follow-up data not available |
| Study design | Randomised and non-randomized controlled studies | Cross-sectional, observational, or case studies |
1RM one repetition maximum, HL high load training, PL plyometric training, RM repetition maximum, SubL submaximal load training, VO2max maximal oxygen uptake, vVO2max velocity at VO2max
Data Collection Process
Data were collected by an independent reviewer (LL), including subject characteristics, methodological data, endurance training, ST intervention, and main outcomes for further analysis. In those articles where only data in the form of figures were presented, the validated WebPlotDigitizer software (Version 4.5; Ankit Rohatgi, Pacifica, CA, USA) [26] was used to extract the data. The reviewers (LL, SV, and RC) discussed the extracted data collectively and discussed any disagreements or controversial data after recoding.
Eligibility Criteria
Studies were eligible for inclusion according to the PICOS criteria (Participants, Intervention, Comparator, Outcome, and Study design; Table 1).
Participants
Subjects over 16 years of age were included in the study, as puberty may influence the adaptive response to training because of hormonal changes that occur during this period [27]. Strength training experience was classified as either experienced or not experienced in ST based on the information provided by each study. The initial VO2max level was recorded, further categorized by performance level into moderately trained (male individuals ≤ 55 mL/kg/min, female individuals ≤ 45 mL/kg/min), well trained (male individuals 55–65 mL/kg/min, female individuals 45–55 mL/kg/min), or highly trained (≥ 65 mL/kg/min, ≥ 55 mL/kg/min) [28]. When male and female performance levels were not distinguished, ranges were established by averaging the values of both sexes for each respective performance level. If initial VO2max values were not recorded, performance level was determined according to the participant’s level of competition (moderately trained = recreational or local club level; well trained = collegiate or provincial level; highly trained = national or international level) [19].
ST Intervention
Strength training methods were classified according to the training target and training load [18, 19] as follows: (1) HL, defined as programs aiming to improve maximal strength development by performing exercises with high loads (e.g., barbell squat at ≥ 80% 1RM or ≤ 7RM); (2) SubL, defined as programs aiming to improve strength development using exercises with moderate-to-low loads (e.g., maximal power load at 40–79% 1RM or 8–20RM; usually with maximal movement velocity intention); (3) PL, defined as programs aiming to improve stretch–shortening cycle functioning using exercises with light loads or body weight (e.g., jump-based training); and (4) combined training (Combined), defined as programs that included two or more ST methods. The groups that performed ST with very low loads (VL, < 40% 1RM or > 20RM) were considered as a control group. The duration of the intervention was recorded as total weeks, sessions per week, and total number of sessions.
Outcome Measurements
Maximal oxygen uptake, vVO2max, MMSS, sprint capacity, and running performance were recorded before and after the ST interventions. Maximum metabolic steady state was considered if measured as: maximal lactate steady state, second lactate threshold, onset of blood lactate accumulation, lactate turn point, critical speed, or second ventilatory threshold. Sprint capacity was measured as the speed in meters (m/s) or time to cover a distance (s), in efforts where energy resources have been released mainly from glycolysis and phosphates [29]. Running performance was measured by a time trial or time to exhaustion in runs of more than 75 s, where aerobic metabolism predominates [30]. If running performance was measured in more than one test (e.g., 1500 m and 10,000 m), the most similar test between studies was selected. For all outcomes, where the study reported multiple timepoints (i.e., more than two data points), the first record and the last record immediately after the intervention were recorded.
Risk of Bias, Publication Bias, and Certainty Assessment
The risk of bias of the studies was assessed using the PEDro (Physiotherapy Evidence Database) scale [31, 32], with items 5–7 removed in consideration of the lack of blinding of subjects, assessors, and researchers in supervised exercise interventions [31, 33]. Based on previous criteria [33], the studies were categorized as low risk (≥ 6 points), moderate risk (4–5 points), and high risk (≤ 3 points). To assess the publication bias of the studies on each ST method, a funnel plot was constructed, indicating a publication bias if an asymmetry was observed.
The GRADE (Grading of Recommendations Assessment, Development and Evaluation) approach was used to evaluate the certainty of evidence [34–36]. High certainty of evidence was initially assumed and then downgraded based on the following criteria: risk of bias, downgraded by one or two levels if the median PEDro score was indicative of moderate risk (< 6 points) or high risk (< 4 points), respectively; inconsistency, downgraded by one level if the Cochrane Q test for heterogeneity was significant (i.e., p < 0.05); indirectness, considered low risk, as the PICOS criteria were ensured; imprecision, downgraded by one level if the number of participants in the control group with the ST group was < 800 or if the confidence interval (CI) was crossed by a small effect size)ES) [i.e., − 0.15 to 0.15]; publication bias, downgraded by one level if an asymmetry was observed in the funnel plot.
Effect Measures
A standardized mean difference between groups (i.e., control-experimental) was calculated as previously recommended [37]. Effect size was calculated as Hedges’ g corrected for sample size [38] to help deal with small samples [39], which are recurrent in the sport science literature [40]. Where studies reported data as mean and standard error (SE), the standard deviation (SD) was calculated from the SE [41]. The criteria for determining the ES magnitude were established as follows: 0.15, 0.45, and 0.80 for a small, moderate, and large effect, respectively [42].
Synthesis Methods
A meta-analysis was performed for each ST method (i.e., HL, SubL, PL, or Combined) for each of the main outcomes (i.e., VO2max, vVO2max, MMSS, sprint capacity, and running performance) when at least three studies provided an outcome measure [16]. If a study had two or more comparison groups in the same analysis, the sample size of the control group was divided by the number of intervention groups [41]. Because of multiple sources of variation between studies (e.g., training and participant characteristics), a randomized effect model with a restricted maximum likelihood estimation method was conducted for estimating the parameters model (τ2) recommended over the traditional DerSimonian and Laird method for continuous data [43]. We based the test statistic and CIs in t-distribution with a Knapp and Hartung adjustment [44].
To examine heterogeneity between studies, the Cochrane Q test was accompanied by the value of I2 to quantify the effect of heterogeneity, with values of < 25%, 25–75%, and > 75% indicating low, moderate, and high levels of heterogeneity, respectively [41]. Outliers were defined as an ES in which the upper limit of the 95% CI was lower than the lower limit of the pooled effect CI or the lower limit of the 95% CI was higher than the upper limit of the pooled effect CI [45]. A sensitivity analysis was then performed with and without the outlier ES to assess their impact on the analysis [45] (i.e., p value from Q test).
A moderator analysis was performed to explore factors associated with ES (e.g., subject characteristics; ST intervention characteristics) if at least eight studies were pooled [46, 47], through meta-regression (i.e., age, body mass, height, initial VO2max, weeks, sessions per week, and total sessions) and sub-group analysis (i.e., sex, performance level, and ST experience). Alpha was set as 0.05. A Comprehensive meta-analysis (Version 3.3.0.70) was used for the analysis and GraphPad Prism 9 (Version 9.2.0) was used to generate the plots.
Results
Study Selection
The search strategy identified a total of 1749 records (Fig. 1). After removing duplicate records, records not retrieved, and documents excluded after reading the title and/or abstract, 73 studies were assessed for eligibility. Upon full-text reading, 35 studies were excluded because of the following reasons: participants aged under 16 years [48–53] or injured before the intervention [54–56]; no comparator group [57–66]; ST method considered not includable (e.g., core strength training; flywheel and isokinetic eccentric training; local muscular endurance training) [67–72]; no relevant outcomes included (i.e., VO2max, vVO2max, MMSS, sprint capacity, running performance) [73–76]; repeated outcome results derived from secondary analysis publications [77–80]; or cross-sectional study [81, 82]. As a result, 38 studies were included in the meta-analyses.
Fig. 1.

Flow diagram of the studies selection process. ST strength training, WOS Web of Science, *studies found from notifications of new studies found in the search strategy in the different databases, **studies found in the reference lists of articles, reviews, systematic reviews, and meta-analyses retrieved from our search strategy
Study Characteristics
The studies included in the meta-analysis are presented in Table 2 for the characteristics of the participants and the interventions, and in Table 3 for the outcome results included in meta-analyses. Thirty-eight studies were included in at least one analysis: 31 studies measured VO2max [3, 20–24, 83–107]; 15 studies measured vVO2max [23, 83–87, 91, 93, 94, 97, 102, 105–108], 21 studies measured MMSS [3, 20, 22–24, 83, 84, 86, 87, 90, 94, 95, 99–101, 105–110], eight studies measured sprint capacity [3, 21, 86, 92, 93, 106, 111, 112], and 24 studies measured running performance [3, 20–23, 85, 89, 90, 92, 95, 97–99, 101, 103, 105, 106, 108–114]. The studies included 894 participants (651 male individuals [290 control and 361 treatments] and 243 female individuals [115 control and 128 treatments]), aged between 17 and 40 years, mean body mass and height of 68.70 kg and 174.50 cm, respectively. Participants were moderately trained (n = 324), well trained (n = 272), and highly trained (n = 298). The ST programs lasted between 6 and 40 weeks, with one to four sessions per week.
Table 2.
Participant and strength training intervention characteristics of the included studies
| Study | G | Subject characteristics | Strength training intervention | ||||||||||||
|---|---|---|---|---|---|---|---|---|---|---|---|---|---|---|---|
| n | Age, years | BM | H | VO2max | PLv | ST Exp | D | F | TS | Exercises | Load | Set × repetition | Rest | ||
| Ache-Dias et al. [83] | PL | 9 (M = 4; F = 5) | 24 | 63 | 160 | 50 | MT | NR | 8 | 2 | 16 | PL: continuous jump | BW | 4–6 × 30 s | 5 min |
| C | 9 (M = 4; F = 5) | 31 | 66 | 170 | 49 | MT | NR | ||||||||
| Bachero-Mena et al. [111] | SubL + PL | 6 (M) | 22 | 65 | 179 | NR | HT | Yes | 25 | 2 | 50 | SubL: squat. PL: jump squat, step phase of triple jump, resisted sprint | SubL: 40–55% 1RM. PL: low load: BW | SubL: 2–3 × 4–6. PL: 3–5 × 4–16 | – |
| C | 7 (M) | 23 | 62 | 172 | NR | HT | Yes | 25 | 2 | 50 | VL: half squat, step-up, hamstrings, quadriceps, calf raises, jump squat, jump | 0–40% 1RM | 3–5 × 10–30 | – | |
| Beattie et al. [84] | HL + SubL + PL | 11 (M) | 30 | 73 | 183 | 60 | WT | No | 40 | 1.5 | 60 | HL: back squat. SubL: single-leg squat, reverse lung, Romanian deadlift, single-leg Romanian deadlift, single jump, split squat, skater squat. PL: pogo jump, countermovement jump, continuous countermovement jump, drop jump | HL: high load. SubL: medium to high load. PL: low load | HL: 2–5 × 1–12. SubL: 1–3 × 3. PL: 2–3 × 4–6 | – |
| C | 9 (M) | 27 | 70 | 177 | 63 | WT | No | ||||||||
| Berryman et al. [85] | SubL | 12 (M) | 31 | 76 | 176 | 58 | WT | No | 8 | 1 | 8 | SubL: half squat | Power peak load | 3–6 × 8 | 3 min |
| PL | 11 (M) | 29 | 75 | 178 | 58 | WT | No | 8 | 1 | 8 | PL: drop jump (20–60 cm) | BW | 3–6 × 8 | 3 min | |
| C | 5 (M) | 29 | 76 | 180 | 56 | WT | No | ||||||||
| Bertuzzi et al. [22] | HL | 8 (M) | 31 | 70 | 174 | 59 | WT | No | 6 | 2 | 12 | HL: half squat | 2 wk: 75–80% 1RM; 2 wk: 80–85% 1RM; 2 wk: 85–90% 1RM | 3–6 × 4–10 | 3 min |
| C | 6 (M) | 33 | 69 | 173 | 58 | WT | No | ||||||||
| Blagrove et al. [19] | SubL + PL | 9 (M = 4; F = 5) | 17 | 58 | 170 | 59 | HT | No | 10 | 2 | 20 | PL: box jump, a-skip, hurdle jump and land, single-leg box jump, high-knees, depth jump. SubL: back squat, Romanian deadlift, single-leg press, calf raises, rack pull, deadlift, step-up | PL: BW. SubL: moderate load | PL: 3–4 × 6–8. SubL: 2–3 × 6–12 | PL: 1.5 min. SubL: 3 min |
| C | 9 (M = 4; F = 5) | 18 | 59 | 172 | 62 | HT | No | ||||||||
| Damasceno et al. [87] | HL | 9 (M) | 34 | 68 | 174 | 54 | MT | NR | 8 | 2 | 16 | HL: half squat, leg press, plantar flexion, knee extension | 2 wk: 75–80% 1RM; 2 wk: 80–85% 1RM; 2 wk: 85–90% 1RM; 2 wk: 87–93% 1RM | 2–3 × 3–10 | 3 min |
| C | 9 (M) | 33 | 71 | 174 | 56 | WT | NR | ||||||||
| do Carmo et al. [23] | PL | 15 (M) | 33 | 70 | 172 | 55 | WT | No | 8 | 2 | 16 | PL: squat jump, split scissor jump, double-leg bound, alternate leg bound, single-leg forward hop, depth jump, double-leg hurdle jump, single-leg hurdle hop | BW | 2–5 × 6 | - |
| C | 13 (M) | 33 | 70 | 172 | 57 | WT | No | ||||||||
| Ferrauti et al. [24] | HL | 11 (M = 9; F = 2) | 40 | 77 | NR | 52 | WT | No | 8 | 2 | 16 | HL: leg press, knee extension, knee flexion, hip extension, ankle extension | 87–93% 1RM | 4 × 3–5 | 3 min |
| C | 11 (M = 7; F = 4) | 40 | 70 | NR | 51 | WT | No | ||||||||
| Filipas et al. [20] | PL | 15 (M) | 34 | 64 | NR | 69 | HT | No | 7 | 1 | 7 | PL: vertical jump, horizontal jump, bounce drop jump | BW | 2 × 10 | 2 min |
| C | 15 (M) | 34 | 65 | NR | 68 | HT | No | ||||||||
| PL | 15 (M) | 35 | 65 | NR | 69 | HT | No | 7 | 1 | 7 | PL: vertical jump, horizontal jump, bounce drop jump | BW | 2 × 10 | 2 min | |
| C | 15 (M) | 34 | 65 | NR | 68 | HT | No | ||||||||
| García-Pinillos et al. [113] | PL | 44 (M = 23; F = 21) | 27 | 66 | 172 | NR | MT | No | 10 | 3 | 30 | PL: jump-rope bilateral, unilateral, unilateral-alternating | BW | 5 min | 30 s works: 30 s rest |
| C | 42 (M = 18; F = 24) | 26 | 66 | 171 | NR | MT | No | ||||||||
| Hamilton et al. [108] | PL | 10 (M) | 28 | 72 | 178 | 66 | HT | NR | 6 | 1.5 | 9 | PL: single-leg step-up, jump | BW | 3 × 20 | 2 min |
| C | 10 (M) | 31 | 73 | 178 | 66 | HT | NR | ||||||||
| Johnston et al. [88] | HL + SubL | 6 (F) | 30 | 57 | 163 | 51 | WT | No | 10 | 3 | 30 | SubL: bent-leg, heel raise, straight-leg heel raise. HL: knee flexion, knee extension, squat, hammer curl, lunge | SubL: 60–67% 1RM. HL: 80–85% 1RM | SubL: 2 × 12–20. HL: 3 × 6–8 | 2 min |
| C | 6 (F) | 30 | 52 | 164 | 52 | WT | No | ||||||||
| Karsten et al. [109] | HL | 8 (M = 5; F = 3) | 39 | 74 | 177 | 47 | MT | NR | 6 | 2 | 12 | HL: Romanian deadlift, squat, calf raises, lunges | 80% 1RM | 4 × 4 | 2 min |
| C | 8 (M = 6; F = 2) | 30 | 69 | 175 | 47 | MT | NR | ||||||||
| Kelly et al. [89] | HL | 7 (F) | 21 | 66 | 162 | 40 | MT | No | 10 | 3 | 30 | HL: squat, calf raises, hip extension, hip flexion, hamstrings curl | 1 wk: 60–70% 1RM; 1 wk: 70–80% 1RM; 8 wk: ≥ 85% 1RM | 3 × 5 | 3–4 min |
| C | 9 (F) | 20 | 60 | 166 | 40 | MT | No | ||||||||
| Li et al. [21] | HL + PL | 10 (M) | 20 | 58 | 178 | 66 | HT | NR | 8 | 3 | 24 | HL: back squat, Bulgarian squat, Romanian deadlifts. PL: double-leg hurdle hop, single-leg hop, drop jump | HL: 80–85% 1RM. PL: BW | HL: 3 × 5 PL: 3 × 6 | 4 min |
| HL | 9 (M) | 21 | 58 | 175 | 66 | HT | NR | 8 | 3 | 24 | HL: back squat, Bulgarian squat, Romanian deadlift | 80–85% 1RM | 5 × 5 | 3 min | |
| C | 9 (M) | 21 | 61 | 179 | 66 | HT | NR | 8 | 3 | 24 | VL: back squat, Bulgarian squat, Romanian deadlift | 40% 1RM | 5 × 20–30 | 1 min | |
| Lum et al. [90] | PL | 7 (M) | 29 | 66 | 171 | 54 | MT | NR | 6 | 2 | 12 | PL: alternate leg bounding, double-leg and single-leg hurdle hop, depth jump | BW | 3–4 × 5–40 | 3 min |
| C | 7 (M) | 29 | 66 | 171 | 54 | MT | NR | ||||||||
| Lum et al. [91] | PL | 9 (M = 6; F = 3) | 38 | 65 | 170 | 51 | WT | Yes | 6 | 2 | 12 | PL: depth jump, single-leg bounding, split jump | BW | 2–4 × 4–5 | 3 min |
| C | 8 (M = 6; F = 2) | 32 | 62 | 168 | 50 | WT | Yes | 6 | 2 | 12 | VL: squat, lunge with knee lift, arabesque | BW | 3 × 30 s | 30 s | |
| Lundstrom et al. [92] | PL | 11 (M = 7; F = 4) | 21 | 66 | NR | 51 | WT | NR | 12 | 1 | 12 | PL: horizontal jump, vertical jump, frog hop, alternate leg bound, single-leg forward hop, lateral cone jump, forward/backward cone jump, squat jump, lunge jump, depth jump, box jump | BW | 1–2 × 8–20 | 1 min |
| C | 11 (M = 6; F = 5) | 20 | 74 | NR | 54 | WT | NR | 12 | 1 | 12 | Core exercises | BW | 1–3 × 10–30 | 1 min | |
| Machado et al. [114] | PL | 8 (M) | 38 | 81 | 177 | NR | MT | NR | 8 | 2 | 16 | PL: multi-direction jumps, squat jump | BW | 6 × 30 s | 30 s |
| PL | 8 (M) | 39 | 84 | 179 | NR | MT | NR | 8 | 2 | 16 | PL: multi-direction jumps, drop jump | BW | 6 × 30 s | 30 s | |
| C | 8 (M) | 35 | 79 | 176 | NR | MT | NR | ||||||||
| Mikkola et al. [93] | SubL + PL | 13 (M = 9; F = 4) | 17 | 63 | 177 | 62 | HT | NR | 8 | 3 | 24 | PL: alternate jump, calf jump, squat jump, hurdle jump. SubL: half squats, knee extensions, knee flexions, calf raises | Low-load or BW | 2–3 × 6–10 | – |
| C | 12 (M = 9; F = 3) | 17 | 60 | 172 | 62 | HT | NR | ||||||||
| Mikkola et al. [107] | HL | 11 (M) | 36 | 78 | 179 | 51 | MT | Yes | 8 | 2 | 16 | HL: squat, seated leg press | 85–90% 1RM | 3 × 4–6 | 2–3 min |
| SubL + PL | 10 (M) | 36 | 79 | 181 | 51 | MT | Yes | 8 | 2 | 16 | SubL: squat, seated leg press. PL: squat jump, scissor jump | 0–40% 1RM | SubL: 3 × 6. PL: 2 × 5–10 | 2–3 min | |
| C | 6 (M) | 34 | 84 | 181 | 48 | MT | Yes | 8 | 2 | 16 | VL: squat, lunges | BW | 3 × 40–50 s | 10–20 s | |
| Millet et al. [94] | HL | 7 (M) | 24 | 67 | 175 | 70 | HT | NR | 14 | 2 | 28 | HL: hamstrings curl, leg press, seated press, squat, leg extension, heel raises | 87–93% 1RM | 3–5 × 3–5 | – |
| C | 8 (M) | 21 | 65 | 175 | 68 | HT | NR | ||||||||
| Paavolainen et al. [3] | PL + SubL | 10 (M) | 23 | 72 | 179 | 68 | HT | NR | 9 | 2.5 | 22.5 | PL: alternate jump, bilateral countermovement jump, drop jump, hurdle jump, one-legged. SubL: leg press, knee extensor-flexor | PL: BW or barbell. SubL: 0–40% 1RM | – | – |
| C | 8 (M) | 24 | 70 | 182 | 68 | HT | NR | – | – | – | VL: leg exercises | BW | 1 × 12 | – | |
| Pellegrino et al. [95] | PL | 11 (M = 7; F = 4) | 33 | 68 | 172 | 48 | MT | No | 6 | 2.5 | 15 | PL: squat jump, split scissor jump, double-leg bound, alternate leg bound, single-leg forward hop, deep knee bend box jump landing, double-leg hurdle jump, single-leg hurdle hop | BW | 2–3 × 8–15 | – |
| C | 11 (M = 7; F = 4) | 34 | 71 | 171 | 48 | MT | No | ||||||||
| Ramírez-Campillo et al. [112] | PL | 17 (M = 9; F = 8) | 22 | 60 | NR | NR | HT | No | 6 | 2 | 12 | PL: vertical jump, horizontal jump, drop jump | BW | 2 × 10 | 2 min |
| C | 15 (M = 10; F = 5) | 22 | 60 | NR | NR | HT | No | ||||||||
| Saunders et al. [96] | PL | 7 (M) | 23 | 68 | NR | 68 | HT | Yes | 9 | 2.5 | 26 | PL: countermovement jump, knee lift, ankle jump, hamstrings curls, alternate leg bound, skip for height, single-leg ankle jump, continuous hurdle jump, scissor jump for height. SubL: leg pressa | 60% 1RM + BW | 1–5 × 6–20 | – |
| C | 8 (M) | 25 | 68 | NR | 70 | HT | Yes | ||||||||
| Schumann et al. [110] | HL + SubL + PL | 13 (M) | 33 | 78 | 179 | NR | MT | NR | 24 | 2 | 46 | HL: leg press, single and double knee flexion, calf raises. SubL: squat jump, drop jump, leaps, step-up. PL: squat jump, drop jump, leap | 4 wk: 40–50% 1RM; 20 wk: 60–85% 1RM | SubL HL: 5–12 sets | 1–3 min |
| C | 14 (M) | 33 | 78 | 179 | NR | MT | NR | ||||||||
| Sedano et al. [97] | SubL + PL | 6 (M) | 24 | 69 | 181 | 69 | HT | Yes | 12 | 2 | 24 | SubL: barbell squat, lying leg curl, seated calf raises, leg extension. PL: vertical jump over hurdles (40 cm), horizontal jump | SubL: 70% 1RM. PL: BW | SubL: 3 × 7. PL: 10 | 5 min |
| SubL | 6 (M) | 24 | 66 | 179 | 71 | HT | Yes | 12 | 2 | 24 | SubL: barbell squat, lying leg curl, seated calf raises, leg extension | 40% 1RM | 3 × 20 | 1 min | |
| C | 6 (M) | 24 | 70 | 185 | 69 | HT | Yes | 12 | 2 | 24 | VL: squat with band, lying leg curl with band, calf raises with band, leg extension with band | Resistance band | 1 × 25 | 5 min | |
| Skovgaard et al. [98] | HL | 12 (M) | 31 | 77 | 180 | 61 | WT | No | 8 | 4 | 32 | HL: squat, deadlift, leg press | 2 wk 65–67% 1RM; 6 wk: HL: 80–90% 1RM | HL: 3 × 8–4 | 3 min |
| C | 9 (M) | 31 | 77 | 180 | 59 | WT | No | ||||||||
| Spurrs et al. [99] | PL | 8 (M) | 25 | 74.7 | 178 | 58 | WT | No | 6 | 2.5 | 15 | PL: squat jump, split scissor jump, double-leg bound, alternate leg bound, single-leg forward hop, depth jump, double-leg hurdle jump, single-leg hurdle hop | BW | 2–3 × 8–15 | – |
| C | 9 (M) | 25 | 70.2 | 178 | 58 | WT | No | ||||||||
| Štohanzl et al. [100] | PL | 9 (F) | 32 | 69 | 169 | 39 | MT | No | 10 | 2 | 20 | PL: calf jump, low skater jump, half squat jump | BW | 3–4 × 12–3 | 2 min |
| PL | 11 (F) | 32 | 71 | 169 | 34 | MT | No | 10 | 1 | 10 | PL: calf jump, low skater jump, half squat jump | BW | 3–4 × 12–3 | 2 min | |
| C | 11 (F) | 32 | 69 | 169 | 37 | MT | No | ||||||||
| Støren et al. [101] | HL | 8 (M = 4; F = 4) | 29 | 60 | 171 | 61 | HT | No | 8 | 3 | 24 | HL: half squat | 90% 1RM | 4 × 4 | 3 min |
| C | 9 (M = 5; F = 4) | 30 | 71 | 179 | 57 | WT | No | ||||||||
| Taipale et al. [102] | HL + PL | 9 (F) | 29 | 62 | 168 | 45 | MT | NR | 16 | 1.2 | 24 | HL: squats, leg press. PL: box jump, vertical jump | HL: 85–90% 1RM. PL: BW | HL: 2–3 × 4–6. PL: 2–3 × 8–10 | 2–3 min |
| C | 9 (F) | 35 | 60 | 165 | 43 | MT | NR | 16 | 1.2 | 24 | VL: squats, lunges, sit-up, calf-raises, step-up | BW | 1 × 45–50 s | 15–20 s | |
| HL + PL | 9 (M) | 31 | 78 | 178 | 50 | MT | NR | 16 | 1.2 | 24 | HL: Squat, leg press. PL: box jump, vertical jump | HL: 85–90% 1RM. PL: BW | HL: 2–3 × 4–6. PL: 2–3 × 8–10 | 2–3 min | |
| C | 7 (M) | 34 | 84 | 180 | 46 | MT | NR | 16 | 1.2 | 24 | VL: squats, lunges, sit-up, calf-raises, step-up | BW | 1 × 45–50 s | 15–20 s | |
| Trowell et al. [103] | SubL + PL | 14 (M = 8; F = 6) | 33 | 73 | 173 | 61 | HT | No | 10 | 2 | 20 | PL: ankle bouncing, hurdle jump (40 cm), high-knee drill or a-skip drill, split squat jump, countermovement jump or drop jump (45 cm). SubL: back squat, single-leg deadlift | SubL: 70% 1RM. PL: 0–30% BW | SubL: 2–5 × 10. PL: 2–5 × many | 3 min |
| C | 14 (M = 9; F = 5) | 34 | 70 | 175 | 66 | HT | No | 10 | 2 | 20 | VL: sit-up, lunge, among others | BW | – | – | |
| Turner et al. [104] | PL | 10 (M = 4; F = 6) | 31 | 65 | 170 | 50 | WT | NR | 6 | 3 | 18 | PL: vertical jump, one-legged vertical jump, vertical springing jump, split-squat jump, incline jump | BW | 1 × 5–15 | – |
| C | 8 (M = 4; F = 4) | 27 | 72 | 174 | 54 | WT | NR | ||||||||
| Vikmoen et al. [105] | HL | 11 (F) | 35 | 62 | 169 | 52 | WT | No | 11 | 2 | 22 | HL: half squat, one-legged leg press, standing one-legged hip flexion, ankle plantar flexion | 3 wk: 75–85% 1RM; 3 wk: 80–87% 1RM; 5 wk: 85–90% 1RM | 3 × 4–10 | – |
| C | 8 (F) | 32 | 66 | 170 | 54 | WT | No | ||||||||
| Vorup et al. [106] | HL | 9 (M) | 39 | 75 | 181 | 60 | WT | NR | 8 | 2 | 16 | HL: half squat, leg press, deadlift | 1 wk: 75% 1RM; 1 wk: 80% 1RM; 2 wk: 85% 1RM; 4 wk: 90% 1RM | 1–4 × 10⁻⁴ | 3 min |
| C | 7 (M) | 37 | 74 | 184 | 60 | WT | NR | ||||||||
1RM one repetition maximum, BM body mass (kg), C control, D duration (weeks), F frequency (session/week), F female, G group, H height (cm), HL high load training, HT highly trained, M male; min minutes, MT moderately trained, n sample size, PL plyometric training, PLv performance level, s seconds, SubL submaximal load training, ST exp strength training experience, TS total sessions, VL very low load, VO2max (mL/kg/min), WL well trained, wk weeks
aThe exercise was not considered relevant to be included as a strength training method in this group
Table 3.
Analysis of the studies included in the meta-analysis of VO2max, vVO2max, maximum metabolic steady state, sprint capacity, and running performance
| Study | Group | n | VO2max | vVO2max | Maximum metabolic steady state | Sprint capacity | Running performance | ||||||||
|---|---|---|---|---|---|---|---|---|---|---|---|---|---|---|---|
| Mean pre (SD) | Mean post (SD) | Mean pre (SD) | Mean post (SD) | Measurement | Mean pre (SD) | Mean post (SD) | Test | Mean pre (SD) | Mean post (SD) | Test | Mean pre (SD) | Mean post (SD) | |||
| Ache-Dias et al. [83] | PL | 9 (M = 4; F = 5) | 3.17 (0.72) | 3.46 (0.70) | 13.68 (1.40) | 14.06 (1.57) | sOBLA | 10.11 (1.64) | 11.09 (1.82) | ||||||
| C | 9 (M = 4; F = 5) | 3.23 (0.73) | 3.25 (0.72) | 14.00 (1.33) | 14.00 (1.26) | sOBLA | 11.39 (1.8) | 11.46 (1.77) | |||||||
| Bachero-Mena et al. [111] | SubL + PL | 6 (M) | 20-m tt (s) | 2.91 (0.12) | 2.87 (0.08) | 800 m tt (s) | 112.79 (6.42) | 111.35 (5.79) | |||||||
| C | 7 (M) | 20-m tt (s) | 2.95 (0.08) | 2.9 (0.06) | 800 m tt (s) | 117.97 (1.97) | 116.11 (1.17) | ||||||||
| Beattie et al. [84] | HL + SubL + PL | 11(M) | 59.60 (2.50) | 61.60 (5.20) | 20.15 (0.91) | 20.95 (0.96) | s4 mmol/L Bla | 16.46 (1.20) | 16.81 (1.30) | ||||||
| C | 9 (M) | 63.20 (2.90) | 65.00 (3.20) | 21.17 (1.03) | 21.5 (1.03) | s4 mmol/L Bla | 17.10 (1.04) | 17.49 (0.93) | |||||||
| Berryman et al. [85] | SubL | 12 (M) | 57.50 (6.70) | 56.10 (6.70) | 16.60 (1.50) | 17.30 (1.60) | 3000-m tt (s) | 755.00 (87.00) | 724.00 (77.00) | ||||||
| PL | 11 (M) | 57.50 (6.50) | 57.30 (5.50) | 16.60 (1.30) | 17.30 (1.30) | 3000-m tt (s) | 748.00 (81.00) | 712.00 (76.00) | |||||||
| C | 5 (M) | 55.70 (8.20) | 55.30 (8.90) | 17.30 (2.00) | 17.50 (2.40) | 3000-m tt (s) | 711.00 (107.00) | 690.00 (109.00) | |||||||
| Bertuzzi et al. [22] | HL | 8 (M) | 58.50 (7.60) | 58.20 (6.20) | 19.00 (1.00) | 19.00 (1.00) | RCP (%vVO2max) | 85.00 (7.00) | 86.00 (8.00) | Time to exhaustion at vVO2max | 454.90 (228.00) | 562.20 (255.00) | |||
| C | 6 (M) | 57.60 (6.30) | 57.50 (5.40) | 18.00 (2.00) | 18.00 (2.00) | RCP (%vVO2max) | 86.00 (6.00) | 85.00 (6.00) | Time to exhaustion at vVO2max | 305.10 (201.60) | 315.30 (184.00) | ||||
| Blagrove et al. [19] | SubL + PL | 9 (M = 4; F = 5) | 229.20 (41.30) | 227.50 (36.20) | 16.80 (2.40) | 17.30 (2.60) | s4 mmol/L Bla | 14.90 (2.40) | 15.40 (2.50) | 20-m tt (s) | 2.73 (0.22) | 2.69 (0.19) | |||
| C | 9 (M = 4; F = 5) | 241.20 (24.20) | 242.00 (21.50) | 17.80 (0.80) | 17.80 (1.70) | s4 mmol/L Bla | 15.80 (1.00) | 16.40 (1.40) | 20-m tt (s) | 2.64 (0.24) | 2.62 (0.23) | ||||
| Damasceno et al. [87] | HL | 9 (M) | 54.30 (5.40) | 54.40 (5.30) | 16.70 (1.30) | 17.20 (1.60) | RCP (km/h) | 15.40 (1.10) | 16.00 (1.20) | ||||||
| C | 9 (M) | 55.80 (5.30) | 56.80 (6.00) | 17.60 (1.10) | 17.70 (1.50) | RCP (km/h) | 15.80 (1.00) | 15.70 (1.20) | |||||||
| do Carmo et al. [23] | PL | 15 (M) | 55.10 (4.30) | 56.90 (4.70) | 18.20 (0.80) | 18.50 (0.80) | VT2 (mL/kg/min) | 49.90 (3.80) | 51.60 (4.20) | 10,000-m tt (s) | 2508.00 (154.00) | 2482.00 (157.00) | |||
| C | 13 (M) | 56.70 (6.10) | 57.20 (6.70) | 18.70 (1.30) | 18.70 (1.60) | VT2 (mL/kg/min) | 50.00 (5.80) | 50.90 (5.60) | 10,000-m tt (s) | 2445.00 (219.00) | 2458.00 (215.00) | ||||
| Ferrauti et al. [24] | HL | 11 (M = 9; F = 2) | 52.00 (6.10) | 54.90 (4.40) | s4 mmol/L Bla | 3.54 (0.41) | 3.69 (0.46) | ||||||||
| C | 11 (M = 7; F = 4) | 51.10 (7.50) | 51.10 (7.50) | s4 mmol/L Bla | 3.40 (0.51) | 3.49 (0.52) | |||||||||
| Filipas et al. [20] | PL | 15 (M) | 68.53 (3.00) | 69.00 (3.10) | s4 mmol/L Bla | 17.28 (0.50) | 17.70 (0.50) | 5000-m tt (s) | 994.90 (29.00) | 978.00 (29.00) | |||||
| C | 15 (M) | 67.30 (2.80) | 68.00 (2.50) | s4 mmol/L Bla | 17.40 (0.63) | 17.50 (0.70) | 5000-m tt (s) | 993.00 (31.90) | 984.00 (33.00) | ||||||
| PL | 15 (M) | 68.90 (2.90) | 69.90 (3.70) | s4 mmol/L Bla | 17.31 (0.60) | 17.70 (0.50) | 5000-m tt (s) | 992.90 (27.00) | 975.00 (24.00) | ||||||
| C | 15 (M) | 68.20 (3.10) | 68.30 (4.10) | s4 mmol/L Bla | 17.30 (0.72) | 17.50 (0.80) | 5000-m tt (s) | 998.00 (34.50) | 990.00 (37.00) | ||||||
| García-Pinillos et al. [113] | PL | 44 (M = 23; F = 21) | 3000-m tt (s) | 774.60 (79.50) | 751.70 (65.80) | ||||||||||
| C | 42 (M = 18; F = 24) | 3000-m tt (s) | 762.10 (87.50) | 750.80 (83.60) | |||||||||||
| Hamilton et al. [108] | PL | 10 (M) | 20.50 (1.30) | 21.05 (1.32) | s4 mmol/L Bla | 14.70 (2.00) | 15.29 (2.05) | 5000-m tt (s) | 1128.00 (78.00) | 1103.40 (66.60) | |||||
| C | 10 (M) | 20.40 (1.00) | 20.58 (1.02) | s4 mmol/L Bla | 15.50 (1.30) | 15.58 (1.37) | 5000-m tt (s) | 1098.00 (78.00) | 1087.00 (63.00) | ||||||
| Johnston et al. [88] | HL + SubL | 6 (F) | 50.50 (2.20) | 48.00 (2.00) | |||||||||||
| C | 6 (F) | 51.50 (2.40) | 51.00 (1.90) | ||||||||||||
| Karsten et al. [109] | HL | 8 (M = 5; F = 3) | CS (km/h) | 13.80 (2.10) | 14.20 (1.70) | 5000-m tt (s) | 1288.30 (183.40) | 1242.90 (187.00) | |||||||
| C | 8 (M = 6; F = 2) | CS (km/h) | 14.7 (1.80) | 14.7 (1.90) | 5000-m tt (s) | 1264.40 (203.70) | 1270.30 (221.80) | ||||||||
| Kelly et al. [89] | HL | 7 (F) | 39.90 (5.20) | 45.10 (7.20) | 3000-m tt (s) | 957.00 (93.00) | 847.00 (48.00) | ||||||||
| C | 9 (F) | 39.50 (6.00) | 42.30 (4.90) | 3000-m tt (s) | 1010.00 (150.00) | 933.00 (107.00) | |||||||||
| Li et al. [21] | HL + PL | 10 (M) | 65.65 (5.06) | 64.47 (4.31) | 50-m tt (s) | 6.25 (0.19) | 6.11 (0.24) | 5000-m tt (s) | 953.70 (12.30) | 926.90 (9.92) | |||||
| HL | 9 (M) | 65.54 (5.52) | 64.65 (6.18) | 50-m tt (s) | 6.17 (0.33) | 6.04 (0.33) | 5000-m tt (s) | 952.56 (10.10) | 932.67 (11.61) | ||||||
| C | 9 (M) | 66.14 (5.25) | 67.79 (3.03) | 50-m tt (s) | 5.94 (0.21) | 5.92 (0.30) | 5000-m tt (s) | 954.11 (6.75) | 947.33 (10.03) | ||||||
| Lum et al. [90] | PL | 7 (M) | 54.40 (5.00) | 53.70 (6.70) | sLT2 | 12.40 (1.00) | 12.40 (1.00) | 10,000-m tt (s) | 3028.00 (405.00) | 2915.00 (420.00) | |||||
| C | 7 (M) | 53.90 (7.40) | 54.60 (6.70) | sLT2 | 12.20 (1.50) | 12.30 (1.50) | 10,000-m tt (s) | 3181.00 (481.00) | 3061.00 (421.00) | ||||||
| Lum et al. [91] | PL | 9 (M = 6; F = 3) | 50.60 (5.20) | 52.60 (6.30) | 16.10 (1.60) | 16.80 (1.80) | 2400-m tt (s) | 598.00 (61.00) | 584.00 (64.00) | ||||||
| C | 8 (M = 6; F = 2) | 49.90 (5.30) | 50.30 (5.70) | 15.60 (1.70) | 15.70 (1.80) | 2400-m tt (s) | 616.00 (46.00) | 614.00 (45.00) | |||||||
| Lundstrom et al. [92] | PL | 11 (M = 7; F = 4) | 50.50 (8.80) | 57.80 (8.30) | 60-m tt (s) | 10.45 (1.37) | 9.88 (1.51) | 2-mile tt (s) | 882.00 (144.00) | 720.00 (138.00) | |||||
| C | 11 (M = 6; F = 5) | 53.60 (8.30) | 57.40 (7.50) | 60-m tt (s) | 9.83 (1.4) | 9.67 (1.19) | 2-mile tt (s) | 840.00 (120.00) | 798.00 (102.00) | ||||||
| Machado et al. [114] | PL | 8 (M) | 5000-m tt (s) | 1495.50 (227.98) | 1355.00 (134.67) | ||||||||||
| PL | 8 (M) | 5000-m tt (s) | 1470.25 (169.24) | 1299.63 (191.47) | |||||||||||
| C | 8 (M) | 5000-m tt (s) | 1701.00 (130.09) | 1696.25 (139.35) | |||||||||||
| Mikkola et al. [93] | SubL + PL | 13 (M = 9; F = 4) | 62.40 (5.40) | 62.80 (5.80) | 17.20 (1.00) | 17.40 (1.00) | 30 m (m/s) | 8.08 (0.16) | 8.17 (0.17) | ||||||
| C | 12 (M = 9; F = 3) | 61.80 (5.30) | 62.80 (5.60) | 17.10 (1.00) | 17.30 (1.40) | 30 m (m/s) | 7.88 (0.18) | 7.85 (0.17) | |||||||
| Mikkola et al. [107] | HL | 11 (M) | 51.00 (4.00) | 52.00 (5.00) | 15.10 (1.20) | 15.30 (1.10) | sMMSS | 12.70 (1.20) | 13.20 (1.20) | ||||||
| SubL + PL | 10 (M) | 51.00 (5.00) | 52.00 (4.00) | 15.30 (1.00) | 15.60 (1.00) | sMMSS | 12.60 (0.80) | 13.00 (1.00) | |||||||
| C | 6 (M) | 48.00 (6.00) | 52.00 (6.00) | 14.50 (0.90) | 15.20 (1.00) | sMMSS | 11.80 (0.70) | 12.40 (0.80) | |||||||
| Millet et al. [94] | HL | 7 (M) | 69.70 (3.60) | 67.20 (4.40) | 19.52 (0.94) | 19.99 (0.79) | VT2 (%VO2max) | 88.40 (2.80) | 88.10 (5.00) | ||||||
| C | 8 (M) | 67.60 (6.40) | 67.30 (5.60) | 19.32 (0.94) | 19.80 (1.18) | VT2 (%VO2max) | 89.30 (8.10) | 88.80 (6.40) | |||||||
| Paavolainen et al. [3] | PL + SubL | 10 (M) | 67.70 (2.80) | 70.20 (3.20) | LT2 (mL/kg/min) | 47.30 (3.30) | 48.10 (3.50) | 20 m (m/s) | 7.96 (0.57) | 8.23 (0.54) | 5000-m tt (s) | 1103.40 (21.60) | 1066.80 (6.00) | ||
| C | 8 (M) | 68.30 (3.10) | 68.40 (3.60) | LT2 (mL/kg/min) | 48.90 (4.50) | 49.30 (2.80) | 20 m (m/s) | 8.28 (0.35) | 8.08 (0.31) | 5000-m tt (s) | 1073.40 (24.00) | 1084.80 (35.40) | |||
| Pellegrino et al. [95] | PL | 11 (M = 7; F = 4) | 48.00 (1.80) | 50.50 (2.10) | sOBLA | 13.79 (0.50) | 13.97 (0.50) | 3000-m tt (s) | 780.90 (29.90) | 760.80 (29.10) | |||||
| C | 11 (M = 7; F = 4) | 47.70 (2.30) | 49.20 (2.10) | sOBLA | 12.53 (0.43) | 12.60 (0.50) | 3000-m tt (s) | 830.40 (35.60) | 817.20 (39.80) | ||||||
| Ramírez-Campillo et al. [112] | PL | 17 (M = 9; F = 8) | 20-m tt (s) | 3.92 (0.30) | 3.83 (0.30) | 2400-m tt (s) | 456.00 (42.00) | 438.00 (48.00) | |||||||
| C | 15 (M = 10; F = 5) | 20-m tt (s) | 3.97 (0.20) | 3.94 (0.40) | 2400-m tt (s) | 480.00 (54.00) | 474.00 (54.00) | ||||||||
| Saunders et al. [96] | PL | 7 (M) | 67.70 (6.20) | 68.20 (6.20) | |||||||||||
| C | 8 (M) | 70.4 (6.20) | 72.5 (5.00) | ||||||||||||
| Schumann et al. [110] | HL + SubL + PL | 13 (M) | s4 mmol/L BLa | 3.90 (0.40) | 4.10 (0.40) | 1000-m tt (s) | 228.00 (48.00) | 198.00 (12.00) | |||||||
| C | 14 (M) | s4 mmol/L BLa | 3.70 (0.50) | 3.90 (0.30) | 1000-m tt (s) | 216.00 (24.00) | 198.00 (12.00) | ||||||||
| Sedano et al. [97] | SubL + PL | 6 (M) | 68.83 (1.94) | 69.51 (1.98) | 20.91 (0.90) | 21.70 (0.78) | 3000-m tt (s) | 491.85 (1.93) | 488.65 (1.87) | ||||||
| SubL | 6 (M) | 70.73 (2.88) | 71.45 (1.76) | 21.45 (1.67) | 22.45 (1.69) | 3000-m tt (s) | 492.63 (1.35) | 491.79 (1.02) | |||||||
| C | 6 (M) | 68.80 (1.83) | 69.20 (2.05) | 21.95 (1.21) | 22.12 (1.02) | 3000-m tt (s) | 493.30 (1.24) | 493.51 (1.52) | |||||||
| Skovgaard et al. [98] | HL | 12 (M) | 60.70 (1.20) | 59.50 (0.80) | 1500-m tt (s) | 327.00 (8.00) | 310.00 (5.00) | ||||||||
| C | 9 (M) | 58.90 (2.10) | 58.20 (2.30) | 1500-m tt (s) | 322.00 (6.00) | 327.00 (9.00) | |||||||||
| Spurrs et al. [99] | PL | 8 (M) | 57.60 (7.70) | 59.50 (8.10) | LT2 (mmol/L BLa) | 4.26 (1.18) | 4.03 (1.42) | 3000-m tt (s) | 616.80 (75.60) | 607.20 (69.00) | |||||
| C | 9 (M) | 57.80 (5.40) | 61.50 (5.90) | LT2 (mmol/L BLa) | 3.73 (1.08) | 4.10 (0.73) | 3000-m tt (s) | 561.60 (34.20) | 558.60 (31.20) | ||||||
| Štohanzl et al. [100] | PL | 9 (F) | 38.80 (1.70) | 39.70 (3.00) | VT2 (mL/kg/min) | 28.90 (2.70) | 28.40 (2.60) | ||||||||
| PL | 11 (F) | 33.70 (6.40) | 34.20 (6.80) | VT2 (mL/kg/min) | 31.20 (3.50) | 30.80 (3.50) | |||||||||
| C | 11 (F) | 37.30 (5.10) | 38.30 (4.50) | VT2 (mL/kg/min) | 30.20 (3.40) | 31.60 (3.80) | |||||||||
| Støren et al. [101] | HL | 8 (M = 4; F = 4) | 61.40 (5.10) | 61.00 (5.80) | LT2 (%VO2max) | 83.00 (4.00) | 83.00 (6.00) | Time to exhaustion at vVO2max | 337.00 (124.00) | 409.00 (164.00) | |||||
| C | 9 (M = 5; F = 4) | 56.50 (8.20) | 56.00 (7.00) | LT2 (%VO2max) | 85.00 (4.00) | 87.00 (5.00) | Time to exhaustion at vVO2max | 412.00 (163.00) | 371.00 (134.00) | ||||||
| Taipale et al. [102] | HL + PL | 9 (F) | 43.70 (2.40) | 45.40 (2.70) | 12.83 (0.83) | 13.45 (0.79) | |||||||||
| C | 9 (F) | 42.80 (5.90) | 44.80 (6.40) | 12.92 (1.58) | 13.31 (1.36) | ||||||||||
| HL + PL | 9 (M) | 50.90 (5.40) | 51.70 (5.40) | 14.80 (1.18) | 15.55 (1.10) | ||||||||||
| C | 7 (M) | 45.70 (3.00) | 49.800 (7.00) | 13.93 (0.75) | 15.02 (1.05) | ||||||||||
| Trowell et al. [103] | SubL + PL | 14 (M = 8; F = 6) | 60.56 (3.77) | 60.56 (4.33) | 2000-m tt (s) | 494.22 (41.24) | 480.49 (41.78) | ||||||||
| C | 14 (M = 9; F = 5) | 65.60 (7.49) | 64.16 (7.10) | 2000-m tt (s) | 482.86 (62.64) | 480.68 (61.88) | |||||||||
| Turner et al. [104] | PL | 10 (M = 4; F = 6) | 50.40 (9.00) | 50.40 (8.00) | |||||||||||
| C | 8 (M = 4; F = 4) | 54.00 (7.20) | 54.20 (6.40) | ||||||||||||
| Vikmoen et al. [105] | HL | 11 (F) | 52.20 (2.30) | 52.70 (3.30) | 12.80 (0.70) | 13.00 (0.90) | s3.5 mmol/L BLa | 9.59 (0.68) | 9.69 (0.64) | 40-min all-out (km) | 6.35 (0.30) | 6.45 (0.38) | |||
| C | 8 (F) | 54.20 (2.90) | 53.10 (1.90) | 13.10 (0.50) | 13.30 (0.60) | s3.5 mmol/L BLa | 9.82 (0.50) | 10.03 (0.54) | 40-min all-out (km) | 6.50 (0.19) | 6.66 (0.23) | ||||
| Vorup et al. [106] | HL | 9 (M) | 59.90 (5.70) | 59.80 (5.60) | 18.60 (0.40) | 18.00 (0.40) | LT2 (mmol/L BLa) | 5.70 (0.70) | 5.50 (0.50) | 400 m tt (s) | 66.05 (5.02) | 62.82 (4.26) | 10,000-m tt (s) | 2407.20 (148.92) | 2363.82 (155.82) |
| C | 7 (M) | 60.20 (5.90) | 60.10 (5.50) | 18.10 (1.30) | 18.30 (1.20) | LT2 (mmol/L BLa) | 5.70 (1.00) | 5.60 (1.10) | 400 m tt (s) | 63.82 (5.16) | 63.58 (5.60) | 10,000 m tt (s) | 2424.60 (160.74) | 2400.30 (203.16) | |
BLa blood lactate, C control, CS critical speed (km/h), F female, HL high load training, LT2 second lactate threshold, M male, min minute, n sample size, PL plyometric training, RCP respiratory compensation point, SD standard deviation, SubL submaximal load training, s seconds, s3.5 mmol/L BLa speed at 3.5 mmol/L BLa (km/h), s4 mmol/L BLa speed at 4 mmol/L BLa (km/h), sMMSS speed at maximal metabolic steady state (km/h), sLT2 speed at second lactate threshold (km/h), sOBLA speed at onset of blood lactate accumulation, tt time trial, VO2max (mL∙kg−1∙min−1), vVO2max (km/h), VT2 second ventilatory threshold
Risk of Bias, Publication Bias, and Certainty Assessment
The median of risk of bias was 6 (range from 4 to 7; moderate-to-low risk of bias; Table S2 of the ESM). Publication bias was found only in the analysis of running performance in the combined group (Fig. S1 of the ESM). The results of the certainty of the evidence for each outcome are presented in Table 4. The reasons for downgrading by one or more levels of certainty were (1) risk (moderate) of bias, (2) inconsistency (i.e., significant heterogeneity was found), (3) imprecision (i.e., low number of participants and/or CI crossing the small effect size), and (4) publication bias (i.e., asymmetry in the funnel plot was found). Certainty of the evidence was moderate for eight outcomes, low in four outcomes, and very low for one outcome.
Table 4.
GRADE (Grading of Recommendations Assessment, Development and Evaluation) assessment for the certainty of evidence
| Certainty assessment | No. of participants | Certainty | ||||||
|---|---|---|---|---|---|---|---|---|
| No. of studies | Risk of bias | Inconsistency | Indirectness | Imprecision | Publication bias | Strength training | Control group | |
| VO2max: high load training (follow-up: mean 8.8 weeks) | ||||||||
| 11 | Not serious | Not serious | Not serious | Seriousa | Undetected | 102 | 91 |
⨁⨁⨁◯ Moderate |
| VO2max: plyometric training (follow-up: mean 7.7 weeks) | ||||||||
| 12 | Not serious | Not serious | Not serious | Seriousa | Undetected | 148 | 130 |
⨁⨁⨁◯ Moderate |
| VO2max: combined training (follow-up: mean 13.1 weeks) | ||||||||
| 10 | Seriousb | Not serious | Not serious | Seriousa | Undetected | 107 | 95 |
⨁⨁◯◯ Low |
| vVO2max: high load training (follow-up: mean 9.2 weeks) | ||||||||
| 6 | Not serious | Not serious | Not serious | Seriousa | Undetected | 55 | 44 |
⨁⨁⨁◯ Moderate |
| vVO2max: plyometric training (follow-up: mean 7.2 weeks) | ||||||||
| 5 | Not serious | Not serious | Not serious | Seriousa | Undetected | 54 | 45 |
⨁⨁⨁◯ Moderate |
| vVO2max: combined training (follow-up: mean 15.7 weeks) | ||||||||
| 6 | Seriousb | Not serious | Not serious | Seriousa | Undetected | 67 | 58 |
⨁⨁◯◯ Low |
| Maximum metabolic steady state: high load training (follow-up: mean 8.5 weeks) | ||||||||
| 9 | Not serious | Not serious | Not serious | Seriousa | Undetected | 82 | 72 |
⨁⨁⨁◯ Moderate |
| Maximum metabolic steady state: plyometric training (follow-up: mean 7.1 weeks) | ||||||||
| 8 | Not serious | Not serious | Not serious | Seriousa | Undetected | 110 | 100 |
⨁⨁⨁◯ Moderate |
| Maximum metabolic steady state: combined training (follow-up: mean 18.2 weeks) | ||||||||
| 5 | Seriousb | Not serious | Not serious | Seriousa | Undetected | 53 | 46 |
⨁⨁◯◯ Low |
| Sprint capacity: combined training (follow-up: mean 12 weeks) | ||||||||
| 5 | Seriousb | Not serious | Not serious | Seriousa | Undetected | 48 | 45 |
⨁⨁◯◯ Low |
| Running performance: high load training (follow-up: mean 8.1 weeks) | ||||||||
| 8 | Not serious | Not serious | Not serious | Seriousa | Undetected | 72 | 65 |
⨁⨁⨁◯ Moderate |
| Running performance: plyometric training (follow-up: mean 7.4 weeks) | ||||||||
| 12 | Not serious | Not serious | Not serious | Seriousa | Undetected | 189 | 169 |
⨁⨁⨁◯ Moderate |
| Running performance: combined training (follow-up: mean 14.7 weeks) | ||||||||
| 6 | Seriousb | Seriousc | Not serious | Seriousd | Detectedc | 59 | 52 |
Very low ⨁◯◯◯ |
VO2max maximal oxygen uptake, vVO2max velocity at maximal oxygen uptake
aDowngraded by one level because n < 800 and/or the 95% confidence interval crossed the small effect size
bDowngraded by one level because the median PEDro scale is < 6
cDowngraded by one level because significant heterogeneity was found
dDowngraded by one level because asymmetry in the funnel plot was observed
VO2max
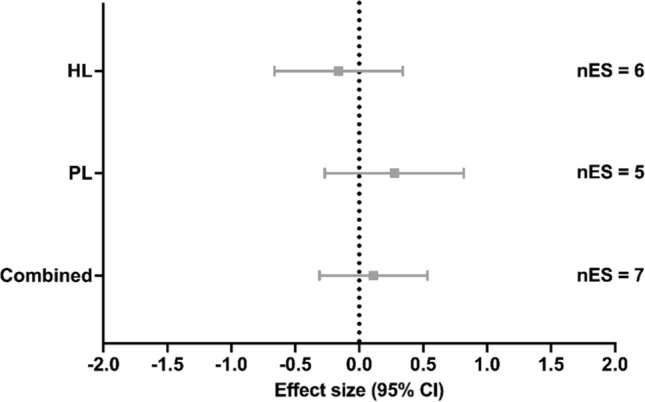
From the studies that measured VO2max, 11 studies implemented HL [21, 22, 24, 87, 89, 94, 98, 101, 105–107], two studies SubL [85, 97] (not included in the meta-analysis), 12 studies (involving 14 groups) implemented PL [20, 23, 83, 85, 90–92, 95, 96, 99, 100, 104], and ten studies (involving 11 groups) implemented Combined [3, 21, 84, 86, 88, 93, 97, 102, 103, 107]. Compared with control conditions, no significant effects on VO2max were found with HL training (ES [95% CI] = − 0.014 [− 0.324 to 0.297], p = 0.924, I2 < 0.001%; Fig. 2), PL (ES [95% CI] = 0.075 [− 0.183 to 0.332], p = 0.541, I2 < 0.001%; Fig. 2) or Combined (ES [95% CI] = − 0.095 [− 0.398 to 0.208], p = 0.499, I2 < 0.001%; Fig. 2). Meta-regressions and subgroup analyses showed no significant moderating variables for any ST method (all p > 0.166; Tables S3–5 of the ESM).
Fig. 2.

Effect of strength training methods on maximal oxygen uptake. A positive effect size represents beneficial effects after strength training compared with control conditions. CI confidence interval, Combined high load training, plyometric training and/or submaximal load training, HL high load training, nES number of effect sizes, PL plyometric training
vVO2max
Among the studies that measured vVO2max, six studies applied HL [22, 87, 94, 105–107], two studies applied SubL [85, 97] (not included in the meta-analysis), five studies applied PL [23, 83, 85, 91, 108], and six studies (involving seven groups) applied Combined [84, 86, 93, 97, 102, 107]. Compared with the control group, no significant effects on vVO2max were found with HL training (ES [95% CI] = − 0.161 [− 0.662 to 0.341], p = 0.448, I2 < 0.001%; Fig. 3), PL (ES [95% CI] = 0.275 [− 0.269 to 0.818], p = 0.233, I2 < 0.001%; Fig. 3) or Combined (ES [95% CI] = 0.112 [− 0.311 to 0.534], p = 0.542, I2 < 0.001%; Fig. 3). The reduced number of studies (i.e., < 8) per each ST method precluded meta-regression and subgroup analyses.
Fig. 3.
Effect of strength training methods on velocity at maximal oxygen uptake. A positive effect size represents beneficial effects after strength training compared with control conditions. CI confidence interval, Combined high load training, plyometric training and/or submaximal load training, HL high load training, nES number of effect sizes, PL plyometric training
Maximum Metabolic Steady State
From the studies that measured MMSS, nine studies implemented HL [22, 24, 87, 94, 101, 105–107, 109], ten groups from eight studies implemented PL [20, 23, 83, 90, 95, 99, 100, 108], and five studies implemented Combined [3, 84, 86, 107, 110]. Compared with the control condition, no significant effects on MMSS were found with HL training (ES [95% CI] = 0.049 [− 0.308 to 0.407], p = 0.760, I2 < 0.001%; Fig. 4), PL (ES [95% CI] = 0.017 [− 0.289 to 0.323], p = 0.902, I2 < 0.001%; Fig. 4) or Combined (ES [95% CI] = − 0.026 [− 0.564 to 0.513], p = 0.902, I2 < 0.001%; Fig. 4). Meta-regressions and subgroup analyses showed no significant effects of possible moderators in the HL and PL methods (all p > 0.181; Tables S6 and S7 of the ESM).
Fig. 4.
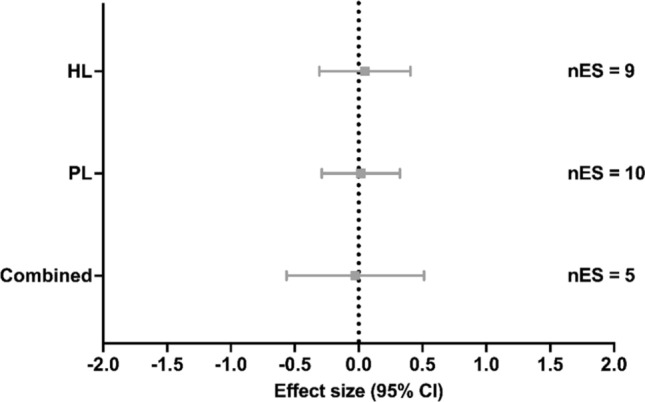
Effect of strength training methods on maximum metabolic steady state. A positive effect size represents beneficial effects after strength training compared with control conditions. CI confidence interval, Combined high load training, plyometric training, and/or submaximal load training, HL high load training, nES number of effect sizes, PL plyometric training
Sprint Capacity
Of the studies that measured sprint capacity, two studies applied HL [21, 106], two studies applied PL [92, 112], and five studies applied Combined [3, 21, 86, 93, 111]. Compared with the control condition, no significant effect on sprint capacity was found with Combined training (ES [95% CI] = − 0.493 [− 1.057 to 0.070], p = 0.072, I2 < 0.001%; Fig. 5).
Fig. 5.
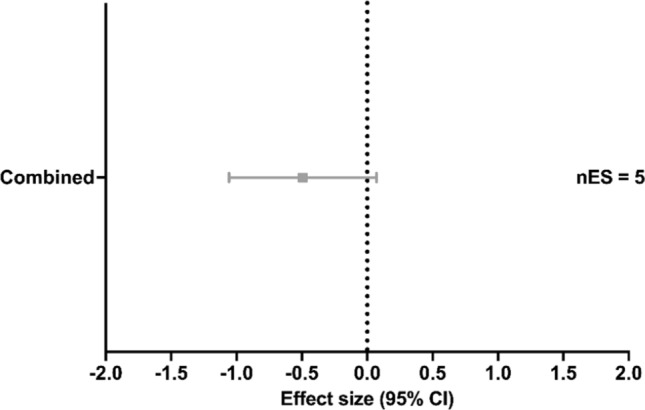
Effect of strength training methods on sprint capacity. A negative effect size represents beneficial effects after strength training compared with control conditions. CI confidence interval, Combined high load training, plyometric training and/or submaximal load training, nES number of effect sizes
Running Performance
From the studies that measured running performance, eight studies implemented HL [21, 22, 89, 98, 101, 105, 106, 109], two studies implemented SubL [85, 97], 14 groups from 12 studies implemented PL [20, 23, 85, 90–92, 95, 99, 108, 112–114], and six studies implemented Combined [3, 21, 97, 103, 110, 111]. Compared with the control group, a significant moderate effect were found with HL training (ES [95% CI] = − 0.469 [− 0.872 to − 0.066], p = 0.029, I2 < 0.001%; Fig. 6) and a significant large effect with Combined training but with a significant and moderate level of heterogeneity (ES [95% CI] = − 1.035 [− 1.967 to − 0.103], p = 0.036; Q(5) = 15.373, p = 0.009, I2 = 67.475%; Fig. 6). No significant effect on running performance was found with PL training (ES [95% CI] = − 0.210 [− 0.433 to 0.014], p = 0.064, I2 < 0.001%; Fig. 6). Meta-regressions and subgroup analyses showed no significant effects of possible moderators (all p > 0.211, Tables S8 and S9 of the ESM).
Fig. 6.
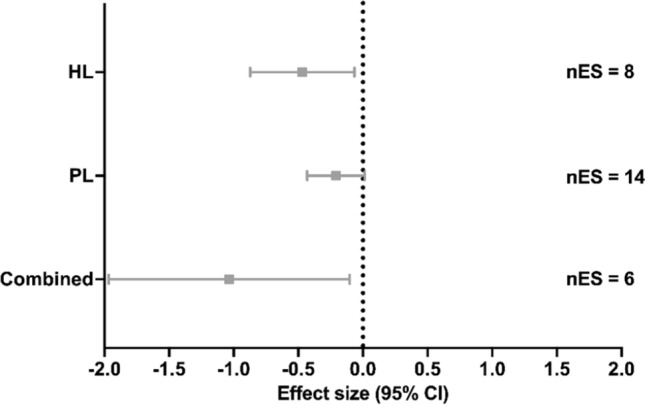
Effect of strength training methods on running performance. A negative effect size represents beneficial effects after strength training compared with control conditions. CI confidence interval, Combined high load training, plyometric training, and/or submaximal load training, HL high load training, nES number of effect sizes, PL plyometric training
Discussion
The aim of this systematic review with meta-analysis was to analyze the effect of different ST methods (i.e., HL, SubL, PL, and Combined) on performance and its determinants (i.e., VO2max, vVO2max, MMSS, and sprint capacity) in middle-distance and long-distance runners. The analyses revealed that, compared with endurance training alone or with ST with very low loads, the HL produced a significant moderate effect on running performance but not PL. Furthermore, when more than two ST methods (i.e., HL, PL and/or SubL) are combined, a significant large effect on running performance is produced. In contrast, no effects on VO2max, vVO2max, MMSS, and sprint capacity were found for all ST methods analyzed. These results suggest that HL is an effective method for improving running performance without interfering with other physiological parameters (i.e., VO2max, vVO2max, and MMSS), and this effect may be enhanced when PL and HL and/or SubL are combined.
VO2max and vVO2max
Maximal oxygen uptake is defined as the highest rate at which oxygen can be taken up and utilized by the body during severe exercise [5] and is an important prerequisite for performance in middle-distance and long-distance running [115]. There was no significant effect of any ST method on VO2max (all p > 0.544), which is consistent with previous meta-analyses in endurance athletes [10, 16]. An improvement in VO2max depends mainly on “upstream factors”, which include all physiological pathways that transfer oxygen from the environment to the blood, pumping it to the periphery and distributing it to and within muscle cells [116, 117]. The short duration of most ST efforts (i.e., exercise duration) probably did not induce an adequate stimulus to these factors. For example, traditional ST with variable resistance elevates oxygen uptake to approximately 45% of VO2max [118], which is not a sufficient aerobic stimulus to improve VO2max [119].
Although traditional ST methods may not stimulate VO2max, they can induce changes in neuromuscular function, musculotendinous stiffness, and muscle fiber type [120], factors that may aid endurance velocity and, by extension, vVO2max [3, 18]. The measure of vVO2max is the interaction between VO2max and running economy [2, 6], influenced by anaerobic and neuromuscular characteristics [121], and can explain differences in performance that VO2max and running economy alone cannot [6]. Indeed, vVO2max has been shown to be a good predictor of performance in middle-distance [122, 123] and long-distance running [124–126]. However, we did not find a significant effect of any ST method on vVO2max (all p > 0.479). The lack of an effect of ST methods on vVO2max may be related to the test protocol used to measure this outcome, particularly the duration of the stages [127]. Protocols with short duration stages and 1.00-km/h incremental changes every minute have been suggested for athletes to reach vVO2max, resulting in lower work and energy cost than longer duration stages [128]. From a total of 15 studies included in the meta-analysis for vVO2max, seven studies [22, 23, 84, 91, 97, 105, 106] used protocols with 1.00-km/h increments every minute, or in shorter stages (i.e., 30 s), and four of these studies showed significant effects after PL [91], HL [106], SubL [97], and Combined methods [84, 97]. From the seven studies that applied longer duration stages (i.e., 3 min or more), three found an effect on vVO2max after PL [83, 108] and HL [87], whereas others found no effect after Combined [86, 93, 102, 107] and HL [107]. These results are in line with the suggestion of a recent meta-analysis to use ramped protocols to elucidate the effects of plyometric jump training on vVO2max [16]. Considering the above, future research is needed to determine which protocol is valid for detecting vVO2max adaptations following different ST methods.
Maximum Metabolic Steady State
Maximum metabolic steady state dictates the boundary between heavy-intensity exercise and severe-intensity exercise [129, 130]. Below MMSS, exercise intensity can reach a steady state of muscle metabolism, whereas above MMSS this state is altered [131], which means increasing the MMSS through training would enable an athlete to achieve a steady state at higher running speeds. Our meta-analysis found no significant effect of any ST method on MMSS (all p > 0.760). The findings suggest that the analyzed ST methods do not generate sufficient metabolic impact to improve the MMSS, which typically benefits from training at intensities around this threshold [132]. Even an alternative approach [133] has been explored involving ST with low loads and high repetitions, aiming at a near-threshold intensity, showing different physiological and mechanical responses compared with aerobic training at these intensities. The absence of an effect of ST on the MMSS (and VO2max) implies that ST may not induce a sufficient stimulus to induce changes in metabolic factors, at least with traditional ST approaches.
Sprint Capacity
In our meta-analysis, we found no significant effect of Combined on sprint capacity (p = 0.072), but not enough studies were found to be able to perform a meta-analysis (i.e., at least three studies) for the other ST methods. Sprint capacity is an important variable because it allows runners to hold a favorable position at the start of a race and to sprint maximally towards its finish [4]. This may be especially relevant in middle-distance events in which the initial and final parts of the race have a higher proportion of sprinting than longer distances. Indeed, a relationship has been found between time achieved in elite male 800-m races with maximum sprint speed in elite male 800-m runners (R2 = 0.550) [134] and a near-significant relationship in sub-elite female 800-m runners (R2 = 0.380, p = 0.057) [135], but this has not been correlated with changes in 5-km performance [3]. As the capacity to sprint is determined by the application of skeletal muscle force (and not necessarily by anaerobic metabolism) [136], improvements may be because of improved neuromuscular capabilities [3]. However, it is important to mention that all [3, 86, 93, 111] but one [21] of the studies included sprint training in combination with ST, so these possible improvements may be due more to sprint training than to ST. Therefore, research is needed to examine the effect of ST on sprint capacity and its effect on middle-distance and long-distance races.
Running Performance
High Load Training
Interventions with HL improved running performance, including time trial and time to exhaustion measures (ES = − 0.469 [moderate], p = 0.029). In contrast, our meta-analyses indicated no effect of HL on VO2max, MMSS, and sprint capacity. Given that no improvement in VO2max or MMSS was found with HL training, following a model that explains performance through metabolic (VO2max, MMSS, and running economy) and non-metabolic (running economy and sprint capacity) factors [137, 138], it is reasonable to argue that HL could improve performance through non-metabolic factors such as running economy [137]. Indeed, HL can induce non-metabolic (e.g., neuromuscular) adaptations [139] leading toward an improved rate of force development [101, 139]. A larger rate of force development may allow high force levels to be generated at shorter contact times (i.e., at a faster running pace) [140, 141], allow a faster transition from the braking phase to the propulsive phase [140], and allows for quasi-isometric muscle conditions that favor muscle energy costs [141, 142]. Indeed, the rate of force development has been correlated with running economy [101, 140, 142]. Additionally, HL can generate changes in lower limb stiffness [142–144], improving energy storage and release from the lower limbs during running, and this could lead to a reduction in the energy expenditure during running [145] and thus running economy [142–144]. Additionally, increased absolute strength may reduce relative effort at submaximal running speeds, activating a lower number of higher threshold motor units, resulting in a lower energy cost during running, and thus improved running economy [141]. Indeed, a secondary analysis of studies included in this systematic review revealed improved running economy after HL (ES = − 0.266, p = 0.039).
Furthermore, we included time to exhaustion as an indicator of running performance. Two studies [101, 106] measured time to exhaustion at vVO2max, showing an improvement after HL intervention. Potentially, these improvements are due to an improvement in running economy [94, 101, 106] and anaerobic capacity [106]. Given that the time to exhaustion at severe intensity (i.e., intensity between MMSS and VO2max) is constrained by a decline in force production [137] and reduced fiber recruitment [146], it is plausible that enhanced rate force development and maximal strength (i.e., 1 RM) could offset the effects of fatigue through enhanced activation of motor neurons and recruitment of muscle fibers [101]. Indeed, while running at vVO2max, athletes with reduced decline in force production may reduce the increase in energy cost (i.e., greater muscular strength endurance) [147]. Consequently, HL could contribute to the delay of muscle fatigue at this specific intensity [101]. Overall, considering the myriad of factors associated with running performance [137, 138, 148], future studies should elucidate the underlying mechanisms (particularly non-metabolic factors) of the improvement in running performance (and fatigue resistance) following HL interventions.
Plyometric Training
Plyometric training may induce neuromuscular adaptations, such as increased motor unit recruitment and improved intermuscular coordination [149]. These neuromuscular improvements have been shown to correlate with improved running economy and anaerobic capacity [137]. Additionally, PL can improve stiffness and compliance (e.g., muscle, tendon, joint) [99, 150]. This mechanism enables greater storage and release of elastic energy within the tendon [150], resulting in reduced muscle energy expenditure [141], and thus improved running economy. Indeed, recent meta-analyses [13, 16] found a significant improvement of running performance after PL. In contrast, our meta-analysis denotes no improvement of running performance after PL (ES = − 0.210, p = 0.064). One possible reason for the discrepancy is that we included a larger (more representative) number of studies in our analysis (n = 12) when compared with recent meta-analyses (n = 7–10) [13, 16]. However, most of the analyzed studies in previous meta-analyses (e.g., seven of ten) [16] were also included in this analysis. Further, our meta-analysis yielded a nearly significant effect for PL on running performance, with a higher ES compared with a similar meta-analysis that found a favorable running performance effect after PL (ES = − 0.210 vs − 0.170, respectively) [13]. The reason for the discrepancies between published meta-analyses and our meta-analysis is currently unclear. Possible methodological differences (e.g., inclusion–exclusion criteria; statistical [meta-analytical] approach) may have played a role.
Combined
Combined involves incorporating more than one ST method into a training program. Our study revealed that Combined produced a significant large effect on running performance (ES = − 1.035, p = 0.036), producing a greater effect than the use of a single ST method alone. Interestingly, the studies that included the Combined method utilized PL in combination with HL and/or SubL, confirming that including PL with resistance training has a favorable effect on running performance [16] and a greater effect than HL alone. In addition, in a secondary analysis, we found that the Combined method has a greater effect (ES = − 0.426, p = 0.018) on running economy compared with the HL (ES = − 0.266, p = 0.039), SubL (ES = − 0.365, p = 0.131),and PL (ES = − 0.122, p = 0.167) methods used individually. Therefore, we can assume that this improvement in running economy also translates to enhanced running performance. This can be observed in the study by Li et al. [21], which found that HL alone and HL combined with PL both improved running economy and 5-km running performance. However, despite no significant differences between the two groups, the HL with PL group exhibited a higher percentage improvement than HL alone in both running economy (7.68% vs 4.89% at 14.00 km/h) and running performance (2.80% vs 2.09%) [21].
One reason for an increased effect may be that the incorporation of different ST methods can generate a variety of overloads that challenge the neuromuscular system [19] and potentially enhance running performance by eliciting diverse neuromuscular mechanisms. Additionally, the sequence of exercises corresponding to different ST methods within the same training session or in separate sessions may serve different purposes for the force–velocity profile [151]. For example, contrast training (i.e., high load exercises followed by alternating plyometric exercises) could induce post-activation potentiation by improving the speed of plyometric exercises through enhancing both the force and velocity components, whereas traditional training (i.e., low load exercises followed by high load exercises) may primarily develop the force component and not be potentiated by exercises with low loads [151]. However, improvements have been observed in studies where both ST methods were included in the same session [21, 97, 103], as well as in separate sessions [3]. Of note, from the five studies that included SubL, four [3, 103, 110, 111] instructed athletes to perform exercises with maximal velocity intention, and one [97] described the intervention as explosive training. Maximal movement velocity intention at a given load can positively influence neuromuscular adaptations [152], and therefore running performance adaptations.
Limitations and Strengths
Some limitations of this meta-analysis should be mentioned. First, because of the different composition of each of the ST methods, we decided to perform a separate analysis of each ST method on each of the performance parameters (i.e., VO2max, vVO2max, MMSS, sprint capacity, and running performance), which resulted in the SubL group not reaching the minimum number of studies (i.e., three studies) for the main analysis in any of the performance parameters, while HL and PL did not reach the minimum number of studies for sprint capacity. In addition, in some cases, the minimum number of studies (i.e., eight studies) for a moderator analysis was not achieved. Second, high heterogeneity was found for Combined in the analysis for running performance (p = 0.009, I2 = 67.475), probably because different types of ST methods with varying effects were included in this group, and thus their effect on running performance should be interpreted with caution. Finally, in this study, we have focused mainly on aerobic parameters, but the anaerobic component is also a determinant of running performance [3], as well as durability [153]. The strengths of our study are also important to note. To our knowledge, this is the first meta-analysis to analyze the effect of different ST methods on different parameters determining running performance specifically in middle-distance and long-distance runners. Furthermore, we included time to exhaustion as an indicator of running performance allowing us to increase the number of studies in the analysis and to discuss durability.
Conclusions
In summary, this systematic review with meta-analysis suggests that ST with HL improves running performance measured by a time trial and time to exhaustion. Combining the PL method with HL and/or SubL showed greater improvement in running performance compared with the ST methods alone, while the PL method alone did not enhance running performance. These improvements occurred without changes in VO2max, vVO2max, MMSS, and sprint capacity, suggesting that the adaptations are mainly due to non-metabolic factors. These results suggest that middle-distance and long-distance coaches and athletes should consider the inclusion of more than one ST method in their training plan. Future research should aim to analyze and compare the effect of different ST methods combined and separately on running performance, as well as the underlying mechanisms related to these effects.
Supplementary Information
Below is the link to the electronic supplementary material.
Funding
Funding for open access publishing: Universidad Pablo de Olavide/CBUA.
Declarations
Funding
No financial support was received for the conduct of this study, or for the preparation of the article.
Conflict of interest
Cristian Llanos-Lagos, Rodrigo Ramirez-Campillo, Jason Moran, and Eduardo Sáez de Villarreal have no conflicts of interest that are directly relevant to the content of this article.
Ethics approval
Not applicable.
Consent to participate
Not applicable.
Consent for publication
Not applicable.
Availability of data and material
All data generated or analyzed during this study are included in the article as tables, figures, and/or ESM. Any other data requirement can be directed to the corresponding author upon reasonable request.
Code availability
Not applicable.
Authors’ contributions
LL and SV conceived the idea and design for the article, LL, RC, and SV performed the literature search, data acquisition, analysis, and/or interpretation. LL, RC, JM, and SV drafted and/or critically revised the work. All authors have read, and approved the manuscript, and have agreed both to be personally accountable for the author’s own contributions and to ensure that questions related to the accuracy or integrity of any part of the work, even those in which the author was not personally involved, are appropriately investigated, resolved, and the resolution documented in the literature. All authors read and approved the final version.
References
- 1.Joyner MJ, Coyle EF. Endurance exercise performance: the physiology of champions. J Physiol. 2008;586:35–44. doi: 10.1113/jphysiol.2007.143834. [DOI] [PMC free article] [PubMed] [Google Scholar]
- 2.Jones AM, Carter H. The effect of endurance training on parameters of aerobic fitness. Sports Med. 2000;29:373–386. doi: 10.2165/00007256-200029060-00001. [DOI] [PubMed] [Google Scholar]
- 3.Paavolainen L, Häkkinen K, Hämäläinen I, et al. Explosive-strength training improves 5-km running time by improving running economy and muscle power. J Appl Physiol. 1999;86:1527–1533. doi: 10.1152/jappl.1999.86.5.1527. [DOI] [PubMed] [Google Scholar]
- 4.Casado A, Renfree A. Fortune favors the brave: tactical behaviors in the middle-distance running Events at the 2017 IAAF World Championships. Int J Sports Physiol Perform. 2018;13:1386–1391. doi: 10.1123/ijspp.2018-0055. [DOI] [PubMed] [Google Scholar]
- 5.Bassett DR, Howley ET. Limiting factors for maximum oxygen uptake and determinants of endurance performance. Med Sci Sports Exerc. 2000;32:70. doi: 10.1097/00005768-200001000-00012. [DOI] [PubMed] [Google Scholar]
- 6.Billat LV, Koralsztein JP. Significance of the velocity at V̇O(2max) and time to exhaustion at this velocity. Sports Med. 1996;22:90–108. doi: 10.2165/00007256-199622020-00004. [DOI] [PubMed] [Google Scholar]
- 7.Barnes KR, Kilding AE. Running economy: measurement, norms, and determining factors. Sports Med Open. 2015;1:1–15. doi: 10.1186/s40798-015-0007-y. [DOI] [PMC free article] [PubMed] [Google Scholar]
- 8.Conley DL, Krahenbuhl GS. Running economy and distance running performance of highly trained athletes. Med Sci Sports Exerc. 1980;12:357–360. doi: 10.1249/00005768-198025000-00010. [DOI] [PubMed] [Google Scholar]
- 9.Sandford GN, Pearson S, Allen SV, et al. Tactical behaviors in men’s 800-m Olympic and World-Championship medalists: a changing of the guard. Int J Sports Physiol Perform. 2018;13:246–249. doi: 10.1123/ijspp.2016-0780. [DOI] [PubMed] [Google Scholar]
- 10.Berryman N, Mujika I, Arvisais D, et al. Strength training for middle- and long-distance performance: a meta-analysis. Int J Sports Physiol Perform. 2018;13:57–64. doi: 10.1123/ijspp.2017-0032. [DOI] [PubMed] [Google Scholar]
- 11.Balsalobre-Fernández C, Santos-Concejero J, Grivas GV. Effects of strength training on running economy in highly trained runners: a systematic review with meta-analysis of controlled trials. J Strength Cond Res. 2016;30:2361–2368. doi: 10.1519/JSC.0000000000001316. [DOI] [PubMed] [Google Scholar]
- 12.Denadai BS, de Aguiar RA, de Lima LCR, et al. Explosive training and heavy weight training are effective for improving running economy in endurance athletes: a systematic review and meta-analysis. Sports Med. 2017;7:545–554. doi: 10.1007/s40279-016-0604-z. [DOI] [PubMed] [Google Scholar]
- 13.Eihara Y, Takao K, Sugiyama T, et al. Heavy resistance training versus plyometric training for improving running economy and running time trial performance: a systematic review and meta-analysis. Sports Med Open. 2022;8:138. doi: 10.1186/s40798-022-00511-1. [DOI] [PMC free article] [PubMed] [Google Scholar]
- 14.Alcaraz-Ibañez M, Rodríguez-Pérez M. Effects of resistance training on performance in previously trained endurance runners: a systematic review. J Sports Sci. 2018;36:613–629. doi: 10.1080/02640414.2017.1326618. [DOI] [PubMed] [Google Scholar]
- 15.Rønnestad BR, Mujika I. Optimizing strength training for running and cycling endurance performance: a review. Scand J Med Sci Sports. 2014;24:603–612. doi: 10.1111/sms.12104. [DOI] [PubMed] [Google Scholar]
- 16.Ramirez-Campillo R, Andrade DC, García-Pinillos F, et al. Effects of jump training on physical fitness and athletic performance in endurance runners: a meta-analysis. J Sports Sci. 2021;39:2030–2050. doi: 10.1080/02640414.2021.1916261. [DOI] [PubMed] [Google Scholar]
- 17.Kraemer WJ, Ratamess NA. Fundamentals of resistance training: progression and exercise prescription. Med Sci Sports Exerc. 2004;36:674–688. doi: 10.1249/01.MSS.0000121945.36635.61. [DOI] [PubMed] [Google Scholar]
- 18.Beattie K, Kenny IC, Lyons M, et al. The effect of strength raining on performance in endurance athletes. Sports Med. 2014;44:845–865. doi: 10.1007/s40279-014-0157-y. [DOI] [PubMed] [Google Scholar]
- 19.Blagrove RC, Howatson G, Hayes PR. Effects of strength training on the physiological determinants of middle- and long-distance running performance: a systematic review. Sports Med. 2018;48:1117–1149. doi: 10.1007/s40279-017-0835-7. [DOI] [PMC free article] [PubMed] [Google Scholar]
- 20.Filipas L, Bonato M, Maggio A, et al. Effects of plyometric training on different 8-week training intensity distributions in well-trained endurance runners. Scand J Med Sci Sports. 2023;33:200–212. doi: 10.1111/sms.14257. [DOI] [PubMed] [Google Scholar]
- 21.Li F, Wang R, Newton RU, et al. Effects of complex training versus heavy resistance training on neuromuscular adaptation, running economy and 5-km performance in well-trained distance runners. PeerJ. 2019;7:1–21. doi: 10.7717/peerj.6787. [DOI] [PMC free article] [PubMed] [Google Scholar]
- 22.Bertuzzi R, Pasqua L, Bueno S, et al. Strength-training with whole-body vibration in long-distance runners: a randomized trial. Int J Sports Med. 2013;34:917–923. doi: 10.1055/s-0033-1333748. [DOI] [PubMed] [Google Scholar]
- 23.do Carmo EC, Barroso R, Gil S, et al. Can plyometric training change the pacing behaviour during 10-km running? Eur J Sport Sci. 2023;23:18–27. doi: 10.1080/17461391.2021.2013952. [DOI] [PubMed] [Google Scholar]
- 24.Ferrauti A, Bergermann M, Fernandez-Fernandez J. Effects of a concurrent strength and endurance training on running performance and running economy in recreational marathon runners. J Strength Cond Res. 2010;24:2770–2778. doi: 10.1519/JSC.0b013e3181d64e9c. [DOI] [PubMed] [Google Scholar]
- 25.Page MJ, McKenzie JE, Bossuyt PM, et al. The PRISMA 2020 statement: an updated guideline for reporting systematic reviews. BMJ. 2021;372:n71. doi: 10.1136/bmj.n71. [DOI] [PMC free article] [PubMed] [Google Scholar]
- 26.Drevon D, Fursa SR, Malcolm AL. Intercoder reliability and validity of WebPlotDigitizer in extracting graphed data. Behav Modif. 2017;41:323–339. doi: 10.1177/0145445516673998. [DOI] [PubMed] [Google Scholar]
- 27.Goswami B, Singha Roy A, Dalui R, et al. Impact of pubertal growth on physical fitness. Am J Sports Sci Med. 2014;2:34–39. doi: 10.12691/ajssm-2-5A-8. [DOI] [Google Scholar]
- 28.Jones AM. Middle-and long-distance running. In: Davison R, Smith PM, Hopker J, Price MJ, Hettinga F, Tew G, Bottoms L, editors. Sport and exercise physiology testing guidelines. Volume I. Sport testing. Abingdon: Routledge; 2006. pp. 167–174. [Google Scholar]
- 29.Rusko H, Nummela A, Mero A. A new method for the evaluation of anaerobic running power in athletes. Eur J Appl Physiol Occup Physiol. 1993;66:97–101. doi: 10.1007/BF01427048. [DOI] [PubMed] [Google Scholar]
- 30.Gastin PB. Energy system interaction and relative contribution during maximal exercise. Sports Med. 2001;31:725–741. doi: 10.2165/00007256-200131100-00003. [DOI] [PubMed] [Google Scholar]
- 31.de Morton NA. The PEDro scale is a valid measure of the methodological quality of clinical trials: a demographic study. Aust J Physiother. 2009;55:129–133. doi: 10.1016/S0004-9514(09)70043-1. [DOI] [PubMed] [Google Scholar]
- 32.Maher CG, Sherrington C, Herbert RD, et al. Reliability of the PEDro Scale for rating quality of randomized controlled trials. Phys Ther. 2003;83:713–721. doi: 10.1093/ptj/83.8.713. [DOI] [PubMed] [Google Scholar]
- 33.González-Mohíno F, Santos-Concejero J, Yustres I, et al. The effects of interval and continuous training on the oxygen cost of running in recreational runners: a systematic review and meta-analysis. Sports Med. 2020;50:283–294. doi: 10.1007/s40279-019-01201-x. [DOI] [PubMed] [Google Scholar]
- 34.Guyatt G, Oxman AD, Akl EA, et al. GRADE guidelines: 1. Introduction: GRADE evidence profiles and summary of findings tables. J Clin Epidemiol. 2011;64:383–394. doi: 10.1016/j.jclinepi.2010.04.026. [DOI] [PubMed] [Google Scholar]
- 35.Zhang Y, Alonso-Coello P, Guyatt GH, et al. GRADE Guidelines: 19. Assessing the certainty of evidence in the importance of outcomes or values and preferences: risk of bias and indirectness. J Clin Epidemiol. 2019;111:94–104. doi: 10.1016/j.jclinepi.2018.01.013. [DOI] [PubMed] [Google Scholar]
- 36.Zhang Y, Coello PA, Guyatt GH, et al. GRADE guidelines: 20. Assessing the certainty of evidence in the importance of outcomes or values and preferences: inconsistency, imprecision, and other domains. J Clin Epidemiol. 2019;111:83–93. doi: 10.1016/j.jclinepi.2018.05.011. [DOI] [PubMed] [Google Scholar]
- 37.Cuijpers P, Weitz E, Cristea IA, et al. Pre-post effect sizes should be avoided in meta-analyses. Epidemiol Psychiatr Sci. 2017;26:364–368. doi: 10.1017/S2045796016000809. [DOI] [PMC free article] [PubMed] [Google Scholar]
- 38.Hedges LV, Olkin I. Statistical methods for meta-analysis. New York: Academic Press; 1985. [Google Scholar]
- 39.Borenstein M, Hedges LV, Higgins JPT, et al. Introduction to meta-analysis. Chichester: Wiley; 2009. [Google Scholar]
- 40.Abt G, Boreham C, Davison G, et al. Power, precision, and sample size estimation in sport and exercise science research. J Sports Sci. 2020;38:1933–1935. doi: 10.1080/02640414.2020.1776002. [DOI] [PubMed] [Google Scholar]
- 41.Higgins JPT, Thomas J, Chandler J, et al. Cochrane handbook for systematic reviews of interventions. Chichester: Wiley; 2019. [Google Scholar]
- 42.Swinton PA, Burgess K, Hall A, et al. Interpreting magnitude of change in strength and conditioning: effect size selection, threshold values and Bayesian updating. J Sports Sci. 2022;40:2047–2054. doi: 10.1080/02640414.2022.2128548. [DOI] [PubMed] [Google Scholar]
- 43.Veroniki AA, Jackson D, Viechtbauer W, et al. Methods to estimate the between-study variance and its uncertainty in meta-analysis. Res Synth Methods. 2016;7:55–79. doi: 10.1002/jrsm.1164. [DOI] [PMC free article] [PubMed] [Google Scholar]
- 44.Knapp G, Hartung J. Improved tests for a random effects meta-regression with a single covariate. Stat Med. 2003;22:2693–2710. doi: 10.1002/sim.1482. [DOI] [PubMed] [Google Scholar]
- 45.Harrer M, Cuijpers P, Furukawa TA, et al. Doing meta-analysis with R: a hands-on guide. Boca Raton: Chapman and Hall/CRC; 2021. [Google Scholar]
- 46.Jukic I, Castilla AP, Ramos AG, et al. The acute and chronic effects of implementing velocity loss thresholds during resistance training: a systematic review, meta-analysis, and critical evaluation of the literature. Sports Med. 2023;53:177–214. doi: 10.1007/s40279-022-01754-4. [DOI] [PMC free article] [PubMed] [Google Scholar]
- 47.Fu R, Gartlehner G, Grant M, et al. Conducting quantitative synthesis when comparing medical interventions: AHRQ and the Effective Health Care Program. J Clin Epidemiol. 2011;64:1187–1197. doi: 10.1016/j.jclinepi.2010.08.010. [DOI] [PubMed] [Google Scholar]
- 48.Bluett KA, Croix MBADS, Lloyd RS. A preliminary investigation into concurrent aerobic and resistance training in youth runners. Isokinet Exerc Sci. 2015;23:77–85. doi: 10.3233/IES-150567. [DOI] [Google Scholar]
- 49.Clark AW, Goedeke MK, Cunningham SR, et al. Effects of pelvic and core strength training on high school cross-country race times. J Strength Cond Res. 2017;31:2289–2295. doi: 10.1519/JSC.0000000000001729. [DOI] [PubMed] [Google Scholar]
- 50.Chelly MS, Hermassi S, Shephard RJ. Effects of in-season short-term plyometric training program on sprint and jump performance of young male track athletes. J Strength Cond Res. 2015;29:2128–2136. doi: 10.1519/JSC.0000000000000860. [DOI] [PubMed] [Google Scholar]
- 51.Elgushy H. The impact of concurrent training on certain pulmonary, physical variables and record level of middle distances for young athletics. Sci Move Health. 2016;16:454–461. [Google Scholar]
- 52.Häkkinen K, Mero A, Kauhanen H. Specificity of endurance, sprint and strength training on physical performance capacity in young athletes. J Sports Med Phys Fitn. 1989;29:27–35. [PubMed] [Google Scholar]
- 53.Saud AA, Nabia GM. Effect of concurrent training on certain pulmonary, physical variables and record level of middle distances for young athletics. Move Health. 2016;16:247–254. [Google Scholar]
- 54.Hutson MJ, O’Donnell E, Petherick E, et al. Incidence of bone stress injury is greater in competitive female distance runners with menstrual disturbances independent of participation in plyometric training. J Sports Sci. 2021;39:2558–2566. doi: 10.1080/02640414.2021.1945184. [DOI] [PubMed] [Google Scholar]
- 55.Taipale RS, Mikkola J, Vesterinen V, et al. Neuromuscular adaptations during combined strength and endurance training in endurance runners: maximal versus explosive strength training or a mix of both. Eur J Appl Physiol. 2013;113:325–335. doi: 10.1007/s00421-012-2440-7. [DOI] [PubMed] [Google Scholar]
- 56.Willy RW, Davis IS. The effect of a hip-strengthening program on mechanics during running and during a single-leg Squat. J Orthop Sports Phys Ther. 2011;41:625–632. doi: 10.2519/jospt.2011.3470. [DOI] [PubMed] [Google Scholar]
- 57.Andrade DC, Beltrán AR, Labarca-Valenzuela C, et al. Effects of plyometric training on explosive and endurance performance at sea level and at high altitude. Front Physiol. 2018;9:1–9. doi: 10.3389/fphys.2018.01415. [DOI] [PMC free article] [PubMed] [Google Scholar]
- 58.Hickson RC, Dvorak BA, Gorostiaga EM, et al. Potential for strength and endurance training to amplify endurance performance. J Appl Physiol. 1988;65:2285–2290. doi: 10.1152/jappl.1988.65.5.2285. [DOI] [PubMed] [Google Scholar]
- 59.Yamanaka R, Wakasawa S, Yamashiro K, et al. Effect of resistance training of psoas major in combination with regular running training on performance in long-distance runners. Int J Sports Physiol Perform. 2021;16:906–909. doi: 10.1123/ijspp.2020-0206. [DOI] [PubMed] [Google Scholar]
- 60.Barnes KR, Hopkins WG, McGuigan MR, et al. Effects of resistance training on running economy and cross-country performance. Med Sci Sports Exerc. 2013;45:2322–2331. doi: 10.1249/MSS.0b013e31829af603. [DOI] [PubMed] [Google Scholar]
- 61.Berryman N, Mujika I, Bosquet L. Effects of short-term concurrent training cessation on the energy cost of running and neuromuscular performances in middle-distance runners. Sports. 2020;9:1. doi: 10.3390/sports9010001. [DOI] [PMC free article] [PubMed] [Google Scholar]
- 62.Lännerström J, Nilsson L, Cardinale D, et al. Effects of plyometric training on soft and hard surfaces for improving running economy. J Hum Kinet. 2021;79:187–196. doi: 10.2478/hukin-2021-0071. [DOI] [PMC free article] [PubMed] [Google Scholar]
- 63.Roschel H, Barroso R, Tricoli V, et al. Effects of strength training associated with whole-body vibration training on running economy and vertical stiffness. J Strength Cond Res. 2015;29:2215–2220. doi: 10.1519/JSC.0000000000000857. [DOI] [PubMed] [Google Scholar]
- 64.Guglielmo L, Greco C, Denadai B. Effects of strength training on running economy. Int J Sports Med. 2009;30:27–32. doi: 10.1055/s-2008-1038792. [DOI] [PubMed] [Google Scholar]
- 65.Patoz A, Breine B, Thouvenot A, et al. Does characterizing global running pattern help to prescribe individualized strength training in recreational runners? Front Physiol. 2021;12:1–9. doi: 10.3389/fphys.2021.631637. [DOI] [PMC free article] [PubMed] [Google Scholar]
- 66.Taipale RS, Forssell J, Ihalainen JK, et al. A 10-week block of combined high-intensity endurance and strength training produced similar changes in dynamic strength, body composition, and serum hormones in women and men. Front Sports Act Living. 2020;2:1–14. doi: 10.3389/fspor.2020.581305. [DOI] [PMC free article] [PubMed] [Google Scholar]
- 67.Day EM, Hahn ME. Increased toe-flexor muscle strength does not alter metatarsophalangeal and ankle joint mechanics or running economy. J Sports Sci. 2019;37:2702–2710. doi: 10.1080/02640414.2019.1661562. [DOI] [PubMed] [Google Scholar]
- 68.Festa L, Tarperi C, Skroce K, et al. Effects of flywheel strength training on the running economy of recreational endurance runners. J Strength Cond Res. 2019;33:684–690. doi: 10.1519/JSC.0000000000002973. [DOI] [PubMed] [Google Scholar]
- 69.Finatto P, Da Silva ES, Okamura AB, et al. Pilates training improves 5-km run performance by changing metabolic cost and muscle activity in trained runners. PLoS One. 2018;13:1–19. doi: 10.1371/journal.pone.0194057. [DOI] [PMC free article] [PubMed] [Google Scholar]
- 70.Gottschall JS, Hastings B. An integrated core training program improves joint symmetry and metabolic economy in trained runners. J Sports Med Phys Fit. 2020;59:2003–2008. doi: 10.23736/S0022-4707.19.09619-1. [DOI] [PubMed] [Google Scholar]
- 71.Sato K, Mokha M. Does core strength training influence running kinetics, lower-extremity Ssability, and 5000-m performance in runners? J Strength Cond Res. 2009;23:133–140. doi: 10.1519/JSC.0b013e31818eb0c5. [DOI] [PubMed] [Google Scholar]
- 72.Paschalis V, Baltzopoulos V, Mougios V, et al. Isokinetic eccentric exercise of quadriceps femoris does not affect running economy. J Strength Cond Res. 2008;22:1222–1227. doi: 10.1519/JSC.0b013e318173da21. [DOI] [PubMed] [Google Scholar]
- 73.Luckin-Baldwin KM, Badenhorst CE, Cripps AJ, et al. Strength training improves exercise economy in triathletes during a simulated triathlon. Int J Sports Physiol Perform. 2021;16:663–673. doi: 10.1123/ijspp.2020-0170. [DOI] [PubMed] [Google Scholar]
- 74.Piacentini MF, De Ioannon G, Comotto S, et al. Concurrent strength and endurance training effects on running economy in master endurance runners. J Strength Cond Res. 2013;27:2295–2303. doi: 10.1519/JSC.0b013e3182794485. [DOI] [PubMed] [Google Scholar]
- 75.Albracht K, Arampatzis A. Exercise-induced changes in triceps surae tendon stiffness and muscle strength affect running economy in humans. Eur J Appl Physiol. 2013;113:1605–1615. doi: 10.1007/s00421-012-2585-4. [DOI] [PubMed] [Google Scholar]
- 76.Fletcher JR, Esau SP, MacIntosh BR. Changes in tendon stiffness and running economy in highly trained distance runners. Eur J Appl Physiol. 2010;110:1037–1046. doi: 10.1007/s00421-010-1582-8. [DOI] [PubMed] [Google Scholar]
- 77.Damasceno M, Pasqua L, Gáspari A, et al. Effects of strength training on bioenergetics parameters determined at velocity corresponding to maximal oxygen uptake in endurance runners. Sci Sports. 2018;33:e263–e270. doi: 10.1016/j.scispo.2018.04.004. [DOI] [Google Scholar]
- 78.Schumann M, Pelttari P, Doma K, et al. Neuromuscular adaptations to same-session combined endurance and strength training in recreational endurance runners. Int J Sports Med. 2016;37:1136–1143. doi: 10.1055/s-0042-112592. [DOI] [PubMed] [Google Scholar]
- 79.Taipale R, Mikkola J, Nummela A, et al. Strength training in endurance runners. Int J Sports Med. 2010;31:468–476. doi: 10.1055/s-0029-1243639. [DOI] [PubMed] [Google Scholar]
- 80.Vikmoen O, Rønnestad BR, Ellefsen S, et al. Heavy strength training improves running and cycling performance following prolonged submaximal work in well-trained female athletes. Physiol Rep. 2017;5:e13149. doi: 10.14814/phy2.13149. [DOI] [PMC free article] [PubMed] [Google Scholar]
- 81.Doma K, Schumann M, Sinclair WH, et al. The repeated bout effect of typical lower body strength training sessions on sub-maximal running performance and hormonal response. Eur J Appl Physiol. 2015;115:1789–1799. doi: 10.1007/s00421-015-3159-z. [DOI] [PubMed] [Google Scholar]
- 82.Guimarães MP, Campos YAC, de Souza HLR, et al. Effect of neuromuscular resistance training on the performance of 5-km runners. Kinesiology. 2020;52:64–71. doi: 10.26582/k.52.1.8. [DOI] [Google Scholar]
- 83.Ache-Dias J, Dellagrana RA, Teixeira AS, et al. Effect of jumping interval training on neuromuscular and physiological parameters: a randomized controlled study. Appl Physiol Nutr Metab. 2016;41:20–25. doi: 10.1139/apnm-2015-0368. [DOI] [PubMed] [Google Scholar]
- 84.Beattie K, Carson BP, Lyons M, et al. The effect of strength training on performance indicators in distance runners. J Strength Cond Res. 2017;31:9–23. doi: 10.1519/JSC.0000000000001464. [DOI] [PubMed] [Google Scholar]
- 85.Berryman N, Maurel D, Bosquet L. Effect of plyometric vs. dynamic weight training on the energy cost of running. J Strength Cond Res. 2010;24:1818–1825. doi: 10.1519/JSC.0b013e3181def1f5. [DOI] [PubMed] [Google Scholar]
- 86.Blagrove RC, Howe LP, Cushion EJ, et al. Effects of strength training on postpubertal adolescent distance runners. Med Sci Sports Exerc. 2018;50:1224–1232. doi: 10.1249/MSS.0000000000001543. [DOI] [PubMed] [Google Scholar]
- 87.Damasceno MV, Lima-Silva AE, Pasqua LA, et al. Effects of resistance training on neuromuscular characteristics and pacing during 10-km running time trial. Eur J Appl Physiol. 2015;115:1513–1522. doi: 10.1007/s00421-015-3130-z. [DOI] [PubMed] [Google Scholar]
- 88.Johnston RE, Quinn TJ, Kertzer R, et al. Strength training in female distance runners. J Strength Cond Res. 1997;11:224–229. doi: 10.1519/00124278-199711000-00004. [DOI] [Google Scholar]
- 89.Kelly CM, Burnett AF, Newton MJ. The effect of strength training on three-kilometer performance in recreational women endurance runners. J Strength Cond Res. 2008;22:396–403. doi: 10.1519/JSC.0b013e318163534a. [DOI] [PubMed] [Google Scholar]
- 90.Lum D, Tan F, Pang J, et al. Effects of intermittent sprint and plyometric training on endurance running performance. J Sport Health Sci. 2019;8:471–477. doi: 10.1016/j.jshs.2016.08.005. [DOI] [PMC free article] [PubMed] [Google Scholar]
- 91.Lum D, Barbosa TM, Aziz AR, et al. Effects of isometric strength and plyometric training on running performance: a randomized controlled study. Res Q Exerc Sport. 2023;94:263–271. doi: 10.1080/02701367.2021.1969330. [DOI] [PubMed] [Google Scholar]
- 92.Lundstrom CJ, Betker MR, Ingraham SJ. Effects of plyometric and explosive speed training on recreational marathoners. J Sports Sci. 2017;5:1–13. doi: 10.17265/2332-7839/2017.01.001. [DOI] [Google Scholar]
- 93.Mikkola J, Rusko H, Nummela A, et al. Concurrent endurance and explosive type strength training improves neuromuscular and anaerobic characteristics in young distance runners. Int J Sports Med. 2007;28:602–611. doi: 10.1055/s-2007-964849. [DOI] [PubMed] [Google Scholar]
- 94.Millet GP, Jaouen B, Borrani F, et al. Effects of concurrent endurance and strength training on running economy and VO2 kinetics. Med Sci Sports Exerc. 2002;34:1351–1359. doi: 10.1097/00005768-200208000-00018. [DOI] [PubMed] [Google Scholar]
- 95.Pellegrino J, Ruby BC, Dumke CL. Effect of plyometrics on the energy cost of running and MHC and titin isoforms. Med Sci Sports Exerc. 2016;48:49–56. doi: 10.1249/MSS.0000000000000747. [DOI] [PubMed] [Google Scholar]
- 96.Saunders PU, Telford RD, Pyne DB, et al. Short-term plyometric training improves running economy in highly trained middle and long distance runners. J Strength Cond Res. 2006;20:947. doi: 10.1519/R-18235.1. [DOI] [PubMed] [Google Scholar]
- 97.Sedano S, Marín PJ, Cuadrado G, et al. Concurrent training in elite male runners: the influence of strength versus muscular endurance training on performance outcomes. J Strength Cond Res. 2013;27:2433–2443. doi: 10.1519/JSC.0b013e318280cc26. [DOI] [PubMed] [Google Scholar]
- 98.Skovgaard C, Christensen PM, Larsen S, et al. Concurrent speed endurance and resistance training improves performance, running economy, and muscle NHE1 in moderately trained runners. J Appl Physiol. 1985;2014(117):1097–1109. doi: 10.1152/japplphysiol.01226.2013. [DOI] [PubMed] [Google Scholar]
- 99.Spurrs RW, Murphy AJ, Watsford ML. The effect of plyometric training on distance running performance. Eur J Appl Physiol. 2003;89:1–7. doi: 10.1007/s00421-002-0741-y. [DOI] [PubMed] [Google Scholar]
- 100.Štohanzl M, Baláš J, Draper N. Effects of minimal dose of strength training on running performance in female recreational runners. J Sports Med Phys Fit. 2018;58:1211–1217. doi: 10.23736/S0022-4707.17.07124-9. [DOI] [PubMed] [Google Scholar]
- 101.Støren O, Helgerud J, Støa EM, et al. Maximal strength training improves running economy in distance runners. Med Sci Sports Exerc. 2008;40:1087–1092. doi: 10.1249/MSS.0b013e318168da2f. [DOI] [PubMed] [Google Scholar]
- 102.Taipale RS, Mikkola J, Salo T, et al. Mixed maximal and explosive strength training in recreational endurance runners. J Strength Cond Res. 2014;28:689–699. doi: 10.1519/JSC.0b013e3182a16d73. [DOI] [PubMed] [Google Scholar]
- 103.Trowell D, Fox A, Saunders N, et al. Effect of concurrent strength and endurance training on run performance and biomechanics: a randomized controlled trial. Scand J Med Sci Sports. 2021;32:543–558. doi: 10.1111/sms.14092. [DOI] [PubMed] [Google Scholar]
- 104.Turner AM, Owings M, Schwane JA. Improvement in running economy after 6 weeks of plyometric training. J Strength Cond Res. 2003;17:60–67. doi: 10.1519/1533-4287(2003)017<0060:iireaw>2.0.co;2. [DOI] [PubMed] [Google Scholar]
- 105.Vikmoen O, Raastad T, Seynnes O, et al. Effects of heavy strength training on running performance and determinants of running performance in female endurance athletes. PLoS One. 2016;11:e0150799. doi: 10.1371/journal.pone.0150799. [DOI] [PMC free article] [PubMed] [Google Scholar]
- 106.Vorup J, Tybirk J, Gunnarsson TP, et al. Effect of speed endurance and strength training on performance, running economy and muscular adaptations in endurance-trained runners. Eur J Appl Physiol. 2016;116:1331–1341. doi: 10.1007/s00421-016-3356-4. [DOI] [PubMed] [Google Scholar]
- 107.Mikkola J, Vesterinen V, Taipale R, et al. Effect of resistance training regimens on treadmill running and neuromuscular performance in recreational endurance runners. J Sports Sci. 2011;29:1359–1371. doi: 10.1080/02640414.2011.589467. [DOI] [PubMed] [Google Scholar]
- 108.Hamilton RJ, Paton CD, Hopkins WG. Effect of high-intensity resistance training on performance of competitive distance runners. Int J Sports Physiol Perform. 2006;1:40–49. doi: 10.1123/ijspp.1.1.40. [DOI] [PubMed] [Google Scholar]
- 109.Karsten B, Stevens L, Colpus M, et al. The effects of sport-specific maximal strength and conditioning training on critical velocity, anaerobic running distance, and 5-km race performance. Int J Sports Physiol Perform. 2016;11:80–85. doi: 10.1123/ijspp.2014-0559. [DOI] [PubMed] [Google Scholar]
- 110.Schumann M, Mykkänen O-P, Doma K, et al. Effects of endurance training only versus same-session combined endurance and strength training on physical performance and serum hormone concentrations in recreational endurance runners. Appl Physiol Nutr Metab. 2015;40:28–36. doi: 10.1139/apnm-2014-0262. [DOI] [PubMed] [Google Scholar]
- 111.Bachero-Mena B, Pareja-Blanco F, González-Badillo JJ. Effects of resistance training on physical performance in high-level 800-m athletes. J Strength Cond Res. 2019;35:1905–1915. doi: 10.1519/JSC.0000000000003066. [DOI] [PubMed] [Google Scholar]
- 112.Ramírez-Campillo R, Álvarez C, Henríquez-Olguín C, et al. Effects of plyometric training on endurance and explosive strength performance in competitive middle- and long-distance runners. J Strength Cond Res. 2014;28:97–104. doi: 10.1519/JSC.0b013e3182a1f44.c. [DOI] [PubMed] [Google Scholar]
- 113.García-Pinillos F, Lago-Fuentes C, Latorre-Román PA, et al. Jump-rope training: improved 3-km time-trial performance in endurance runners via enhanced lower-limb reactivity and foot-arch stiffness. Int J Sports Physiol Perform. 2020;15:927–933. doi: 10.1123/ijspp.2019-0529. [DOI] [PubMed] [Google Scholar]
- 114.Machado AF, De Castro JBP, Bocalini DS, et al. Effects of plyometric training on the performance of 5-km road runners. J Phys Educ Sport. 2019;19:691–695. doi: 10.7752/jpes.2019.01099. [DOI] [Google Scholar]
- 115.Legaz-Arrese A, Munguía-Izquierdo D, Nuviala Nuviala A, et al. Average VO2max as a function of running performances on different distances. Sci Sports. 2007;22:43–49. doi: 10.1016/j.scispo.2006.01.008. [DOI] [Google Scholar]
- 116.Levine BD. VO2, max: what do we know, and what do we still need to know? J Physiol. 2008;586:25–34. doi: 10.1113/jphysiol.2007.147629. [DOI] [PMC free article] [PubMed] [Google Scholar]
- 117.Saltin B, Calbet JAL. Point: in health and in a normoxic environment, VO2 max is limited primarily by cardiac output and locomotor muscle blood flow. J Appl Physiol. 2006;100:744–748. doi: 10.1152/ajpregu.00332.2005. [DOI] [PubMed] [Google Scholar]
- 118.Hurley BF, Seals DR, Ehsani AA, et al. Effects of high-intensity strength training on cardiovascular function. Med Sci Sports Exerc. 1984;16:483–488. doi: 10.1249/00005768-198410000-00011. [DOI] [PubMed] [Google Scholar]
- 119.Davies CTM, Knibbs AV. The training stimulus: the effects of intensity, duration and frequency of effort on maximum aerobic power output. Int Z Angew Physiol Einschl Arbeitsphysiol. 1971;29:299–305. doi: 10.1007/BF00697733. [DOI] [PubMed] [Google Scholar]
- 120.Aagaard P, Andersen JL. Effects of strength training on endurance capacity in top-level endurance athletes. Scand J Med Sci Sports. 2010;20:39–47. doi: 10.1111/j.1600-0838.2010.01197.x. [DOI] [PubMed] [Google Scholar]
- 121.Paavolainen L, Nummela A, Rusko H. Muscle power factors and VO2max as determinants of horizontal and uphill running performance. Scand J Med Sci Sports. 2000;10:286–291. doi: 10.1034/j.1600-0838.2000.010005286.x. [DOI] [PubMed] [Google Scholar]
- 122.Du Z, Lu W, Lang D. Comparison between 2,000 m and 3,000 m time trials to estimate the maximal aerobic speed for collegiate runners. Front Physiol. 2022;13:1–8. doi: 10.3389/fphys.2022.1005259. [DOI] [PMC free article] [PubMed] [Google Scholar]
- 123.Mccormack WP, Shoepe TC, Almstedt HC, et al. Velocity at maximal oxygen uptake best predicts 3 km race time in collegiate distance runners. J Hum Sport Exerc. 2018;13:631–638. doi: 10.14198/jhse.2018.133.13. [DOI] [Google Scholar]
- 124.McLaughlin JE, Howley ET, Bassett DR, et al. Test of the classic model for predicting endurance running performance. Med Sci Sports Exerc. 2010;42:991–997. doi: 10.1249/MSS.0b013e3181c0669d. [DOI] [PubMed] [Google Scholar]
- 125.Morgan DW, Baldini FD, Martin PE, et al. Ten kilometre performance and predicted velocity at VO2max among well trained male runners. Med Sci Sports Exerc. 1989;21:78–83. doi: 10.1249/00005768-198902000-00014. [DOI] [PubMed] [Google Scholar]
- 126.Da Silva DF, Machado FA. Relation of different methods to estimate maximal aerobic speed with performance in recreational/amateur runners. Med Sport. 2015;68:179–191. [Google Scholar]
- 127.Midgley AW, McNaughton LR, Carroll S. Time at VO2max during intermittent treadmill running: test protocol dependent or methodological artefact? Int J Sports Med. 2007;28:934–939. doi: 10.1055/s-2007-964972. [DOI] [PubMed] [Google Scholar]
- 128.Panissa LG, Shiroma SA, Franchini E, et al. Effect of protocol manipulation for determining maximal aerobic power on a treadmill and cycle ergometer: a brief review. Nat Strength Condit Assoc. 2017;39:58–71. doi: 10.1519/SSC.0000000000000350. [DOI] [Google Scholar]
- 129.Poole DC, Rossiter HB, Brooks GA, et al. The anaerobic threshold: 50+years of controversy. J Physiol. 2021;599:737–767. doi: 10.1113/JP279963. [DOI] [PubMed] [Google Scholar]
- 130.Wasserman K, McIlroy MB. Detecting the threshold of anaerobic metabolism in cardiac patients during exercise. Am J Cardiol. 1964;14:844–852. doi: 10.1016/0002-9149(64)90012-8. [DOI] [PubMed] [Google Scholar]
- 131.Jones AM, Vanhatalo A. The ‘critical power’ concept: applications to sports performance with a focus on intermittent high-intensity exercise. Sports Med. 2017;47:65–78. doi: 10.1007/s40279-017-0688-0. [DOI] [PMC free article] [PubMed] [Google Scholar]
- 132.Londeree BR. Effect of training on lactate/ventilatory thresholds: a meta-analysis. Med Sci Sports Exerc. 1997;29:837–843. doi: 10.1097/00005768-199706000-00016. [DOI] [PubMed] [Google Scholar]
- 133.Garnacho-Castaño MV, Dominguez R, Maté-Muñoz JL. Understanding the meaning of lactate threshold in resistance exercises. Int J Sports Med. 2015;36:371–377. doi: 10.1055/s-0034-1398495. [DOI] [PubMed] [Google Scholar]
- 134.Sandford GN, Allen SV, Kilding AE, et al. Anaerobic speed reserve: a key component of elite male 800-m running. Int J Sports Physiol Perform. 2019;14:501–508. doi: 10.1123/ijspp.2018-0163. [DOI] [PubMed] [Google Scholar]
- 135.Hallam LC, Ducharme JB, Mang ZA, et al. The role of the anaerobic speed reserve in female middle-distance running. Sci Sports. 2022;37(637):e1–8. doi: 10.1016/j.scispo.2021.07.006. [DOI] [Google Scholar]
- 136.Bundle MW, Weyand PG. Sprint exercise performance: does metabolic power matter? Exerc Sport Sci Rev. 2012;40:174–182. doi: 10.1097/JES.0b013e318258e1c1. [DOI] [PubMed] [Google Scholar]
- 137.Paavolainen L, Nummela A, Rusko H, et al. Neuromuscular characteristics and fatigue during 10 km running. Int J Sports Med. 1999;20:516–521. doi: 10.1055/s-1999-8837. [DOI] [PubMed] [Google Scholar]
- 138.Hayes PR, Gordon DA. Physiological determinants of middle-and long-distance running. In: Blagrove RC, Hayes PR, editors. The science and practice of middle and long distance running. New York: Routledge; 2021. pp. 3–16. [Google Scholar]
- 139.Aagaard P, Simonsen EB, Andersen JL, et al. Increased rate of force development and neural drive of human skeletal muscle following resistance training. J Appl Physiol. 2002;93:1318–1326. doi: 10.1152/japplphysiol.00283.2002. [DOI] [PubMed] [Google Scholar]
- 140.Lum D, Chua K, Rashid AA. Isometric mid-thigh pull force-time characteristics: a good indicator of running performance. J Train. 2020;9:54–59. doi: 10.17338/trainology.9.2_54. [DOI] [Google Scholar]
- 141.Fletcher JR, MacIntosh BR. Running economy from a muscle energetics perspective. Front Physiol. 2017;8:1–15. doi: 10.3389/fphys.2017.00433. [DOI] [PMC free article] [PubMed] [Google Scholar]
- 142.Zhang Q, Nassis GP, Chen S, et al. Not lower-limb joint strength and stiffness but vertical stiffness and isometric force-time characteristics correlate with running economy in recreational male runners. Front Physiol. 2022;13:1–12. doi: 10.3389/fphys.2022.940761. [DOI] [PMC free article] [PubMed] [Google Scholar]
- 143.Li F, Newton RU, Shi Y, et al. Correlation of eccentric strength, reactive strength, and leg stiffness with running economy in well-trained distance runners. J Strength Cond Res. 2021;35:1491–1499. doi: 10.1519/JSC.0000000000003446. [DOI] [PubMed] [Google Scholar]
- 144.Liu B, Wu J, Shi Q, et al. Running economy and lower extremity stiffness in endurance runners: a systematic review and meta-analysis. Front Physiol. 2022;13:1–13. doi: 10.3389/fphys.2022.1059221. [DOI] [PMC free article] [PubMed] [Google Scholar]
- 145.Moore IS, Ashford KJ, Cross C, et al. Humans optimize ground contact time and leg stiffness to minimize the metabolic cost of running. Front Sports Act Living. 2019;1:1–10. doi: 10.3389/fspor.2019.00053. [DOI] [PMC free article] [PubMed] [Google Scholar]
- 146.Nummela AT, Paavolainen LM, Sharwood KA, et al. Neuromuscular factors determining 5 km running performance and running economy in well-trained athletes. Eur J Appl Physiol. 2006;97:1–8. doi: 10.1007/s00421-006-0147-3. [DOI] [PubMed] [Google Scholar]
- 147.Hayes PR, French DN, Thomas K. The effect of muscular endurance on running economy. J Strength Cond Res. 2011;25:2464–2469. doi: 10.1519/JSC.0b013e3181fb4284. [DOI] [PubMed] [Google Scholar]
- 148.Coyle EF. Integration of the physiological factors determining endurance performance ability. Exerc Sport Sci Rev. 1995;23:25–63. doi: 10.1249/00003677-199500230-00004. [DOI] [PubMed] [Google Scholar]
- 149.Markovic G, Mikulic P. Neuro-musculoskeletal and performance adaptations to lower-extremity plyometric training. Sports Med. 2010;40:859–895. doi: 10.2165/11318370-000000000-00000. [DOI] [PubMed] [Google Scholar]
- 150.Kubo K, Ishigaki T, Ikebukuro T. Effects of plyometric and isometric training on muscle and tendon stiffness in vivo. Physiol Rep. 2017;5:1–13. doi: 10.14814/phy2.13374. [DOI] [PMC free article] [PubMed] [Google Scholar]
- 151.Marshall J, Bishop C, Turner A, et al. Optimal training sequences to develop lower body force, velocity, power, and jump height: a systematic review with meta-analysis. Sports Med. 2021;51:1245–1271. doi: 10.1007/s40279-021-01430-z. [DOI] [PubMed] [Google Scholar]
- 152.Pareja-Blanco F, Rodríguez-Rosell D, Sánchez-Medina L, et al. Effect of movement velocity during resistance training on neuromuscular performance. Int J Sports Med. 2014;35:916–924. doi: 10.1055/s-0033-1363985. [DOI] [PubMed] [Google Scholar]
- 153.Maunder E, Seiler S, Mildenhall MJ, et al. The importance of ‘durability’ in the physiological profiling of endurance athletes. Sports Med. 2021;51:1619–1628. doi: 10.1007/s40279-021-01459-0. [DOI] [PubMed] [Google Scholar]
Associated Data
This section collects any data citations, data availability statements, or supplementary materials included in this article.