

Abstract
The disparity in life expectancy between white and black Americans exceeds five years for men and three years for women. While prior research has investigated the roles of healthcare, health behaviors, biological risk, socioeconomic status, and life course effects on black mortality, the literature on the geographic origins of the gap is more limited. This study examines how the black-white life expectancy gap varies across counties and how much of the national gap is attributable to within-county racial inequality versus differences between counties. The estimates suggest that over 90% of the national gap can be attributed to within-county factors. Using a quasi-experimental research design, I find that black-white residential segregation increases the gap by approximately 16 years for men and five years for women. The segregation effect loads heavily on causes of death associated with access to and quality of healthcare; safety and violence; and public health measures. Residential segregation does not appear to operate through health behaviors or individual-level factors, but instead acts primarily through institutional mechanisms. Efforts to address racial disparities in mortality should focus on reducing racial residential segregation or reducing inequalities in the mechanisms through which residential segregation acts: public services, employment opportunities, and community resources.
Introduction
That black Americans live shorter lives than their white counterparts is perhaps the most consistent and longstanding empirical association in social demography. Some of the earliest observations regarding this association date back to 19th-century Philadelphia, where W.E.B. Du Bois determined that not only did black Philadelphians have higher mortality than whites, but that levels of black mortality varied by location within the city, with blacks living in the lower-class eastern wards abutting the Delaware experiencing much higher rates of death than those in the middle-class western wards lining the Schuylkill River (Du Bois 1899). This same pattern of high rates of black mortality prevailed in nearly all cities, as well as in much of the American South. In the century that followed, the evidence base on elevated rates of black mortality grew. Early research efforts by sociologists, demographers, and actuaries working for insurance firms built on Du Bois’s work and identified adverse living conditions and extreme poverty as among the chief factors explaining the woefully high rates of mortality experienced by urban blacks (Ewbank 1987).
The new availability of microdata starting in the 1970s and stretching through the contemporary era provided an opportunity for researchers to examine the individual-level factors leading to high rates of black mortality. This line of inquiry focused on individual-level factors like educational attainment, health behaviors, earnings, insurance coverage, and chronic disease risk in trying to understand the reasons behind high black mortality rates. The findings were enlightening. Research showed that blacks with higher levels of education lived significantly longer than those with less education (Meara, Richards, and Cutler 2008; Hendi 2017; Elo and Preston 1996; Montez et al. 2011). Insurance coverage and access to care tend to be associated with lower black mortality, as are higher levels of income (Elo, Beltrán-Sánchez, and Macinko 2014). At various points in the 20th and early 21st centuries, cigarette smoking and drug overdose have been implicated as major factors in explaining higher rates of black mortality (Ho and Elo 2013; Alexander, Kiang, and Barbieri 2018). Information from health surveys and medical records have helped to identify the specific diseases—respiratory diseases, diabetes, and increasingly cardiovascular disease—associated with higher levels of black mortality (Berkman, Singer, and Manton 1989). What’s shared across all of these studies is that even after adjusting for socioeconomic, biological, behavioral, and medical risk factors, a significant portion of the black mortality disadvantage remains unexplained.
One area of promise that has been underexplored is the role of place as an underlying factor explaining elevated levels of black mortality. Research in this area has shown that blacks living in the Deep South and in the inner cities of large metropolitan areas tend to have significantly higher mortality than blacks living elsewhere (Harper, MacLehose, and Kaufman 2014; Murray et al. 2006). This place-based effect is amplified at the national level since blacks disproportionately reside in the South and in big cities. A central question in regard to place that remains unresolved is thus whether the national black-white life expectancy gap can be attributed to the fact that blacks and whites live in different places or to the fact that even when they co-reside within the same general areas, blacks experience higher death rates than do whites. In essence, this is a question of locating where precisely the national black-white life expectancy gap comes from.
Place is a central determinant of longevity because one’s place of residence structures one’s daily interactions and influences many of the institutions that govern the health and well-being of populations, including an individual’s social and economic opportunities, access to and quality of health care, exposure to safety and violence, and development of information networks. The effects of place can manifest differently for different racial groups. Because blacks and whites tend to live in different places, they experience different levels of exposure to particular place-based effects. Even when blacks and whites live in the same place, whites may benefit more from the longevity-promoting characteristics of a place because they are often the ones who set in play and control the system through which place-based benefits are distributed.
Compounding our conceptual difficulties in understanding where the black-white gap comes from is the fact that most past studies have used observational data or methodologies that do not elucidate chains of causation. Most studies have regressed mortality on county-level characteristics, making it difficult to uncover the true underlying mechanisms responsible for within-county racial inequalities in mortality.
This study contributes to the literature on black-white mortality differentials by identifying how much of the national black-white life expectancy gap arises from the different distribution of blacks versus whites across U.S. counties, and how much of the gap comes from black-white mortality differences occurring within particular geographic areas. The first main finding is that over 90% of the national black-white life expectancy gap is due to within-county black-white mortality differences as opposed to differences in the counties in which blacks and whites reside. Thus, it is not so much the fact that blacks overwhelmingly live in Southern and large urban counties that is driving their mortality disadvantage, but it is instead the fact that whites within these same areas are able to sustain significantly lower mortality than their black counterparts.
The second main finding of this article is that within-county residential segregation is the major driver of black-white life expectancy gaps. Using a quasi-experimental research design that exploits the neighborhood divisions created by nineteenth-century railroad track crossings, I find that residential segregation causes the black-white life expectancy gap to widen by over 16 years for men and nearly five years for women. A cause of death analysis suggests that this effect operates mainly through causes closely associated with health care system factors, safety, and public health measures. Relatively little of the segregation effect is found to operate through causes closely linked to health behaviors or environmental conditions. This finding suggests that place plays a central role in driving the national black-white life expectancy gap, though at a lower geographic level than many previous studies have considered.
The remainder of this article describes the relationship between place and mortality, outlines the data and methods used, including the formal demographic relations developed to measure the geographic contributions to the national black-white2 gap, and presents and discusses the results in the context of the previous literature.
Place and Racial Differences in Mortality
The previous literature on place and racial inequalities in mortality has concentrated on the central roles of two important groups: poor, rural blacks and high-risk inner-city blacks. These two groups have among the most adverse mortality patterns among all place-race groups, and studies have correctly suggested that addressing the poor mortality conditions among these groups would reduce national black-white disparities (Harper, MacLehose, and Kaufman 2014; Murray et al. 2006). Blacks living in the central cities of primarily northern metros have been subject to drug epidemics, poverty, violence, and persistent underinvestment. These social forces have led to high rates of mortality among urban blacks from causes of death as varied as drug overdose, cardiovascular disease, homicide, HIV/AIDS, and infant mortality. This was especially evident in the early 1990s, when the black-white life expectancy gap peaked.
Poor, rural blacks also face elevated levels of mortality compared to many other place-race groups, but for different reasons than inner-city blacks. Blacks living in rural areas are primarily located in the U.S. South. Violent deaths and HIV/AIDS are much less common among these populations. However, poor rural blacks are more likely to be exposed to infectious disease pathogens propagated by low-quality water delivery and treatment systems, dangerous or dilapidated housing, rural hospital closures, and inadequate healthcare facilities and treatment options. The deficient or nonexistent water treatment infrastructure has led to significantly higher rates of infectious disease mortality among poor, rural blacks, and is likely to contribute to elevated rates of chronic disease mortality. All of the aforementioned infrastructural deficiencies likely contribute to high rates of cardiovascular disease and cancer mortality for poor, rural black men and women. The only major advantage that this latter group possesses over their inner-city black counterparts is that they are partially shielded from high rates of homicide mortality.
While both of these groups are important, the focus on them makes an implicit assumption that it is the quality of the broad type of place (e.g., urban areas, rural counties) that drives these groups’ poor mortality trajectories. In other words, these studies tell a story about differences between counties, as opposed to inequalities within counties. This seems sensible when considering black mortality prior to the 1990s, when so much of the black population was concentrated in central cities and the American South. But times have changed, and black Americans increasingly live in northern metropolitan suburbs, parts of the West, and nonrural Southern counties. As blacks moved away from areas whose characteristics were hypothesized to give rise to high black mortality, we might have expected the large national black-white life expectancy gap to diminish to near zero. While black mortality has improved tremendously and white mortality has stalled in recent years, a large national black-white gap remains. Even northern and southern suburban counties that experienced high rates of black in-migration have large and persistent racial disparities in mortality. This suggests that the theoretical mechanism responsible for the national black-white gap is more likely to operate at the within-county versus between-county level.
No previous study has actually documented how much of the national black-white gap is due to within- versus between-county inequality. Even if much of the national gap is due to within-county factors, it would be inaccurate to describe place as irrelevant for racial inequalities in mortality. Indeed, this study explores the claim that within-county black-white residential segregation is a fundamental and central cause of the national black-white gap.
Residential segregation is hypothesized to influence racial inequalities in mortality through its effects on social and economic resources, health behaviors, neighborhood resources, and the development and maintenance of social networks and information sets (Massey, Condran, and Denton 1987; Williams and Collins 2001; LaVeist 1993; Acevedo-Garcia et al. 2003). Residential segregation has been linked to racial disparities in educational attainment and earnings (Quillian 2014; Ananat 2011), which themselves may be determinants of mortality. Residential segregation also creates the capacity for racial inequalities in neighborhood resources including access to high-quality hospitals (Gaskin et al. 2009); the presence of safe and effective policing (Siegel et al. 2019; Diehr and McDaniel 2018); parks, streetlamps, and other forms of physical infrastructure (Trounstine 2016); and the presence of grocery stores, pharmacies, and other businesses that influence health and well-being (Guadamuz et al. 2021; Bower et al. 2014). While residential segregation was initially the result of racist housing covenants and conscious attempts by whites to avoid living alongside blacks and other nonwhites, there is evidence that it is increasingly being maintained by racial inequalities in information sets and social networks. Because blacks and whites already tend to live in very different areas, their networks tend not to overlap, and their daily activities—shopping, working, and spending leisure time—tend not to bring them to each others’ locales. In other words, residential segregation leads to network divides, which in turn reinforce already-existing segregation in what has been termed a cycle of segregation (Krysan and Crowder 2017). Whether contemporary segregation is driven by outright preference for racial division or by factors related to asymmetric information sets, it is clear that black-white residential segregation is itself a form of structural racism. Information and networks, social and economic resources, and neighborhood resources have the potential to influence the uptake of adverse health behaviors like cigarette smoking, drug use, binge drinking, or unsafe sex, which in turn are among the most important determinants of variation in U.S. mortality (Kramer and Hogue 2009).
One social process that independently influences both segregation and mortality is racism, by which we mean either interpersonal racism or racist ideologies that may result in a preference for racial residential segregation. Counties where racist ideologies are more prevalent may be more likely to generate residential segregation and may also, independently, produce more adverse mortality outcomes for blacks. While residential segregation has a direct and causal effect on mortality patterns, it may be difficult to measure statistically. Because racism is correlated with residential segregation and may also independently influence mortality, we may be concerned that measuring the direct association between segregation and mortality would lead to a misleading conclusion about the causal influence of segregation on mortality. There are likely many additional sources of endogeneity in the relationship between residential segregation and the black-white mortality gap. Highly segregated areas are often located in large cities that have other characteristics that tend to decrease black-white mortality gaps: the presence of high-quality hospitals, access to trauma centers, and more restrictive gun laws. Because of the multiple forms of endogeneity likely to be present in the segregation-mortality relationship, and because the different forms of endogeneity can either augment or diminish the measured association between segregation and the black-white mortality gap, measuring the direct association between black-white residential segregation and the mortality gap may not yield a causal estimate of the statistical effect. These inferential challenges have prevented mortality researchers from developing a fuller understanding of whether and why residential segregation may be a fundamental, casual determinant of the national black-white life expectancy gap.
Data and Methods
This study uses two main sources of data: death certificate records and census population counts. Information on deaths comes from the restricted-use Multiple Cause of Death file produced by the National Center for Health Statistics (NCHS) for each year between 1990 and 2019. These are combined with the NCHS bridged-race population estimates for each year between 1990 and 2019 to produce death rates. Bridged-race population estimates recategorize individuals from their 1997 OMB racial/ethnic categorization into single-race categories that are consistent with the death records. This enables us to estimate a consistent set of mortality rates over the entire study period.
Outcome and Explanatory Measures
The main outcome measures are life expectancy at birth and the black-white gap in life expectancy at birth (Preston, Heuveline, and Guillot 2001). The latter is the white life expectancy at birth less the black life expectancy at birth.
The explanatory measure in the second half of the analysis is the black-white index of dissimilarity, the most commonly employed measure of residential segregation (Massey and Denton 1988). It measures the proportion of the black or white population that would have to move from one census tract to another in order to achieve uniform proportions of blacks (or whites) living in each tract. The index of dissimilarity ranges from 0 to 1, with 0 indicating equal distributions of blacks and whites across tracts and 1 indicating that blacks and whites live in entirely different tracts. The index for residential segregation is computed using fine-grained data on the number of black and white individuals living in each census tract. This data comes from the 1990 and 2020 decadal census summary files.
Analytic Approach
The two main objectives of this study are: (1) to estimate how much of the national black-white life expectancy gap comes from within-county inequality versus between-county inequality, and (2) to assess the role of racial residential segregation in driving within-county black-white life expectancy gaps.
For the first goal, we equalize black and white mortality in each county and then examine the counterfactual national black-white life expectancy gap. The total contribution of within-county racial differences to the national life expectancy gap is thus:
where is the probability that a newborn black child survives to age ; is the proportion of blacks aged living in county ; is the force of mortality, or instantaneous death rate, at age for race group in county ; is the number of deaths in the black population at age ; and are the black population totals at age for county and the nation, respectively; and is national black life expectancy. The difference between the observed national black-white gap and the within-county contribution equals the between-county contribution. We utilize data on the 3,126 counties and county equivalents in the United States or some subset therein. These counties represent administrative subdivisions of the country and often have highly varying land areas. The reason we choose counties as the unit of analysis is that many of the mechanisms hypothesized to link residential segregation and mortality operate within administrative divisions.
Residential Segregation Regressions
To assess the impact of residential segregation on the black-white life expectancy gap, we take a regression approach, where the outcome is the contribution of cause of death to the black-white life expectancy gap in county :
where is the proportion of deaths at ages to due to cause of death among people from race group living in county ; is the death rate at ages to for people in race group living in county ; and is the number of years whites outlive blacks in county due to excess mortality at ages to . The latter quantity is calculated by applying Arriaga’s (1984) decomposition of black-white life expectancy differences into age group contributions. The causes of death are chosen to reflect broad categories of mortality that still retain social and biological relevance. For example, alcohol-related deaths are included in a single category since they almost all have a single, underlying driver (alcohol abuse), while drug overdose deaths are separated from other injuries since they result from distinct biological and social processes. The categories are kept broad to minimize issues arising from competing risks. The causes of death are listed in Appendix Table A1.
Each cause-specific value (for cause of death ) is then regressed on the county-level black-white index of dissimilarity. Because the OLS estimator is linear in the outcome variable, it is additive in additive components of the outcome. Thus, the linear associations between residential segregation and the cause-specific black-white life expectancy gaps sum to the total (“all-cause”) black-white life expectancy gap.
Instrumental Variables Regression
Though the above regressions provide estimates of the association between residential segregation and the black-white gap, they do not constitute a causal estimate. The concern with the above regressions is that residential segregation is nonrandomly assigned to counties. It is likely that some third factor, such as racial attitudes in a county, might drive both residential segregation and the black-white gap. In such a scenario, the OLS estimates would be biased estimates of the true causal impact of segregation on the gap. To get a causal estimate, we use an instrumental variable approach.
Any instrumental variable must satisfy two conditions: relevance and exogeneity. Relevance requires the instrument to be correlated with the endogenous variable (residential segregation). Exogeneity requires that the instrument only be correlated with the outcome through the endogenous variable—that is, the instrumental variable should not act through tertiary variables to influence the outcome. The instrument we use in this study is a “railroad division index.” This index, created and used in prior research to estimate the causal effect of segregation on poverty, measures the extent to which 19th-century railroad track crossings subdivide land into distinct neighborhoods (Ananat 2011). For a given place, we use records on 19th-century railroad track crossings to define neighborhoods, where each neighborhood is contained within a boundary of crossings. The area contained within each of these neighborhoods is calculated, and then the railroad division index is computed as
where is the area contained in neighborhood and the summation is over all neighborhoods in a given place. The index attains a minimum value of 0 (the lowest potential for segregation) if the place is not divided by railroad track crossings at all. As the number of crossings grows and the size of each neighborhood generated by the crossings shrinks, the railroad division index converges to a maximum value of 1 (the highest potential for segregation).
The railroad division index satisfies the relevance condition since having more neighborhoods in a given area leads to a greater potential for residential segregation. The more subdivided is a unit of land by railroad tracks, the more distinct neighborhoods there can be in which blacks and whites can separately live. The first stage F-statistic for the instrument is well above 10, indicating an acceptable level of relevance (Staiger and Stock 1997). The instrument satisfies the exogeneity condition because the tracks were laid in the 19th century, well before the Great Migration of blacks to the North, and the tracks were laid randomly with respect to socioeconomic characteristics and were instead laid according to more mundane topographical factors like land grade (Ananat 2011; Wellington 1914). In most cases, the tracks were laid in unoccupied areas. Had the tracks been laid more recently—after the Great Migration—or following land pricing or some obvious social pattern, then the railroad divisions could have been a result of instead of a driver of residential segregation. This last point is why using 19th-century railroad crossings would be a more valid approach than using, for example, neighborhood divisions generated by 20th-century highway crossings. This instrument is only calculated for non-Southern locations, since blacks already were widely distributed in the South prior to the tracks being laid. If we included Southern counties in the instrumental variable analysis then it is unlikely the instrument would be exogenous, since tracks in those areas may have been laid partly on the basis of the racial-geographic distribution of the population. The instrument is available for a total of 112 counties. These 112 places are not necessarily randomly chosen, but have been shown to be uncorrelated with characteristics predictive of factors correlated with mortality gaps. Thus, using the instrumental variable approach allows one to generate an internally valid causal estimate of the effect of residential segregation on the black-white life expectancy gap, but that estimate isn’t necessarily representative of all types of counties. Also important for identification is that the instrument is predictive of racial segregation but not income segregation, meaning that the empirical strategy used in this analysis will not misattribute income segregation effects to racial residential segregation effects (Ananat 2011).
Similar to the OLS estimator, the IV regression can be additively decomposed into the cause-specific effects of residential segregation. Conventional standard errors for life expectancy estimates tend to underestimate the true amount of sampling variation, so we use the adjusted procedure for producing standard errors described in Appendix B.
Results
The findings are organized into three subsections—national-level trends in longevity, geographic inequality and locating the black-white life expectancy gap, and within-county residential segregation—reflecting both the analytic strategy used in this article as well as the theoretical mechanisms underlying trends in the black-white life expectancy gap.
National-Level Trends in Longevity
Figure 1 (top panel) graphs life expectancy at birth for non-Hispanic black and white men and women between 1990 and 2019. All four race-sex group combinations experienced increases in life expectancy over this period. Non-Hispanic white life expectancy increased from 79 to 82 years for women and from 72.5 to 76 years for men. Non-Hispanic blacks experienced increases from 74 to 77 years for women and from 64 to 72 years for men.
FIGURE 1. Life Expectancy at Birth by Race and the Black-White Life Expectancy Gap, 1990–2019.
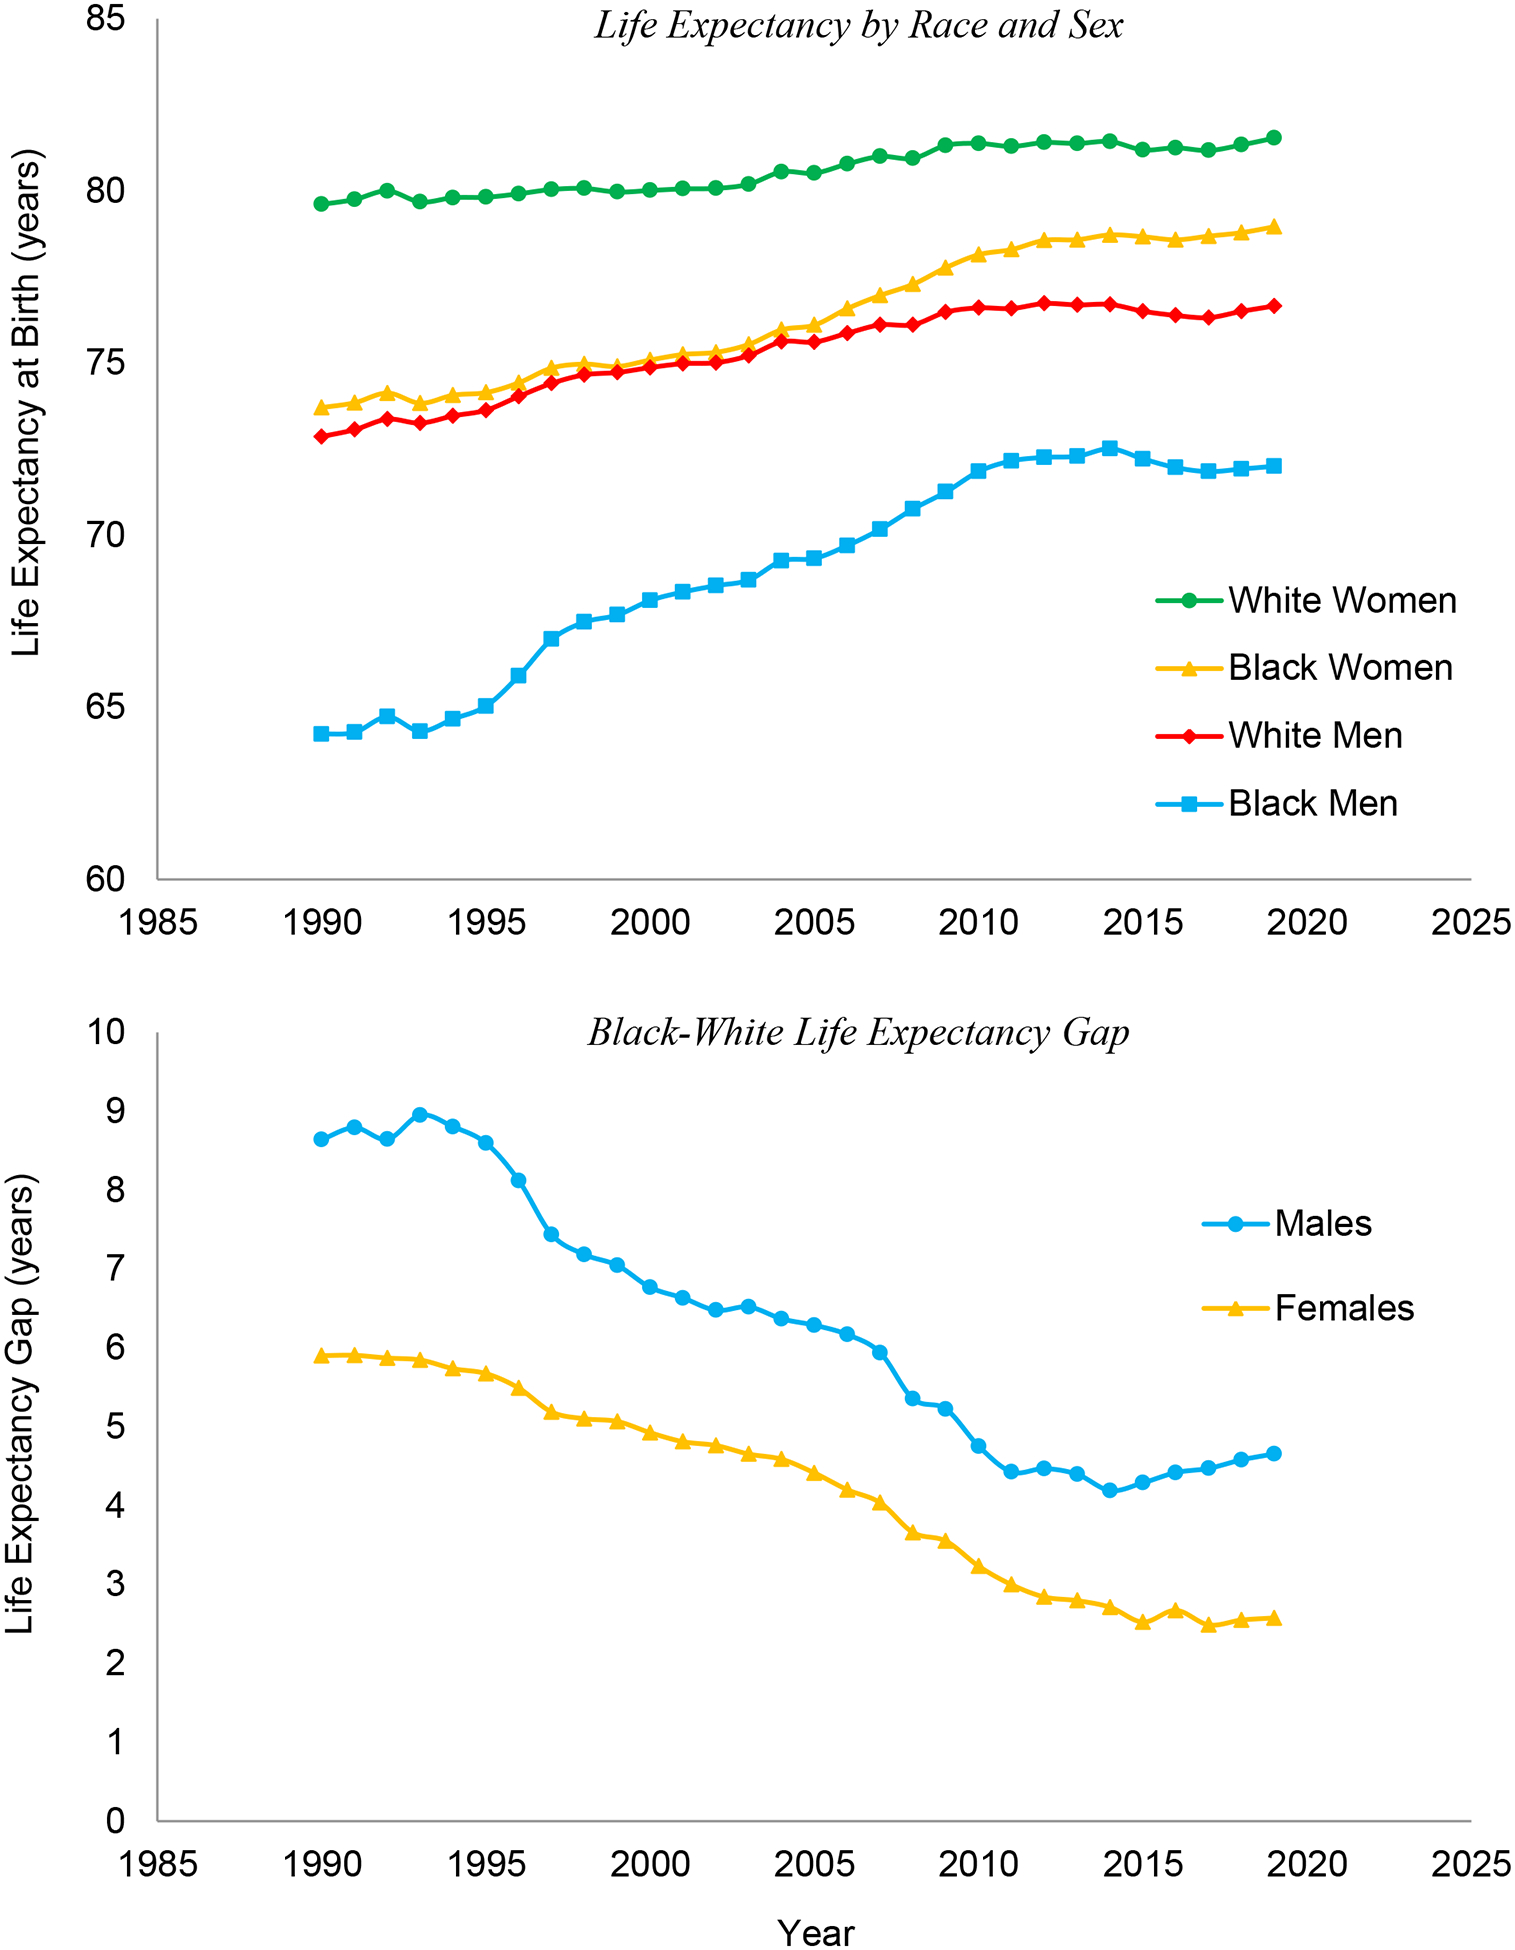
Life expectancy estimates are author’s calculations based on NCHS and Census data, with the black-white gap defined as the difference between white and black life expectancy.
For both sexes, blacks outpaced whites by large margins, leading to a narrowing of the black-white gap over this period (Figure 1, bottom panel). The gap peaked in the early 1990s at approximately nine years for men and six years for women. By 2019, the black-white gap halved and was approximately five years for men and three years for women.
A three- or five-year life expectancy gap is sizeable and is a number that should raise concerns relating to equity and the mechanisms underlying the production of inequality in longevity. Chief among these questions is where precisely this life expectancy gap is coming from.
Geographic Inequality and Locating the Black-White Life Expectancy Gap
The top two graphs in Figure 2 plot black life expectancy on the x-axis against white life expectancy on the y-axis for males and females, respectively, for the period 2015–2019. Each circle represents a single county, with the circle’s area proportional to the county’s black population. The red 45-degree line indicates equality in life expectancy between blacks and whites. For both men and women, the great majority of counties, as well as the majority of population mass, lies above the 45-degree line, indicating that in most counties, whites have higher life expectancy than blacks. This relationship holds at nearly all levels of black life expectancy. That is, the fact that blacks have lower life expectancy than whites cannot be attributed to blacks lying at the extreme low end of the life expectancy distribution in some counties. Even in counties where blacks have relatively high life expectancy, whites tend to do better. Women have a greater spread of life expectancy values for both blacks and whites. The distance from the 45-degree line is typically larger for males than for females.
FIGURE 2. Black vs. White Life Expectancies and Rankings Across Counties, 2015–2019.

The top panels show life expectancies in years for blacks (x-axis) and whites (y-axis). The bottom panels show within-race county life expectancy rankings for blacks (x-axis) and whites (y-axis), with rankings ranging from 0 (worst) to 1 (best) within each race-sex group. The left panels correspond to males and the right to females. The red 45-degree line indicates equality between blacks and whites. Counties are represented by circles with areas proportional to the black population.
If all the counties were to lie along the 45-degree line, that would suggest that there are no within-county black-white life expectancy gaps. Given that there is a large national black-white life expectancy gap, this would suggest that the national gap can be attributed to the differential distribution of blacks and whites across counties. We test the hypothesis that the national gap is due to this between-county variation versus within-county inequality between blacks and whites.
In the 1990–1994 period, white life expectancy was 73.20 years for men and 79.76 years for women (Table 1). The corresponding black life expectancies for that period were 64.43 years for men and 73.91 years for women, leading to observed black-white life expectancy gaps of 8.77 and 5.85 years for men and women, respectively. The black counterfactual life expectancy is a simulation where black age-specific mortality rates are set equal to white age-specific mortality rates for each county. Thus, the black counterfactual life expectancy is the national black life expectancy that would prevail if there were no within-county racial inequality. The black counterfactual life expectancies were 72.03 years for men and 79.11 years for women. Thus, the counterfactual black-white life expectancy gaps were 1.17 years for men and 0.65 years for women, indicating that 87% of the national gap for men and 89% of the national gap for women could be attributed to within-county inequality, leaving 13% and 11% of the national gap coming from between-county differences.
TABLE 1.
Within- and Between-County Contributions to the National Black-White Life Expectancy Gap, 1990–1994 through 2015–2019
| Males | Life Expectancy at Birtha | Black-White Life Expectancy Gapb | Within- and Between-County Componentsc | ||||
|---|---|---|---|---|---|---|---|
| Period | White | Black | Black CF | Observed | CF | Within | Between |
| 1990–94 | 73.20 | 64.43 | 72.03 | 8.77 | 1.17 | 87% | 13% |
| [73.18,73.23] | [64.36,64.51] | [71.95,72.1] | [8.69,8.85] | [1.10,1.25] | |||
| 1995–99 | 74.29 | 66.63 | 73.30 | 7.66 | 0.99 | 87% | 13% |
| [74.27,74.32] | [66.56,66.7] | [73.23,73.37] | [7.59,7.74] | [0.91,1.07] | |||
| 2000–04 | 75.14 | 68.59 | 74.34 | 6.54 | 0.80 | 88% | 12% |
| [75.12,75.16] | [68.52,68.67] | [74.26,74.42] | [6.47,6.62] | [0.72,0.89] | |||
| 2005–09 | 76.04 | 70.25 | 75.31 | 5.79 | 0.73 | 87% | 13% |
| [76.01,76.06] | [70.17,70.33] | [75.22,75.40] | [5.70,5.87] | [0.63,0.82] | |||
| 2010–14 | 76.66 | 72.22 | 76.18 | 4.44 | 0.48 | 89% | 11% |
| [76.64,76.69] | [72.13,72.31] | [76.10,76.27] | [4.35,4.54] | [0.39,0.57] | |||
| 2015–19 | 76.47 | 71.99 | 76.12 | 4.48 | 0.35 | 92% | 8% |
| [76.45,76.5] | [71.90,72.08] | [76.04,76.20] | [4.39,4.58] | [0.27,0.44] | |||
| Females | Life Expectancy at Birtha | Black-White Life Expectancy Gapb | Within- and Between-County Componentsc | ||||
| Period | White | Black | Black CF | Observed | CF | Within | Between |
| 1990–94 | 79.76 | 73.91 | 79.11 | 5.85 | 0.65 | 89% | 11% |
| [79.74,79.79] | [73.82,74.00] | [79.02,79.20] | [5.76,5.95] | [0.56,0.75] | |||
| 1995–99 | 79.96 | 74.66 | 79.32 | 5.30 | 0.64 | 88% | 12% |
| [79.94,79.99] | [74.58,74.74] | [79.24,79.40] | [5.21,5.39] | [0.56,0.72] | |||
| 2000–04 | 80.18 | 75.43 | 79.67 | 4.74 | 0.50 | 89% | 11% |
| [80.15,80.20] | [75.36,75.51] | [79.60,79.75] | [4.66,4.82] | [0.42,0.59] | |||
| 2005–09 | 80.91 | 76.94 | 80.43 | 3.97 | 0.48 | 88% | 12% |
| [80.88,80.94] | [76.86,77.03] | [80.35,80.52] | [3.88,4.05] | [0.39,0.57] | |||
| 2010–14 | 81.38 | 78.47 | 81.12 | 2.91 | 0.25 | 91% | 9% |
| [81.35,81.40] | [78.38,78.55] | [81.04,81.21] | [2.82,3.00] | [0.17,0.34] | |||
| 2015–19 | 81.30 | 78.74 | 81.22 | 2.56 | 0.08 | 97% | 3% |
| [81.27,81.32] | [78.65,78.83] | [81.14,81.30] | [2.47,2.65] | [−0.01,0.16] | |||
National life expectancy for non-Hispanic whites and blacks. Black CF=national black life expectancy if, in each county, blacks had white age-specific death rates
National black-white life expectancy gap in the observed and counterfactual (CF) scenarios. The CF scenario imposes the condition that, in each county, blacks have white age-specific death rates.
Contribution of within-county black-white mortality differences and between-county variation in black-white differences to the national life expectancy gap
Note: Values given in brackets are 95% confidence intervals.
By 2015–2019, white life expectancy had increased to 76.47 years for men and 81.30 years for women. The corresponding figures for blacks were 71.99 years and 78.74 years, leading to a 4.48-year gap for men and a 2.56-year gap for women. The decrease in the gaps are indicative of rapid improvements in black mortality over this period coupled with slower rates of improvements among whites. The counterfactual black life expectancy was 76.12 years for men and 81.22 years for women, leading to a counterfactual black-white gap of 0.35 years for men and 0.08 years for women. Thus, by 2015–2019, the contribution of within-county differences to the national gap increased to 92% for men and 97% for women. While a large part of the narrowing of the gap was due to reductions in geographic inequality (i.e., between-county differences), nearly all of the remainder of the national gap will need to be addressed by reducing within-county inequalities between blacks and whites.
Tables 2 and 3 contextualize the above findings. Table 2 lists the counties with the largest black-white life expectancy gaps in 2015–2019, while Table 3 list the 25 counties with the largest reverse or negative black-white life expectancy gaps. What are the counties with such sizeable black-white life expectancy gaps? At the top of the list is the nation’s capital. The black-white gap in Washington, DC is a whopping 18.01 years for men and 12.30 years for women. Many other counties in this table represent big cities, including San Francisco, Manhattan, St. Louis, Milwaukee, New Orleans, and Baltimore. However, big cities are not the sole sites of extreme racial inequality in longevity. Other counties included on this list include Niagara County, New York; Orange County, North Carolina; Cambria County, Pennsylvania; and Colorado County, Texas. There are also smaller cities included in this list like Omaha and Charleston. What is clear from this table is that there is no clear geographic origin of the black-white gap—this list includes counties representing regions across the country, multiple levels of metropolitan/nonmetropolitan classification, and various levels of population density.
TABLE 2.
Counties with Largest Black-White Life Expectancy Gaps in 2015–2019
| Male Rankings | Female Rankings | |||||||||
|---|---|---|---|---|---|---|---|---|---|---|
| County Equivalent | White | Black | B-W Gap | 95% Conf. Int. | County Equivalent | White | Black | B-W Gap | 95% Conf. Int. | |
| 1. | Washington, DC | 86.10 | 68.09 | 18.01 | [15.82,20.19] | Washington, DC | 89.44 | 77.14 | 12.30 | [9.92,14.68] |
| 2. | San Francisco, CA | 80.51 | 68.33 | 12.18 | [10.35,14.02] | Cambria, PA | 79.39 | 69.08 | 10.32 | [5.02,15.62] |
| 3. | New York, NY | 84.95 | 72.78 | 12.17 | [10.88,13.46] | New York, NY | 88.53 | 79.00 | 9.53 | [8.23,10.83] |
| 4. | Richmond city, VA | 79.85 | 68.41 | 11.44 | [8.92,13.96] | San Francisco, CA | 85.33 | 76.24 | 9.10 | [7.04,11.16] |
| 5. | St. Louis city, MO | 74.46 | 63.88 | 10.57 | [8.75,12.40] | Colonial Heights city, VA | 78.12 | 69.78 | 8.34 | [3.61,13.06] |
| 6. | St. Louis, MO | 77.52 | 66.98 | 10.54 | [9.60,11.49] | Colorado, TX | 81.43 | 73.27 | 8.16 | [2.86,13.47] |
| 7. | Colorado, TX | 76.58 | 66.09 | 10.49 | [5.23,15.75] | Richmond city, VA | 84.88 | 77.32 | 7.55 | [4.99,10.12] |
| 8. | Cook, IL | 78.37 | 68.46 | 9.91 | [9.38,10.43] | Queen Anne’s, MD | 82.49 | 75.01 | 7.48 | [2.60,12.36] |
| 9. | Beaufort, SC | 81.98 | 72.08 | 9.90 | [6.08,13.73] | Salem, NJ | 80.04 | 72.57 | 7.47 | [3.51,11.42] |
| 10. | Fulton, GA | 80.87 | 71.09 | 9.79 | [8.57,11.00] | Westmoreland, PA | 80.62 | 73.23 | 7.38 | [3.81,10.95] |
| 11. | Charleston, SC | 78.68 | 69.34 | 9.35 | [7.62,11.07] | Racine, WI | 81.72 | 74.57 | 7.14 | [3.07,11.21] |
| 12. | Dane, WI | 80.03 | 70.73 | 9.31 | [4.61,14.01] | Boone, MO | 82.49 | 75.42 | 7.08 | [2.92,11.24] |
| 13. | Cambria, PA | 73.31 | 64.37 | 8.93 | [3.22,14.64] | Champaign, IL | 83.46 | 76.52 | 6.94 | [3.39,10.49] |
| 14. | Champaign, IL | 78.85 | 70.28 | 8.56 | [4.44,12.68] | Dane, WI | 83.89 | 77.00 | 6.89 | [2.93,10.85] |
| 15. | Orange, NC | 80.60 | 72.08 | 8.52 | [3.93,13.10] | Midland, TX | 80.74 | 74.46 | 6.27 | [1.96,10.58] |
| 16. | Black Hawk, IA | 77.00 | 68.51 | 8.49 | [5.07,11.91] | Shawnee, KS | 80.52 | 74.31 | 6.21 | [2.59,9.83] |
| 17. | Fayette, TN | 77.90 | 69.45 | 8.45 | [3.98,12.92] | Essex, NJ | 84.57 | 78.42 | 6.14 | [4.83,7.46] |
| 18. | Mahoning, OH | 74.51 | 66.24 | 8.28 | [6.11,10.45] | Beaufort. SC | 85.69 | 79.62 | 6.06 | [2.35,9.78] |
| 19. | Milwaukee, WI | 76.11 | 67.83 | 8.28 | [7.04,9.51] | Niagara, NY | 80.73 | 74.84 | 5.89 | [1.74,10.04] |
| 20. | Orleans, LA | 77.72 | 69.47 | 8.25 | [6.34,10.16] | Brazos, TX | 83.17 | 77.29 | 5.88 | [1.12,10.65] |
| 21. | Shawnee, KS | 74.86 | 66.65 | 8.21 | [3.99,12.43] | Beaver, PA | 80.10 | 74.22 | 5.88 | [2.83,8.93] |
| 22. | Allegheny, PA | 75.99 | 67.82 | 8.17 | [7.17,9.16] | Washington, PA | 79.84 | 73.98 | 5.86 | [1.49,10.24] |
| 23. | James City, VA | 80.64 | 72.57 | 8.07 | [3.20,12.94] | Polk, IA | 81.61 | 75.76 | 5.85 | [3.17,8.53] |
| 24. | Tulsa, OK | 74.72 | 66.84 | 7.88 | [6.18,9.58] | Douglas, NE | 81.66 | 75.84 | 5.83 | [3.85,7.81] |
| 25. | Baltimore city, MD | 72.84 | 64.97 | 7.87 | [6.69,9.05] | Adams, MS | 79.79 | 73.98 | 5.81 | [1.68,9.95] |
Note: This ranking includes only those counties with black-white gap standard errors of at most 3 years. County equivalents are followed by state abbreviations. “Life expectancy at birth” is indicated by and “black-white” by B-W.
TABLE 3.
Counties with Largest Negative Black-White Life Expectancy Gaps in 2015–2019
| Male Rankings | Female Rankings | |||||||||
|---|---|---|---|---|---|---|---|---|---|---|
| County Equivalent | White | Black | B-W Gap | 95% Conf. Int. | County Equivalent | White | Black | B-W Gap | 95% Conf. Int. | |
| 1. | Clayton, GA | 69.68 | 73.84 | −4.16 | [−7.08,−1.24] | Petersburg city, VA | 64.91 | 74.16 | −9.24 | [−12.83,−5.66] |
| 2. | Petersburg city, VA | 59.87 | 63.48 | −3.61 | [−6.77,−0.44] | Clayton, GA | 74.72 | 79.29 | −4.57 | [−6.86,−2.27] |
| 3. | Osceola, FL | 74.60 | 76.49 | −1.89 | [−6.75,2.98] | Marlboro, SC | 73.46 | 76.00 | −2.54 | [−7.65,2.57] |
| 4. | Marlboro, SC | 67.04 | 68.86 | −1.82 | [−6.16,2.52] | Leflore, MS | 72.29 | 74.83 | −2.54 | [−6.45,1.38] |
| 5. | Polk, TX | 70.30 | 72.12 | −1.82 | [−4.98,1.34] | Martinsville city, VA | 70.15 | 72.63 | −2.49 | [−5.64,0.67] |
| 6. | Jackson, FL | 71.93 | 73.71 | −1.78 | [−6.10,2.54] | Fayette, WV | 75.36 | 77.69 | −2.33 | [−6.89,2.23] |
| 7. | Raleigh, WV | 69.30 | 70.98 | −1.67 | [−7.14,3.79] | Liberty, GA | 76.87 | 79.11 | −2.24 | [−7.32,2.84] |
| 8. | Clay, FL | 75.01 | 76.39 | −1.38 | [−6.06,3.31] | Clay, FL | 78.89 | 81.00 | −2.11 | [−7.44,3.22] |
| 9. | Liberty, GA | 72.28 | 73.61 | −1.33 | [−6.43,3.77] | Russell, AL | 75.96 | 77.66 | −1.70 | [−5.47,2.07] |
| 10. | Broward, FL | 76.73 | 78.02 | −1.29 | [−2.95,0.37] | Rockland, NY | 84.60 | 86.22 | −1.62 | [−5.73,2.50] |
| 11. | Rockdale, GA | 74.07 | 75.12 | −1.05 | [−5.72,3.63] | Marshall, MS | 75.97 | 77.49 | −1.52 | [−6.28,3.24] |
| 12. | Douglas, GA | 73.83 | 74.80 | −0.97 | [−3.69,1.75] | Liberty, TX | 75.86 | 77.28 | −1.41 | [−4.83,2.00] |
| 13. | Hernando, FL | 73.84 | 74.78 | −0.94 | [−6.54,4.66] | Bedford, TN | 76.86 | 78.20 | −1.34 | [−6.44,3.76] |
| 14. | Union, SC | 69.76 | 70.67 | −0.92 | [−5.92,4.09] | Talladega, AL | 75.53 | 76.86 | −1.33 | [−4.04,1.39] |
| 15. | Middlesex, MA | 79.39 | 80.14 | −0.75 | [−4.84,3.34] | Middlesex, MA | 83.83 | 85.13 | −1.30 | [−4.78,2.17] |
| 16. | Giles, TN | 71.74 | 72.45 | −0.71 | [−5.80,4.38] | Osceola, FL | 80.60 | 81.86 | −1.27 | [−4.64,2.10] |
| 17. | Norfolk, MA | 78.37 | 79.07 | −0.70 | [−3.75,2.35] | Norfolk, MA | 83.52 | 84.78 | −1.26 | [−5.15,2.62] |
| 18. | Middlesex, NJ | 76.85 | 77.46 | −0.61 | [−3.03,1.80] | Darlington, SC | 76.17 | 77.33 | −1.16 | [−4.46,2.13] |
| 19. | Henry, GA | 74.63 | 75.10 | −0.48 | [−3.56,2.61] | Broward, FL | 82.22 | 83.38 | −1.16 | [−2.65,0.33] |
| 20. | Marshall, MS | 70.19 | 70.62 | −0.43 | [−5.15,4.28] | Upson, GA | 75.10 | 76.13 | −1.02 | [−5.60,3.55] |
| 21. | Bronx, NY | 74.21 | 74.61 | −0.39 | [−1.81,1.02] | Danville city, VA | 75.16 | 76.18 | −1.02 | [−4.37,2.33] |
| 22. | St. Clair, AL | 71.99 | 72.38 | −0.39 | [−5.85,5.07] | Henry, GA | 78.79 | 79.72 | −0.94 | [−3.17,1.29] |
| 23. | Gwinnett, GA | 77.71 | 78.03 | −0.32 | [−3.00,2.37] | Columbia, GA | 81.83 | 82.76 | −0.94 | [−6.61,4.74] |
| 24. | Ben Hill, GA | 69.46 | 69.77 | −0.31 | [−4.84,4.22] | Martin, NC | 77.13 | 78.01 | −0.88 | [−6.26,4.50] |
| 25. | Colbert, AL | 71.19 | 71.36 | −0.17 | [−5.25,4.90] | Newton, GA | 78.80 | 79.66 | −0.85 | [−4.33,2.63] |
Note: This ranking includes only those counties with black-white gap standard errors of at most 3 years. County equivalents are followed by state abbreviations. “Life expectancy at birth” is indicated by and “black-white” by B-W.
At the other end of the spectrum are counties that have the largest negative black-white gaps, where blacks outlive whites within a given county. These counties are relatively rare, and only two include negative gaps that are statistically significant: Clayton County, Georgia and Petersburg City, Virginia. Clayton County has a black-white gap of −4.16 years for men and −4.57 years for women. Petersburg City has gaps of −3.61 years for men and −9.24 years for women. The counties in Table 3 represent a mix of metropolitan categories and regions of the country, as well as a wide range of median household incomes. Again, there is no clear geographic pattern, suggesting that even at the extremes, within-county factors appear to be driving the national black-white gap rather than differences between counties.
The bottom panels of Figure 2 plot black life expectancy ranks against white life expectancy ranks. The county with the highest (lowest) white life expectancy gets a rank of one (zero) on the y-axis. Similarly, the county with the highest (lowest) black life expectancy gets a value of one (zero) on the x-axis. Each circle represents a county with area proportional to its black population. In counties that lie along the 45-degree line, the black life expectancy ranking equals the white life expectancy ranking. If all counties lay along this line, this would mean that the highest life expectancy blacks and whites were living in the same counties and the lowest life expectancy blacks and whites were living in the same counties as each other. Deviations from the line indicate that higher life expectancy whites are living in the same counties as lower life expectancy blacks, or the reverse. These two panels thus represent a weaker-form test of the hypothesis that the national black-white life expectancy gap is a result of between-county racial inequality versus within-county racial inequality.
There is generally a positive correlation in these graphs, but there is a significant amount of deviation from the 45-degree line. The deviation is directed: much of the population mass lies above the line and, for men, a significant amount of mass lies in the upper left portion of the graph. In other words, there are many counties where very high life expectancy whites co-reside with very low life expectancy blacks. These findings suggest within-county residential segregation may be a driver of within-county racial inequality in life expectancy, which in turn is the major driver of the national black-white gap.
Within-County Residential Segregation
Figure 3 plots the association between residential segregation and the black-white gap in 1990–1994 and 2015–2019. For men and women in both periods, there is a positive correlation between segregation and the black-white gap. More segregated counties tend to have wider life expectancy gaps. The slopes of the best-fit lines equal around 9 years for men and 4 years for women. Despite large declines in the level of black-white residential segregation, the intensity of the association between residential segregation and the black-white gap remains robust.
FIGURE 3. Residential Segregation and Black-White Life Expectancy Gaps by County.

Circles represent counties, with circle areas proportional to counties’ black populations. Residential segregation is measured using the black-white index of dissimilarity.
Figure 4 decomposes this association into cause of death contributions. For males, the strongest associations arise from homicide, circulatory diseases, hypertensive heart disease, respiratory diseases, suicide, other external causes, and lung and all other cancers. For women, the largest associations are for respiratory diseases, circulatory diseases, hypertensive heart disease, lung cancer, drug overdose, digestive diseases, other external causes, and homicide. In general, causes that are most amenable to medical care, public health efforts, and law enforcement or other actions to promote safety tend to have the largest associations with residential segregation (e.g., homicide, circulatory diseases). Conditions for which medical screening and treatment options are more limited cluster towards the bottom (e.g., Alzheimer’s disease, mental disorders).
FIGURE 4. Cause of Death Contributions to the Association between Residential Segregation and the Black-White Life Expectancy Gap.

Estimates are based on county-level linear regressions of cause-specific contributions to the black-white life expectancy gap on the black-white index of dissimilarity. Coefficients are indicated by circles (1990–1994) and triangles (2015–2019) with 95% confidence intervals shown with dotted lines. All estimates are given in years, and the cause-specific estimates sum to the relationship between residential segregation and the overall (not cause-specific) black-white gap. “Hypertensive HD” stands for hypertensive heart disease and “Screenable Cancers” includes breast, prostate, colorectal, and cervical cancers.
These associations, while highly suggestive, fall short of establishing a causal link. We thus use instrumental variable regression to assess the casual effect of residential segregation on the black-white life expectancy gap in 2015–2019. The overall causal effect of residential segregation is to increase the size of the gap by 16.34 years for men and 4.96 years for women (Table 4). The IV estimate is similar to the OLS estimate for women, but far exceeds the OLS estimate for men, indicating the causal effect is much stronger than the association suggests.
TABLE 4.
Instrumental Variable Regressions of Black-White Life Expectancy Gaps on Residential Segregation by Cause of Death, 2015–2019
| Males | Females | ||||||
|---|---|---|---|---|---|---|---|
| Cause of Death | OLS | IV | Diff | Cause of Death | OLS | IV | Diff |
| Homicide | 3.04 | 6.42 | 3.38 | Circulatory | 0.74 | 2.33 | 1.59 |
| Circulatory | 1.97 | 3.87 | 1.90 | Perinatal/Congenital | 0.31 | 1.07 | 0.77 |
| Perinatal/Congenital | 0.55 | 2.03 | 1.48 | Other External | 0.44 | 1.04 | 0.60 |
| Other External | 0.67 | 1.85 | 1.19 | Hypertensive HD | 0.55 | 0.97 | 0.42 |
| Hypertensive HD | 0.89 | 1.52 | 0.63 | All Other Cancers | 0.30 | 0.93 | 0.62 |
| All Other Cancers | 0.29 | 0.95 | 0.66 | Nervous System | 0.33 | 0.81 | 0.49 |
| Nervous System | 0.26 | 0.81 | 0.55 | Homicide | 0.29 | 0.74 | 0.45 |
| Lung Cancer | 0.14 | 0.51 | 0.38 | Genitourinary | 0.14 | 0.47 | 0.33 |
| Influenza/Pneumonia | 0.09 | 0.49 | 0.39 | Mental Disorders | −0.11 | 0.39 | 0.50 |
| Transport Accidents | 0.20 | 0.41 | 0.20 | Lung Cancer | 0.25 | 0.35 | 0.10 |
| Suicide | 0.31 | 0.36 | 0.05 | Screenable Cancers | 0.24 | 0.33 | 0.09 |
| Genitourinary | 0.08 | 0.32 | 0.24 | Ill-Defined | 0.14 | 0.33 | 0.19 |
| All Other Causes | 0.17 | 0.27 | 0.10 | Influenza/Pneumonia | 0.23 | 0.29 | 0.06 |
| Respiratory | 0.50 | 0.16 | −0.34 | All Other Causes | 0.08 | 0.24 | 0.15 |
| Endocrine & Metabolic | 0.11 | 0.14 | 0.03 | Other Infectious | 0.45 | 0.23 | −0.23 |
| Liver Cancer | 0.00 | 0.13 | 0.13 | Transport Accidents | −0.03 | 0.11 | 0.14 |
| Other Infectious | 0.37 | 0.07 | −0.29 | Digestive | 0.10 | 0.08 | −0.02 |
| Alcohol-Induced | 0.28 | 0.06 | −0.22 | Alcohol-Induced | 0.08 | 0.03 | −0.06 |
| Mental Disorders | 0.04 | 0.05 | 0.00 | Alzheimer’s | −0.23 | −0.03 | 0.21 |
| Screenable Cancers | 0.21 | 0.03 | −0.17 | Suicide | 0.02 | −0.07 | −0.09 |
| Ill-Defined | 0.26 | 0.03 | −0.23 | Endocrine & Metabolic | 0.09 | −0.08 | −0.17 |
| Digestive | 0.01 | 0.00 | 0.00 | HIV/AIDS | 0.17 | −0.15 | −0.32 |
| Alzheimer’s | −0.03 | −0.01 | 0.01 | Liver Cancer | −0.06 | −0.19 | −0.13 |
| HIV/AIDS | 0.31 | −0.34 | −0.65 | Respiratory | 0.43 | −0.50 | −0.93 |
| Diabetes | −0.32 | −0.68 | −0.36 | Diabetes | −0.41 | −1.09 | −0.68 |
| Drug Overdose | −1.25 | −3.12 | −1.86 | Drug Overdose | −0.50 | −3.66 | −3.16 |
| All Causes Combined | 9.14 | 16.34 | 7.21 | 4.03 | 4.96 | 0.93 | |
Note: Estimates correspond to the regression coefficient on the index of dissimilarity. OLS estimates are based on the IV subsample (N=112 counties). “Diff” is the difference between the IV and OLS estimate. Bold values are statistically significant at the 95% level.
The largest effects for men come from homicide, circulatory diseases, perinatal and congenital conditions, other external causes, hypertensive heart disease, all other cancers, nervous system diseases, influenza/pneumonia, and all other causes. For women, the strongest effects come from circulatory diseases, perinatal and congenital conditions, other external causes, hypertensive heart disease, nervous system diseases, and homicide. Two causes of death, diabetes and drug overdose, contribute negatively to the gap, indicating that residential segregation actually leads to smaller differences between blacks and whites in life-years lost due to these causes.
These results focus mainly on life expectancy at birth. To examine the robustness of the findings, Appendix Tables A2–A4 additionally present the regression results using life expectancy at ages 20, 40, and 60. The findings are largely consistent with those using life expectancy at birth.
Discussion
This study identifies the geographic origins of the national black-white gap in life expectancy and adjudicates how much of the gap is due to differences between blacks and whites within counties versus differences between counties. The overwhelming majority of the national black-white gap arises from within-county factors. In 2015–2019, over 90% of the gap came from within-county racial inequality for both men and women.
The prior literature on geographic variation in black mortality has largely focused on the important finding that certain parts of the country or certain types of counties or regions have significantly lower levels of black life expectancy than others (Murray et al. 2006; Murray, Kulkarni, and Ezzati 2005; Harper et al. 2009; Harper, MacLehose, and Kaufman 2014; Dwyer-Lindgren et al. 2022). The South and big cities have been singled out as having amongst the worst black-white disparities and lowest levels of black life expectancy in the country. Because blacks are disproportionately represented in rural, southern, and large urban counties, it is sensible to hypothesize that racial differences in settlement patterns are to blame for the disparity. This analysis finds that while certain parts of the country, including some large urban counties and parts of the South, do indeed have very low levels of black life expectancy or large and persistent black-white gaps, there is no consistent pattern relating geographic characteristics of counties—regional location, population density, urbanicity—to their within-county black-white life expectancy gaps. Counties from all major geographic regions and metropolitan categories, as well as both high- and low-density counties, are represented among the best- and worst-performing counties in terms of black life expectancy. This bolsters the conclusion that processes occurring within counties as opposed to differences between counties are responsible for the national black-white gap.
I find that within-county black-white residential segregation is closely linked to county-level black-white disparities in longevity. On average, the most segregated counties have black-white gaps that are approximately nine years larger for men and four years larger for women than the least segregated counties. Beyond this association, the instrumental variables strategy used in this study identifies the causal effect of residential segregation on the black-white gap. Residential segregation increases the black-white gap by 16.34 years for men and 4.96 years for women. These numbers are equally striking and terrifying. A typical large life expectancy gap is around three years. That is roughly equal to the gap in life expectancy between the U.S. and other high-income countries (Ho 2022). A 16-year difference is virtually unheard of and exceeds any known disparities by education, occupation, or other stratifying variable. This result is a clear demonstration of Williams and Collins’s (2001) statement that residential segregation is a fundamental cause of racial disparities in health and mortality.
One of the more striking contrasts in the results is the sex difference in the effect of residential segregation. This difference may be tied to the different ways each gender experiences segregation and the downstream effects of those experiential differences (Guest, Almgren, and Hussey 1998). Black men may be more negatively affected by residential segregation in part due to their greater exposure to violence and exclusion from employment opportunities, which are closely connected to homicide and cardiovascular disease. Violence, unemployment, and low-quality employment are key determinants of stress, which may also contribute to the observed mortality patterns. Previous research has demonstrated that segregation-driven racial disparities in the labor market are larger for men (Thomas and Moye 2015). This may be due to racialized fear, wherein black men in segregated areas are more likely to be perceived or stereotyped as violent, lazy, or otherwise ineligible for employment. In less segregated areas, employers are more likely to regularly interact with black men, creating opportunities for employers to reject negative stereotypes (Ibid.). The explanation for sex differences in early-life racial disparities is less clear, but may be related to greater frailty of male fetuses and newborns. Male infants die at higher rates from most causes of death, and especially from respiratory conditions (Preston 1976; Drevenstedt et al. 2008). The adverse conditions generated by residential segregation may amplify preexisting gender disparities.
In some counties, blacks significantly outlive whites on average. While these negative gaps are statistically significant in only two county equivalents (Clayton, GA and Petersburg, VA), this finding sheds light on potential mechanisms. Many of these counties have military installations, large black foreign-born populations, or experienced high rates of white flight. The military is a total institution, where inequalities across race and other dimensions of stratification tend to be smaller than in the general population. The military distributes salaries, services, and healthcare and provides safe environments more equally across race groups than do private and other public institutions, flattening racial inequalities. The foreign-born black population is systematically different from U.S.-born blacks, since the latter have experienced a lifetime of racial inequality and thus enter any given stage of life at a lower point in the social hierarchy. Foreign-born blacks are among the most-educated, lowest-mortality populations in the country. Areas like Clayton and Petersburg that experienced high rates of white outmigration tend to have very low white life expectancy, but not particularly high black life expectancy. This is likely related to the tipping point phenomenon, where the black population surpasses some critical tipping point, leading middle-class whites to flee to other, nearby areas. The whites left behind tend to be negatively select on several dimensions predictive of mortality. Two lessons from these distinctive negative-gap counties are that (1) material and community resources, especially safe environments and equitable access to healthcare, appear to be drivers of racial differences in longevity; and (2) racial discrimination is harmful for black mortality. Some studies have theorized that the concentration of black populations can have a positive effect on black health and mortality through political empowerment (LaVeist 1992). This study suggests that the way black populations become concentrated matters, since white flight does not appear to greatly improve black mortality outcomes.
The latter phenomena highlight the fact that migration is fundamental to the segregation-mortality relationship, since racially selective migration is what drives segregation. In that sense, the effects of migration and segregation are not entirely separable. Selective migration can both alter patterns of residential segregation and modify the relationship between segregation and mortality. The former effect of migration is perhaps more obvious. Residential segregation can decrease if: (a) tracts that are disproportionately white experience high rates of net in-migration for blacks or out-migration for whites; or (b) tracts that are disproportionately black experience high rates of net in-migration for whites or out-migration for blacks. The opposite is also true: residential segregation will typically increase if whites and blacks migrate to distinct tracts. The second effect of migration—the effect of migration on the segregation-mortality relationship—is more complex and depends on the type of selective migration occurring.
In recent years, American counties have experienced two major selective migration-related trends: black suburbanization and the return of young, upper-class whites to the cities (Massey and Tannen 2018). There is scant evidence in the prior literature on the mortality effects of these two recent migration streams. Based on the socioeconomic characteristics of the migrants involved, we might expect white migration to the cities to reduce urban white mortality and potentially to slightly increase suburban white mortality at the young adult ages. Because black suburbanization tends to move middle-class blacks to the suburbs, leaving behind lower-SES black city-dwellers, we might expect a small increase in urban black mortality, though the effect on suburban black mortality is uncertain. On the whole, because migrants tend to exhibit a health advantage (Jasso et al. 2004), we might expect counties with higher rates of net in-migration of blacks relative to whites to have narrowing black-white mortality gaps. This may be particularly true for cross-region movers, since those migrants who move greater distances may be more positively select.
These recent migration streams may also influence the relationship between segregation and the black-white mortality gap, even in the scenario where black-white residential segregation remains unchanged. In general, we would expect the segregation-mortality gap relationship to strengthen if blacks with lower mortality risk were moving out of highly segregated areas and whites with lower mortality risk were moving into highly segregated areas. For example, the relationship would become stronger under the following two conditions: (a) if blacks moving out of cities and into suburbs simultaneously have lower mortality than blacks in the cities as a whole and their mortality risk isn’t significantly higher than that of black suburban non-movers; and (b) whites moving to the cities from the suburbs have lower mortality than urban white non-movers. Similarly, if black urban-to-suburban movers have higher mortality risk than both urban and suburban black non-movers, the relationship could become weaker.
How might migration have impacted the associations examined in this analysis? For the OLS results, we would expect selective migration streams to have strengthened the association between black-white residential segregation and the black-white life expectancy gap, even as overall black-white residential segregation has declined. This is consistent with the associations we observe, where the association grew slightly stronger between the early 1990s and the late 2010s. For the IV results, selective migration streams should not have had a major effect on the relationship between segregation and the black-white gap since we do not expect the railroad division index to be a driver of net migration. If the characteristics of people are what drive their migration decisions and those characteristics are also what drive changes in the black-white mortality gap, we might see an artifactual relationship emerge between segregation and the black-white gap. One way we can assess the likelihood of this artifact is by considering age variations in the segregation-mortality gap relationship. Among younger people (i.e., in their teens or early twenties), we would expect a weaker relationship between their characteristics and their likelihood of moving, since they are often not the ones making the decisions to move. Thus, if selective migration is driving the segregation-mortality gap relationship, we should expect this relationship to be weaker among young people and stronger among middle-aged and older adults. But this is not what we find (see Appendix Tables A2–A4). Indeed, we find the opposite, that much of the segregation-mortality gap association is concentrated at the younger ages and diminishes at the middle and older adult ages. Another finding in this study is that health behaviors, while important in explaining racial differences in mortality, are not a major driver of the segregation-mortality gap relationship, suggesting that individual characteristics associated with migration decisions are unlikely to be confounders for the segregation-mortality relationship. In other words, the evidence adds to our confidence that the effects identified in this study arise from segregation and not associated processes.
The causes of death through which residential segregation affects the black-white gap tend to be associated with safety and violence, access to and quality of the healthcare system, and public health measures. Blacks and whites co-residing in the same county may experience different levels of care, be exposed to differentially-effective forms of policing and infrastructures supporting safety, and benefit unequally from public and private investment in their communities. I do not find strong evidence that segregation affects the black-white gap through health behaviors and behaviorally-linked diseases. In fact, I find that far from increasing the gap through its effects on diabetes and drug overdose, segregation actually narrows the gap through these causes. This is not to say that diabetes and drug overdose are unimportant factors for black mortality, but instead that those causes are not the mechanisms through which residential segregation acts. Similarly, alcohol-related and lung cancer deaths (closely linked to cigarette smoking) do not appear to drive the segregation-mortality gap association.
One way to summarize these results is that institutional, and not individual, factors operate as the mechanisms linking residential segregation to racial differences in mortality. Why are institutional factors so important in this context? One explanation relates to political power and how spaces are defined and social boundaries are constructed and contested. In the U.S., residential segregation was designed as a means of empowering whites and allowing them to reap the benefits associated with local government and private enterprise. Whites can steer effective policing, safe parks, street lighting, and the like to their own communities while either ignoring or siphoning money away from black communities. Prior research has identified segregation as a key determinant of racial differences in homicide victimization (Light and Thomas 2019). Because whites living in segregated areas are already advantaged, they have more effective political mobilization, allowing them to maintain their advantage in resource acquisition. Whites can demand that their neighborhoods be served by the best hospitals and that during emergencies, ambulances departing from their neighborhoods go directly to those high-quality hospitals. Businesses respond to incentives. White neighborhoods with higher levels of safety and higher-income residents are able to attract businesses like grocery stores, diagnostic centers, and pharmacies that promote good health. Predominantly black neighborhoods lose out precisely because residential segregation makes them unprofitable places to set up shop, thus restarting the cycle.
The broader literature on racial disparities in mortality encompasses four main types of explanations for mortality gaps. The first type emphasizes the socioeconomic underpinnings of racial inequality. Research in this area attempts to quantify how much of the black-white mortality disparity can be attributed to racial disparities in factors like educational attainment, income, occupation, and poverty (Keil et al. 1992). The familiar refrain from this literature is that SES explains some, but not all of the black-white gap. The second type examines how the racial gap varies by geography (Murray et al. 2006). Work in this subarea suggests that blacks living in the Deep South and inner cities are uniquely disadvantaged. The third class of explanations examines the role of health care and health behaviors and finds that part of the black-white gap is due to causes that can be addressed with effective health care or behavioral interventions (Macinko and Elo 2009). A fourth type of explanation is that racial disparities in health and mortality arise from life course processes wherein an individual’s childhood circumstances or lifetime accumulation of stressors has an influence on later life mortality (Geronimus et al. 2006; Preston, Hill, and Drevenstedt 1998).
The first three categories of explanations are highly consistent with the residential segregation mechanism identified in this paper. Residential segregation causes concentrated poverty and limits access to high-quality education in black neighborhoods. It is especially prevalent in big cities and the South. Residential segregation also influences access to high-quality care by routing people who live in black and white neighborhoods to different hospitals (Chandra and Skinner 2003). In other words, residential segregation is fundamental to these explanations. A fifth class of explanations has received considerably less attention in the literature: that racism is the direct cause of black-white life expectancy gaps. All the above mechanisms are related to racial inequality, and residential segregation is perhaps the most palpable representation of a history of racism and racial inequality manifesting in mortality differentials. This line of literature started with Du Bois in the late 1800s and was continued by scholars including Yankauer in the 1950s, LaVeist since the 1980s, and Collins and Williams in the 1990s and 2000s. It has collectively demonstrated how this form of structural racism led to higher rates of poor health and mortality among blacks, and the present study shows that these effects have persisted across decades, even as blacks have left the rural South and central cities (Du Bois 1899; Yankauer 1950; Collins and Williams 1999; Williams and Collins 2001).
There are limitations to the study. First, while we are able to establish a causal effect of segregation on black-white disparities in life expectancy, we have not demonstrated the precise mechanisms linking segregation to mortality. The cause of death estimates shed some light, suggesting that segregation acts through the healthcare system, safety and violence, and public health measures, but further research is needed to identify the specific pathways through which these operate. Another limitation specific to the instrumental variable analysis is that it included only 112 counties, which is a small and nonrandom subsample of all counties. These are more likely to be urban or micropolitan counties and are less likely to be non-metropolitan or rural counties. Rural counties tend to have lower levels of black-white residential segregation and smaller black-white mortality gaps, so the underrepresentation of these counties in the instrumental variable subsample may lead to more conservative estimates that understate the full effect of residential segregation. A third limitation is that the estimates demonstrate a contemporaneous effect of segregation on mortality disparities but do not estimate potential life course effects. It seems likely that the true and full effect of residential segregation on mortality disparities may be greater than the estimates in this study would suggest. Future studies of life course effects of residential segregation will need data on migration histories over the life course. While such a dataset does not presently exist for the entire life course, longitudinal surveys such as the Health and Retirement Study may offer promising avenues for future work in this area. Future research can also use more fine-grained geographic identifiers linked to mortality records. Prior research has highlighted potential benefits of focusing on lower-level geographic data and processes (Boing et al. 2020) and, as shown above, much of the black-white gap can be tied to inequality operating within counties.
Black-white disparities in life expectancy remain unacceptably high. This study makes clear that future progress in narrowing the black-white gap will have to come from addressing low-level geographic processes that produce inequality, and chief among these processes is residential segregation. A 25% reduction in residential segregation across all counties can reduce remaining black-white life expectancy gaps by approximately 80%. More fundamentally, reductions in residential segregation can lead to a more fair and just society in which the mechanisms driving racial inequity in longevity can be eliminated.
Supplementary Material
Acknowledgments
Research reported in this publication was supported by the National Institute on Aging of the National Institutes of Health under Award Number R01AG080438. The content is solely the responsibility of the author and does not necessarily represent the official views of the National Institutes of Health. The author wishes to thank Diane Lauderdale, Emily Smith-Greenaway, and Johnelle Sparks for their helpful suggestions on earlier versions of this article, as well as Tod Hamilton, Sam Harper, Alicia Riley, and other attendees of the annual meetings of the Population Association of America, the American Sociological Association, and the Resource Centers for Minority Aging Research for their insightful questions and encouragement.
Footnotes
I use the terms “black” and “white” to refer to non-Hispanic blacks and non-Hispanic whites, respectively. Race and ethnic groups categories follow the bridged-race classifications, which are a refinement of the 1997 Office of Management and Budget (OMB) standard used by the National Center for Health Statistics.
Data Availability
This article uses data from the U.S. National Vital Statistics System that can be requested through the Mortality Statistics Branch of the National Center for Health Statistics.
References
- Acevedo-Garcia Dolores, Lochner Kimberly A., Osypuk Theresa L., and Subramanian SV. 2003. “Future Directions in Residential Segregation and Health Research: A Multilevel Approach.” American Journal of Public Health 93 (2): 215–221. 10.2105/ajph.93.2.215. https://ajph.aphapublications.org/doi/abs/10.2105/AJPH.93.2.215. [DOI] [PMC free article] [PubMed] [Google Scholar]
- Alexander Monica J., Kiang Mathew V., and Barbieri Magali. 2018. “Trends in Black and White Opioid Mortality in the United States, 1979–2015.” Epidemiology (Cambridge, Mass.) 29 (5): 707–715. 10.1097/EDE.0000000000000858. https://pubmed.ncbi.nlm.nih.gov/29847496 https://www.ncbi.nlm.nih.gov/pmc/articles/PMC6072374/. [DOI] [PMC free article] [PubMed] [Google Scholar]
- Ananat Elizabeth Oltmans. 2011. “The Wrong Side(s) of the Tracks: The Causal Effects of Racial Segregation on Urban Poverty and Inequality.” American Economic Journal: Applied Economics 3 (2): 34–66. 10.1257/app.3.2.34. https://www.aeaweb.org/articles?id=10.1257/app.3.2.34. [DOI] [Google Scholar]
- Arriaga Edward E. 1984. “Measuring and explaining the change in life expectancies.” Demography 21 (1): 83–96. [PubMed] [Google Scholar]
- Berkman Lisa, Singer Burton, and Manton Kenneth. 1989. “Black/White Differences in Health Status and Mortality Among the Elderly.” Demography 26 (4): 661–678. 10.2307/2061264. [DOI] [PubMed] [Google Scholar]
- Boing Antonio Fernando, Alexandra Crispim Boing Jack Cordes, Kim Rockli, and Subramanian SV. 2020. “Quantifying and explaining variation in life expectancy at census tract, county, and state levels in the United States.” Proceedings of the National Academy of Sciences 117 (30): 17688–17694. 10.1073/pnas.2003719117. [DOI] [PMC free article] [PubMed] [Google Scholar]
- Bower Kelly M., Thorpe Roland J., Rohde Charles, and Gaskin Darrell J.. 2014. “The intersection of neighborhood racial segregation, poverty, and urbanicity and its impact on food store availability in the United States.” Preventive Medicine 58: 33–39. https://doi.org/ 10.1016/j.ypmed.2013.10.010. https://www.sciencedirect.com/science/article/pii/S0091743513003988. [DOI] [PMC free article] [PubMed] [Google Scholar]
- Chandra Amitabh, and Skinner Jonathan. 2003. “Geography and Racial Health Disparities.” National Bureau of Economic Research Working Paper Series No. 9513. 10.3386/w9513. http://www.nber.org/papers/w9513. [DOI] [Google Scholar]
- Collins Chiquita A., and Williams David R.. 1999. “Segregation and Mortality: The Deadly Effects of Racism?” Sociological Forum 14 (3): 495–523. [Google Scholar]
- Diehr Aaron J., and McDaniel Justin T.. 2018. “Lack of community-oriented policing practices partially mediates the relationship between racial residential segregation and “black-on-black” homicide rates.” Preventive Medicine 112: 179–184. https://doi.org/ 10.1016/j.ypmed.2018.04.032. https://www.sciencedirect.com/science/article/pii/S0091743518301506. [DOI] [PubMed] [Google Scholar]
- Drevenstedt Greg L., Crimmins Eileen M., Vasunilashorn Sarinnapha, and Finch Caleb E.. 2008. “The rise and fall of excess male infant mortality.” Proceedings of the National Academy of Sciences 105 (13): 5016–5021. https://doi.org/doi: 10.1073/pnas.0800221105. https://www.pnas.org/doi/abs/10.1073/pnas.0800221105. [DOI] [PMC free article] [PubMed] [Google Scholar]
- Du Bois WEB 1899. The Philadelphia Negro: A Social Study. Philadelphia, PA: University of Pennsylvania Press. [Google Scholar]
- Dwyer-Lindgren Laura, Kendrick Parkes, Kelly Yekaterina O., Sylte Dillon O., Schmidt Chris, Blacker Brigette F., Daoud Farah, Abdi Amal A., Baumann Mathew, Mouhanna Farah, Kahn Ethan, Hay Simon I., Mensah George A., Nápoles Anna M., Pérez-Stable Eliseo J., Shiels Meredith, Freedman Neal, Arias Elizabeth, George Stephanie A., Murray David M., Phillips John W. R., Spittel Michael L., Murray Christopher J. L., and Mokdad Ali H.. 2022. “Life expectancy by county, race, and ethnicity in the USA, 2000–19: a systematic analysis of health disparities.” The Lancet 400 (10345): 25–38. 10.1016/S0140-6736(22)00876-5. [DOI] [PMC free article] [PubMed] [Google Scholar]
- Elo Irma T., Beltrán-Sánchez Hiram, and Macinko James. 2014. “The Contribution of Health Care and Other Interventions to Black–White Disparities in Life Expectancy, 1980–2007.” Population Research and Policy Review 33 (1): 97–126. 10.1007/s11113-013-9309-2. [DOI] [PMC free article] [PubMed] [Google Scholar]
- Elo Irma T., and Preston Samuel H.. 1996. “Educational differentials in mortality: United States, 1979–1985.” Social Science & Medicine 42 (1): 47–57. https://doi.org/ 10.1016/0277-9536(95)00062-3. https://www.sciencedirect.com/science/article/pii/0277953695000623. [DOI] [PubMed] [Google Scholar]
- Ewbank Douglas C. 1987. “History of Black Mortality and Health before 1940.” The Milbank Quarterly 65: 100–128. 10.2307/3349953. http://www.jstor.org/stable/3349953. [DOI] [PubMed] [Google Scholar]
- Gaskin Darrell J., Price Adrian, Brandon Dwayne T., and LaVeist Thomas A.. 2009. “Segregation and Disparities in Health Services Use.” Medical Care Research and Review 66 (5): 578–589. 10.1177/1077558709336445. https://journals.sagepub.com/doi/abs/10.1177/1077558709336445. [DOI] [PMC free article] [PubMed] [Google Scholar]
- Geronimus Arline T., Hicken Margaret, Keene Danya, and Bound John. 2006. “Weathering and age patterns of allostatic load scores among blacks and whites in the United States.” American Journal of Public Health 96 (5): 826–833. 10.2105/AJPH.2004.060749. [DOI] [PMC free article] [PubMed] [Google Scholar]
- Guadamuz Jenny S., Wilder Jocelyn R., Mouslim Morgane C., Zenk Shannon N., Alexander G. Caleb, and Qato Dima Mazen. 2021. “Fewer Pharmacies In Black And Hispanic/Latino Neighborhoods Compared With White Or Diverse Neighborhoods, 2007–15.” Health Affairs 40 (5): 802–811. 10.1377/hlthaff.2020.01699. [DOI] [PubMed] [Google Scholar]
- Guest Avery M., Almgren Gunnar, and Hussey Jon M.. 1998. “The ecology of race and socioeconomic distress: Infant and working-age mortality in Chicago.” Demography 35 (1): 23–34. 10.2307/3004024. [DOI] [PubMed] [Google Scholar]
- Harper Sam, Lynch John, Meersman Stephen C., Breen Nancy, Davis William W., and Reichman Marsha C.. 2009. “Trends in area-socioeconomic and race-ethnic disparities in breast cancer incidence, stage at diagnosis, screening, mortality, and survival among women ages 50 years and over (1987–2005).” Cancer Epidemiology Biomarkers and Prevention 18 (1): 121–131. 10.1158/1055-9965.EPI-08-0679. [DOI] [PubMed] [Google Scholar]
- Harper Sam, MacLehose Richard F., and Kaufman Jay S.. 2014. “Trends in the black-white life expectancy gap among US States, 1990–2009.” Health Affairs 33 (8): 1375–1382. 10.1377/hlthaff.2013.1273. [DOI] [PubMed] [Google Scholar]
- Hendi Arun S. 2017. “Trends in Education-Specific Life Expectancy, Data Quality, and Shifting Education Distributions: A Note on Recent Research.” Demography 53 (3): 1203–1213. [DOI] [PMC free article] [PubMed] [Google Scholar]
- Ho Jessica Y. 2022. “Causes of America’s Lagging Life Expectancy: An International Comparative Perspective.” The Journals of Gerontology: Series B. 10.1093/geronb/gbab129. [DOI] [PMC free article] [PubMed] [Google Scholar]
- Ho Jessica Y., and Elo Irma T.. 2013. “The Contribution of Smoking to Black-White Differences in U.S. Mortality.” Demography 50 (2): 545–568. 10.1007/s13524-012-0159-z. [DOI] [PMC free article] [PubMed] [Google Scholar]
- Jasso Guillermina, Massey Douglas S., Rosenzweig Mark R., and Smith James P.. 2004. “Immigrant Health: Selectivity and Acculturation.” In Critical Perspectives on Racial and Ethnic Differences in Health in Late Life, edited by Ethnicity National Research Council (US) Panel on Race, and Health in Later Life; Anderson NB, Bulatao RA, Cohen B,. Washington, DC: National Academies Press. [PubMed] [Google Scholar]
- Keil JE, Sutherland SE, Knapp RG, and Tyroler HA. 1992. “Does equal socioeconomic status in Black and White men mean equal risk of mortality?” American Journal of Public Health 82 (8): 1133–1136. 10.2105/AJPH.82.8.1133. [DOI] [PMC free article] [PubMed] [Google Scholar]
- Kramer Michael R., and Hogue Carol R.. 2009. “Is Segregation Bad for Your Health?” Epidemiologic Reviews 31 (1): 178–194. 10.1093/epirev/mxp001. [DOI] [PMC free article] [PubMed] [Google Scholar]
- Krysan Maria, and Crowder Kyle. 2017. Cycle of segregation : social processes and residential stratification. New York: Russell Sage Foundation. [Google Scholar]
- LaVeist Thomas A. 1992. “The Political Empowerment and Health Status of African-Americans: Mapping a New Territory.” American Journal of Sociology 97 (4): 1080–1095. 10.1086/229862. https://www.journals.uchicago.edu/doi/abs/10.1086/229862. [DOI] [Google Scholar]
- ---. 1993. “Segregation, Poverty, and Empowerment: Health Consequences for African Americans.” The Milbank Quarterly 71 (1): 41–64. 10.2307/3350274. http://www.jstor.org/stable/3350274. [DOI] [PubMed] [Google Scholar]
- Light Michael T., and Thomas Julia T.. 2019. “Segregation and Violence Reconsidered: Do Whites Benefit from Residential Segregation?” American Sociological Review 84 (4): 690–725. 10.1177/0003122419858731. https://journals.sagepub.com/doi/abs/10.1177/0003122419858731. [DOI] [Google Scholar]
- Macinko J, and Elo IT. 2009. “Black-white differences in avoidable mortality in the USA, 1980–2005.” Journal of epidemiology and community health 63 (9): 715–721. 10.1136/jech.2008.081141. [DOI] [PubMed] [Google Scholar]
- Massey Douglas S., Condran Gretchen A., and Denton Nancy A.. 1987. “The Effect of Residential Segregation on Black Social and Economic Well-Being*.” Social Forces 66 (1): 29–56. 10.1093/sf/66.1.29. [DOI] [Google Scholar]
- Massey Douglas S., and Denton Nancy A.. 1988. “The dimensions of residential segregation.” Social Forces 67 (2): 281–315. 10.1093/sf/67.2.281. [DOI] [Google Scholar]
- Massey Douglas S., and Tannen Jonathan. 2018. “Suburbanization and segregation in the United States: 1970–2010.” Ethnic and Racial Studies 41 (9): 1594–1611. 10.1080/01419870.2017.1312010. [DOI] [PMC free article] [PubMed] [Google Scholar]
- Meara Ellen R., Richards Seth, and Cutler David M.. 2008. “The gap gets bigger: Changes in mortality and life expectancy, by education, 1981–2000.” Health Affairs 27 (2): 350–360. 10.1377/hlthaff.27.2.350. [DOI] [PMC free article] [PubMed] [Google Scholar]
- Montez Jennifer Karas, Robert a Hummer Mark D. Hayward, Woo Hyeyoung, and Rogers Richard G.. 2011. “Trends in the Educational Gradient of U.S. Adult Mortality from 1986 to 2006 by Race, Gender, and Age Group.” Research on aging 33 (2): 145–171. 10.1177/0164027510392388. http://www.pubmedcentral.nih.gov/articlerender.fcgi?artid=3166515&tool=pmcentrez&rendertype=abstract. [DOI] [PMC free article] [PubMed] [Google Scholar]
- Murray Christopher J. L., Kulkarni Sandeep C., Michaud Catherine, Tomijima Niels, Bulzacchelli Maria T., Iandiorio Terrell J., and Ezzati Majid. 2006. “Eight Americas: Investigating mortality disparities across races, counties, and race-counties in the United States.” PLoS Medicine 3 (9): 1513–1524. 10.1371/journal.pmed.0030260. [DOI] [PMC free article] [PubMed] [Google Scholar]
- Murray Christopher J. L., Kulkarni Sandeep, and Ezzati Majid. 2005. “Eight Americas: New perspectives on U.S. health disparities.” American Journal of Preventive Medicine 29 (5 SUPPL. 1): 4–10. 10.1016/j.amepre.2005.07.031. [DOI] [PubMed] [Google Scholar]
- Preston Samuel H. 1976. Mortality Patterns in National Populations With Special Reference to Recorded Causes of Death. New York: Academic Press. [Google Scholar]
- Preston Samuel H., Heuveline Patrick, and Guillot Michel. 2001. Demography: Measuring and Modeling Population Processes. Malden, MA: Blackwell. [Google Scholar]
- Preston Samuel H., Hill Mark E., and Drevenstedt Greg L.. 1998. “Childhood conditions that predict survival to advanced ages among African-Americans.” Social Science and Medicine 47 (9): 1231–1246. 10.1016/S0277-9536(98)00180-4. [DOI] [PubMed] [Google Scholar]
- Quillian Lincoln. 2014. “Does Segregation Create Winners and Losers? Residential Segregation and Inequality in Educational Attainment.” Social Problems 61 (3): 402–426. 10.1525/sp.2014.12193. [DOI] [Google Scholar]
- Siegel Michael, Sherman Rebecca, Li Cindy, and Knopov Anita. 2019. “The Relationship between Racial Residential Segregation and Black-White Disparities in Fatal Police Shootings at the City Level, 2013–2017.” Journal of the National Medical Association 111 (6): 580–587. https://doi.org/ 10.1016/j.jnma.2019.06.003. https://www.sciencedirect.com/science/article/pii/S0027968419301300. [DOI] [PubMed] [Google Scholar]
- Staiger Douglas, and Stock James H.. 1997. “Instrumental Variables Regression with Weak Instruments.” Econometrica 65 (3): 557–586. 10.2307/2171753. http://www.jstor.org/stable/2171753. [DOI] [Google Scholar]
- Thomas Melvin, and Moye Richard. 2015. “Race, Class, and Gender and the Impact of Racial Segregation on Black-White Income Inequality.” Sociology of Race and Ethnicity 1 (4): 490–502. 10.1177/2332649215581665. https://journals.sagepub.com/doi/abs/10.1177/2332649215581665. [DOI] [Google Scholar]
- Trounstine Jessica. 2016. “Segregation and Inequality in Public Goods.” American Journal of Political Science 60 (3): 709–725. 10.1111/ajps.12227. https://onlinelibrary.wiley.com/doi/abs/10.1111/ajps.12227. [DOI] [Google Scholar]
- Wellington Arthur M. 1914. The Economic Theory of the Location of Railways, 6th Edition (corrected). 6th ed. New York: John Wiley & Sons. [Google Scholar]
- Williams David R., and Collins Chiquita. 2001. “Racial Residential Segregation: A Fundamental Cause of Racial Disparities in Health.” Public Health Reports 116 (5): 404–416. 10.1093/phr/116.5.404. https://journals.sagepub.com/doi/abs/10.1093/phr/116.5.404. [DOI] [PMC free article] [PubMed] [Google Scholar]
- Yankauer Alfred. 1950. “The Relationship of Fetal and Infant Mortality to Residential Segregation: An Inquiry Into Social Epidemiology.” American Sociological Review 15 (5): 644–648. 10.2307/2086918. http://www.jstor.org/stable/2086918. [DOI] [Google Scholar]
Associated Data
This section collects any data citations, data availability statements, or supplementary materials included in this article.
Supplementary Materials
Data Availability Statement
This article uses data from the U.S. National Vital Statistics System that can be requested through the Mortality Statistics Branch of the National Center for Health Statistics.