

Abstract
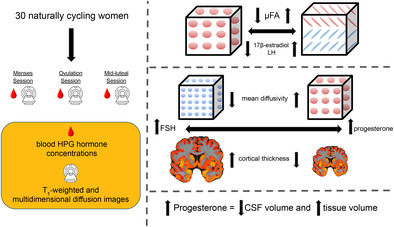
Cyclic fluctuations in hypothalamic–pituitary–gonadal axis (HPG‐axis) hormones exert powerful behavioral, structural, and functional effects through actions on the mammalian central nervous system. Yet, very little is known about how these fluctuations alter the structural nodes and information highways of the human brain. In a study of 30 naturally cycling women, we employed multidimensional diffusion and T1‐weighted imaging during three estimated menstrual cycle phases (menses, ovulation, and mid‐luteal) to investigate whether HPG‐axis hormone concentrations co‐fluctuate with alterations in white matter (WM) microstructure, cortical thickness (CT), and brain volume. Across the whole brain, 17β‐estradiol and luteinizing hormone (LH) concentrations were directly proportional to diffusion anisotropy (μFA; 17β‐estradiol: β 1 = 0.145, highest density interval (HDI) = [0.211, 0.4]; LH: β 1 = 0.111, HDI = [0.157, 0.364]), while follicle‐stimulating hormone (FSH) was directly proportional to CT (β 1 = 0 .162, HDI = [0.115, 0.678]). Within several individual regions, FSH and progesterone demonstrated opposing relationships with mean diffusivity (D iso) and CT. These regions mainly reside within the temporal and occipital lobes, with functional implications for the limbic and visual systems. Finally, progesterone was associated with increased tissue (β 1 = 0.66, HDI = [0.607, 15.845]) and decreased cerebrospinal fluid (CSF; β 1 = −0.749, HDI = [−11.604, −0.903]) volumes, with total brain volume remaining unchanged. These results are the first to report simultaneous brain‐wide changes in human WM microstructure and CT coinciding with menstrual cycle‐driven hormone rhythms. Effects were observed in both classically known HPG‐axis receptor‐dense regions (medial temporal lobe, prefrontal cortex) and in other regions located across frontal, occipital, temporal, and parietal lobes. Our results suggest that HPG‐axis hormone fluctuations may have significant structural impacts across the entire brain.
Keywords: brain structure, brain volume, cortical thickness, diffusion imaging, hormones, magnetic resonance imaging, menstrual cycle
We performed multidimensional diffusion and T1‐weighted imaging of 30 women during three estimated phases of their menstrual cycles. Analyses revealed that 17β‐estradiol and LH were associated with increased microscopic FA, FSH and progesterone had opposing relationships with CT and mean diffusivity, and progesterone was associated with brain volume changes.
Practitioners Points.
17β‐estradiol and luteinizing hormone (LH) were positively associated with diffusion anisotropy.
Follicle‐stimulating hormone and progesterone demonstrated opposing relationships with mean diffusivity and cortical thickness in several regions.
Progesterone was positively associated with tissue volume and negatively associated with cerebrospinal fluid volume.
1. INTRODUCTION
On average, people who menstruate experience about 450 menstrual cycles throughout the lifespan (Chavez‐MacGregor et al., 2008). Driving these cycles are rhythmic fluctuations in hypothalamic–pituitary–gonadal axis (HPG‐axis) hormones such as sex steroids (17β‐estradiol and progesterone) and pituitary gonadotropins (luteinizing hormone [LH] and follicle‐stimulating hormone [FSH]). The cycle begins with menses, signaling the start of the follicular phase and the gradual rise of 17β‐estradiol concentrations stimulated by FSH (Baird, 1987). Just before ovulation (release of a mature egg), three “ovulatory” hormones (17β‐estradiol, LH, and FSH) reach peak values; post‐ovulation, the luteal phase begins, during which progesterone peaks and 17β‐estradiol remains high (Stricker et al., 2006). Fluctuations in concentrations of these hormones have been found to coincide with variation in functional brain activation, such as within the anterior cingulate cortex during reinforcement learning or within the default mode network at rest (Beltz & Moser, 2020). In addition, fluctuations of these hormones can induce or exacerbate neurological and psychiatric symptomatology (Handy et al., 2022). Due to the widespread presence of gonadal hormone receptors in the mammalian brain (Barth et al., 2015), HPG‐axis hormones exhibit powerful neuromodulatory effects that influence synaptic plasticity (Haraguchi et al., 2012) and dendritic spine density (Woolley & McEwen, 1993). Yet, despite the functional and cellular importance of these hormones, neuroimaging research dedicated to our understanding of the human brain as an endocrine organ makes up a very small percentage of all neuroimaging studies (Taylor et al., 2021).
In human neuroscience, the majority of published work has documented how menstrual cycle‐driven hormonal fluctuations may or may not influence brain communication at rest (functional connectivity) and brain functional activation when completing spatial navigation, working memory, verbal fluency, and emotion processing tasks, among others (Dubol et al., 2021; Le et al., 2020; Pletzer et al., 2019). Far less is known about hormonal influences on the anatomical highways and nodes that allow for such functional communication to occur (Dubol et al., 2021). Broadly speaking, these “highways” are the white matter (WM) tracts that transfer information between gray matter (GM) regional nodes; both highways and nodes may vary in structural properties. Studies typically assay these neuroanatomical variables noninvasively using diffusion tensor imaging (WM microstructure) and voxel‐based morphometry (GM volume). WM microstructure has been found to be altered across hormonal transition periods, including puberty, postmenopausal estrogen therapy, and gender‐affirming hormone treatment (Ha et al., 2007; Herting et al., 2012; Kranz et al., 2017). Only a handful of studies have investigated time‐varying changes in WM microstructural properties across a natural menstrual cycle (i.e., not affected by pharmacological interventions). These studies suggest that both WM volumetric and diffusion properties are predominantly altered during the ovulatory phase of the cycle, or correlated with 17β‐estradiol concentrations (Barth et al., 2016; De Bondt, Van Hecke, et al., 2013; Meeker et al., 2020; Şafak, 2019).
A larger corpus of work has probed the effect of menstrual cycle stage on regional and global GM volume. GM morphology appears to be sensitive to hormonal transition periods, including puberty, oral contraceptive use, and pregnancy (Herting et al., 2014; Hoekzema et al., 2017; Lisofsky et al., 2016). Only a small body of studies has investigated time‐varying changes in GM morphology across a natural menstrual cycle. GM morphology tends to change in concert with ovulation and/or 17β‐estradiol (Barth et al., 2016; De Bondt et al., 2016; De Bondt, Jacquemyn, et al., 2013; Franke et al., 2015; Hagemann et al., 2011; Petersen et al., 2015), although GM morphological alterations are also observed more broadly when comparing luteal and follicular cycle phases (Lisofsky et al., 2015; Meeker et al., 2020; Ossewaarde et al., 2013; Pletzer et al., 2010; Protopopescu et al., 2008) and tied to circulating progesterone concentrations (Pletzer et al., 2018; Taylor et al., 2020). A recent dense‐sampling study by Zsido et al. (2023) conducted ultra‐high field imaging of the medial temporal lobe (MTL) and found significant volumetric changes corresponding with 17β‐estradiol and progesterone concentrations, as well as their interaction (Zsido et al., 2023).
The above studies are, to our knowledge, the only to map time‐varying changes in structural variables across a natural menstrual cycle, highlighting the relative paucity of studies in this area, particularly in the case of WM microstructure. Compounding the issue for WM microstructure is the measurement typically employed; WM microstructure is commonly assessed with fractional anisotropy (FA) and mean diffusivity (MD) derived from diffusion tensor images (DTI) (Le Bihan et al., 2001). Despite their widespread adoption for assessing WM “integrity” in clinical populations (Clark et al., 2011), FA and MD directly scale with fiber orientation dispersion, making them sensitive to the participant‐specific presence of crossing, kissing, or fanning fibers (Vos et al., 2012). Any single voxel within much of the WM could contain an FA value drawn from a trimodal distribution based on the number of fiber crossings (Volz et al., 2018). Additionally, measures derived from DTI are voxel‐averaged and do not account for the heterogeneity of brain tissue at the sub‐voxel level (Topgaard, 2019). However, recent developments in multidimensional diffusion imaging techniques offer a means to account for complex WM fiber configurations and sub‐voxel heterogeneity when imaging human WM microstructure (Topgaard, 2017). As opposed to simple voxel‐averaging, multidimensional diffusion imaging (also known as q‐space trajectory imaging [QTI]) allows for the estimation of parameter distributions within each voxel, providing greater disentanglement of intersecting diffusion properties and offering a clearer picture of the underlying WM microstructure (Topgaard, 2017, 2019; Westin et al., 2016). These properties include diffusion tensor “size” (degree of free, unrestricted [isotropic] diffusion and typically aligned with increased water content), “shape” (degree of directional [anisotropic] diffusion along WM tracts and putative measure of tissue integrity), and “orientation” (degree of fiber crossing in a voxel). Multidimensional diffusion parameters include an improved estimate of MD (here called “D iso”), as well as an improved estimate of FA (called “micro‐fractional anisotropy” or μFA) which is robust to fiber orientation and overcomes the associated limitations of FA (Andersen et al., 2020; Ikenouchi et al., 2020; Lasič et al., 2014). The primary aim of this work is to therefore use recent advancements in multidimensional diffusion imaging of the WM to investigate whether menstrual cycle‐driven HPG‐axis hormone fluctuations coincide with changes in WM microstructure.
We also report HPG‐axis hormone‐associated changes in GM cortical thickness (CT). Previous work has mainly correlated HPG‐axis hormones with changes in GM volume obtained through voxel‐based morphometry, for which results can be heavily influenced by spatial smoothing, image co‐registration imperfections, and voxel‐wise correction for multiple comparisons (Whitwell, 2009). On the other hand, CT modeling techniques can provide greater sensitivity (Hutton et al., 2009) than volumetric analyses. Additionally, CT measures mimic functional network organization and predict clinical symptomatology (He et al., 2007; Pettigrew et al., 2016). Together, these imaging measures (multidimensional diffusion parameters and CT) will provide the clearest combined account to date of how HPG‐axis hormones may influence the anatomical highways and nodes of the brain.
In addition, a third aim of this study is to assess HPG‐axis hormone‐associated changes in brain volume. No study, to our knowledge, has investigated whether hormone‐related changes in WM microstructure and CT coincide with HPG‐axis hormone‐related changes in estimates of total brain volume. A previous study identified peak GM volume and decreased cerebrospinal fluid (CSF) at ovulation (Hagemann et al., 2011); yet, the dynamic relationships between total brain volume, tissue volume, and CSF volume across the menstrual cycle are largely unknown and can provide insight into the potential mechanisms behind short‐term WM and GM structural changes.
The current study addresses documented methodological concerns in the field of menstrual cycle neuroimaging by achieving direct hormone assay, whole brain analyses, and a robust sample size (Dubol et al., 2021). We extend previous work by assaying concentrations of four HPG‐axis hormones (17β‐estradiol, progesterone, LH, and FSH) and recording multidimensional diffusion and T1‐magnetization prepared rapid gradient echo (MPRAGE) anatomical images from a group of 30 naturally cycling young women. In order to capture significant variation in hormone concentrations, we obtained data for each participant during three estimated menstrual cycle time‐points: menses, ovulation, and the mid‐luteal phase. We then employed a Bayesian framework to test if concentrations of each hormone would credibly associate with within‐individual WM and GM architecture, both at the whole brain and predefined region levels. Finally, we examined whether these hormones are associated with changes in whole brain, tissue, and CSF volume. We hypothesized that we would observe a directly proportional relationship between hormones known to peak at ovulation (17β‐estradiol, LH, FSH) and μFA, as well as an inversely proportional relationship between these hormones and MD. We also predicted that CT would be tied to changes in 17β‐estradiol and progesterone concentrations.
2. MATERIALS AND METHODS
2.1. Participants
A total of 30 naturally cycling, healthy female participants (mean age = 21.73 years; range = 18–29) completed all study recruitment, prescreening, and protocol procedures. Participants reported belonging to the following racial/ethnic groups: White non‐Hispanic/Latino (10), Hispanic/Latino (6), Black/African‐American (1), West Asian/Middle Eastern (1), East Asian (6), and Southeast Asian (6).
Study inclusion criteria were assessed via self‐report and required that participants be between the ages of 18–30, be nulliparous, have not used any hormonal or implant birth control within 3 months prior to onset of study involvement, have never undergone hormonal therapy, have no plans to begin birth control or become pregnant within the upcoming year, and have a relatively regular (21–40 days length) menstrual cycle. Exclusionary criteria were also assessed via self‐report and included contraindications to Magnetic resonance imaging (MRI; nonremovable metal, incompatible medical devices, hearing loss/tinnitus, claustrophobia) and medical history of clinically significant reproductive, cardiovascular, neurological, or psychiatric conditions (other than mild–moderate mood or attention deficit disorders). Two participants reported a history of mild–moderate depression and/or anxiety. One participant reported an ADHD diagnosis; this was the only participant to report current use of prescription medication. All participants provided written informed consent for study procedures approved by the University of California, Santa Barbara's Institutional Review Board/Human Subjects Committee.
Participants were recruited as part of a wider women's/menstruating individuals' hormonal health study via digital flyers sent to the University of California, Santa Barbara community (Babenko, 2023). To assess eligibility, participants completed the following: a prescreening video call to ensure understanding of study procedures, the UCSB Brain Imaging Center's MRI screening form, and a comprehensive health questionnaire, which assessed participant demographics, history of substance usage, and mental and reproductive health topics, for which they received $10 compensation if deemed eligible. Of a total sample of 46 eligible participants, 30 completed all 3 experimental sessions involving MRI scans and blood draws. Of these 30 participants, 22 completed at least 1 month of researcher‐supervised menses and ovulation test tracking prior to the menstrual cycle containing their initial session. Due to study timing constraints, the remaining eight participants began cycle‐tracking within the same cycle as their initial session. Participants were paid $60 per MRI session, and those who completed a full three cycles of preinitial session remote cycle tracking earned an additional $50, totaling $190–$240/participant.
2.2. Menstrual cycle tracking procedures
Researchers engaged in cycle tracking in order to, as closely as possible, schedule experimental sessions that would match the three phases of participants' individual cycles. To begin, participants were asked to self‐report to researchers their menses start and end dates, as well as share any previous cycle tracking data they may have collected for personal use. Researchers then calculated average cycle lengths from these reports, which were used to predict future scheduling of sessions. Cycle length information was updated as new menses tracking data was collected. Menses sessions were scheduled based on a combination of self‐reported previous menses onset, self‐reported menses symptom onset, and ovulation test results.
In order to schedule ovulation and luteal sessions, participants were given 40 mL disposable plastic urine cups and ovulation testing strips, which measure urine levels of LH (Easy@Home, Premom). Experimenters informed participants of their predicted “fertile‐window” (on average within a range of 3–15 days depending on prediction certainty), during which ovulation was likely to occur. Participants were asked to complete ovulation self‐tests and send a clear photo of results by 8 p.m. during all “fertile‐window” days. Using the Premom mobile application, experimenters obtained a ratio of LH‐to‐control line darkness, for which any result >0.80 was considered to be positive for ovulation. If a participant's ovulation test results never produced an LH‐to‐control line exceeding 0.80, their ovulation test was considered to be positive according to their individual peak value determined from their history of study cycle tracking. After completing cycle tracking, experimenters informed participants of their potential ovulation session dates, during which they were asked to send in their ovulation test results by 9 a.m. If their ovulation test result ratios were >0.80 (or at the level of their previous individually determined peak), they were asked to come in that day to complete study procedures. If the participant was unable to be scheduled that same day for any reason, their tracking data were logged and the session was postponed to their following cycle.
Mid‐luteal sessions were scheduled based on both average cycle length and ovulation testing data. Using individualized cycle prediction data, experimenters scheduled mid‐luteal sessions during the predicted midpoint between ovulation and start of next menses. If a participant could not be scheduled within their predicted menses, ovulation, or mid‐luteal windows for that cycle, then experimenters postponed the session to the next cycle. If a participant received a SARS‐CoV‐2 vaccine/booster or diagnosis, or reported ingestion of emergency contraceptives, they waited at least one complete menstrual cycle (menses‐to‐menses) prior to returning for any additional sessions.
2.3. Experimental protocol
Participants underwent three experimental MRI sessions each, which were scheduled to coincide with three estimated phases of their menstrual cycle: menses (based on self‐report), ovulation (based on ovulation test results), and mid‐luteal phase (estimated to be mid‐way between ovulation window and predicted start of menses). Order of sessions was counterbalanced such that 15 participants began with the menses session, 14 participants with the ovulation session, and 1 began with the mid‐luteal session (due to study timing constraints). Using a subgroup analysis, we show that brain–hormone relationships are not meaningfully confounded by experiment session order effects (see Supplementary Information Table S9). Sessions lasted for 3 h, typically took place during the hours of 11 a.m.–4 p.m., and did not all necessarily occur within the same monthly cycle. Participants were instructed to maintain their typical daily routines on session days. Upon arrival for their session, experimenters screened the participant for SARS‐CoV‐2 according to the University of California, Santa Barbara's Office of Research COVID safety guidelines. Then, participants were instructed to change into scrubs, underwent a blood draw completed by a licensed phlebotomist (see Section 2.4), and completed a 1‐h MRI scanning protocol (see Section 2.5).
2.4. Blood sample acquisition and processing
In order to assess serum levels of the gonadal hormones 17β‐estradiol and progesterone, as well as the pituitary gonadotropins LH and FSH, a licensed phlebotomist collected a blood sample (<8.5–10 cc) from each participant during each session (three samples/participant). The phlebotomist used a BD Diagnostics vacutainer push button to start an intravenous line (hand or forearm), and then used a 10 mL vacutainer SST tube (BD Diagnostics) to collect the sample. After collection, the sample was allowed 30 min to clot at room temperature, and was then centrifuged (2100 revolutions per minute [RPM] for 10 min). From the centrifuged samples, experimenters aliquoted 1 mL of serum into three 2 mL microtubes, which were subsequently stored in a −80°C freezer until 2 of the microtubes (per participant) were shipped for processing at the Endocrine Technologies Core (ETC) at the Oregon National Primate Research Center (ONPRC, Beaverton, OR). The third microtube was stored as a backup in case any damage occurred to the samples during shipment for testing.
Gonadal steroid hormone concentrations were obtained using ultrahigh‐performance liquid chromatography‐heated electrospray ionization‐tandem triple quadrupole mass spectrometry (LC‐MS/MS) on a Shimadzu Nexera‐LCMS‐8060 instrument (Kyoto, Japan). The dynamic range for both 17β‐estradiol and progesterone was 0.002–20 ng/mL, with the following lower quantification limits, intra‐assay variations, and accuracies, respectively: 0.002 ng/mL, 2.1%, and 100.9% for 17β‐estradiol, and 0.010 ng/mL, 12.3%, and 106.3% for progesterone. Pituitary gonadotropin concentrations were obtained using a Roche cobas e411 automated clinical immunoassay platform (Roche Diagnostics, Indianapolis, IN). The assay range for both LH and FSH was 0.1–200 mIU/mL, while the intra‐ and interassay coefficients of variation were respectively 2.3% and 2.4% for n = 2 LH assays, and 0.9% and 1.0% for n = 2 FSH assays.
2.5. MRI acquisition and processing
Following each session's blood draw, participants underwent MRI in a Siemens 3 T Prisma scanner with a 64‐channel phased‐array head/neck coil. First, high‐resolution T1‐weighted MPRAGE anatomical scans were acquired (TR = 2500 ms, TE = 2.22 ms, FOV = 241 mm, T1 = 851 ms, flip angle = 7°, with 0.9 mm3 voxel size). Following the anatomical scan, a series of 4 spherical b‐tensor (b = 0, 100–500, 1000, 1500 s/mm2; 3 diffusion directions) and 4 linear b‐tensor (b = 500, 1000, 1500, 2000 s/mm2; 6, 10, 16, and 30 diffusion directions) QTI diffusion sequences that have been shown to have good contrast‐to‐noise ratio (Martin et al., 2020) were collected (TR = 6308 ms, TE = 80 ms, diffusion gradient amplitude = 80.0 mT/m, FOV = 230 mm, flip angle = 90°, 2.0 × 2.0 mm2 in‐plane resolution, 4.0 mm slice thickness, iPAT factor = 2).
MRI preprocessing was conducted with Advanced Normalization Tools (ANTs; Avants et al., 2011) and MATLAB (MathWorks, Inc.). First, T1‐weighted anatomical data were skull‐stripped with antsBrainExtraction.sh. In order to create individualized participant WM and GM tissue masks, we first segmented the skull‐stripped anatomical data using the ANTsPy (https://github.com/ANTsX/ANTsPy) kmeans_segmentation function, which outputted probability maps of participant WM, GM, and CSF. We then binarized these probability maps (all values >0 = 1) to obtain WM, GM, and CSF tissue masks.
Second, for each participant, we calculated region of interest (ROI)‐specific mean values of six QTI‐derived multidimensional diffusion parameters, which describe facets of diffusion tensor size, shape, and orientation. To do this, we first used an open‐source, MATLAB pipeline for multidimensional diffusion MRI (https://github.com/markus-nilsson/md-dmri) to complete motion and eddy current correction of diffusion data, as well as estimation of voxel‐wise brain maps of size‐shape‐orientation diffusion tensor distributions (DTDs) using the “dtd” method (Nilsson et al., 2018; Topgaard, 2019). Then, using ANTs, we spatially normalized participant DTD diffusion data and HCP1065 Population‐Averaged Tractography Atlas probabilistic WM region masks (thresholded at ≥50%; Yeh, 2022) to their participant‐specific anatomical space, where all further calculations were conducted. Next, we utilized the participant‐specific WM tissue masks to extract WM voxels from DTD data, which was then segmented into 64 ROIs using the HCP1065 atlas masks. Then, for each ROI, we calculated mean values of parameters describing diffusion tensor size (average isotropic diffusivity [D iso, a metric of MD] and normalized variation in isotropic diffusivity [V ison]), tensor shape (normalized mean squared anisotropy [D 2 anison], μFA, and FA), and tensor orientation (fiber orientation parameter [OP]; for descriptions of each, see Section 2.6). Finally, because we had no a priori hypotheses for hemisphere‐specific effects, we averaged homologous ROI mean values across hemispheres, leading to a total of 34 bilateral WM region values per diffusion parameter per participant session. Supplementary analyses exploring hemispheric differences did not find meaningful differences from the original analysis (see Supplementary Information Tables S5 and S6).
Third, for each participant, we calculated cortical and subcortical ROI‐specific mean values of CT. We used anatomical as opposed to diffusion imaging to obtain CT due to the known limitations of diffusion imaging for detecting neurite density (Lampinen et al., 2019). To do this, we first utilized participant‐specific GM tissue masks to extract GM voxels from their respective anatomical images. Then, we used the ANTsPy DiReCT algorithm to estimate CT across the GM. DiReCT has been shown to have good scan‐rescan repeatability and outperform FreeSurfer in prediction of CT measures (Tustison et al., 2014). In order to segment the GM into ROIs, we first obtained 20 Open Access Series of Imaging Studies (OASIS) young, healthy adult brains and their respective Desikan‐Killiany‐Tourville (DKT; 31 per hemisphere, 62 total) cortical labels as defined by the Mindboggle project (Klein & Tourville, 2012). We then spatially normalized these labels to participant anatomical space, where we used antsJointLabelFusion.sh to obtain customized DKT‐31 cortical region labels for each participant (Wang et al., 2013). Next, we utilized these customized participant‐specific labels to segment the CT data and subsequently calculated mean CT values for each ROI in participant‐specific anatomical space. Due again to a lack of a priori hypotheses for hemisphere‐specific effects, we averaged the mean CT values of homologous right and left hemisphere ROIs. This led to a total of 31 bilateral GM region CT values per participant session. Supplementary analyses exploring hemispheric differences did not find meaningful differences from the original analysis (see Supplementary Information Tables S7 and S8).
Finally, for each participant session, we calculated total brain volume, tissue volume, and CSF volume. To do this, we used ANTsPy label_geometry_measures with the previously generated k‐means segmentation masks to calculate volume (mm3) for the whole brain (WM + GM + CSF), brain tissue (WM + GM), and CSF (CSF mask only). This led to a total of three volume values per participant session.
2.6. Multidimensional diffusion parameters
For each participant, we estimated six voxel‐wise multidimensional diffusion parameters describing diffusion tensor size (mean isotropic diffusivity; D iso, normalized variation in isotropic diffusivity; V ison), shape (normalized mean squared anisotropy; D 2 anison, FA, μFA), and orientation (OP).
In order to calculate the diffusion tensor size (D iso and V ison) and shape (D 2 anison) parameters as defined by Topgaard (2019), we first estimated voxel‐wise distributions of parallel (D ||) and perpendicular (D ⊥) component diffusivities (in 10−8 m2/s). Then, with these values, mean isotropic diffusivity (D iso) and normalized diffusion anisotropy (D anison, represented in Topgaard, 2019 as D Δ) were calculated (Topgaard, 2019, equation 2). We then took the expected values (E[x]) of D iso and D anison to obtain E[D iso] (from now on referred to as D iso), which is equivalent to mean diffusivity (MD), and E[D anison], which contains similar information as other measures of tensor shape/anisotropy, such as μFA (Topgaard, 2019, equations 9 and 10). To obtain V ison, we calculated the variance of isotropic diffusivity (V[Diso]; Topgaard, 2019, equation 11), which was then normalized by D 2 iso. Visualizations of D iso, D 2 anison, and V ison are shown in Figure 1a.
FIGURE 1.
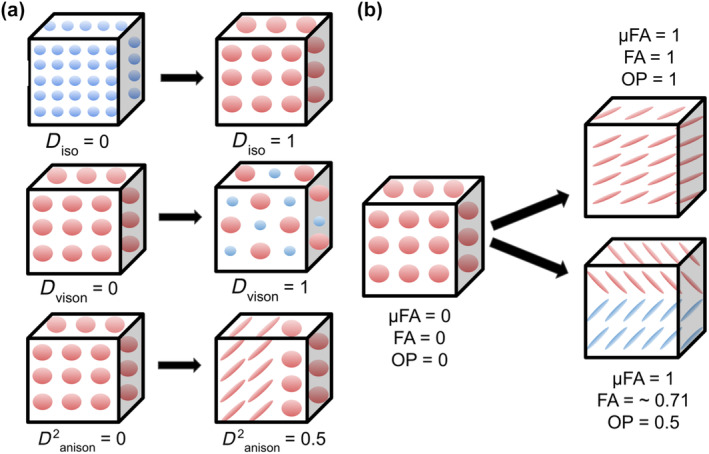
Multidimensional diffusion size‐shape‐orientation properties captured via q‐tensor imaging and diffusion tensor distribution (DTD) modeling within a voxel (cube). (a) top row: Increased D iso represents an increase in isotropic diffusion tensor size (greater isotropic diffusion is represented as larger spheres). D iso can be employed as an index of mean diffusivity. Middle row: Increased V ison represents an increase of variation in isotropic diffusion tensor size (variety of sphere size). Bottom row: Increased D 2 anison represents an increase in diffusion tensor anisotropy and a change in tensor shape (tensor shape changes from sphere to ellipse). DTD modeling is sensitive to microstructural variation at the sub‐voxel level, such as within voxels that contain half isotropic diffusion and half anisotropic diffusion (represented here as a mixture of ellipses and spheres). (b) DTD modeling also allows for the estimation of other parameters describing tensor shape (conventional fractional anisotropy [FA], micro‐fractional anisotropy [μFA]) as well as diffusion tensor orientation (orientation parameter [OP]). Left: In voxels with random orientation and isotropic diffusion (lack of parallel WM fiber bundle), FA, μFA, and OP are equal to 0. Right top: In voxels with a single white matter (WM) fiber bundle traveling in one direction, FA, μFA, and OP equal 1. Right bottom: In voxels with crossing fibers (OP<1), FA decreases in value while μFA remains equal to 1 (robust to crossing fibers). After DTD modeling, we calculated WM regional summary values of DTDs that describe facets of diffusion tensor size, shape, and orientation. Figure design is based on Topgaard (2019).
In order to calculate the remaining parameters describing tensor shape (μFA, FA) and orientation (OP), we drew on other sources of QTI theory (Lasič et al., 2014; Westin et al., 2016). More specifically, μFA was calculated according to equation 14 in Lasič et al. (2014). The orientation dispersion parameter (OP), also known as “microscopic orientation coherence,” or the ratio of micro‐ to macroscopic anisotropy in a voxel, was calculated according to equation 33 in Westin et al., 2016. The OP ranges from 0 (diffusion in all directions equally, whether it be isotropic or anisotropic) to 1 (parallel diffusion in one direction). As discussed in Lasič et al. (2014), equation 22, FA can be derived from μFA and OP; thus, participant μFA and OP data were used to calculate their respective FA maps. Both μFA and FA range from 0 (completely isotropic diffusion) to 1 (completely anisotropic diffusion); however, in voxels with diffusion in multiple directions (high OP), μFA is designed to be robust to these orientation changes, see Figure 1b (Lasič et al., 2014). Group‐averaged multidimensional diffusion parameter brain maps are shown in Figure 2.
FIGURE 2.

Multidimensional diffusion parameter maps averaged across all 30 participants. Top row: D iso (left) is greater (brighter) in regions of greater isotropic (free water) diffusion, such as within ventricles. In contrast, V ison (middle) is lower (darker) in the ventricles due to the uniform lack of restriction on isotropic diffusion, leading to lower variety in diffusion tensor size. D 2 anison (right) is greater in the white matter (WM) due to increased anisotropy, similarly to measures of fractional anisotropy (FA). Bottom row: micro‐fractional anisotropy (μFA, left) remains high in WM regions with crossing fibers (lower orientation parameter [OP] values, right), while FA (middle) decreases in regions where OP is low.
2.7. Statistical analyses
All analyses were conducted using Python (version 3.7.10). We first aimed to verify that our session timing successfully captured group‐level natural variation in gonadal steroid hormones (17β‐estradiol, progesterone) and pituitary gonadotropins (LH, FSH) consistent with known typical menstrual cycle‐related hormone fluctuations for young, naturally cycling women (Stricker et al., 2006). To do this, one‐way analyses of variance (ANOVAs) using the Pingouin (0.5.3) package were conducted that examined the effect of session type (menses, ovulation, mid‐luteal) on HPG‐axis hormone concentration. Then, to determine specific session‐level differences in HPG‐axis concentrations, we conducted post hoc paired‐sample Wilcoxon signed rank tests (statannot 0.2.3), which controlled for the non‐normality of underlying HPG‐axis hormone concentration distributions. Differences were considered significant if they met a Bonferroni‐adjusted p‐value of p < .0167 (p = .05/3 sessions).
Next, we tested whether: (1) HPG‐axis hormone concentration levels are associated with changes in WM diffusion tensor size‐shape‐orientation parameters at the whole brain and region‐specific levels, (2) HPG‐axis hormone concentration levels are associated with changes in CT at the whole brain and region‐specific levels, and (3) HPG‐axis hormone concentration levels are associated with changes in brain volume. To test these relationships, we conducted Bayesian hierarchical regression models to assess whether participants' HPG‐axis hormone concentration values were related to their respective WM diffusion, CT, and volumetric measures across all three sessions. We sampled posterior distributions using No U‐Turn sampling Hamiltonian Monte Carlo, implemented with the PyMC3 package (Salvatier et al., 2016). After tuning the sampler's step size to an acceptance level of 0.95, posteriors were sampled in four parallel chains of 10,000 samples (40,000 total) with an additional initial 5000 samples per chain (tuning samples were then discarded). We required that no chain contain any divergences and that no posterior's R value (the ratio of variance within chains to the variance of pooled chains) would be greater than 1. We then calculated highest density intervals (HDIs; the Bayesian equivalent of a confidence interval) using the default settings (i.e., 94% density) in the arviz package (Kumar et al., 2019). Tables outlining the models described below can be found in the Supplementary Information.
In order to test the first two questions, 28 total models were run: 24 WM diffusion‐hormone models (6 diffusion measures [D iso, V ison, D anison, μFA, FA, OP] × 4 hormones [17β‐estradiol, progesterone, LH, FSH]), and 4 CT‐hormone models (CT × [17β‐estradiol, progesterone, LH, FSH]). We first separately z‐score normalized the brain measures across sessions within each region for each participant, and z‐score normalized the HPG‐axis hormone concentrations across sessions within each participant. We then fitted a hierarchical model, with the lowest level (Level 1) sampling β0 n,r and β1 n,r regression coefficient posteriors at each brain region r for each participant n. This level allowed for the testing of region‐specific brain–hormone relationships for each individual participant. The next level of the hierarchy (Level 2) constrained the distributions of β0 n,r and β1 n,r to be drawn from group‐level (across all participants) Gaussian distributions, that is, β0 n,r ~ N(μ β0(r),𝜎 β0(r)) and β1 n,r ~ N(μ β1(r),𝜎 β1(r)). Here, the group‐level μ β1(r) parameter posterior reflects the expected value of the brain–hormone relationship at the whole‐group level within a region r, while 𝜎 β1(r) reflects the variation in this relationship across participants at that region, that is, “shrinkage.” The next layer of the hierarchy (Level 3) accounted for whole brain effects at the group level by constraining μ (r) and 𝜎(r) parameters to be drawn from hierarchical Gaussian distributions, that is, μ (r) ~ N(M μ ,Σ μ ) and 𝜎(r) ~ N(M 𝜎,Σ𝜎). Here, the group‐level M u(β1) parameter reflects the expected value of the whole brain (across all regions) brain–hormone relationship across all participants, while M 𝜎(β1) reflects the average whole‐brain shrinkage (i.e., the variation in this relationship across participants). M and Σ parameters were respectively constrained with uninformative Gaussian (μ ~ N(0,1)) and half‐Gaussian (𝜎~halfN(1)) priors. This modeling framework allowed us to assess credible relationships for both specific regions and for the whole brain within the same model.
To assess credible relationships at the region‐specific level (Level 2), we first computed a deterministic posterior (d r ), which scaled the expected value by the shrinkage, that is, μ β1/𝜎 β1. For whole‐brain effects (Level 3), we computed another deterministic posterior (D), which was the average whole brain (across all regions) brain–hormone relationship at the group level, scaled by the average shrinkage (variation across participants) of this relationship, that is, M u(β1)/M 𝜎(β1). We then considered relationships credible if the HDI of posteriors d r or D exceeded the region of practical equivalences (ROPEs; Makowski et al., 2019) determined with null‐generative simulations using identical data structure (i.e., 34 regions for WM diffusion or 31 regions for CT, 30 participants, 3 sessions, variables drawn from a z‐distribution; see Supplementary Information). For the 24 WM diffusion‐hormone models and 4 CT‐hormone models that were run, these ROPEs were respectively (−0.35 to 0.35) for d r posteriors and (−0.06 to 0.06) for D posteriors.
Finally, for the third question, we tested whether HPG‐axis hormones are associated with changes in total brain volume, tissue volume, and CSF volume. In order to examine brain volume‐hormone relationships, 12 models (3 volume measures [total brain, tissue, CSF] × 4 hormones [17β‐estradiol, progesterone, LH, FSH]) were run. As before, we z‐score normalized the brain measures across sessions for each participant and normalized the HPG‐axis hormone measures across sessions within each participant. For these volume‐hormone models, “regions” are not defined as atlas ROIs, but as our three whole‐brain volumetric areas of interest (total brain, tissue, and CSF) obtained via ANTs brain segmentation. These volume‐hormone models featured nearly the same structure as the previously described WM diffusion‐hormone and CT‐hormone models; yet, there was no bottom layer associated with individual brain regions. Unlike previous models, each model only examined relationships within one volumetric brain area and did not calculate whole brain effects as an aggregate of individual regions. Instead, the lowest level (Level 1) sampled β0 n and β1 n parameter posteriors at a singular brain volumetric area (whole brain, tissue, CSF) for each participant n, and the second level (Level 2) constrained these distributions to be drawn from group‐level Gaussian distributions, that is, β0 n ~ N(μ β0, 𝜎 β0) and β1 n ~ N(μ β1, 𝜎 β1). As before, the group‐level μ β1 parameter posterior reflects the expected value of the group‐level brain–hormone relationship within the brain volumetric area, while 𝜎 β1 reflects variation in this relationship across individuals at in that area, that is, “shrinkage.” μ and 𝜎 parameters were respectively constrained with uninformative Gaussian (μ ~ N(0,1)) and half‐Gaussian (𝜎~halfN(1)) priors. As before, we assessed relationships by computing a deterministic posterior (D), which scaled the expected value by the shrinkage, that is, μ β1/𝜎 β1. Here, we imposed a ROPE of (−0.35 to 0.35) for D posteriors, determined with null‐generative simulations using identical data structure (1 brain volumetric area, 30 participants, 3 sessions, variables drawn from a z‐distribution).
3. RESULTS
3.1. HPG‐axis hormone concentrations
In the first step of our analyses, we verified that HPG‐axis hormone concentrations varied across the three experimental sessions coinciding with estimated menstrual cycle phases (menses, ovulation, and mid‐luteal). For our study population, group mean participant cycle length (average across all tracked cycles for a given participant) was 31.20 days (range = 24.44–43.82). A summary of median HPG‐axis hormone concentration values by estimated phase can be found in Table 1. We confirmed that, across estimated cycle phases, HPG‐axis hormone concentrations significantly (p < .05) varied: 17β‐estradiol (F = 40.20, p < .001, η 2 = .47), progesterone (F = 65.93, p < .001, η 2 = .61), LH (F = 38.65, p < .001, η 2 = .47), and FSH (F = 47.69, p < .001, η 2 = .48).
TABLE 1.
Median values of group serum HPG‐axis hormone concentrations by session type.
| Session | 17β‐estradiol (pg/mL) | Progesterone (ng/mL) | LH (mIU/mL) | FSH (mIU/mL) |
|---|---|---|---|---|
| Menses | 26.0 (17.25, 31.0) | 0.09 (0.07, 0.18) | 4.64 (3.06, 6.26) | 5.88 (4.56, 7.09) |
| Ovulation | 200.0 (125.0, 267.5) | 0.65 (0.53, 1.06) | 43.69 (21.21, 59.96) | 9.81 (6.15, 13.54) |
| Mid‐luteal | 125.0 (83.25,167.5) | 11.0 (5.48, 17.25) | 4.67 (2.33, 9.72) | 2.70 (2.10, 3.94) |
Note: Values in table are reported as median (Q1,Q3).
Abbreviations: FSH, follicle‐stimulating hormone; HPG, hypothalamic–pituitary‐gonadal; LH, luteinizing hormone.
Post‐hoc paired Wilcoxon signed‐rank tests found that within‐subject group‐level differences in HPG‐axis hormone concentration levels were consistent with known patterns of HPG‐axis hormone fluctuations across a typical menstrual cycle in young, naturally cycling women (Stricker et al., 2006). Significance was defined according to a Bonferroni‐adjusted p‐value of p < .0167 (p = .05/3 sessions). Overall, we observed a group‐level pattern of moderate levels of FSH and relatively low concentrations of 17β‐estradiol, progesterone, and LH during menses sessions, relatively high concentrations of 17β‐estradiol, LH, and FSH during ovulation sessions, and relatively high concentrations of progesterone/moderate concentrations of 17β‐estradiol during mid‐luteal sessions. Specifically, 17β‐estradiol concentrations (Figure 3a) were significantly greater during the ovulation and mid‐luteal sessions when compared with menses (p < .0001), while the difference between ovulation and mid‐luteal sessions did not pass the Bonferroni‐adjusted p‐value (p = .028). Progesterone concentrations (Figure 3b) were significantly greater during the mid‐luteal session when compared with ovulation and menses, as well as during the ovulation session when compared with menses (p < .0001). LH concentrations (Figure 3c) were greater during the ovulation session when compared with both menses and mid‐luteal sessions (p < .0001); menses and mid‐luteal sessions did not significantly differ (p = .62). Similarly, FSH concentrations (Figure 3d) were greater during the ovulation session when compared with both menses (p < .001) and mid‐luteal (p < .0001) sessions, while menses was found to have greater concentrations when compared with the mid‐luteal session (p < .0001).
FIGURE 3.
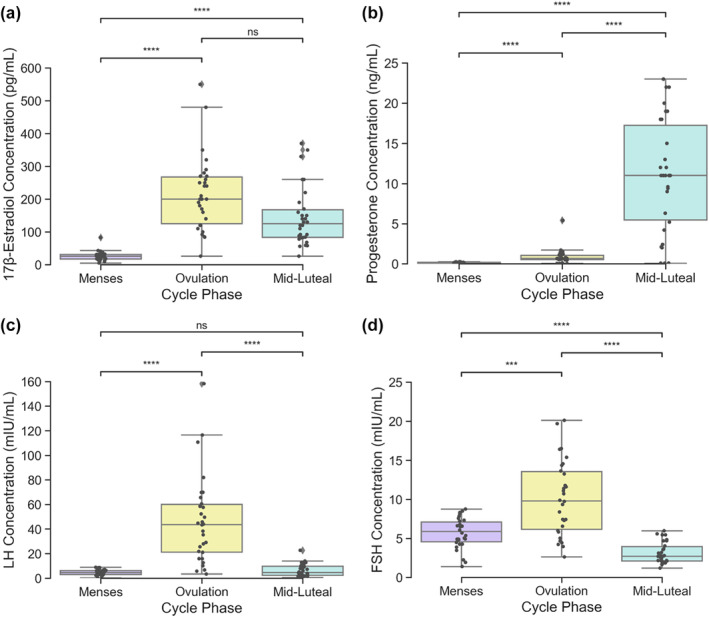
Variation in hypothalamic–pituitary–gonadal axis hormone concentrations across three experimental scanning sessions coinciding with estimated menstrual cycle phases (N = 30). One‐way ANOVAs found significant estimated phase on hormone concentration effects for all four hormones studied (p < .001). Significant differences in within‐subject hormone concentrations between sessions ([a]: 17β‐estradiol, [b]: progesterone, [c]: LH, [d]: FSH) were determined by Wilcoxon signed‐rank tests and defined with a Bonferroni‐adjusted p < .0167. *** indicates p < .001, **** indicates p < .0001, ns indicates no significance found. Gray points indicate individual participant values. FSH, follicle‐stimulating hormone; LH, luteinizing hormone.
3.2. HPG‐axis hormone and WM microstructure relationships
Next, we tested if HPG‐axis hormone concentrations (17β‐estradiol, progesterone, LH, FSH) are associated with six WM multidimensional diffusion parameters that describe aspects of diffusion tensor size (mean isotropic diffusivity size [D iso], variation in isotropic diffusivity size [V ison]), shape (mean squared anisotropy [D 2 anison], μFA, FA), and orientation (OP). Note that tables report unadjusted regression coefficients (β weights), while relationships were only considered credible (positive or negative) if an estimate of effect size (i.e., shrinkage‐adjusted coefficients) for whole brain (D) or region‐specific relationships (d r ) exceeded defined regions of practical equivalence (ROPEs; D: [−0.06 to 0.06], d r : [−0.35 to 0.35]; see Section 2.7).
3.2.1. Whole brain
Beginning with credible relationships across the whole brain (Table 2), hierarchical Bayesian regression models found that whole‐brain relationships between WM diffusion parameters and hormones differed depending on whether we were examining associations with diffusion tensor size, shape, or orientation.
TABLE 2.
Whole‐brain beta weights and credibility tests for all white matter diffusion hierarchical Bayesian regression models.
| Relationship | β 1 | D | HDI of D |
|---|---|---|---|
| D iso–17β‐estradiol | −0.055 | −0.123 | [−0.22, −0.031] |
| D iso –progesterone | 0.258 a , b | 0.593 | [0.46, 0.732] |
| D iso –LH | −0.211 a | −0.516 | [−0.648, −0.397] |
| D iso –FSH | −0.299 a , b | −0.796 | [−1.001, −0.619] |
| V ison –17β‐estradiol | 0.132 a | 0.311 | [0.209, 0.419] |
| V ison–progesterone | −0.043 | −0.074 | [−0.155, 0.003] |
| V ison –LH | 0.085 a | 0.193 | [0.097, 0.288] |
| V ison–FSH | 0.056 | 0.105 | [0.025, 0.189] |
| D 2 anison –17β‐estradiol | 0.182 a | 0.381 | [0.289, 0.48] |
| D 2 anison –progesterone | 0.090 a | 0.162 | [0.081, 0.247] |
| D 2 anison –LH | 0.115 a | 0.293 | [0.182, 0.405] |
| D 2 anison–FSH | 0 | 0.001 | [−0.093, 0.095] |
| μFA–17β‐estradiol | 0.145 a | 0.305 | [0.211, 0.4] |
| μFA–progesterone | 0 | 0 | [−0.082, 0.082] |
| μFA–LH | 0.111 a | 0.261 | [0.157, 0.364] |
| μFA–FSH | 0.065 | 0.132 | [0.04, 0.219] |
| FA–17β‐estradiol | 0.052 | 0.090 | [0.012, 0.167] |
| FA–progesterone | 0.105 a | 0.219 | [0.121, 0.322] |
| FA–LH | 0.027 | 0.049 | [−0.031, 0.133] |
| FA–FSH | −0.045 | −0.093 | [−0.179, 0] |
| OP–17β‐estradiol | −0.005 | −0.010 | [−0.095, 0.071] |
| OP–progesterone | 0.043 | 0.086 | [−0.001, 0.178] |
| OP–LH | 0.030 | 0.067 | [−0.027, 0.163] |
| OP–FSH | 0.026 | 0.056 | [−0.037, 0.152] |
A credible whole brain relationship (HDI of D lies outside of the ROPE [−0.06–0.06]).
Credible relationships at the region‐specific level (HDI of d r lies outside of the ROPE [−0.35–0.35] for at least one region). Beta weights and credibility tests for individual region D iso‐FSH and D iso‐progesterone relationships are located in Tables S1 and S2.
Abbreviations: FA, fractional anisotropy; FSH, follicle‐stimulating hormone; HDI, highest density interval; LH, luteinizing hormone; OP, orientation parameter; ROPE, region of practical equivalence; μFA, micro‐fractional anisotropy. Credible/significant results are shown in bold values.
With parameters related to size (Table 2), we first observed that D iso (a measure of isotropic diffusivity size and index of MD) was positively associated with progesterone concentrations (β 1 = 0.258, D = 0.593, HDI = [0.46, 0.732]), and negatively associated with LH and FSH (LH: β 1 = −0.211, D = −0.516, HDI = [−0.648, −0.397]; FSH: β 1 = −0.299, D = −0.796, HDI = [−1.001, −0.619]). Meanwhile V ison (variation in isotropic diffusivity size) was positively associated with 17β‐estradiol and LH (17β‐estradiol: β 1 = 0.132, D = 0.311, HDI = [0.209, 0.419]; LH: β 1 = 0.085 D = 0.193, HDI = [0.097, 0.288]). No other relationships credibly exceeded the ROPE. Overall, these results indicate that the mean size of isotropic diffusivity (MD) demonstrated both positive (progesterone) and negative (LH, FSH) relationships with hormone concentrations, while variation in the size of isotropic diffusivity exhibited positive relationships with 17β‐estradiol and LH.
Next, with parameters related to shape (Table 2), we first observed that D 2 anison (a measure of mean squared anisotropy) was positively associated with 17β‐estradiol, LH, and progesterone (17β‐estradiol: β 1 = 0.182, D = 0.381, HDI = [0.289, 0.48]; LH: β 1 = 0.115, D = 0.293, HDI = [0.182, 0.405], progesterone: β 1 = 0.090, D = 0.162, HDI = [0.081, 0.247]). Meanwhile, μFA was positively associated with 17β‐estradiol and LH (17β‐estradiol: β 1 = 0.145, D = 0.305, HDI = [0.211, 0.4]; LH: β 1 = 0.111, D = 0.261, HDI = [0.157, 0.364]). In contrast, progesterone was positively associated with conventional FA (β 1 = 0.105, D = 0.219, HDI = [0.121, 0.322]). All other relationships did not credibly exceed the ROPE. Overall, these results indicate that multidimensional diffusion parameters that assess diffusion tensor shape (D 2 anison and μFA) exhibited positive relationships with 17β‐estradiol and LH, similar to the pattern observed above for the size parameter V ison. Interestingly, progesterone holds a positive relationship with conventional FA, another measure of diffusion tensor shape, highlighting a discrepancy between what these anisotropy parameters may represent. Finally, with parameters related to orientation (OP), we observed no credible associations (Table 2).
3.2.2. Region‐specific
We next tested relationships between HPG‐axis hormone concentrations and WM diffusion parameters at the region‐specific level within the same hierarchical Bayesian regression models (Table 2). Overall, only the size parameter D iso (index of MD) was credibly associated with hormone concentrations at the regional level (Figure 4). More specifically, concentrations of progesterone and FSH were associated with D iso in multiple regions, but in opposing directions. FSH (Figure 4, top row) was negatively associated with D iso in 17 regions; in seven of those, progesterone (Figure 4, bottom row) was also positively associated with D iso (corpus callosum forceps major, corpus callosum tapetum, fornix, frontal parahippocampal cingulum, optic radiation, posterior corticostriatal tract, posterior thalamic radiation). In all credible regions, region‐specific relationships trended in the same direction as the respective whole‐brain effects (i.e., FSH: negative, progesterone: positive). No credible region‐specific relationships were observed between any hormones and either shape or orientation WM diffusion parameters. These results indicate that, in several overlapping regions across the brain, progesterone and FSH concentrations had opposing influence uniquely on size parameters, that is, they exhibited opposing relationships with MD. Further region‐specific visualization of relationships between hormone estimates and D iso are provided in the Supplementary Information (Figures S1 and S2 and Tables S1 and S2).
FIGURE 4.
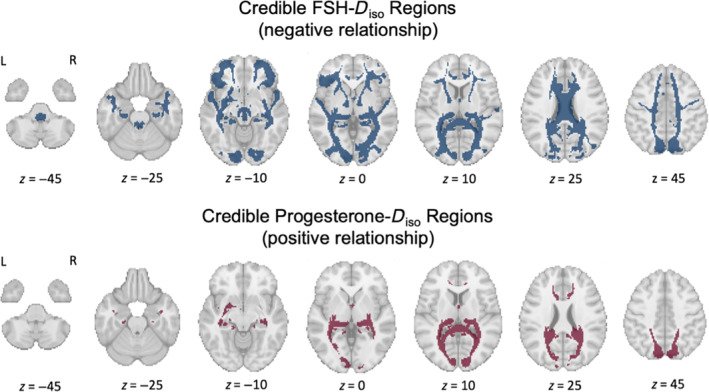
White matter regions where follicle‐stimulating hormone (FSH)–Diso (top row) and progesterone–D iso (bottom row) relationships are credible (N = 30). Top row: Blue indicates the 17 regions where within‐subject increases in FSH concentrations were credibly associated with a decrease in mean region D iso (an index of mean diffusivity [MD]) across the three sessions (negative relationship). Across the whole brain, FSH and luteinizing hormone (LH) concentrations were credibly negatively associated with D iso (LH not credible at the region‐specific level). Bottom row: Red indicates the 7 regions where within‐subject increases in progesterone concentrations were credibly associated with an increase in mean region D iso across the three sessions (positive relationship). Across the whole brain, progesterone concentrations were also credibly positively associated with D iso. Both FSH and progesterone were associated with changes in D iso in seven shared regions (corpus callosum forceps major, corpus callosum tapetum, fornix, frontal parahippocampal cingulum, optic radiation, posterior corticostriatal tract, posterior thalamic radiation), but in opposing directions matching their respective whole‐brain trends (FSH: negative, progesterone: positive).
3.3. HPG‐axis hormone and CT relationships
We next tested whether changes in HPG‐axis hormone concentrations (17β‐estradiol, progesterone, LH, FSH) are associated with changes in mean ROI GM CT estimates derived from T1‐MPRAGE images. Again, relationships were only considered credible (positive or negative) if an estimate of effect size (i.e., shrinkage‐adjusted coefficients) for whole brain (D) or region‐specific relationships (d r ) exceeded defined regions of practical equivalence (ROPEs; D: [−0.06 to 0.06], d r : [−0.35 to 0.35]; see Section 2.7).
3.3.1. Whole brain
Beginning again with credible relationships across the whole brain (Table 3), hierarchical Bayesian regression models found that whole brain CT was uniquely associated with FSH (β 1 = 0 .162, D = 0.395, HDI = [0.115, 0.678]). Progesterone trended toward a negative relationship with CT, but the relationship did not reach the criteria for credibility (β 1 = −0.099, D = −0.197, HDI = [−0.453, 0.066]). We did not observe credible wholebrain relationships for any of the other considered hormones.
TABLE 3.
Whole‐brain beta weights and credibility tests for all cortical thickness (CT) hierarchical Bayesian regression models.
| Relationship | β 1 | D | HDI of D |
|---|---|---|---|
| CT–17β‐estradiol | 0.065 | 0.191 | [0.059, 0.325] |
| CT–progesterone | −0.099 a | −0.197 | [−0.453, 0.066] |
| CT–LH | 0.071 | 0.198 | [0.006, 0.401] |
| CT–FSH | 0.162 a , b | 0.395 | [0.115, 0.678] |
A credible whole brain relationship (HDI of D lies outside of the ROPE [−0.06–0.06]).
Credible relationships at the region level (HDI of d r lies outside of the ROPE [−0.35–0.35] for at least one region). Beta weights and credibility tests for individual region CT‐FSH and CT‐progesterone relationships are located in Supplementary Tables S3 and S4.
Abbreviations: FSH, follicle‐stimulating hormone; HDI, highest density interval; LH, luteinizing hormone; ROPE, region of practical equivalence. Credible/significant results are shown in bold values.
3.3.2. Region‐specific
We tested relationships between hormones and CT at the region‐specific level within the same hierarchical Bayesian regression models (Table 3). Overall, CT was associated with both progesterone and FSH at the region‐specific level.
More specifically, FSH was positively associated with CT in eight regions (Figure 5, top row). Progesterone was also associated with CT in eight regions (Figure 5, bottom row), but the relationship between progesterone and CT associations did not always follow its negative whole brain trend. Progesterone was negatively associated with CT in six regions, and positively associated with CT in two regions.
FIGURE 5.
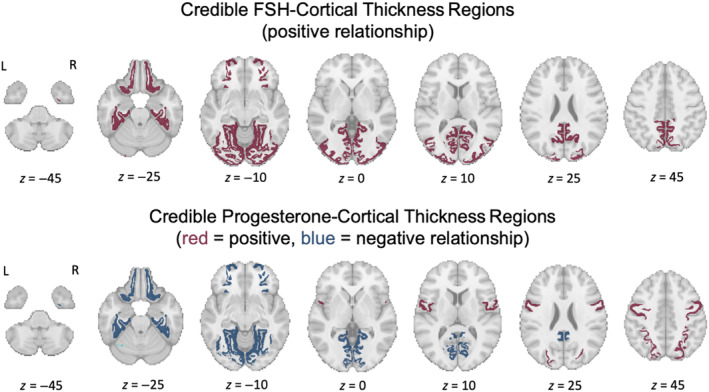
Cortical regions where follicle‐stimulating hormone (FSH)‐cortical thickness–(CT, top row) and progesterone‐CT (bottom row) relationships are credible (N = 30). Top row: Red indicates regions where within‐subject increases in FSH concentrations were credibly associated with an increase in mean region CT across the three sessions (positive relationship). These regions include the fusiform gyrus, isthmus cingulate, lateral occipital gyrus, lateral orbitofrontal gyrus, lingual gyrus, parahippocampal gyrus, pericalcarine cortex, and the precuneus. Across the whole brain, FSH concentrations were credibly positively associated with CT. Bottom row: Blue indicates regions where within‐subject increases in progesterone concentrations were credibly associated with a decrease in mean region CT across the three sessions (negative relationship). Positive FSH–CT relationships were also credible for these areas. These regions include the fusiform gyrus, isthmus cingulate, lateral orbitofrontal gyrus, lingual gyrus, parahippocampal gyrus, and the pericalcarine cortex. Red indicates regions where progesterone was credibly associated with an increase in CT (positive relationship). These regions include the precentral gyrus and the superior parietal lobule.
Both FSH and progesterone exhibited relationships with CT in six shared regions (fusiform gyrus, isthmus cingulate, lateral orbitofrontal gyrus, lingual gyrus, parahippocampal gyrus, and pericalcarine cortex); in each of these regions with shared FSH and progesterone influences over CT, relationships trended in opposite directions from each other. We did not observe any credible region‐specific relationships between CT and either 17β‐estradiol or LH. Based on these results, we observed that FSH and progesterone were associated with CT in opposite directions within several overlapping regions, similarly to the region‐specific pattern observed for the WM parameter, D iso (MD). However, unlike what was found in the WM, region‐specific relationships between progesterone and CT sometimes deviated from the relationships seen at the whole brain level. Further region‐specific visualization of relationships between hormone estimates and CT are provided in the Supplementary Information (Figures S3 and S4 and Tables S3 and S4).
3.4. HPG‐axis hormone and brain volume relationships
We finally tested whether changes in HPG‐axis hormone concentrations (17β‐estradiol, progesterone, LH, FSH) are associated with within‐subject changes in total brain volume, tissue volume, and CSF volume (Table 4). Note that in this case, there was no layer to the hierarchical model associated with individual brain regions, such that each variable here relates to a whole brain measure of a volumetric area. These whole‐brain relationships were considered credible (positive or negative) if an estimate of effect size (i.e., shrinkage‐adjusted coefficients, or D) exceeded a defined ROPE which is equivalent to that of a single region in the previous models (−0.35 to 0.35).
TABLE 4.
Beta weights and credibility tests for all brain volume hierarchical Bayesian regression models.
| Relationship | β 1 | D | HDI of D |
|---|---|---|---|
| Total brain volume–17β‐estradiol | 0.111 | 0.341 | [−0.774, 2.332] |
| Total brain volume–progesterone | −0.053 | −0.101 | [−0.625, 0.434] |
| Total brain volume–LH | 0.081 | 0.173 | [−0.471, 0.86] |
| Total brain volume–FSH | 0.066 | 0.167 | [−0.655, 1.239] |
| Tissue volume–17β‐estradiol | 0.279 | 2.203 | [−0.461, 20.52] |
| Tissue volume–progesterone | 0.660 a | 2.616 | [0.607, 15.845] |
| Tissue volume–LH | −0.193 | −1.058 | [−10.497, 1.008] |
| Tissue volume–FSH | −0.452 | −1.366 | [−6.281, −0.14] |
| Cerebrospinal fluid–17β‐estradiol | −0.292 | −2.631 | [−24.278, 0.535] |
| Cerebrospinal fluid–progesterone | −0.749 a | −2.709 | [−11.604, −0.903] |
| Cerebrospinal fluid–LH | 0.183 | 1.262 | [−1.205, 11.979] |
| Cerebrospinal fluid–FSH | 0.484 | 1.907 | [0.18, 12.87] |
Credible relationships at the whole brain volumetric area level (HDI of D lies outside of the ROPE [−0.35–0.35]).
Abbreviations: FSH, follicle‐stimulating hormone; HDI, highest density interval; LH, luteinizing hormone; ROPE, region of practical equivalence. Credible/significant results are shown in bold values.
Hierarchical Bayesian regression models found that progesterone was credibly positively associated with tissue volume (β 1 = 0.66, D = 2.616, HDI = [0.607, 15.845]) and negatively associated with CSF volume (β 1 = −0.749, D = −2.709, HDI = [−11.604, −0.903]); no other hormones exhibited relationships with tissue or CSF volumes. We did not observe credible total brain volume relationships for any of the considered hormones.
4. DISCUSSION
In the current study, we tested whether menstrual cycle‐driven HPG‐axis hormone concentrations in 30 naturally cycling women are associated with within‐subject WM microstructural, GM CT, and brain volume changes at both whole brain and region‐specific levels. Group‐level HPG‐axis hormone concentrations measured during three estimated phases of the menstrual cycle (menses, ovulation, and mid‐luteal) were confirmed to fluctuate in accordance with expected values (Stricker et al., 2006). 17β‐estradiol, LH, and FSH (hormones that peak during ovulation) were associated with increased whole brain WM microstructural anisotropy (μFA), whole‐brain variation in isotropic diffusion tensor size, and whole brain and region‐specific CT (FSH only), as well as decreased whole brain and region‐specific isotropic diffusion (D iso, from here on referred to as “mean diffusivity” [MD]). In contrast, progesterone (which peaks during the luteal phase) was associated with increased MD at both the whole brain and region‐specific levels, increased and decreased region‐specific CT, and increased tissue/decreased CSF volume.
4.1. HPG‐axis hormones and WM microstructure
While recent work has identified menstrual cycle‐related structural changes in singular regions such as the hypothalamus, hippocampus, and fornix, the current study is the first to report widespread WM microstructural changes associated with cycle‐driven hormone fluctuations (Baroncini et al., 2010; Barth et al., 2016; De Bondt, Van Hecke, et al., 2013; Protopopescu et al., 2008). Our results suggest a global decrease in freely diffusing WM water when FSH is elevated, likely during the follicular and ovulatory phases. The ovulatory phase is also likely marked by increased anisotropic diffusion and variation in tensor size, which correlate with high 17β‐estradiol and LH levels. With increased progesterone levels, likely during the luteal phase, we then see a global increase in freely diffusing WM water and tissue volume. While FSH and progesterone‐associated changes in MD were credible at the region‐specific level, HPG‐axis hormone‐associated fluctuations in anisotropy and MD identified here were overall not restricted to singular WM bundles.
Previous work has identified 17β‐estradiol‐associated increases in hippocampal FA and 17β‐estradiol/LH‐associated decreases in fornix MD in naturally cycling women (Barth et al., 2016; De Bondt, Van Hecke, et al., 2013). Similarly, our results suggest an ovulatory hormone (17β‐estradiol and LH)‐associated pattern of increased anisotropy, as well as decreased limbic system MD. On the other hand, progesterone was found to be positively associated with MD. Şafak, 2019 observed increased apparent diffusion coefficients (diffusivity) across the whole brain in the luteal (high progesterone) vs. follicular (low progesterone) phases, though the results were not statistically significant. In the current study, progesterone was paradoxically found to also increase with FA (a ratio of anisotropy/isotropy). FA's known sensitivity to factors outside of cell microstructure, such as fiber orientation, may explain this discrepancy (Volz et al., 2018). While FA may provide adequate representation of WM microstructure in isolated tracts with parallel bundles, track‐specific changes in FA in this study and others may be compromised when investigating across the whole brain due to potential interactions between WM structural changes and crossing fiber anatomy. Our whole brain volume observations provide context to this finding. The observed positive relationship between progesterone and tissue volume contained within a static total brain volume would cause this tissue to expand into the ventricles, leading to the observed decrease in CSF volume. This change may cause displacement of crossing fiber locations within the WM, thus inducing spurious alterations in FA values. A previous study of seven individuals across the cycle also identified an inverse relationship between tissue (in their case, GM) and CSF volumes, albeit with conflicting results (progesterone negatively associated with GM volume and positively associated with CSF volume; Hagemann et al., 2011). Differing image processing methods and individual differences in brain–hormone relationships may account for this discrepancy; future investigations are needed with larger and more diverse cohorts.
4.2. Potential mechanisms of HPG‐axis hormone‐associated WM microstructural changes
While the mechanism driving cycle‐dependent changes in diffusion parameters across the whole brain are unknown, here we consider a few putative mechanisms. Both estradiol and progesterone are implicated in the upregulation of cell myelination and myelin repair (Arevalo et al., 2010; Schumacher et al., 2012). Yet, this study found that 17β‐estradiol was associated with increased anisotropy (often claimed to represent increased WM “integrity”/myelination), while progesterone was associated with increased diffusivity. Due to the limited resolution of diffusion imaging, these parameters are sensitive to changes in several factors, including myelin content, axon density (Friedrich et al., 2020), and interstitial/extracellular fluid volume, making it difficult to pinpoint exactly which factor is contributing to these diffusion property changes.
The molecular, physiologic, and anatomic effects of HPG‐axis hormones are widespread, targeting astrocytes, microglia, and NMDA receptors, among other sites (Brann et al., 2007). Therefore, it is unlikely that only one mechanism describes the brain–hormone relationships observed with MRI. Here we consider one potential factor that is directly related to our primary MRI measure (water diffusion): aquaporin‐4 (AQP4). APQ4 is a water channel ubiquitous in astrocyte end feet located on brain capillaries (Wardlaw et al., 2020). AQP4 is implicated in facilitating water movement between perivascular spaces (Virchow‐Robin spaces) and the interstitial fluid, rendering its role integral for maintaining brain water and ion homeostasis, a process especially apparent during post‐injury edema formation (Sun et al., 2007; Wardlaw et al., 2020). Rodent studies have identified inhibitory effects of estradiol on AQP4; for example, estradiol treatment was found to prevent AQP4 expression after a rodent model of ischemic brain edema formation was induced (Shin et al., 2011). In contrast, progesterone has been implicated in counteracting estradiol's inhibitory effects on brain water accumulation (Soltani et al., 2016), a mechanism that may underlie our observed positive relationship between progesterone and MD. Yet, while HPG‐axis hormones have been linked to aquaporin functioning in human reproductive organs, the link between AQP4 and HPG‐axis hormones in the human brain is largely unknown and requires further study (He et al., 2006).
4.3. HPG‐axis hormones and CT
With regard to CT, exogenous (e.g., via oral contraceptives) and endogenous changes in HPG‐axis hormone concentrations have been associated with alterations in region‐specific cortical and subcortical GM morphology (Hoekzema et al., 2017; Lisofsky et al., 2016; Paternina‐Die et al., 2024; Petersen et al., 2015; Taylor et al., 2020; Zsido et al., 2023). This study is the first, to our knowledge, to report widespread CT changes directly correlated with HPG‐axis hormone concentration fluctuations across the whole brain. FSH was associated with increased CT and progesterone was associated with decreased CT within several shared regions, including the parahippocampal and fusiform gyri. Similarly, previous work has identified increased cortical GM volume in the right fusiform and parahippocampal gyri, as well as increased left hemisphere CT, in the early follicular (i.e., preovulatory, low progesterone) vs. luteal (high progesterone) phases (Meeker et al., 2020; Pletzer et al., 2010). Additionally, 17β‐estradiol (typically low during the early follicular phase and elevated during the luteal phase) has been negatively associated with anterior cingulate cortex GM volume (De Bondt, Jacquemyn, et al., 2013). Our finding that progesterone is associated with both increased and decreased CT suggests that the directionality of HPG‐axis hormone‐GM morphology relationships may vary widely across regions. While most previous work has observed decreased regional GM CT or volume during the luteal phase, a study assessing amygdala morphology found increased GM volume during the luteal phase, implicating that GM volume fluctuation patterns may vary by region (Ossewaarde et al., 2013). Within the MTL, cycle‐driven progesterone‐GM volume relationship directionality has varied across subregions (Taylor et al., 2020; Zsido et al., 2023). In our findings, we see that the difference in progesterone–CT relationship valence lies between more superior motor/parietal (positive association) and more inferior orbitofrontal/occipital/limbic (negative association) regions. One potential cause could be the heterogeneity of 17β‐estradiol and progesterone hormone receptor locations across the brain, with known dense concentrations in prefrontal, subcortical, cerebellar, and limbic regions (Barth et al., 2015). Another factor to consider is regional differences in the biomechanical alteration of brain tissue (compression, stretching, etc.) in response to whole‐brain morphological shifts (Prange & Margulies, 2002). Based on these results, brain–HPG‐axis hormone relationships should not be assumed to be uniform across all regions.
4.4. Potential mechanisms of HPG‐axis hormone‐associated CT changes
The observed cycle‐associated changes in CT may be due to a variety of factors. Neuromodulatory factors beyond synaptic transmission, such as 17β‐estradiol, have been shown to increase astrocytic Ca2+ and lead to neural activity‐independent slow modulation of cerebral blood flow (Iadecola & Nedergaard, 2007). Additionally, arterial spin labeling MRI has identified increased frontal pole cerebral blood flow during the follicular phase, albeit with a very small sample of women (Otomo et al., 2020). Thus, the observed changes in CT may be due to hormone‐driven alterations in cerebral blood flow. However, HPG‐axis hormone‐associated volumetric changes in the MTL have been found to be independent of cerebral blood flow (Zsido et al., 2023), casting doubt on this explanation. Rodent studies have identified rapid (timescale of hours to days) estradiol and progesterone‐mediated changes in hippocampal cell spine/synapse density (Woolley & McEwen, 1993). Additionally, hormone treatment with estradiol has been found to increase prefrontal cortex spine number and density in nonhuman primates (Hao et al., 2006; Tang et al., 2004), though some investigations failed to observe this effect (Young et al., 2013). Future investigations are needed to determine whether human menstrual cycle‐driven changes in CT reflect short‐term changes in synaptic plasticity, and why brain–hormone relationships may vary across cortical and subcortical regions.
4.5. Behavioral, functional, and clinical implications
Although we do not currently report functional consequences or correlates of structural brain changes, our findings may have implications for hormone‐driven alterations in behavior and cognition. Notably, our results point to FSH vs. progesterone‐associated opposing effects (MD and CT) in several shared WM and GM regions. These identified regions are mainly limbic (fornix, parahippocampal gyrus, cingulate) and temporo‐occipital (fusiform and lingual gyri, pericalcarine cortex, optic radiation, posterior thalamic and corticostriatal tracts). Within our sample, FSH was the only hormone that exhibited moderate values during the menses (early follicular) session. Thus, our observed structural changes may be due to a preovulatory/early follicular (moderate FSH) versus postovulatory/luteal (high progesterone) “seesaw” effect, or may be directly linked to FSH and progesterone values. A wide body of evidence supports the idea that progesterone is a powerful modulator of limbic structures, rapidly altering hippocampal subfield structure (Taylor et al., 2020; Woolley & McEwen, 1993) and exhibiting paradoxical anxiolytic (Frye et al., 2006) and negative affect‐promoting properties through action on GABA‐A receptors (Bäckström et al., 2011). Additionally, progesterone has been linked to changes in network dynamics outside of the limbic system (Arélin et al., 2015; Pritschet et al., 2020; Syan et al., 2017). Along with these findings, our results support the notion that progesterone not only acts on the limbic system, but also on structural and functional networks across the whole brain. While progesterone has been more widely studied, very little is known about how endogenous FSH affects the human brain in young women. Network analyses of a single woman's menstrual cycle found that pituitary gonadotropin (LH and FSH) concentrations were coupled with network community frequency (Greenwell et al., 2023); however, future investigations are needed to assess this finding across populations. Our findings that FSH is associated with significant GM and WM structural changes highlights the need for further study of pituitary gonadotropins and the mechanisms that underlie their action on the human brain. The current study did not directly link changes in WM microstructure or CT to behavioral outcomes. Yet, network neuroscience has identified interdependence between anatomical and functional network properties (Bullmore & Sporns, 2009). Our reported widespread alterations in regional WM and GM structural properties, which span across anatomical networks, may couple with significant changes in brain network function. These changes could underlie the significant behavioral and symptomological fluctuations commonly experienced across the cycle. Finally, our results suggest that HPG‐axis hormones may be significant modulators of whole brain water dynamics and WM cell architecture. Understanding how HPG‐axis hormones may affect water diffusion measures in humans could have significant clinical implications. For example, sex and age differences in post‐brain injury outcomes could be explained by differing hormonal effects on the brain injury response, such as brain water accumulation (Gupte et al., 2019). Our findings prompt the need to incorporate measures of WM tissue structure into future studies of HPG‐axis hormone fluctuations.
4.6. Limitations and future considerations
While this study has significant strengths due to its within‐subject design and reliable brain measures, several limitations exist. Data were only sampled at three time points/participant, providing sparse sampling to our regression model and leaving out associations that occur during the other days of the menstrual cycle. We estimated scheduling of the ovulation and luteal sessions through at‐home ovulation tests, which can be positive across multiple days, or, for some individuals, never reach the “positive” threshold as defined by the test manufacturer. Because of this, ovulation and mid‐luteal sessions may not have captured the exact ovulation or mid‐luteal day for all participants. Despite this, significant fluctuations in HPG‐axis hormones were captured, allowing us to achieve the primary aim of associating brain measures with HPG‐axis hormone concentrations (as opposed to cycle phase). Future dense‐sampling studies are needed to fill these information gaps. The correlational nature of this work means that true causality between HPG‐axis hormones and brain structure could not be established. Other HPG‐axis hormones not considered here may influence brain structural changes across the menstrual cycle. Examples include testosterone, which has been found to increase during the ovulatory phase but have day‐to‐day variability that exceeds cycle‐related variability, and dehydroepiandrosterone‐sulfate, which has been found to decrease during the mid‐luteal phase (Bui et al., 2013; Hamidovic et al., 2022). Future analyses of these hormones and their relationships to brain structure are needed. Alterations in brain structural measures may also be due to nonhormone factors that coincide with menstrual cycle rhythms. While this study aimed to address this by assessing brain‐HPG‐axis hormone (as opposed to cycle phase) relationships, future population studies with pharmacological hormone suppression are needed to establish causality. Additionally, while the current work has a larger sample size than many previous menstrual cycle studies, larger consortium studies are warranted to truly establish brain–hormone associations at the population level. All participants were adults under the age of 30 at time of study, but menstrual cycle‐driven brain–hormone associations may evolve throughout the lifespan. Further study in younger and older age groups is needed to better understand this relationship. The CT changes described here are based on standard T1‐MPRAGE images, which may miss more localized/subregional changes that we are not able to detect. Further study of brain–hormone relationships at the subregion level is warranted. Finally, an analysis consisting of 40 separate Bayesian models may pose a risk for susceptibility to Type 1 error. However, our imposition of a ROPE based on null‐generative models serves as a conservative protection for multiple comparisons.
5. CONCLUSIONS
HPG‐axis hormones (17β‐estradiol, progesterone, LH, FSH) were associated with significant modulations of WM microstructure and CT. Naturally cycling young women experience widespread brain structural changes in concert with HPG‐axis hormone fluctuations. While modulation of the MTL is more established, structural and functional networks across the brain should be considered in HPG‐axis hormone research. Investigation of brain–hormone relationships across networks is necessary to understand human nervous system functioning on a daily basis, during hormone transition periods, and across the human lifespan.
Supporting information
Data S1: Supporting information.
ACKNOWLEDGMENTS
The authors thank Jan Martin and Frederik Bernd Lund at the Institute of Radiology, University Hospital Erlangen, Friedrich‐Alexander‐Universität Erlangen‐Nürnberg (FAU), Erlangen, Germany for providing software code for the gradient tensor waveforms. We would also like to thank Mario Mendoza for MRI assistance, as well as Drs. Laura Pritschet, Shuying Yu, Caitlin Taylor, and Tyler Santander for advising on study procedures. The research was supported by the Institute for Collaborative Biotechnologies under Cooperative Agreement (W911NF‐19‐2‐0026) and contract (W911NF‐19‐D‐0001) from the Army Research Office. The content of the information does not necessarily reflect the position or the policy of the Government and no official endorsement should be inferred. For blood sample processing, the Endocrine Technologies Core (ETC) at Oregon National Primate Research Center (ONPRC) is supported (in part) by NIH grant (P51 OD011092) for operation of the Oregon National Primate Research Center. Research reported in this publication was supported by the Office of the Director, National Institutes of Health of the National Institutes of Health under award number (S10OD026701). The content is solely the responsibility of the authors and does not necessarily represent the official views of the National Institutes of Health.
Rizor, E. J. , Babenko, V. , Dundon, N. M. , Beverly‐Aylwin, R. , Stump, A. , Hayes, M. , Herschenfeld‐Catalan, L. , Jacobs, E. G. , & Grafton, S. T. (2024). Menstrual cycle‐driven hormone concentrations co‐fluctuate with white and gray matter architecture changes across the whole brain. Human Brain Mapping, 45(11), e26785. 10.1002/hbm.26785
Elizabeth Rizor and Viktoriya Babenko contributed equally to this work.
Contributor Information
Elizabeth J. Rizor, Email: elizabethrizor@gmail.com.
Scott T. Grafton, Email: stgrafton@ucsb.edu.
DATA AVAILABILITY STATEMENT
The data that support the findings of this study will be openly available in a data repository upon publication of the article.
REFERENCES
- Andersen, K. W. , Lasič, S. , Lundell, H. , Nilsson, M. , Topgaard, D. , Sellebjerg, F. , Szczepankiewicz, F. , Siebner, H. R. , Blinkenberg, M. , & Dyrby, T. B. (2020). Disentangling white‐matter damage from physiological fibre orientation dispersion in multiple sclerosis. Brain Communications, 2(2), fcaa077. 10.1093/braincomms/fcaa077 [DOI] [PMC free article] [PubMed] [Google Scholar]
- Arélin, K. , Mueller, K. , Barth, C. , Rekkas, P. V. , Kratzsch, J. , Burmann, I. , Villringer, A. , & Sacher, J. (2015). Progesterone mediates brain functional connectivity changes during the menstrual cycle—A pilot resting state MRI study. Frontiers in Neuroscience, 9, 44. [DOI] [PMC free article] [PubMed] [Google Scholar]
- Arevalo, M.‐A. , Santos‐Galindo, M. , Bellini, M.‐J. , Azcoitia, I. , & Garcia‐Segura, L. M. (2010). Actions of estrogens on glial cells: Implications for neuroprotection. Biochimica et Biophysica Acta, 1800(10), 1106–1112. 10.1016/j.bbagen.2009.10.002 [DOI] [PubMed] [Google Scholar]
- Avants, B. B. , Tustison, N. J. , Song, G. , Cook, P. A. , Klein, A. , & Gee, J. C. (2011). A reproducible evaluation of ANTs similarity metric performance in brain image registration. NeuroImage, 54(3), 2033–2044. 10.1016/j.neuroimage.2010.09.025 [DOI] [PMC free article] [PubMed] [Google Scholar]
- Babenko, V. (2023). Dynamic allostatic modulation during appraisal, cognitive challenge, and across the menstrual cycle (order no. 30246092). Available from Dissertations & Theses @ University of California; ProQuest Dissertations & Theses A&I; Publicly Available Content Database. (2810870047). https://www.proquest.com/dissertations-theses/dynamic-allostatic-modulation-during-appraisal/docview/2810870047/se-2
- Bäckström, T. , Haage, D. , Löfgren, M. , Johansson, I. M. , Strömberg, J. , Nyberg, S. , Andréen, L. , Ossewaarde, L. , van Wingen, G. A. , Turkmen, S. , & Bengtsson, S. K. (2011). Paradoxical effects of GABA‐A modulators may explain sex steroid induced negative mood symptoms in some persons. Neuroscience, 191, 46–54. 10.1016/j.neuroscience.2011.03.061 [DOI] [PubMed] [Google Scholar]
- Baird, D. T. (1987). A model for follicular selection and ovulation: Lessons from superovulation. Journal of Steroid Biochemistry, 27(1), 15–23. 10.1016/0022-4731(87)90289-5 [DOI] [PubMed] [Google Scholar]
- Baroncini, M. , Jissendi, P. , Catteau‐Jonard, S. , Dewailly, D. , Pruvo, J.‐P. , Francke, J.‐P. , & Prevot, V. (2010). Sex steroid hormones‐related structural plasticity in the human hypothalamus. NeuroImage, 50(2), 428–433. 10.1016/j.neuroimage.2009.11.074 [DOI] [PubMed] [Google Scholar]
- Barth, C. , Steele, C. J. , Mueller, K. , Rekkas, V. P. , Arélin, K. , Pampel, A. , Burmann, I. , Kratzsch, J. , Villringer, A. , & Sacher, J. (2016). In‐vivo dynamics of the human hippocampus across the menstrual cycle. Scientific Reports, 6(1), 32833. 10.1038/srep32833 [DOI] [PMC free article] [PubMed] [Google Scholar]
- Barth, C. , Villringer, A. , & Sacher, J. (2015). Sex hormones affect neurotransmitters and shape the adult female brain during hormonal transition periods. Frontiers in Neuroscience, 9, 37. 10.3389/fnins.2015.00037 [DOI] [PMC free article] [PubMed] [Google Scholar]
- Beltz, A. M. , & Moser, J. S. (2020). Ovarian hormones: A long overlooked but critical contributor to cognitive brain structures and function. Annals of the new York Academy of Sciences, 1464(1), 156–180. 10.1111/nyas.14255 [DOI] [PubMed] [Google Scholar]
- Brann, D. W. , Dhandapani, K. , Wakade, C. , Mahesh, V. B. , & Khan, M. M. (2007). Neurotrophic and neuroprotective actions of estrogen: Basic mechanisms and clinical implications. Steroids, 72(5), 381–405. 10.1016/j.steroids.2007.02.003 [DOI] [PMC free article] [PubMed] [Google Scholar]
- Bui, H. N. , Sluss, P. M. , Blincko, S. , Knol, D. L. , Blankenstein, M. A. , & Heijboer, A. C. (2013). Dynamics of serum testosterone during the menstrual cycle evaluated by daily measurements with an ID‐LC–MS/MS method and a 2nd generation automated immunoassay. Steroids, 78(1), 96–101. 10.1016/j.steroids.2012.10.010 [DOI] [PubMed] [Google Scholar]
- Bullmore, E. , & Sporns, O. (2009). Complex brain networks: Graph theoretical analysis of structural and functional systems. Nature Reviews Neuroscience, 10(3), 186–198. 10.1038/nrn2575 [DOI] [PubMed] [Google Scholar]
- Chavez‐MacGregor, M. , van Gils, C. H. , van der Schouw, Y. T. , Monninkhof, E. , van Noord, P. A. H. , & Peeters, P. H. M. (2008). Lifetime cumulative number of menstrual cycles and serum sex hormone levels in postmenopausal women. Breast Cancer Research and Treatment, 108(1), 101–112. 10.1007/s10549-007-9574-z [DOI] [PMC free article] [PubMed] [Google Scholar]
- Clark, K. A. , Nuechterlein, K. H. , Asarnow, R. F. , Hamilton, L. S. , Phillips, O. R. , Hageman, N. S. , Woods, R. P. , Alger, J. R. , Toga, A. W. , & Narr, K. L. (2011). Mean diffusivity and fractional anisotropy as indicators of disease and genetic liability to schizophrenia. Journal of Psychiatric Research, 45(7), 980–988. 10.1016/j.jpsychires.2011.01.006 [DOI] [PMC free article] [PubMed] [Google Scholar]
- De Bondt, T. , Jacquemyn, Y. , Van Hecke, W. , Sijbers, J. , Sunaert, S. , & Parizel, P. M. (2013). Regional gray matter volume differences and sex‐hormone correlations as a function of menstrual cycle phase and hormonal contraceptives use. Brain Research, 1530, 22–31. 10.1016/j.brainres.2013.07.034 [DOI] [PubMed] [Google Scholar]
- De Bondt, T. , Pullens, P. , Van Hecke, W. , Jacquemyn, Y. , & Parizel, P. M. (2016). Reproducibility of hormone‐driven regional grey matter volume changes in women using SPM8 and SPM12. Brain Structure and Function, 221(9), 4631–4641. 10.1007/s00429-016-1193-1 [DOI] [PubMed] [Google Scholar]
- De Bondt, T. , Van Hecke, W. , Veraart, J. , Leemans, A. , Sijbers, J. , Sunaert, S. , Jacquemyn, Y. , & Parizel, P. M. (2013). Does the use of hormonal contraceptives cause microstructural changes in cerebral white matter? Preliminary results of a DTI and tractography study. European Radiology, 23(1), 57–64. 10.1007/s00330-012-2572-5 [DOI] [PubMed] [Google Scholar]
- Dubol, M. , Epperson, C. N. , Sacher, J. , Pletzer, B. , Derntl, B. , Lanzenberger, R. , Sundström‐Poromaa, I. , & Comasco, E. (2021). Neuroimaging the menstrual cycle: A multimodal systematic review. Frontiers in Neuroendocrinology, 60, 100878. 10.1016/j.yfrne.2020.100878 [DOI] [PubMed] [Google Scholar]
- Franke, K. , Hagemann, G. , Schleussner, E. , & Gaser, C. (2015). Changes of individual BrainAGE during the course of the menstrual cycle. NeuroImage, 115, 1–6. 10.1016/j.neuroimage.2015.04.036 [DOI] [PubMed] [Google Scholar]
- Friedrich, P. , Fraenz, C. , Schlüter, C. , Ocklenburg, S. , Mädler, B. , Güntürkün, O. , & Genç, E. (2020). The relationship between axon density, myelination, and fractional anisotropy in the human corpus callosum. Cerebral Cortex, 30(4), 2042–2056. 10.1093/cercor/bhz221 [DOI] [PubMed] [Google Scholar]
- Frye, C. A. , Sumida, K. , Dudek, B. C. , Harney, J. P. , Lydon, J. P. , O'Malley, B. W. , Pfaff, D. W. , & Rhodes, M. E. (2006). Progesterone's effects to reduce anxiety behavior of aged mice do not require actions via intracellular progestin receptors. Psychopharmacology, 186(3), 312–322. 10.1007/s00213-006-0309-3 [DOI] [PubMed] [Google Scholar]
- Greenwell, S. , Faskowitz, J. , Pritschet, L. , Santander, T. , Jacobs, E. G. , & Betzel, R. F. (2023). High‐amplitude network co‐fluctuations linked to variation in hormone concentrations over the menstrual cycle. Network Neuroscience, 1–40, 1181–1205. 10.1162/netn_a_00307 [DOI] [PMC free article] [PubMed] [Google Scholar]
- Gupte, R. P. , Brooks, W. M. , Vukas, R. R. , Pierce, J. D. , & Harris, J. L. (2019). Sex differences in traumatic brain injury: What we know and what we should know. Journal of Neurotrauma, 36(22), 3063–3091. 10.1089/neu.2018.6171 [DOI] [PMC free article] [PubMed] [Google Scholar]
- Ha, D. M. , Xu, J. , & Janowsky, J. S. (2007). Preliminary evidence that long‐term estrogen use reduces white matter loss in aging. Neurobiology of Aging, 28(12), 1936–1940. 10.1016/j.neurobiolaging.2006.08.007 [DOI] [PMC free article] [PubMed] [Google Scholar]
- Hagemann, G. , Ugur, T. , Schleussner, E. , Mentzel, H.‐J. , Fitzek, C. , Witte, O. W. , & Gaser, C. (2011). Changes in brain size during the menstrual cycle. PLoS One, 6(2), e14655. 10.1371/journal.pone.0014655 [DOI] [PMC free article] [PubMed] [Google Scholar]
- Hamidovic, A. , Soumare, F. , Naveed, A. , Davis, J. , Sun, J. , & Dang, N. (2022). Reduced dehydroepiandrosterone‐sulfate levels in the mid‐luteal subphase of the menstrual cycle: Implications to Women's Health Research. Metabolites, 12(10), 941. 10.3390/metabo12100941 [DOI] [PMC free article] [PubMed] [Google Scholar]
- Handy, A. B. , Greenfield, S. F. , Yonkers, K. A. , & Payne, L. A. (2022). Psychiatric symptoms across the menstrual cycle in adult women: A comprehensive review. Harvard Review of Psychiatry, 30, 100–117. 10.1097/HRP.0000000000000329 [DOI] [PMC free article] [PubMed] [Google Scholar]
- Hao, J. , Rapp, P. R. , Leffler, A. E. , Leffler, S. R. , Janssen, W. G. M. , Lou, W. , McKay, H. , Roberts, J. A. , Wearne, S. L. , Hof, P. R. , & Morrison, J. H. (2006). Estrogen alters spine number and morphology in prefrontal cortex of aged female rhesus monkeys. The Journal of Neuroscience, 26(9), 2571–2578. 10.1523/JNEUROSCI.3440-05.2006 [DOI] [PMC free article] [PubMed] [Google Scholar]
- Haraguchi, S. , Sasahara, K. , Shikimi, H. , Honda, S. , Harada, N. , & Tsutsui, K. (2012). Estradiol promotes Purkinje dendritic growth, Spinogenesis, and synaptogenesis during neonatal life by inducing the expression of BDNF. The Cerebellum, 11(2), 416–417. 10.1007/s12311-011-0342-6 [DOI] [PubMed] [Google Scholar]
- He, R.‐H. , Sheng, J.‐Z. , Luo, Q. , Jin, F. , Wang, B. , Qian, Y.‐L. , Zhou, C.‐Y. , Sheng, X. , & Huang, H.‐F. (2006). Aquaporin‐2 expression in human endometrium correlates with serum ovarian steroid hormones. Life Sciences, 79(5), 423–429. 10.1016/j.lfs.2006.01.020 [DOI] [PubMed] [Google Scholar]
- He, Y. , Chen, Z. J. , & Evans, A. C. (2007). Small‐world anatomical networks in the human brain revealed by cortical thickness from MRI. Cerebral Cortex, 17(10), 2407–2419. 10.1093/cercor/bhl149 [DOI] [PubMed] [Google Scholar]
- Herting, M. M. , Gautam, P. , Spielberg, J. M. , Kan, E. , Dahl, R. E. , & Sowell, E. R. (2014). The role of testosterone and estradiol in brain volume changes across adolescence: A longitudinal structural MRI study. Human Brain Mapping, 35(11), 5633–5645. 10.1002/hbm.22575 [DOI] [PMC free article] [PubMed] [Google Scholar]
- Herting, M. M. , Maxwell, E. C. , Irvine, C. , & Nagel, B. J. (2012). The impact of sex, puberty, and hormones on white matter microstructure in adolescents. Cerebral Cortex, 22(9), 1979–1992. 10.1093/cercor/bhr246 [DOI] [PMC free article] [PubMed] [Google Scholar]
- Hoekzema, E. , Barba‐Müller, E. , Pozzobon, C. , Picado, M. , Lucco, F. , García‐García, D. , Soliva, J. C. , Tobeña, A. , Desco, M. , Crone, E. A. , Ballesteros, A. , Carmona, S. , & Vilarroya, O. (2017). Pregnancy leads to long‐lasting changes in human brain structure. Nature Neuroscience, 20(2), 287–296. 10.1038/nn.4458 [DOI] [PubMed] [Google Scholar]
- Hutton, C. , Draganski, B. , Ashburner, J. , & Weiskopf, N. (2009). A comparison between voxel‐based cortical thickness and voxel‐based morphometry in normal aging. NeuroImage, 48(2), 371–380. 10.1016/j.neuroimage.2009.06.043 [DOI] [PMC free article] [PubMed] [Google Scholar]
- Iadecola, C. , & Nedergaard, M. (2007). Glial regulation of the cerebral microvasculature. Nature Neuroscience, 10(11), 1369–1376. 10.1038/nn2003 [DOI] [PubMed] [Google Scholar]
- Ikenouchi, Y. , Kamagata, K. , Andica, C. , Hatano, T. , Ogawa, T. , Takeshige‐Amano, H. , Kamiya, K. , Wada, A. , Suzuki, M. , Fujita, S. , Hagiwara, A. , Irie, R. , Hori, M. , Oyama, G. , Shimo, Y. , Umemura, A. , Hattori, N. , & Aoki, S. (2020). Evaluation of white matter microstructure in patients with Parkinson's disease using microscopic fractional anisotropy. Neuroradiology, 62(2), 197–203. 10.1007/s00234-019-02301-1 [DOI] [PubMed] [Google Scholar]
- Klein, A. , & Tourville, J. (2012). 101 labeled brain images and a consistent human cortical labeling protocol. Frontiers in Neuroscience, 6, 171. 10.3389/fnins.2012.00171 [DOI] [PMC free article] [PubMed] [Google Scholar]
- Kranz, G. S. , Seiger, R. , Kaufmann, U. , Hummer, A. , Hahn, A. , Ganger, S. , Tik, M. , Windischberger, C. , Kasper, S. , & Lanzenberger, R. (2017). Effects of sex hormone treatment on white matter microstructure in individuals with gender dysphoria. NeuroImage, 150, 60–67. 10.1016/j.neuroimage.2017.02.027 [DOI] [PubMed] [Google Scholar]
- Kumar, R. , Carroll, C. , Hartikainen, A. , & Martin, O. (2019). ArviZ a unified library for exploratory analysis of Bayesian models in python. Journal of Open Source Software, 4(33), 1143. 10.21105/joss.01143 [DOI] [Google Scholar]
- Lampinen, B. , Szczepankiewicz, F. , Novén, M. , Westen, D. , Hansson, O. , Englund, E. , Mårtensson, J. , Westin, C. , & Nilsson, M. (2019). Searching for the neurite density with diffusion MRI: Challenges for biophysical modeling. Human Brain Mapping, 40(8), 2529–2545. 10.1002/hbm.24542 [DOI] [PMC free article] [PubMed] [Google Scholar]
- Lasič, S. , Szczepankiewicz, F. , Eriksson, S. , Nilsson, M. , & Topgaard, D. (2014). Microanisotropy imaging: Quantification of microscopic diffusion anisotropy and orientational order parameter by diffusion MRI with magic‐angle spinning of the q‐vector. Frontiers in Physics, 2, 11. 10.3389/fphy.2014.00011 [DOI] [Google Scholar]
- Le Bihan, D. , Mangin, J. F. , Poupon, C. , Clark, C. A. , Pappata, S. , Molko, N. , & Chabriat, H. (2001). Diffusion tensor imaging: Concepts and applications. Journal of Magnetic Resonance Imaging, 13(4), 534–546. 10.1002/jmri.1076 [DOI] [PubMed] [Google Scholar]
- Le, J. , Thomas, N. , & Gurvich, C. (2020). Cognition, the menstrual cycle, and premenstrual disorders: A review. Brain Sciences, 10(4), 198. 10.3390/brainsci10040198 [DOI] [PMC free article] [PubMed] [Google Scholar]
- Lisofsky, N. , Mårtensson, J. , Eckert, A. , Lindenberger, U. , Gallinat, J. , & Kühn, S. (2015). Hippocampal volume and functional connectivity changes during the female menstrual cycle. NeuroImage, 118, 154–162. 10.1016/j.neuroimage.2015.06.012 [DOI] [PubMed] [Google Scholar]
- Lisofsky, N. , Riediger, M. , Gallinat, J. , Lindenberger, U. , & Kühn, S. (2016). Hormonal contraceptive use is associated with neural and affective changes in healthy young women. NeuroImage, 134, 597–606. 10.1016/j.neuroimage.2016.04.042 [DOI] [PubMed] [Google Scholar]
- Makowski, D. , Ben‐Shachar, M. S. , Chen, S. H. A. , & Lüdecke, D. (2019). Indices of effect existence and significance in the Bayesian framework. Frontiers in Psychology, 10, 2767. 10.3389/fpsyg.2019.02767 [DOI] [PMC free article] [PubMed] [Google Scholar]
- Martin, J. , Endt, S. , Wetscherek, A. , Kuder, T. A. , Doerfler, A. , Uder, M. , Hensel, B. , & Laun, F. B. (2020). Contrast‐to‐noise ratio analysis of microscopic diffusion anisotropy indices in q‐space trajectory imaging. Zeitschrift Fur Medizinische Physik, 30(1), 4–16. 10.1016/j.zemedi.2019.01.003 [DOI] [PubMed] [Google Scholar]
- Meeker, T. J. , Veldhuijzen, D. S. , Keaser, M. L. , Gullapalli, R. P. , & Greenspan, J. D. (2020). Menstrual cycle variations in gray matter volume, white matter volume and functional connectivity: Critical impact on parietal lobe. Frontiers in Neuroscience, 14, 594588. [DOI] [PMC free article] [PubMed] [Google Scholar]
- Nilsson, M. , Szczepankiewicz, F. , Lampinen, B. , Ahlgren, A. , de Almeida Martins, J. P. , Lasič, S. , Carl‐Fredrik, W. , & Topgaard, D. (2018). An open‐source framework for analysis of multidimensional diffusion MRI data implemented in MATLAB. Proceedings of the International Society for Magnetic Resonance in Medicine, 26, 5355. http://archive.ismrm.org/2018/5355.html [Google Scholar]
- Ossewaarde, L. , van Wingen, G. A. , Rijpkema, M. , Bäckström, T. , Hermans, E. J. , & Fernández, G. (2013). Menstrual cycle‐related changes in amygdala morphology are associated with changes in stress sensitivity. Human Brain Mapping, 34(5), 1187–1193. 10.1002/hbm.21502 [DOI] [PMC free article] [PubMed] [Google Scholar]
- Otomo, M. , Harada, M. , Abe, T. , Matsumoto, Y. , Abe, Y. , Kanazawa, Y. , Miyoshi, M. , Kabasawa, H. , & Takahashi, Y. (2020). Reproducibility and variability of quantitative cerebral blood flow measured by multi‐delay 3D arterial spin labeling according to sex and menstrual cycle. The Journal of Medical Investigation, 67(3.4), 321–327. 10.2152/jmi.67.321 [DOI] [PubMed] [Google Scholar]
- Paternina‐Die, M. , Martínez‐García, M. , Martín de Blas, D. , Noguero, I. , Servin‐Barthet, C. , Pretus, C. , Soler, A. , López‐Montoya, G. , Desco, M. , & Carmona, S. (2024). Women's neuroplasticity during gestation, childbirth and postpartum. Nature Neuroscience, 27(2), 317–327. 10.1038/s41593-023-01513-2 [DOI] [PMC free article] [PubMed] [Google Scholar]
- Petersen, N. , Touroutoglou, A. , Andreano, J. M. , & Cahill, L. (2015). Oral contraceptive pill use is associated with localized decreases in cortical thickness. Human Brain Mapping, 36(7), 2644–2654. 10.1002/hbm.22797 [DOI] [PMC free article] [PubMed] [Google Scholar]
- Pettigrew, C. , Soldan, A. , Zhu, Y. , Wang, M.‐C. , Moghekar, A. , Brown, T. , Miller, M. , & Albert, M. (2016). Cortical thickness in relation to clinical symptom onset in preclinical AD. NeuroImage: Clinical, 12, 116–122. 10.1016/j.nicl.2016.06.010 [DOI] [PMC free article] [PubMed] [Google Scholar]
- Pletzer, B. , Harris, T. , & Hidalgo‐Lopez, E. (2018). Subcortical structural changes along the menstrual cycle: Beyond the hippocampus. Scientific Reports, 8(1), 16042. 10.1038/s41598-018-34247-4 [DOI] [PMC free article] [PubMed] [Google Scholar]
- Pletzer, B. , Harris, T.‐A. , Scheuringer, A. , & Hidalgo‐Lopez, E. (2019). The cycling brain: Menstrual cycle related fluctuations in hippocampal and fronto‐striatal activation and connectivity during cognitive tasks. Neuropsychopharmacology, 44(11), 1867–1875. 10.1038/s41386-019-0435-3 [DOI] [PMC free article] [PubMed] [Google Scholar]
- Pletzer, B. , Kronbichler, M. , Aichhorn, M. , Bergmann, J. , Ladurner, G. , & Kerschbaum, H. H. (2010). Menstrual cycle and hormonal contraceptive use modulate human brain structure. Brain Research, 1348, 55–62. 10.1016/j.brainres.2010.06.019 [DOI] [PubMed] [Google Scholar]
- Prange, M. T. , & Margulies, S. S. (2002). Regional, directional, and age‐dependent properties of the brain undergoing large deformation. Journal of Biomechanical Engineering, 124(2), 244–252. 10.1115/1.1449907 [DOI] [PubMed] [Google Scholar]
- Pritschet, L. , Santander, T. , Taylor, C. M. , Layher, E. , Yu, S. , Miller, M. B. , Grafton, S. T. , & Jacobs, E. G. (2020). Functional reorganization of brain networks across the human menstrual cycle. NeuroImage, 220, 117091. 10.1016/j.neuroimage.2020.117091 [DOI] [PubMed] [Google Scholar]
- Protopopescu, X. , Butler, T. , Pan, H. , Root, J. , Altemus, M. , Polanecsky, M. , McEwen, B. , Silbersweig, D. , & Stern, E. (2008). Hippocampal structural changes across the menstrual cycle. Hippocampus, 18(10), 985–988. 10.1002/hipo.20468 [DOI] [PubMed] [Google Scholar]
- Şafak, K. Y. (2019). Variability of apparent diffusion coefficient in the brain in women during follicular and luteal phases of the menstrual cycle. The Neuroradiology Journal, 32(2), 127–131. 10.1177/1971400918819088 [DOI] [PMC free article] [PubMed] [Google Scholar]
- Salvatier, J. , Wiecki, T. V. , & Fonnesbeck, C. (2016). Probabilistic programming in python using PyMC3. PeerJ Computer Science, 2, e55. 10.7717/peerj-cs.55 [DOI] [PMC free article] [PubMed] [Google Scholar]
- Schumacher, M. , Hussain, R. , Gago, N. , Oudinet, J.‐P. , Mattern, C. , & Ghoumari, A. (2012). Progesterone synthesis in the nervous system: Implications for myelination and myelin repair. Frontiers in Neuroscience, 6, 10. [DOI] [PMC free article] [PubMed] [Google Scholar]
- Shin, J. A. , Choi, J. H. , Choi, Y.‐H. , & Park, E.‐M. (2011). Conserved aquaporin 4 levels associated with reduction of brain edema are mediated by estrogen in the ischemic brain after experimental stroke. Biochimica et Biophysica Acta (BBA) – Molecular Basis of Disease, 1812(9), 1154–1163. 10.1016/j.bbadis.2011.05.004 [DOI] [PubMed] [Google Scholar]
- Soltani, Z. , Khaksari, M. , Shahrokhi, N. , Mohammadi, G. , Mofid, B. , Vaziri, A. , & Amiresmaili, S. (2016). Effect of estrogen and/or progesterone administration on traumatic brain injury‐caused brain edema: The changes of aquaporin‐4 and interleukin‐6. Journal of Physiology and Biochemistry, 72(1), 33–44. 10.1007/s13105-015-0453-5 [DOI] [PubMed] [Google Scholar]
- Stricker, R. , Eberhart, R. , Chevailler, M.‐C. , Quinn, F. A. , Bischof, P. , & Stricker, R. (2006). Establishment of detailed reference values for luteinizing hormone, follicle stimulating hormone, estradiol, and progesterone during different phases of the menstrual cycle on the Abbott ARCHITECT® analyzer. Clinical Chemistry and Laboratory Medicine, 44(7), 883–887. 10.1515/CCLM.2006.160 [DOI] [PubMed] [Google Scholar]
- Sun, X.‐L. , Ding, J.‐H. , Fan, Y. , Zhang, J. , Gao, L. , & Hu, G. (2007). Aquaporin 4 regulates the effects of ovarian hormones on monoamine neurotransmission. Biochemical and Biophysical Research Communications, 353(2), 457–462. 10.1016/j.bbrc.2006.12.040 [DOI] [PubMed] [Google Scholar]
- Syan, S. K. , Minuzzi, L. , Costescu, D. , Smith, M. , Allega, O. R. , Coote, M. , Hall, G. B. C. , & Frey, B. N. (2017). Influence of endogenous estradiol, progesterone, allopregnanolone, and dehydroepiandrosterone sulfate on brain resting state functional connectivity across the menstrual cycle. Fertility and Sterility, 107(5), 1246–1255.e4. 10.1016/j.fertnstert.2017.03.021 [DOI] [PubMed] [Google Scholar]
- Tang, Y. , Janssen, W. G. M. , Hao, J. , Roberts, J. A. , McKay, H. , Lasley, B. , Allen, P. B. , Greengard, P. , Rapp, P. R. , Kordower, J. H. , Hof, P. R. , & Morrison, J. H. (2004). Estrogen replacement increases Spinophilin‐immunoreactive spine number in the prefrontal cortex of female rhesus monkeys. Cerebral Cortex, 14(2), 215–223. 10.1093/cercor/bhg121 [DOI] [PubMed] [Google Scholar]
- Taylor, C. M. , Pritschet, L. , & Jacobs, E. G. (2021). The scientific body of knowledge – Whose body does it serve? A spotlight on oral contraceptives and women's health factors in neuroimaging. Frontiers in Neuroendocrinology, 60, 100874. 10.1016/j.yfrne.2020.100874 [DOI] [PMC free article] [PubMed] [Google Scholar]
- Taylor, C. M. , Pritschet, L. , Olsen, R. K. , Layher, E. , Santander, T. , Grafton, S. T. , & Jacobs, E. G. (2020). Progesterone shapes medial temporal lobe volume across the human menstrual cycle. NeuroImage, 220, 117125. 10.1016/j.neuroimage.2020.117125 [DOI] [PubMed] [Google Scholar]
- Topgaard, D. (2017). Multidimensional diffusion MRI. Journal of Magnetic Resonance, 275, 98–113. 10.1016/j.jmr.2016.12.007 [DOI] [PubMed] [Google Scholar]
- Topgaard, D. (2019). Diffusion tensor distribution imaging. NMR in Biomedicine, 32(5), 1–12. 10.1002/nbm.4066 [DOI] [PMC free article] [PubMed] [Google Scholar]
- Tustison, N. J. , Cook, P. A. , Klein, A. , Song, G. , Das, S. R. , Duda, J. T. , Kandel, B. M. , van Strien, N. , Stone, J. R. , Gee, J. C. , & Avants, B. B. (2014). Large‐scale evaluation of ANTs and FreeSurfer cortical thickness measurements. NeuroImage, 99, 166–179. 10.1016/j.neuroimage.2014.05.044 [DOI] [PubMed] [Google Scholar]
- Volz, L. J. , Cieslak, M. , & Grafton, S. T. (2018). A probabilistic atlas of fiber crossings for variability reduction of anisotropy measures. Brain Structure and Function, 223(2), 635–651. 10.1007/s00429-017-1508-x [DOI] [PubMed] [Google Scholar]
- Vos, S. B. , Jones, D. K. , Jeurissen, B. , Viergever, M. A. , & Leemans, A. (2012). The influence of complex white matter architecture on the mean diffusivity in diffusion tensor MRI of the human brain. NeuroImage, 59(3), 2208–2216. 10.1016/j.neuroimage.2011.09.086 [DOI] [PMC free article] [PubMed] [Google Scholar]
- Wang, H. , Suh, J. W. , Das, S. R. , Pluta, J. B. , Craige, C. , & Yushkevich, P. A. (2013). Multi‐atlas segmentation with joint label fusion. IEEE Transactions on Pattern Analysis and Machine Intelligence, 35(3), 611–623. 10.1109/TPAMI.2012.143 [DOI] [PMC free article] [PubMed] [Google Scholar]
- Wardlaw, J. M. , Benveniste, H. , Nedergaard, M. , Zlokovic, B. V. , Mestre, H. , Lee, H. , Doubal, F. N. , Brown, R. , Ramirez, J. , MacIntosh, B. J. , Tannenbaum, A. , Ballerini, L. , Rungta, R. L. , Boido, D. , Sweeney, M. , Montagne, A. , Charpak, S. , Joutel, A. , Smith, K. J. , … colleagues from the Fondation Leducq Transatlantic Network of Excellence on the Role of the Perivascular Space in Cerebral Small Vessel Disease . (2020). Perivascular spaces in the brain: Anatomy, physiology and pathology. Nature Reviews Neurology, 16(3), 137–153. 10.1038/s41582-020-0312-z [DOI] [PubMed] [Google Scholar]
- Westin, C. F. , Knutsson, H. , Pasternak, O. , Szczepankiewicz, F. , Özarslan, E. , van Westen, D. , Mattisson, C. , Bogren, M. , O'Donnell, L. J. , Kubicki, M. , Topgaard, D. , & Nilsson, M. (2016). Q‐space trajectory imaging for multidimensional diffusion MRI of the human brain. NeuroImage, 135, 345–362. 10.1016/j.neuroimage.2016.02.039 [DOI] [PMC free article] [PubMed] [Google Scholar]
- Whitwell, J. L. (2009). Voxel‐based morphometry: An automated technique for assessing structural changes in the brain. Journal of Neuroscience, 29(31), 9661–9664. 10.1523/JNEUROSCI.2160-09.2009 [DOI] [PMC free article] [PubMed] [Google Scholar]
- Woolley, C. S. , & McEwen, B. S. (1993). Roles of estradiol and progesterone in regulation of hippocampal dendritic spine density during the estrous cycle in the rat. Journal of Comparative Neurology, 336(2), 293–306. 10.1002/cne.903360210 [DOI] [PubMed] [Google Scholar]
- Yeh, F. C. (2022). Population‐based tract‐to‐region connectome of the human brain and its hierarchical topology. Nature Communications, 13(1), 4933. 10.1038/s41467-022-32595-4 [DOI] [PMC free article] [PubMed] [Google Scholar]
- Young, M. E. , Ohm, D. T. , Janssen, W. G. M. , Gee, N. A. , Lasley, B. L. , & Morrison, J. H. (2013). Continuously delivered ovarian steroids do not alter dendritic spine density or morphology in macaque dorsolateral prefrontal cortical neurons. Neuroscience, 255, 219–225. 10.1016/j.neuroscience.2013.09.062 [DOI] [PMC free article] [PubMed] [Google Scholar]
- Zsido, R. G. , Williams, A. N. , Barth, C. , Serio, B. , Kurth, L. , Mildner, T. , Trampel, R. , Beyer, F. , Witte, A. V. , Villringer, A. , & Sacher, J. (2023). Ultra‐high‐field 7T MRI reveals changes in human medial temporal lobe volume in female adults during menstrual cycle. Nature Mental Health, 1(10), 761–771. 10.1038/s44220-023-00125-w [DOI] [Google Scholar]
Associated Data
This section collects any data citations, data availability statements, or supplementary materials included in this article.
Supplementary Materials
Data S1: Supporting information.
Data Availability Statement
The data that support the findings of this study will be openly available in a data repository upon publication of the article.