

Summary
Adzuki bean (Vigna angularis) is an important legume crop cultivated in over 30 countries worldwide. We developed a high‐quality chromosome‐level reference genome of adzuki bean cultivar Jingnong6 by combining PacBio Sequel long‐read sequencing with short‐read and Hi‐C technologies. The assembled genome covers 97.8% of the adzuki bean genome with a contig N50 of approximately 16 Mb and a total of 32 738 protein‐coding genes. We also generated a comprehensive genome variation map of adzuki bean by whole‐genome resequencing (WGRS) of 322 diverse adzuki beans accessions including both wild and cultivated. Furthermore, we have conducted comparative genomics and a genome‐wide association study (GWAS) on key agricultural traits to investigate the evolution and domestication. GWAS identified several candidate genes, including VaCycA3;1, VaHB15, VaANR1 and VaBm, that exhibited significant associations with domestication traits. Furthermore, we conducted functional analyses on the roles of VaANR1 and VaBm in regulating seed coat colour. We provided evidence for the highest genetic diversity of wild adzuki (Vigna angularis var. nipponensis) in China with the presence of the most original wild adzuki bean, and the occurrence of domestication process facilitating transition from wild to cultigen. The present study elucidates the genetic basis of adzuki bean domestication traits and provides crucial genomic resources to support future breeding efforts in adzuki bean.
Keywords: Adzuki bean, domestication, GWAS, agronomic traits, seed coat colour
Introduction
Adzuki bean (Vigna angularis var. angularis) is cultivated in more than thirty countries including China, Japan, Korea, Philippines, India, Poland, New Zealand, Canada, Kenya and Zaire (Manickavasagan and Thirunathan, 2020; Soltani et al., 2019), making it a globally important legume crop. Adzuki bean seeds are rich in high‐quality protein (Ge et al., 2021), starch, mineral elements (such as iron, zinc, calcium and magnesium), vitamins (such as tocopherol and folate) (USDA, 2019) and dietary fibres (Lin et al., 2002). Due to their diverse bioactivities and secondary metabolites (Gohara et al., 2016; Lee et al., 2017) such as azukisaponins (Kitagawa et al., 1983; Liu et al., 2017), phenolic acids, flavonoids and proanthocyanidins (Cheng et al., 2020; Chu et al., 2021b), adzuki beans possess medicinal value in traditional Chinese medicine. They are recognized for their diuretic properties and ability to alleviate dropsy and beriberi (Chinese Pharmacopoeia Commission, 2010). Additionally, they exhibit hypoglycemic effects (Itoh et al., 2004) and demonstrate anti‐cancer activity (Gohara et al., 2016; Kawakami et al., 2018). Overall, due to its short growth period and small genome, adzuki bean can serve as one of the model species for understanding legume biology (Yang et al., 2015).
The cultivated adzuki bean is considered to have been domesticated from wild adzuki bean, Vigna angularis var. nipponensis (Yamaguchi, 1992). Adzuki bean was thought originated from China (Vavilov, 1926) with the earliest evidence of domestication dating back to 12 000 years ago in this region (Liu et al., 2013).
Adzuki bean was identified as a kind of plant food in the Kuahuqiao site of Zhejiang in China 7000 years ago (Yang and Jiang, 2010), but it was suggested that adzuki bean was domesticated from four progenitors with multiple geographical origins by morphological evidence (Lee, 2013) or Japan origin (Tomooka et al., 2002). The commercial varieties of adzuki bean are predominantly selected from elite landraces, resulting in limited genetic diversity within the cultivated population. The lack of modern genomic tools and limited utilization of existing genomic information have posed significant constraints on adzuki been breeding.
Whole genome re‐sequencing (WGRS) has been widely used for identification of genome‐wide genetic markers and in genetic diversity studies, as well as to elucidate domestication and breeding history in several crops including rice (Wang et al., 2018), maize (Navarro et al., 2017), chickpea (Varshney et al., 2019, 2021), pigeonpea (Varshney et al., 2017a), pearl millet (Varshney et al., 2017b), foxtail millet (Jia et al., 2013), tomato (Lin et al., 2014) and cotton (Fang et al., 2017). WGRS and GWAS have unravelled the genetic components that significantly contribute to the observed variations in agronomic traits in legume crops, including soybean (Zhou et al., 2015), pigeonpea (Varshney et al., 2017a), chickpea (Varshney et al., 2019) and common bean (Wu et al., 2020). However, it is imperative to identify genome variations in a broader germplasm collection and establish their associations with important phenotypes for targeted breeding and improvement of adzuki bean.
Previous versions of adzuki bean draft genomes (Kang et al., 2015; Sakai et al., 2015; Yang et al., 2015) were limited by fragmented data and a lack of chromosome‐level resolution. We hereby present a chromosome‐scale high quality reference genome assembly of adzuki bean by combining Illumina short reads, PacBio long reads and Hi‐C analyses. In addition, we generated WGRS data on a total of 322 accessions, including both wild and cultivated varieties, in order to identify the population structure, domestication events and evolution of adzuki bean.
GWAS of fourteen traits identified the key genes associated with red seed coat formation and other agronomic traits that are shaped by domestication and selection. Furthermore, we successfully validated the function of these genes and developed molecular markers to inform breeding strategies to accelerate development of modern cultivars of adzuki bean.
Results
De novo sequencing and genome assembly
We previously sequenced and assembled a reference genome of the adzuki bean Chinese cultivar “Jingnong6” (Yang et al., 2015). However, the genome with contig N50 of 38.36 kb and 25 426 contigs was highly fragmented due to solely based on Illumina short reads sequencing technology (Kang et al., 2015). In this study, three sequencing approaches were employed to generate a high‐quality genome assembly of adzuki bean (Figure 1), including 257 × PacBio Sequel technology (116.06 Gb with N50 and maximum read length of 19 171 bp and 238 473 bp, respectively), DNBseq short reads (65.53 Gb), and Hi‐C data (120.4 Gb).
Figure 1.
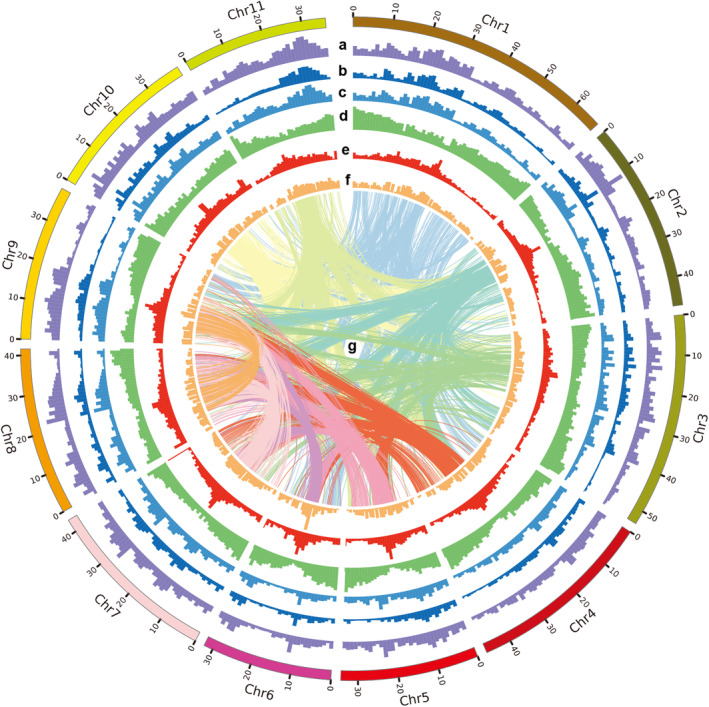
Genome assembly of Jingnong6. The features of Vigna Angularis highlighted from outermost to innermost circle are (a) SNP density for all samples; (b) SNP density for cultivate group; (c) SNP density for wild group; (d) gene density; (e) GC content; (f) repeats density; and (g) intra‐genome collinear blocks connected by curved lines. All statistics are computed for windows of 1 Mb.
The initial assembly was performed using the cleaned PacBio reads, followed by polishing with short reads to obtain high‐quality sequences. Then, the assembled contig genome size has a size of 489 771 011 bp and is composed of 328 contigs. The contig N50 was 16 063 027 bp, while the maximum contig length was 31 458 188 bp (Table 1). The High‐throughput chromatin conformation capture (Hi‐C) technology, which generated a total of 120.4 Gb data, was employed to construct a chromosome‐level genome with 97.8% (479.1 Mb) mapped onto 11 chromosomes using the 3D‐DNA software, achieving a scaffold N50 of 41.6 Mb (Figure S1). This updated genome assembly significantly improved the contiguity metrics by 421‐fold (by contig N50) compared with the previously published genome assembly (Kang et al., 2015). The current assembly also significantly reduced the genome ambiguity by reducing the total number of contigs from 25 426 to 328. The high‐quality of the genome assembly was evident based on completeness assessment using Benchmarking Universal Single‐Copy Orthologs (BUSCO) that indicated a score of 98.8% (Table S1).
Table 1.
Comparison of the salient features of four adzuki bean genome assemblies
| Shumari (Sakai et al., 2015) | Gyeongwon (Kang et al., 2015) | Jingnong6 (Yang et al., 2015) | Jingnong6 (This study) | |
|---|---|---|---|---|
| No. of chromosomes | 11 | 11 | 11 | 11 |
| Sequencer | PacBio | Illumina HiSeq | Illumina HiSeq (shotgun) | PacBio and Hi‐C |
| Sequencing Depth | 51× | 160× | 168× | 237× and 245× |
| Assembly size (Scaffold, bp) | 522 761 097 | 444 438 822 | 467 300 602 | 489 771 011 |
| Assembly size (Chromosome, bp) | 471 245 712 | 227 273 901 | 372 736 198 | 479 088 429 |
| Percentage of anchored Scaffold | 90.14% | 51.13% | 79.90% | 97.80% |
| Contig N50 (bp) | 809 255 | 26 637 | 38 390 | 16 063 027 |
| Scaffold N50 (bp) | 2 952 390 | 8 174 047 | 1 292 063 | 41 615 786 |
| Number of annotated genes | 30 570 | 26 857 | 34 183 | 32 748 |
Repeat and gene annotation
Combining de novo and homology‐based approaches, a total of 286 431 291 bp representing 59.79% of the genome was annotated to be repetitive sequences, which is higher than reported in Medicago (57%) (Shen et al., 2020), Lotus (34.28%) (Sato et al., 2008), common bean (45.42%) (Schmutz et al., 2014), mung bean (52.83%) (Yan et al., 2020), pigeonpea (51.67%) (Varshney et al., 2012), chickpea (49.41%) (Varshney et al., 2013) and even soybean (52.75%) (Shen et al., 2018). The genome annotation revealed that retrotransposons accounted for 39.95% of the total genome size, with a total length of 191 417 307 bp. This included long terminal repeats (LTR)‐retrotransposons (39.05%) and non‐LTR‐retrotransposons (0.91%). In contrast, DNA transposons constituted only 11.61% of the genome. (Figure 1; Table S2). A combination of de novo prediction and homology‐based search on RNA‐seq data from 12 tissue samples predicted a total of 52 643 transcripts and identified 32 738 high‐confidence protein‐coding genes in the adzuki bean genome. The median lengths of the predicted transcripts and coding sequences were 1512 bp and 1074 bp, respectively (Table S3). Of the 52 643 predicted transcripts, 85.3% (44903) coding sequences had integrity with both start codon and stop codon (Table S4). BUSCO showed that the completeness of the protein is 92.3% (Table S5), and 99.93% of the predicted protein‐coding genes were functionally annotated.
Comparative genomics analysis
To understand the evolution of gene families and obtain a comprehensive phylogenetic analysis, we identified unique and shared gene families among adzuki bean and eleven other species: Arachis ipaensis, white lupin (Lupinus albus), pea (Pisum sativum), Medicago truncatula, chickpea (Cicer arietinum), lotus (Lotus japonicus), pigeonpea (Cajanus cajan), common bean (Phaseolus vulgaris), cowpea (Vigna unguiculata), mung bean (Vigna radiata) and grape (Vitis vinifera). A total of 31 332 genes (95.7%) were clustered into 16 641 gene families, of which 15 795 were shared by all 12 species whereas 846 orthogroups containing 5147 genes were specific to adzuki bean (Table S6).
The clustering of adzuki bean and mung bean within the same branch of the phylogenetic tree based on 605 single‐copy gene families and incorporating divergence time, provided further evidence in support of the divergence within the Vigna genus.
The divergence of the Vigna genus from Phaseolus is estimated to have occurred approximately 22.1 million years ago (MYA). Adzuki bean diverged from mung bean around 6.4 MYA, preceding its divergence from cowpea which took place between 7 and 39 MYA.
We compared 1338 contracted and 591 expanded orthogroups in adzuki bean with the other genomes (Figure 2a; Figure S2; Table S7). The expanded gene families were mainly involved in ascorbate and aldarate metabolism, glutathione metabolism and pathogen interaction. Through orthologue search and comparisons between adzuki bean, cowpea, and mung bean genomes, synteny and collinearity were observed at chromosome level for all chromosomes except chromosomes 3 and 5. Our study suggests occurrence of a break and fusion in the chromosomes 3 and 5 of adzuki bean (Figure 2b; Figure S3).
Figure 2.

Comparative genomics analysis of Vigna Angularis, Vigna radiata and Vigna unguiculata. (a) Phylogenetic tree of gene families' expansion/contraction; (b) Genome collinearity analysis between Vigna Angularis (adzuki bean), Vigna radiata (mung bean) and Vigna unguiculata (cowpea).
Population analysis and domestication history of adzuki bean
We resequenced the genomes of 322 adzuki bean accessions, including 67 wild, 39 semi‐wild, 160 landraces and 56 improved varieties (Yamaguchi and Nikuma, 1996), with an average of 8.92‐fold genome coverage (Figure 3a; Figures S4 and S5; Table S8). The morphological characteristics of semi‐wild adzuki bean (weedy) are between cultivated and wild adzuki beans (Mimura et al., 2000). Landraces and improved varieties are cultigens. A total of 1.36 Tb clean data (average 4.21 Gb per individual) was generated, with an average coverage of 95.24% of the reference genome (Table S9). A total of 1 352 825 single‐nucleotide polymorphisms (SNPs) was identified, with 106 034 located within protein‐coding genes. Additionally, 73 694 SNPs were detected in upstream or downstream regions, while the remaining SNPs belonged to intergenic regions (Figure 1; Table S10).
Figure 3.

Population structure of 322 accessions of wild and cultivated adzuki beans. (a) Geographic distribution of the 322 accessions; (b) principal component analysis (PCA) plot1; (c) principal component analysis (PCA) plot2; (d) linkage disequilibrium of “original wild”, “progenitor wild” and cultigen adzuki bean; (e) phylogenetic tree and population structure. “Wild” and “semi‐wild” are represented by the red colour. The cultigen group (cultigen 1–4) consists of “landrace” and “improved varieties”, denoted by green and blue colours, respectively. [Correction added on 28 March 2024, after first online publication: Figure 3 is updated in this version.]
We examined evolutionary relationships among 322 accessions through principal component analysis (PCA), phylogenetic‐tree construction, and population‐structure analysis. Our analysis clearly distinguished the wild adzuki bean accessions from the semi‐wild and cultigen varieties except a few wild accessions that clustered with semi‐wilds (Figure 3b). The genetic profiles of the adzuki bean accessions suggested six distinct groups that corresponded to the original wild, progenitor wild, and cultigen (with four subgroups) groups, comprising 32, 73 and 217 samples, respectively. The phylogenetic tree of the 322 accessions using the neighbour‐joining method separated the wild adzuki bean accessions into two distinct groups: the “original wild group” had 32 accessions which are exclusively found in mountainous regions ranging from N26° to N38° and E102° to E119° within China, whereas the other 35 wild accessions from China (N27°–N41° and E116°–E124°), Nepal, Korea and Japan clustered with 38 semi‐wild accessions forming another distinct group referred to as the “progenitor wild” group. Ancestry estimation from the ADMIXTURE software suggested that the cross validation (CV) error reaches its minimum value at K = 2. The optimal fit is achieved at K = 2, indicating a greater dissimilarity between the “original wild” population and other types of accessions (Figure 3e). But K = 5 was deemed the best fit to explain the population classification based on phenotypic traits.
The cultivated adzuki beans were clustered into four distinct subgroups: “Cultigens 1–4”. The “Cultigen 1” had one semi‐wild accession and 44 landraces exclusively sourced from China. The “Cultigen 2” subgroup consisted of 101 accessions, including one semi‐wild, 77 landraces (with 4 accessions exhibiting morphology similar to the semi‐wild type) and 24 commercial varieties sourced from China, Japan, Korea and Bhutan. The third subgroup named “Cultigen 3” had 27 landraces and 28 improved commercial varieties sourced from China, Korea and Japan. The “Cultigen 4” subgroup consisted of 12 landraces and 4 improved accessions from China, Japan and Korea. The average genetic diversity (Pi) value of “original wild”, “progenitor wild” and cultivated adzuki beans were 7.5 × 10⁻⁴, 4.53 × 10⁻⁴ and 3.17 × 10⁻⁴, respectively. The decrease in genetic diversity suggested that the domestication of adzuki bean might be a slow process with transition from “original wild” to “progenitor wild”, and eventually to cultigen. The pairwise FST analysis revealed a higher degree of differentiation between the “original wild” and “progenitor wild” populations compared to that observed between the “progenitor wild” and “cultigens” (Tables S11 and S12; Figure 3b,c). The process of domestication and selection results in a reduction in the genetic diversity within the population, while simultaneously strengthening the linkage between genetic loci. Therefore, populations characterized by higher levels of domestication and increased selection intensity typically exhibit a slower rate of decay in linkage disequilibrium (LD). A gradual decrease in the rate of LD decay from the “original wild” population to the “progenitor wild” population and finally to the cultigen group (including landrace and improved varieties) suggested an intermediate state of LD decay in the “progenitor wild” population, positioning them between the “original wild” and cultigen populations (Figure 3d). These findings suggested that domestication is a progressive process with progenitor to cultivated in adzuki bean during its transition from wild to cultivated. The accessions in the group “original wild” were predominantly distributed within the mountainous regions located to the south of the Qinling Mountains‐Huaihe River Line. The further categorization of accessions within the “progenitor wild” group into three subgroups corresponded to the geographical distribution of “progenitor wild‐China”, “progenitor wild‐Korea”, and “progenitor wild‐Japan”. The Pi values of “progenitor wild‐China”, “progenitor wild‐Korea” and “progenitor wild‐Japan” were 4.9 × 10⁻⁴, 3.6 × 10⁻⁴ and 2.8 × 10⁻⁴, respectively. These results suggested that the genetic diversity of “progenitor wild‐China” was higher than that of “progenitor wild‐Korea” and “progenitor wild‐Japan” (Table S11; Figure 3a). Our results indicated that China served as the original centre of adzuki bean, with the middle and lower reaches of the Yangtze River likely being the site of its centre of domestication. It is plausible that adzuki beans could have migrated from the southern region of China to northern China, subsequently spreading to the Korean Peninsula and Japan.
Genome‐wide association analysis and selective signals of agronomic traits domestication
Agronomic traits are closely linked to domestication, but their regulatory mechanisms are always complicated. In this study, we performed genome‐wide association studies (GWAS) on traits associated with domestication including pod dehiscence, yield traits, growth period and more. The key genes involved in the domestication of adzuki bean were identified by integrating selective signals between wild and cultivated adzuki bean accessions, along with a positive association signal from GWAS on chromosome 5. A non‐synonymous SNP (Chr5:27353701, G/T) located in the CDS region of a candidate gene VaCycA3;1 (Va05G046260) underwent selection and was found to be associated with total seed number per plant (SDTN) and growth habit (erect or twining) (Figure 4a). Two distinct haplotypes of this SNP (Chr5:27353701, G/T) were identified related to multiple agronomic traits, such as Hap.1 (GG) associated with low SDTN and pod dehiscence, and Hap.2 (TT) associated with high SDTN and pod non dehiscence (Figure 4b,d,f). This non‐synonymous SNP resulted in a codon change from GGA to stop codon TGA, which led to premature translation termination (Figure 4d). Our results demonstrate a strong role for VaCycA3;1 during the domestication of adzuki bean.
Figure 4.

Genome‐wide association analysis and selection sweeps in domestication traits. (a) Selective signals and local Manhattan plots of GWAS signals overlapping with selection sweeps; (b) local Manhattan plot and linkage disequilibrium heat map (bottom) of VaCycA3;1; (c) local Manhattan plot and linkage disequilibrium heat map (bottom) of VaHB15; (d) schematic representation of VaCycA3;1 including candidate causal SNP, amino acid compilation and pod difference; (e) schematic representation of VaHB15; (f) box plots show SDTN in three haplotypes of VaCycA3;1; (g) box plots show PDDM100 in three haplotypes of VaHB15.
The candidate gene VaHB15 (Va05G054120) is associated with the duration of pod maturity, and a non‐synonymous SNP (Chr5: 32530016, G/T) within this gene exhibited strong positive selection during the domestication (Figure 4a,c,e). Two basic haplotypes of this SNP were identified in relation to multiple agronomic traits; specifically, Hap.1 (GG) was associated with shorter maturity time, while Hap.2 (TT) was linked to longer maturity time (Figure 4g). The HD‐Zip III homologue encoded by Va05G054120 was previously reported to be critical for vascular development in Arabidopsis (Du et al., 2015) and poplar (Du et al., 2011). To the best of our knowledge, the present study is the first to report its function specifically related to growth period.
Identification of two genes controlling seed coat colour
The red seed coat colour is a distinctive characteristic observed in the vast majority of cultivated adzuki beans, whereas nearly all wild adzuki beans exhibit a black mottled on grey seed coat. GWAS based on genetic variation data of 322 accessions (Table S13) identified two genomic blocks having significant associations with seed coat colour. The most significant block (13 711 715–13 773 905, 62.19 Kb) on chromosome 1 contains a cluster of 20 genes (Figure 5a). The peak SNP (Chr1:13773905, T/A) is located within the exon of the VaANR1 (Va01G021240) gene, which encodes an anthocyanidin reductase enzyme capable of facilitating the conversion of 3‐OH‐anthocyanidins to epi‐flavan‐3‐ols (Lepiniec et al., 2006). The identified SNP is a stop‐gain variant (TTG to TAG) that induces premature termination of transcripts (Figure 5b). The premature termination of translation may result in a conformational alteration of the protein's tertiary structure, as predicted. (Figure 5d). This SNP resulted in the generation of two distinct haplotypes. Accessions carrying the reference haplotype (Hap.1: TT) exhibited a seed coat coloration characterized by red, black mottling on red and red mottling on ivory, or an entirely ivory coloration. Conversely, accessions carrying the alternate haplotype (Hap.2: AA) displayed various other seed coat colours (Figure 5b).
Figure 5.

Genome‐wide association with seed coat colour of var. angularis. (a) Manhattan plot for seed coat colour GWAS in the full population with the local Manhattan plot and linkage disequilibrium heat map (bottom) of VaANR1 and VaBm; (b) schematic representation of VaANR1 including candidate causal SNP, amino acid compilation and seed coat colour difference; (c) schematic representation of VaBm including candidate causal SNP, amino acid compilation and seed coat colour difference; (d) prediction of protein tertiary structure difference between Hap.1 and Hap.2 of VaANR1; (e) flavanols content during the seed coat coloration stage in red Jingnong6 and light brown FM6261; (f) cyanidin content during the seed coat coloration stage in red Jingnong6 and light brown FM6261; (g) relative expression levels of VaANR1 during the seed coat coloration stage in red Jingnong6 and light brown FM6261; (h) linkage map of VaANR1 and SSR markers.
To further explore the relationship between VaANR1 and seed coat colour, a light brown seed coat mutant FM6261 of Jingnong6 radiated by 60Co, which carries the alternate haplotype, was used to validate the function of VaANR1. The expression level of VaANR1 decreased significantly from stage 1 to stage 3 in both Jingnong6 and FM6261 (Figure 5g). Considering seed coat colouring, the content of flavanols decreased, while the content of all compounds in FM6261 was higher than in Jingnong6 at every stage (Figure 5e). Cyanidins were barely accumulated in FM6261, but were obviously synthesized in Jingnong6 (Figure 5f). To further determine the correlation between VaANR1 and seed coat colour trait, we analysed an F3 mapping population, CCA026 (red) × FM6261 (light brown) with 90 simple sequence repeat (SSR) markers. Ten markers (11.1%) showed association with the seed coat colour gene sdc2, which was finely mapped between the SSR markers C1S168–26 and C1S168–8 (Table S14; Figure 5h).
The variation in seed coat colour between red and light brown seeds was found to be linked to a genomic region harbouring VaANR1. However, there were no significant differences observed at the expression level between red Jingnong6 and its mutant FM6261 with a light brown seed coat (Figure 5g). This indicated that the variation of VaANR1 would cause premature translation termination, which in turn could affect the synthesis of flavanols and cyanidins rather than the transcription level. The content of flavanols and cyanidins ultimately determines the seed coat colour.
Another candidate gene VaBm (Va08G018610) encodes a protein containing a retrotransposon gag domain. It is located on chromosome 8 and correlated with black mottled seed coat colour (Figure 5a). The exonic regions of VaBm contained a total of eight SNPs. The peak SNP (Chr8:10806223, C/G), which caused amino acid variation from Thr (ACT) to Ser (AGT), generated three haplotypes, Hap.1 (CC), Hap.2 (CG), and Hap.3 (GG) (Figure 5c). The seed coat of accessions with Hap.1 (CC) exhibited an absence of splotches, while the seed coats of accessions with Hap.2 (CG) and Hap.3 (GG) displayed a black mottled pattern. The landraces GM276 and GM633 exhibited red and black mottling on their respective red seed coats. Allele‐specific polymerase chain reaction (AS‐PCR) established the correlation between VaBm variation and seed coat characteristics in the F2 population derived from a cross between GM276 and GM633 (Figure S6). The co‐segregation of SNP in the gene VaBm with the seed coat trait of black mottle/no mottle demonstrates its immense potential for precise morphological identification. In summary, the variation in VaANR1 gene is associated with seed coat coloration, while the variability of VaBm is linked to seed coat patterning in adzuki bean.
Discussion
In this study, we assembled a chromosome‐scale high quality reference genome of adzuki bean using PacBio long reads sequencing, Illumina short reads and Hi‐C interaction maps (Table 1). The first chromosome‐scale reference genome exhibits significant enhancements compared to previously published assemblies of adzuki bean (Kang et al., 2015; Sakai et al., 2015; Yang et al., 2015). The high percentage of repetitive sequences (59.79%) in the current assembly reflects the high efficiency in assembling repeat sequences.
Chromosomal fusion and fission are among the driving factors of chromosome evolution and affect genetic diversity and environmental adaptation (Cicconardi et al., 2021; Ijdo et al., 1991). Interspecific synteny analysis suggested the occurrence of chromosome fission/fusion events in the genomes of Vigna. The chromosomes 3 and 5 of fission/fusion events might have promoted the speciation of adzuki bean.
The adzuki bean has the closest relation and a high degree of collinearity with mung bean and cowpea. Consistent with the existing classification (Zhuang et al., 2019). Compared with mung bean and cowpea, chromosome 5 of adzuki bean showed a break and fusion. We observed cooccurrence of strong selective signals with GWAS associative signals in the genome. The genomic locations of break and fusion, selective signals and GWAS peaks implied a possible unique domestication region in the chromosome 5 of adzuki bean. Re‐sequencing and genome‐wide analysis of 332 accessions of wild adzuki bean (Vigna angularis var. nipponensis) and cultivated adzuki bean (Vigna angularis var. angularis) provides abundant data of genome variations.
Vigna angularis var. nipponensis is regarded as wild progenitor of adzuki bean (Yamaguchi, 1992). The abundance of genetic diversity suggests that the oldest wild adzuki bean originated in the southern region of China, and population structure analysis combined with selection analysis provides compelling evidence to support this hypothesis. The great diversity in the wild adzuki bean populations, having higher natural allelic variation than cultivated adzuki bean, will further facilitate breeding. Our research unravelled adzuki bean domestication as an asymptotic process from wild to cultivated. The phenotypes of wild accessions in progenitor wild group are different from the original wild group in terms of seed size, seed colour or stem colour. The seed sizes of semi‐wild accessions are larger than those of wild accessions within the progenitor wild group, yet smaller than those of cultivated adzuki beans. The semi‐wild accessions exhibit trailing growth habits similar to those of wild accessions, along with a green stem colour characteristic of cultigens (Figure S5). Interestingly, our genomic analysis reveals a fascinating congruence between domestication and the archaeological evidence of seed sizes, indicating an increase in adzuki bean seed size following domestication (Lee, 2013; Tao, 2017). Through the process of domestication, adzuki bean seed size has gained a gradual increase from its wild counterparts, indicating an ongoing transition towards cultigens. Semi‐wild adzuki bean (weedy) has been recognized as an intermediate type (Yamaguchi and Nikuma, 1996). Our results demonstrate that the semi‐wild adzuki bean had closer relationship to cultigen adzuki bean than that of wild type and provide evidence that semi‐wild adzuki bean might be a kind of preliminary landrace (Yang et al., 2015).
Our research showed that adzuki bean originated from China and the lower‐middle reaches of Yangtze River Valley was probably the place of the earliest development of cultivated adzuki bean, supporting Vavilov's view on adzuki bean origin (Vavilov, 1926). All types of original wild, progenitor wild, semi‐wild, and cultivated adzuki beans were found only in the lower‐middle reaches of Yangtze River Valley. The introgression had been found in cultivated adzuki bean with admixed evident between wild and cultivated groups. The earliest archaeological evidence of Vigna seeds were collected 12 000 years ago as plant foods from Shanxi Mozitang site of China (Liu et al., 2013). Adzuki bean, mung bean, rice bean (Vigna umbellata) and cowpea of the genus Vigna have been cultivated in China. Mung bean and rice bean are believed to have originated from South or Southeast Asia (Tomooka et al., 2002; Zukovskij, 1962). On the other hand, cowpea is known to have originated from Africa (Ng and Maréchal, 1985). The earliest archaeological Vigna seeds in Shanxi Mozitang site of China should be adzuki bean (Liu et al., 2013). Adzuki bean food was identified in the Kuahuqiao site (8000 ~ 7000 cal. BP) of Zhejiang in China (Yang and Jiang, 2010) which was earlier than others (Lee, 2013).
In the present study, GWAS identified several genomic loci contributing to the seed coat colour and agronomic traits of adzuki bean. The resulting genes associated with flavonoid metabolism, VaANR1 and VaBm with retrotransposon domain, explain the genetic basis for the variation in seed coat colour between red and black mottle on grey. The functional analysis of VaANR1 and VaBm showed that they have similar function with the homologous genes reported in previous studies (Kitamura et al., 2016; Selinger and Chandler, 2001), supporting the fact that the disparity between the two seed coat colours is a qualitative trait regulated by a single locus (Chu et al., 2021a). VaANR1 and VaBm genes might result in the seed coat colour variation between black mottle on grey in wild type and red in cultivated adzuki bean. Further investigation is required to determine whether this variation represents a direct selection or serves as an accessory to the selection of agronomic traits during domestication.
Several significant selected regions on chromosome 5 align with peaks of agronomic traits in GWAS (Table S15). These regions are also non‐homologous between adzuki bean and other Vigna beans. CWA124 is close to the wild accessions in phenotype and close to the cultivated species in genotype. Therefore, we analysed the gene introgression of CWA124 and found that CWA124 is close to the wild accessions in the key region of domestication and agronomic traits on chromosome 5, although CWA124 is close to the cultigen accessions in the whole genome (Figure S7). These regions on chromosome 5 may be the uniquely selected during the process of adzuki bean domestication. Furthermore, the selection of a single candidate region may have led to the alteration of multiple agronomic traits during the domestication. Multiple pod dehiscence candidate genes VaGALT2, VaCSLH1, VaE1314, VaE134, VaBGLU12 and VaBGLT were identified in the specific region.
The haplotype analysis revealed that SNPs within candidate genes, such as VaCycA3;1 and VaHB15, were significantly associated with multiple agronomic traits related to flowering and maturity time, seed size, pod size, plant height, number of pods per plant and total seed number per plant (Figure S8). The homologues of VaCycA3;1 in Arabidopsis regulate formative cell divisions (Willems et al., 2020). However, more characterization by transgenesis in adzuki bean is needed for functional analysis of VaCycA3;1.
GWAS on fourteen agronomic traits identified numerous genomic regions significantly associated with these traits. This large amount of new genomic resources, including selected regions, candidate genes and molecular markers, will provide valuable support for evolutionary studies, functional genomics research, and adzuki bean breeding.
Materials and methods
Plant materials
The widely adopted Chinese cultivar Jingnong6 was used for de novo genome sequencing and assembly. The genomic DNA was extracted from the fresh leaves of adzuki bean by the cetyltrimethylammonium bromide (CTAB) method (Murray and Thompson, 1980; Zhu et al., 2007).
De novo sequencing and genome assembly
The high molecular weight DNA (>15 kb) was extracted and the large size fraction was obtained with automated gel electrophoresis (BluePippin). One 20‐kb insert library was constructed, and a SMRT cell with 116.06 Gb of sequence data (241‐fold coverage of the genome) was sequenced on the PacBio Sequel platform. The N50 length and mean length of the subreads were 19.2 kb and 12.5 kb, respectively. The Hi‐C library was prepared following the reported protocol (Wang et al., 2015). The short reads for whole genome shut gun and Hi‐C data were sequenced by BGI DNBSEQ™ with 350 bp insert size library. PacBio reads were cleaned and used for a preliminary assembly of contigs using CANU 1.7.1 (Koren et al., 2017). Then, all PacBio long reads were used to polish the CANU‐based genome with ARROW (SMRT LINK 5.0.1) (Chin et al., 2013). Finally, the short reads were mapped on the polished genome using BWA‐MEM 0.7.17 (Li and Durbin, 2009) and the assembled genome was corrected by PILON 1.22 (Walker et al., 2014), with default settings. To anchor the assembled contigs to chromosomes, Hi‐C reads were mapped onto the assembled contigs with BWA‐MEM 0.7.17 (Li and Durbin, 2009) and the aligned reads, which were duplicated and without correct cross‐linking information, were removed by Juicer v1.5.6 (Durand et al., 2016). The valid paired‐end reads were retained and used for anchoring contigs onto chromosomes by 3D‐DNA with default parameters (Dudchenko et al., 2017).
Genome annotations
The chromosome‐level assembled adzuki bean genome was annotated with repeats and genes. The repeats in adzuki bean genome were identified with de novo and homology‐based methods. First, a de novo repetitive sequence library was constructed with LTR_FINDER v1.06 (Zhao and Hao, 2007) (http://tlife.fudan.edu.cn/ltr_finder/) and RepeatModeler (Smit et al., 1996‐2004) (http://www.repeatmasker.org/RepeatModeler/) and the de novo repeats were predicted with Repeatmasker v4.0.7. Then, using the RepBase v21.12 (Jurka et al., 2005) (http://www.girinst.org/repbase) database, homology‐based repetitive sequences of the adzuki bean genome were identified with RepeatMasker v4.0.7 (Smit et al., 1996‐2004) and RepeatProteinMask v4.0.7 (Smit et al., 1996‐2004). In addition, the tandem repeats were identified with Tandem Repeats Finder v4.09 (Benson, 1999) (http://tandem.bu.edu/trf/trf.html).
The gene annotation of the adzuki bean genome was performed with three algorithms: ab initio prediction, homology‐based prediction and RNA‐seq data‐based prediction. First, the repeat‐masked adzuki bean genome was ab initio predicted using Augustus (Zhao and Hao, 2007) (http://bioinf.uni‐greifswald.de/augustus/). Second, RNA‐seq data of 24 new samples obtained during seed development together with the transcriptome sequences from other tissue types (Yang et al., 2015) was mapped to the assembled genome with TOPHAT v2.1.0 (Trapnell et al., 2009) and the transcript structures was identified using CUFFLINKS v2.2.1 e three strategies were integrated into the consensus gene sets with MAKER pipeline v3.31.8 (Holt and Yandell, 2011). The gene function annotation was achieved according to the predicted protein‐coding genes blasted again six databases of eggNOG5.0, GO, KEGG, COG, NR and SwissProt.
Population materials and phenotyping
A total of 322 adzuki bean (V. angularis var. angularis) accessions from four relative types wild (67), semi‐wild (39), landrace (160) and improved varieties (56) were obtained for whole genome sequencing (Table S8). These samples originated from a wide range of geographic regions that covered six countries including China (218), Korea (31), Japan (68), Nepal (1), USA (2) and Bhutan (2).
For phenotyping, all 322 adzuki bean accessions were planted at the Experimental Station of Beijing University of Agriculture, Tingzizhuang and Ma'an Shan from 2014 to 2017. Data of fourteen phenotypes referring to the standard in books of Cheng and Tomooka (Cheng et al., 2006; Tomooka et al., 2002) was collected for the GWAS from three locations over 4 years. Five individuals from each accession were used for measurements of each phenotype.
The six field phenotypic metrics maturity days of 100% of the pods (PDDM100), maturity days of 50% of the pods (PDDM50), days of 50% flower (FLD50), days to first flower (FLD), plant height (PHT) and pod dehiscence (PDD) were measured during the growth period of the adzuki beans. Seed related traits including total seed number per plant (SDTN), total number of pods per plant (PDTN), pod width (PDW), pod length (PDL) and seed coat colour (SDC) were measured after harvest. SC‐G automatic seed test analysis and a 1000 grain weight instrument (Hangzhou Wanshen Testing Technology Co., Ltd) were used for measurements of seed width (SDW), seed length (SDL) and 100 seed weight (SD100WT).
Whole genome re‐sequencing and genetic variation analysis
For the adzuki bean accessions, 60 μg of DNA of each sample was sheared into ~350 bp insert‐size fragments using paired‐end kits (Illumina, San Diego, CA, USA). All libraries were sequenced using 150‐bp paired‐end sequencing on an Illumina HiSeq™ 2500 at Beijing Genome Institute, Shenzhen (BGI‐ Shenzhen, China). A total of 1610 Gb sequenced data was obtained. On average, 5 Gb (10‐fold coverage of the genome) of the sequence was obtained for each accession (Table S9). The raw sequenced reads were filtered with SOAPnuke version 1.5.3 (Chen et al., 2018) with excluding N content (N content >5%), adapter, PCR duplicates, and low‐quality (low‐quality base >20%, quality value ≤10) reads. The retained clean data was about 4.21 Gb for each individual with an average of 8.92 (7–16) fold coverage (Table S9).
The clean reads were mapped against the new adzuki bean Chinese cultivar Jingnong6 genome using BWA‐MEM 0.7.17 (Li and Durbin, 2009). Alignment results in bam format were sorted and indexed using samtools (v1.3) (Li et al., 2009). Genetic variation, including SNPs and indels, were identified using Genome Analysis Toolkit (GATK, v3.4) (McKenna et al., 2010) with the module of UnifiedGenotyper. The SNP annotation based on adzuki bean genome was performed using the package ANNOVAR (v2015) (Wang et al., 2010). To ensure accuracy, the SNPs with a SNP quality >30 and site frequency spectrum (MAF≥0.05 and missing rate ≤0.1) were used in the subsequent analysis.
Phylogenetic tree and population genetics analysis
To explore the phylogenetic relationship of the 322 adzuki bean accessions at the genome‐wide level, and neighbour joining tree was generated using the software of Phylip v3.696 (Stamatakis, 2014) with a bootstrapping value of 1000. The fastSTRUCTURE (Anil Raj et al., 2014) was used to infer the population structure with K values ranging from 2 to 10. The structure frappe figure was presented in Pophelper (http://royfrancis.github.io/pophelper). The genetic relationships were examined with principal component analysis (PCA) using SNPRelate (Zheng et al., 2012).
Linkage disequilibrium and selective sweep analysis
To discovery the pattern of linkage disequilibrium among different adzuki bean accessions, the pairwise squared correlation coefficients (r2) were calculated using PopLDdecay v3.30 (https://github.com/BGI‐shenzhen/PopLD decay) with the following parameters: “PopLDdecay‐InGenotype‐SubPop ‐MaxDist 500 ‐MAF 0.05 ‐Miss 0.6.” Rscript (version 3.2.1) was applied to plot the average r2 values between all pairs of genotypes.
To identify differentiated loci between sub‐populations, we performed a sliding window analysis based on pairwise estimates of differentiation (FST) and Pi within each population. The Pi and FST were calculated respectively with vcftools (Danecek et al., 2011) and pair‐wisely (Akey et al., 2002). The window size was 100 k with a step size of 10 kb.
Genome‐wide association study (GWAS) analysis
GWAS was performed using the Genomic Association and Prediction Integrated Tool (GAPIT) package in R software V4.6. The window size was 100 k with a step size of 100 kb.
In total, the SNPs with a minor allele frequency of 0.05 and greater missing rate of 0.1 were used for GWAS. The target traits and genome‐wide SNPs was carried out with the Efficient Mixed‐Model Association eXpedited program (EMMAx) (Kang et al., 2010). The population structure was corrected to remove the false positives with kinship (K) matrix generated by the FaST‐LMM program v2.07 (Lippert et al., 2011). The modified Bonferroni correction was applied to identify the genome‐wide significance thresholds (0.05/total SNPs [log10 (P) = −5 ~ −8]) of the GWAS. The LD heatmap was plotted by R version 3.6.2 (R Core Team, 2014) (http://www.R‐project.org/) with a LDheatmap model (Shin et al., 2006).
VaANR1 expression level detection by qRT‐PCR
We collected the seed coat of Jingnong6 and FM6261 during the three colouring stages, respectively. All samples were immediately frozen in liquid nitrogen and then stored at −80 °C. Total RNA was extracted from 0.1 g of each powdered seed coat with EASYspin plus Total RNA Isolation Kit (Aidlab, China), according to the instructions of the manufacturer, with minor modifications.
The 1000 ng of the total RNA was reverse transcribed using PrimeScript RT Reagent Kit (RR037A, TaKaRa, Japan) following the manufacturer's instructions. The cDNA was diluted 10‐fold with nuclease‐free water for qRT‐PCR analysis. qRT‐PCR was conducted using LightCycler® 96 Plates and performed on the LightCycler 96 SW 1.1 (Roche Molecular Systems, Germany). The reaction mixture contained 10 μL ChamQTM Universal SYBR® qPCR Master Mix (#Q711, Vazyme, China), 1 μL 10‐fold diluted cDNA, 0.4 μM of each forward and reverse primer and ddH2O to make up the final volume to 20 μL. Amplifications were performed with the following program: 95 °C for 30 s; 40 cycles of 95 °C for 10 s, 60 °C for 30 s and melting curve analysis conditions (95 °C for 10 s, 65 °C increased to 97 °C with temperature increments of 0.11 °C every 1 s).No‐template reactions were used as negative controls, and each sample was assessed in three technical replicates. Gene transcription levels of seed coats from the Jingnong6 and FM6261 during the three colouring stages were calculated using three biological replicates (each replicate contained the mixed seed coats of six individuals). An actin housekeeping gene of the adzuki bean was used for normalization.
Flavanols and cyanidins measured by LC–MS
The seed coats of Jingnong6 and FM6261 collected during three colouring stages, were ground into a powder and extracted with 1 mL 70% aqueous methanol by overnight incubation at 4 °C. The extracted solution was centrifuged for 10 min at 10 000 g . The extracts were analysed using a liquid chromatography–electrospray ionization–tandem mass spectrometry (LC–ESI–MS/MS) system (high‐performance liquid chromatography, HPLC, Shimpack UFLC CBM30A, Shimadzu; mass spectrometry,4500 QTRAP, Applied Biosystems). The analytical conditions referred to Chen et al.'s methods and were not modified (Chen et al., 2013).
Gene mapping of VaANR1 and AS‐PCR
SSR Hunter version 1.3 and Oligo version 7 were used for the primer design of 10 SSR and 1 AS‐PCR primer pairs (Table S14). DNA was diluted to the same concentration (50 ng/mL). There action mixture contained 5 μL PCR mix, 1 μL DNA, 0.4 μL of each forward and reverse primer and double‐distilled water (ddH2O) to make up the final volume to 10 μL. Amplifications were performed with the following program: 95 °C for 5 min; 40 cycles of 95 °C for 30 s; 55 °C for 30 s; 72 °C for 30 s and 72 °C for 10 min. PCR products were separated on 8% polyacrylamide gel electrophoresis (PAGE), silver stained and viewed. As a morphological marker, sdc2 was used to construct a linkage map with SSR markers.
Author contributions
P.W. managed the project.; J‐B.J. and C.H.C. led the genome sequencing and GWAS accessions resequencing. L‐W.C., P.W. Z‐X.T., R.K.V., K.Y., J‐B.J., C.H.C. and B.Z. designed the project, performed data analysis and prepared the manuscript. W‐Q.W. and B.W., performed the DNA sequencing and GWAS accessions resequencing. W‐Q.W., B.W., A.B. and B.W. performed the genome assembly, data analysis. L‐W.C, Y‐N. H, P.Z., Y‐Q.L., J‐P.Y. and Y‐S.L. investigated phenotype data of agronomic traits of GWAS accessions and performed GWAS analysis. L‐W.C and K‐L.W. assayed the flavonol and anthocyanin content and analysed gene expression. Q‐J.S. performed GWAS analysis. Y.X., L.B. and R‐X.F. performed genes transformation and verification. E.C.S. advised on data discussion and revised the manuscript.
Supporting information
Figure S1 Adzuki bean genome Hi‐C hot map.
Figure S2 Contracted and expanded gene families in comparative genomics analysis.
Figure S3 Break and fusion in chromosome 3 and 5 of adzuki bean.
Figure S4 Accessions information in different collection place.
Figure S5 Phenotypes of wild, semi‐wild and cultigen adzuki bean.
Figure S6 AS‐PCR analysis in the GM276 × GM633 F2 population.
Figure S7 Genetic background of CWA124.
Figure S8 SNPs inside VaCycA3;1 and VaHB15 associated with multiple traits.
Table S1 BUSCO Evaluation of adzuki bean Jingnong6 proteins.
Table S2 Repeat sequence annotation statistics.
Table S3 Structural statistics of gene annotation.
Table S4 Structural integrity assessment.
Table S5 BUSCO Evaluation of adzuki bean Jingnong6 genome assembly.
Table S6 Statistics of Speciesinp hylogenetic tree with divergence time.
Table S7 Significantly enriched GO terms and KEGG pathway.
Table S8 The list and origin of Accessions.
Table S9 BWA comparison statistics of 322 accessions.
Table S10 SNP statistics of the whole population.
Table S11 Pi of each Subgroup.
Table S12 Fst between each two Subgroup.
Table S13 Seed coat color of 322 accessions.
Table S14 Primer Information in this study.
Table S15 Candidate genes correlated with multiple agronomic traits.
Acknowledgements
We thank Professor Yuncong Yao in Beijing University of Agriculture for project support, Professor Junyi Gai, academician, and Professor Shouping Yang in Nanjing Agricultural University for their kind help on planting of the GWAS accessions.
Financial support was provided by the National Key R&D Program of China (2018YFD1000705, 2018YFD1000700), the National Natural Science Foundation of China provided financial support (grant number 31871697), the Beijing Natural Science Foundation–Beijing Municipal Education Committee (grant number KZ201710020013), New variaties breeding and Experimental demostration of adzuki bean (grant number 2024115272‐22) and the Food Futures Institute of the Murdoch University, Australia for the start up grant to RKV.
Contributor Information
Rajeev K Varshney, Email: rajeev.varshney@murdoch.edu.au.
Zhixi Tian, Email: zxtian@genetics.ac.cn.
Jianbo Jian, Email: jianjianbo@genomics.cn.
Ping Wan, Email: pingwan3@163.com.
References
- Akey, J.M. , Zhang, G. , Zhang, K. , Jin, L. and Shriver, M.D. (2002) Interrogating a high‐density SNP map for signatures of natural selection. Genome Res. 12, 1805–1814. [DOI] [PMC free article] [PubMed] [Google Scholar]
- Benson, G. (1999) Tandem repeats finder: a program to analyze DNA sequences. Nucleic Acids Res. 27, 573–580. [DOI] [PMC free article] [PubMed] [Google Scholar]
- Chen, W. , Gong, L. , Guo, Z. , Wang, W. , Zhang, H. , Liu, X. , Yu, S. et al. (2013) A novel integrated method for large‐scale detection,identification, and quantification of widely targeted metabolites: Application in the study of rice metabolomics. Mol. Plant 6, 1769–1780. [DOI] [PubMed] [Google Scholar]
- Chen, Y. , Chen, Y. , Shi, C. , Huang, Z. , Zhang, Y. , Li, S. et al. (2018) SOAPnuke: a MapReduce acceleration‐supported software for integrated quality control and preprocessing of high‐throughput sequencing data. Gigascience 7, gix120. [DOI] [PMC free article] [PubMed] [Google Scholar]
- Cheng, X.Z. , Wang, S.H. and Wang, L.X. (2006) Adzuki bean germplasm resources description specifications and data standards [M].
- Cheng, A. , Hou, C. , Sun, J. and Wan, F. (2020) Effect of steam explosion on phenolic compounds and antioxidant capacity in adzuki beans. J. Sci. Food Agric. 100, 4495–4503. [DOI] [PubMed] [Google Scholar]
- Chin, C.S. , Alexander, D.H. , Marks, P. , Klammer, A.A. , Drake, J. , Heiner, C. , Clum, A. et al. (2013) Nonhybrid, finished microbial genome assemblies from long‐read SMRT sequencing data. Nat. Methods 10, 563–569. [DOI] [PubMed] [Google Scholar]
- Chinese Pharmacopoeia Commission (ed) (2010) Chinese Pharmacopeia (the 2010 Edition), Eds Chinese Pharmacopoeia Commission, p. 147. Beijing: China Med Sci Press. [Google Scholar]
- Chu, L. , Zhao, P. , Huang, X. , Zhao, B. , Li, Y. , Yang, K. and Wan, P. (2021a) Genetic analysis of seed coat colour in adzuki bean (Vigna angularis L.). Plant Genet. Resour. 19, 67–73. [Google Scholar]
- Chu, L. , Zhao, P. , Wang, K. , Zhao, B. , Li, Y. , Yang, K. and Wan, P. (2021b) VaSDC1 Is Involved in Modulation of Flavonoid Metabolic Pathways in Black and Red Seed Coats in Adzuki Bean (Vigna angularis L.). Front. Plant Sci. 12, 679892. [DOI] [PMC free article] [PubMed] [Google Scholar]
- Cicconardi, F. , Lewis, J.J. , Martin, S.H. , Reed, R.D. , Danko, C.G. and Montgomery, S.H. (2021) Chromosome fusion affects genetic diversity and evolutionary turnover of functional loci but consistently depends on chromosome size. Mol. Biol. Evol. 38, 4449–4462. [DOI] [PMC free article] [PubMed] [Google Scholar]
- Danecek, P. , Auton, A. , Abecasis, G. , Albers, C.A. , Banks, E. , DePristo, M.A. et al. (2011) The variant call format and VCFtools. Bioinformatics 27, 2156–2158. [DOI] [PMC free article] [PubMed] [Google Scholar]
- Du, J. , Miura, E. , Robischon, M. , Martinez, C. and Groover, A. (2011) The Populus class III HD ZIP transcription factor POPCORONA affects cell differentiation during secondary growth of woody stems. PLoS One 6, e17458. [DOI] [PMC free article] [PubMed] [Google Scholar]
- Du, Q. , Avci, U. , Li, S. , Gallego‐Giraldo, L. , Pattathil, S. , Qi, L. et al. (2015) Activation of miR165b represses At HB 15 expression and induces pith secondary wall development in A rabidopsis. Plant J. 83, 388–400. [DOI] [PubMed] [Google Scholar]
- Dudchenko, O. , Batra, S.S. , Omer, A.D. , Nyquist, S.K. , Hoeger, M. , Durand, N.C. , Shamim, M.S. et al. (2017) De novo assembly of the Aedes aegypti genome using Hi‐C yields chromosome‐length scaffolds. Science 356, 92–95. [DOI] [PMC free article] [PubMed] [Google Scholar]
- Durand, N.C. , Shamim, M.S. , Machol, I. , Rao, S.S.P. , Huntley, M.H. , Lander, E.S. and Aiden, E.L. (2016) Juicer provides a one‐click system for analyzing loopresolution Hi‐C experiments. Cell Syst. 3, 95–98. [DOI] [PMC free article] [PubMed] [Google Scholar]
- Fang, L. , Wang, Q. , Hu, Y. , Jia, Y. , Chen, J. , Liu, B. et al. (2017) Genomic analyses in cotton identify signatures of selection and loci associated with fiber quality and yield traits. Nat. Genet. 49, 1089–1098. [DOI] [PubMed] [Google Scholar]
- Ge, J. , Sun, C.‐X. , Mata, A. , Corke, H. , Gan, R.‐Y. and Fang, Y. (2021) Physicochemical and pH‐dependent functional properties of proteins isolated fromeight traditional Chinese beans. Food Hydrocoll. 112, 106288. [Google Scholar]
- Gohara, A.K. , Souza, A.H.P.D. , Gomes, S.T.M. , Souza, N.E.D. , Visentainer, J.V. and Matsushita, M. (2016) Nutritional and bioactive compounds of adzuki beans cultivars using chemometric approach. Ciência e Agrotecnologia 40, 104–113. [Google Scholar]
- Holt, C. and Yandell, M. (2011) MAKER2: an annotation pipeline and genome‐database management tool for second‐generation genome projects. BMC Bioinform 12, 491. [DOI] [PMC free article] [PubMed] [Google Scholar]
- Ijdo, J.W. , Baldini, A. , Ward, D.C. , Reeders, S.T. and Wells, R.A. (1991) Origin of human chromosome 2: an ancestral telomere‐telomere fusion. Proc. Natl. Acad. Sci. U. S. A. 88, 9051–9055. [DOI] [PMC free article] [PubMed] [Google Scholar]
- Itoh, T. , Kita, N. , Kurokawa, Y. et al. (2004) Suppressive effect of a hotwater extract of adzuki beans (Vigna angularis) on hyperglycemia after sucrose loading in mice and diabetic rats. Biosci. Biotechnol. Biochem. 68, 2421–2426. [DOI] [PubMed] [Google Scholar]
- Jia, G. , Huang, X. , Zhi, H. , Zhao, Y. , Zhao, Q. , Li, W. et al. (2013) A haplotype map of genomic variations and genome‐wide association studies of agronomic traits in foxtail millet (Setaria italica). Nat. Genet. 45, 957–961. [DOI] [PubMed] [Google Scholar]
- Jurka, J. , Kapitonov, V.V. , Pavlicek, A. , Klonowski, P. , Kohany, O. and Walichiewicz, J. (2005) Repbase Update, a database of eukaryotic repetitive elements. Cytogenet. Genome Res. 110, 462–467. [DOI] [PubMed] [Google Scholar]
- Kang, H.M. , Sul, J.H. , Service SK , Zaitlen, N.A. , Kong, S.Y. , Freimer, N.B. , Sabatti, C. et al. (2010) Variance component model to account for sample structure in genome‐wide association studies. Nat. Genet. 42, 348–354. [DOI] [PMC free article] [PubMed] [Google Scholar]
- Kang, Y.J. , Satyawan, D. , Shim, S. , Lee, T. , Lee, J. , Hwang, W.J. et al. (2015) Draft genome sequence of adzuki bean, Vigna angularis . Sci. Rep. 5, 1–8. [DOI] [PMC free article] [PubMed] [Google Scholar]
- Kawakami, W. , Oshima, A. and Yanase, E. (2018) Structural characterization of proanthocyanidins from adzuki seed coat. Food Chem. 239(jan.15), 1110–1116. [DOI] [PubMed] [Google Scholar]
- Kitagawa, W.H. , Saito, M. et al. (1983) Saponin and sapogenol. XXXII. chemical constituents of the seeds of Vigna angularis (Willd.) Ohwi et Ohashi. (2). Azukisaponins I, II, III, and IV[J]. Chem. Pharm. Bull. 31, 674–682. [Google Scholar]
- Kitamura, S. , Oono, Y. and Narumi, I. (2016) Arabidopsispab1, a mutant with reduced anthocyanins in immature seeds from banyuls, harbors a mutation in the MATE transporter FFT. Plant Mol. Biol. 90, 7–18. [DOI] [PubMed] [Google Scholar]
- Koren, S. , Walenz, B.P. , Berlin, K. , Miller, J.R. , Bergman, N.H. and Phillippy, A.M. (2017) Canu: scalable and accurate long‐read assembly via adaptive k‐mer weighting and repeat separation. Genome Res. 27, 722–736. [DOI] [PMC free article] [PubMed] [Google Scholar]
- Lee, G.A. (2013) Archaeological perspectives on the origins of azuki (Vigna angularis). The Holocene 23, 453–459. [Google Scholar]
- Lee, K.J. , Ma, K.H. , Cho, Y.H. , Lee, J.R. , Chung, J.W. and Lee, G.A. (2017) Phytochemical distribution and antioxidant activities of Korean adzuki bean (Vigna angularis) landraces. J. Crop Sci. Biotechnol. 20, 205–212. [Google Scholar]
- Lepiniec, L. , Debeaujon, I. , Routaboul, J.M. , Baudry, A. , Pourcel, L. , Nesi, N. and Caboche, M. (2006) Genetics and biochemistry of seed flavonoids. Annu. Rev. Plant Biol. 57, 405–430. [DOI] [PubMed] [Google Scholar]
- Li, H. and Durbin, R. (2009) Fast and accurate short read alignment with Burrows‐Wheeler transform. Bioinformatics 25, 1754–1760. [DOI] [PMC free article] [PubMed] [Google Scholar]
- Li, H. , Handsaker, B. , Wysoker, A. , Fennell, T. , Ruan, J. , Homer, N. , Marth, G. et al. (2009) The Sequence Alignment/Map format and SAMtools. Bioinformatics 25, 2078–2079. [DOI] [PMC free article] [PubMed] [Google Scholar]
- Lin, R.F. et al. (2002) In Minor Grain Crops in China( Yun, L. , ed), pp. 192–209. Beijing: Agric Sci Tech Press. [Google Scholar]
- Lin, T. , Zhu, G. , Zhang, J. , Xu, X. , Yu, Q. , Zheng, Z. et al. (2014) Genomic analyses provide insights into the history of tomato breeding. Nat. Genet. 46, 1220–1226. [DOI] [PubMed] [Google Scholar]
- Lippert, C. , Listgarten, J. , Liu, Y. , Kadie, C.M. , Davidson, R.I. and Heckerman, D. (2011) FaST linear mixed models for genome‐wide association studies. Nat. Methods 8, 833–835. [DOI] [PubMed] [Google Scholar]
- Liu, L. , Bestel, S. , Shi, J. , Song, Y. and Chen, X. (2013) Paleolithic human exploitation of plant foods during the last glacial maximum in North China. Proc. Natl. Acad. Sci. U. S. A. 110, 5380–5385. [DOI] [PMC free article] [PubMed] [Google Scholar]
- Liu, R. , Cai, Z. and Xu, B. (2017) Characterization and quantification of flavonoids and saponins in adzuki bean (Vigna angularis L.) by HPLC–DAD–ESI–MSn analysis[J]. Chem. Cent. J. 11, 93–110. [DOI] [PMC free article] [PubMed] [Google Scholar]
- Manickavasagan, A. and Thirunathan, P. (eds) (2020) Pulses: Processing and Product Development. Berlin, Germany: Springer Nature. [Google Scholar]
- McKenna, A. , Hanna, M. , Banks, E. , Sivachenko, A. , Cibulskis, K. , Kernytsky, A. , Garimella, K. et al. (2010) The Genome Analysis Toolkit: a MapReduce framework for analyzing next‐generation DNA sequencing data. Genome Res. 20, 1297–1303. [DOI] [PMC free article] [PubMed] [Google Scholar]
- Mimura, M. , Yasuda, K. and Yamaguchi, H. (2000) RAPD variation in wild, weedy and cultivated azuki beans in Asia. Genet. Resour. Crop Evol. 47, 603–610. [Google Scholar]
- Murray, M. and Thompson, W.F. (1980) Rapid isolation of high molecular weight plant DNA. Nucleic Acids Res. 8, 4321–4326. [DOI] [PMC free article] [PubMed] [Google Scholar]
- Navarro, J.A.R. , Willcox, M. , Burgueño, J. , Romay, C. , Swarts, K. , Trachsel, S. et al. (2017) A study of allelic diversity underlying flowering‐time adaptation in maize landraces. Nat. Genet. 49, 476–480. [DOI] [PubMed] [Google Scholar]
- Ng, N.Q. and Maréchal, R. (1985) Cowpea taxonomy, origin and germ plasm. In Cowpea Research, Production and Utilization( Singh, S.R. and Rachie, K.O. , eds), pp. 11–21. Chichester: Wiley. [Google Scholar]
- R Core Team (2014) R: A Language and Environment for Statistical Computing. Vienna, Austria: R Foundation for Statistical Computing. [Google Scholar]
- Raj, A. , Stephens, M. and Pritchard, J.K. (2014) fastSTRUCTURE: Variational Inference of Population Structure in Large SNP Data Sets. Genetics 197, 573–589. [DOI] [PMC free article] [PubMed] [Google Scholar]
- Sakai, H. , Naito, K. , Ogiso‐Tanaka, E. , Takahashi, Y. , Iseki, K. , Muto, C. et al. (2015) The power of single molecule real‐time sequencing technology in the de novo assembly of a eukaryotic genome. Sci. Rep. 5, 1–13. [DOI] [PMC free article] [PubMed] [Google Scholar]
- Sato, S. , Nakamura, Y. , Kaneko, T. , Asamizu, E. , Kato, T. , Nakao, M. , Sasamoto, S. et al. (2008) Genome structure of the legume, Lotus japonicus . DNA Res. 20, 227–239. [DOI] [PMC free article] [PubMed] [Google Scholar]
- Schmutz, J. et al. (2014) A reference genome for common bean and genome‐wide 18 analysis of dual domestications. Nat. Genet. 46, 707–713. [DOI] [PMC free article] [PubMed] [Google Scholar]
- Selinger, D.A. and Chandler, V.L. (2001) B‐Bolivia, an allele of the maize b1 gene with variable expression, contains a high copy retrotransposon‐related sequence immediately upstream. Plant Physiol. 125, 1363–1379. [DOI] [PMC free article] [PubMed] [Google Scholar]
- Shen, Y. , Liu, J. , Geng, H. , Zhang, J. , Liu, Y. , Zhang, H. et al. (2018) De novo assembly of a Chinese soybean genome. Sci. China Life Sci. 61, 871–884. [DOI] [PubMed] [Google Scholar]
- Shen, C. , Du, H. , Chen, Z. , Lu, H. , Zhu, F. , Chen, H. et al. (2020) The chromosome‐level genome sequence of the autotetraploid alfalfa and resequencing of core germplasms provide genomic resources for alfalfa research. Mol. Plant 13, 1250–1261. [DOI] [PubMed] [Google Scholar]
- Shin, J. , Blay, S. , McNeney, B. and Graham, J. (2006) LDheatmap: An R function for graphical display of pairwise linkage disequilibria between single nucleotide polymorphisms. J. Stat. Softw. 16, 1–9. http://stat.sfu.ca/statgen/research/ldheatmap.html [Google Scholar]
- Smit, A.F.A. , Hubley R., and Green P.. (1996. ‐2004) http://www.repeatmasker.org.
- Soltani, N. , Shropshire, C. and Sikkema, P.H. (2019) Control of volunteer adzuki bean and soybean in white bean with halosulfuron. Can. J. Plant Sci. 99, 375–378. [Google Scholar]
- Stamatakis, A. (2014) RAxML version 8: A tool for phylogenetic analysis and post‐analysis of large phylogenies. Bioinformatics 30, 1312–1313. [DOI] [PMC free article] [PubMed] [Google Scholar]
- Tao, D. (2017) The preliminary an analysis of adzuki (vigna) remains from archaeological site in China Western. Archaeology 14, 275–281. [Google Scholar]
- Tomooka, N. , Vaughan, D. , Maxted, N. and Moss, H. (2002) The Asian Vigna: Genus Vigna Subgenus Ceratotropis Genetic Resources. Berlin, Germany: Springer Science & Business Media. [Google Scholar]
- Trapnell, C. , Pachter, L. and Salzberg, S.L. (2009) TopHat: discovering splice junctions with RNA‐Seq. Bioinformatics 25, 1105–1111. [DOI] [PMC free article] [PubMed] [Google Scholar]
- USDA . (2019) Beans, adzuki, mature seeds, raw. https://fdc.nal.usda.gov/fdc‐app.html#/food ‐details/173727/nutrients
- Varshney, R.K. , Chen, W. , Li, Y. , Bharti, A.K. , Saxena, R.K. , Schlueter, J.A. , Donoghue, M.T.A. et al. (2012) Draf t genome sequence of pigeonpea (Cajanus cajan), 3 an orphan legume crop of resource poor farmers. Nat. Biotechnol. 30(1), 83. [DOI] [PubMed] [Google Scholar]
- Varshney, R.K. , Song, C. , Saxena, R.K. , Azam, S. , Yu, S. , Sharpe, A.G. , Cannon, S. et al. (2013) Draft genome sequence of chickpea (Cicer arietinum) 5 provides a resource for trait improvement. Nat. Biotechnol. 31(3), 240–246. [DOI] [PubMed] [Google Scholar]
- Varshney, R.K. , Saxena, R.K. , Upadhyaya, H.D. , Khan, A.W. , Yu, Y. , Kim, C. et al. (2017a) Whole‐genome resequencing of 292 pigeonpea accessions identifies genomic regions associated with domestication and agronomic traits. Nat. Genet. 49, 1082–1088. [DOI] [PubMed] [Google Scholar]
- Varshney, R.K. , Shi, C. , Thudi, M. , Mariac, C. , Wallace, J. , Qi, P. et al. (2017b) Pearl millet genome sequence provides a resource to improve agronomic traits in arid environments. Nat. Biotechnol. 35, 969–976. [DOI] [PMC free article] [PubMed] [Google Scholar]
- Varshney, R.K. , Thudi, M. , Roorkiwal, M. , He, W. , Upadhyaya, H.D. , Yang, W. et al. (2019) Resequencing of 429 chickpea accessions from 45 countries provides insights into genome diversity, domestication and agronomic traits. Nat. Genet. 51, 857–864. [DOI] [PubMed] [Google Scholar]
- Varshney, R.K. , Roorkiwal, M. , Sun, S. , Bajaj, P. , Chitikineni, A. , Thudi, M. et al. (2021) A chickpea genetic variation map based on the sequencing of 3,366 genomes. Nature 599, 622–627. [DOI] [PMC free article] [PubMed] [Google Scholar]
- Vavilov, N.I. (1926) Studies on the Origin of Cultivated Plants. Leningrad, 1951.
- Walker, B.J. , Abeel, T. , Shea, T. , Priest, M. , Abouelliel, A. , Sakthikumar, S. , Cuomo, C.A. et al. (2014) Pilon: an integrated tool for comprehensive microbial variant detection and genome assembly improvement. PLoS One 9, e112963. [DOI] [PMC free article] [PubMed] [Google Scholar]
- Wang, K. , Li, M. and Hakonarson, H. (2010) ANNOVAR: functional annotation of genetic variants from high‐throughput sequencing data. Nucleic Acids Res. 38, e164. [DOI] [PMC free article] [PubMed] [Google Scholar]
- Wang, C. , Liu, C. , Roqueiro, D. , Grimm, D. , Schwab, R. , Becker, C. , Lanz, C. et al. (2015) Genome‐wide analysis of local chromatin packing in Arabidopsis thaliana. Genome Res. 25, 246–256. [DOI] [PMC free article] [PubMed] [Google Scholar]
- Wang, W. , Mauleon, R. , Hu, Z. , Chebotarov, D. , Tai, S. , Wu, Z. et al. (2018) Genomic variation in 3,010 diverse accessions of Asian cultivated rice. Nature 557, 43–49. [DOI] [PMC free article] [PubMed] [Google Scholar]
- Willems, A. , Heyman, J. , Eekhout, T. , Achon, I. , Pedroza‐Garcia, J.A. , Zhu, T. et al. (2020) The cyclin CYCA3; 4 is a postprophase target of the APC/CCCS52A2 E3‐ligase controlling formative cell divisions in Arabidopsis. Plant Cell 32, 2979–2996. [DOI] [PMC free article] [PubMed] [Google Scholar]
- Wu, J. , Wang, L. , Fu, J. , Chen, J. , Wei, S. , Zhang, S. et al. (2020) Resequencing of 683 common bean genotypes identifies yield component trait associations across a north–south cline. Nat. Genet. 52, 118–125. [DOI] [PubMed] [Google Scholar]
- Yamaguchi, H. (1992) Wild and weed azuki beans in Japan. Econ. Bot. 46, 384–394. [Google Scholar]
- Yamaguchi, H. and Nikuma, Y. (1996) Biometric analysis on classification of weed, wild and cultivated azuki beans. J. Weed Sci. Technol. 41, 55–62. [Google Scholar]
- Yan, Q. , Wang, Q. , Xuzhen, C. , Wang, L. , Somta, P. , Xue, C. et al. (2020) High‐Quality Genome Assembly, Annotation and Evolutionary Analysis of the Mung Bean (Vigna Radiata) Genome. Authorea Preprints.
- Yang, X. and Jiang, L. (2010) Starch grain analysis reveals ancient diet at Kuahuqiao Site, Zhejiang Province. Chin. Sci. Bull. 55, 1150–1156. [Google Scholar]
- Yang, K. , Tian, Z. , Chen, C. , Luo, L. , Zhao, B. , Wang, Z. , Yu, L. et al. (2015) Genome sequencing of adzuki bean (Vigna angularis) provides insight into high starch and low fat accumulation and domestication. Proc. Natl. Acad. Sci. U. S. A. 112, 13213–13218. [DOI] [PMC free article] [PubMed] [Google Scholar]
- Zhao, X. and Hao, W. (2007) LTR_FINDER: an efficient tool for the prediction of full‐length LTR retrotransposons. Nucleic Acids Res. 35(Web Server issue), W265–W268. [DOI] [PMC free article] [PubMed] [Google Scholar]
- Zheng, X. , Levine, D. , Shen, J. , Gogarten, S. , Laurie, C. and Weir, B. (2012) A High‐performance Computing Toolset for Relatedness and Principal Component Analysis of SNP Data. Bioinformatics 28, 3326–3328. [DOI] [PMC free article] [PubMed] [Google Scholar]
- Zhou, Z. , Jiang, Y. , Wang, Z. , Gou, Z. , Lyu, J. , Li, W. et al. (2015) Resequencing 302 wild and cultivated accessions identifies genes related to domestication and improvement in soybean. Nat. Biotechnol. 33, 408–414. [DOI] [PubMed] [Google Scholar]
- Zhu, Q. , Zheng, X. , Luo, J. , Gaut, B.S. and Ge, S. (2007) Multilocus analysis of nucleotide variation of Oryza sativa and its wild relatives: severe bottleneck during domestication of rice. Mol. Biol. Evol. 24, 875–888. [DOI] [PubMed] [Google Scholar]
- Zhuang, W. , Chen, H. , Yang, M. , Wang, J. , Pandey, M.K. , Zhang, C. et al. (2019) The genome of cultivated peanut provides insight into legume karyotypes, polyploid evolution and crop domestication. Nat. Genet. 51, 865–876. [DOI] [PMC free article] [PubMed] [Google Scholar]
- Zukovskij, P.M. (1962) Cultivated Plants and their Wild Relatives, p. 107. Farnham Royal, England: Commonwealth Agricultural Bureaux. [Google Scholar]
Associated Data
This section collects any data citations, data availability statements, or supplementary materials included in this article.
Supplementary Materials
Figure S1 Adzuki bean genome Hi‐C hot map.
Figure S2 Contracted and expanded gene families in comparative genomics analysis.
Figure S3 Break and fusion in chromosome 3 and 5 of adzuki bean.
Figure S4 Accessions information in different collection place.
Figure S5 Phenotypes of wild, semi‐wild and cultigen adzuki bean.
Figure S6 AS‐PCR analysis in the GM276 × GM633 F2 population.
Figure S7 Genetic background of CWA124.
Figure S8 SNPs inside VaCycA3;1 and VaHB15 associated with multiple traits.
Table S1 BUSCO Evaluation of adzuki bean Jingnong6 proteins.
Table S2 Repeat sequence annotation statistics.
Table S3 Structural statistics of gene annotation.
Table S4 Structural integrity assessment.
Table S5 BUSCO Evaluation of adzuki bean Jingnong6 genome assembly.
Table S6 Statistics of Speciesinp hylogenetic tree with divergence time.
Table S7 Significantly enriched GO terms and KEGG pathway.
Table S8 The list and origin of Accessions.
Table S9 BWA comparison statistics of 322 accessions.
Table S10 SNP statistics of the whole population.
Table S11 Pi of each Subgroup.
Table S12 Fst between each two Subgroup.
Table S13 Seed coat color of 322 accessions.
Table S14 Primer Information in this study.
Table S15 Candidate genes correlated with multiple agronomic traits.