Abstract
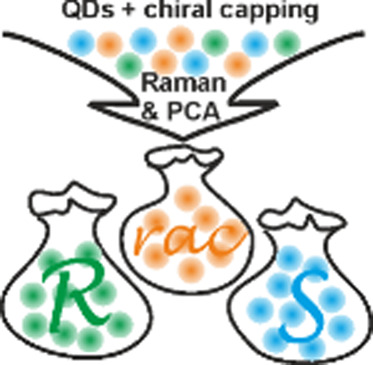
The chiroptical activity of various semiconductor inorganic nanocrystalline materials has typically been tested using circular dichroism or circularly polarized luminescence. Herein, we report on a high-throughput screening method for identifying and differentiating chiroptically active quantum-sized ZnO crystals using Raman spectroscopy combined with principal component analysis. ZnO quantum dots (QDs) coated by structurally diverse homo- and heterochiral aminoalcoholate ligands (cis- and trans-1-amino-2-indanolate, 2-amino-1-phenylethanolate, and diphenyl-2-pyrrolidinemethanolate) were prepared using the one-pot self-supporting organometallic procedure and then extensively studied toward the identification of specific Raman fingerprints and spectral variations. The direct comparison between the spectra demonstrates that it is very difficult to make definite recognition and identification between QDs coated with enantiomers based only on the differences in the respective Raman bands’ position shifts and their intensities. However, the applied approach involving the principal component analysis performed on the Raman spectra allows the simultaneous differentiation and identification of the studied QDs. The first and second principal components explain 98, 97, 97, and 87% of the variability among the studied families of QDs and demonstrate the possibility of using the presented method as a qualitative assay. Thus, the reported multivariate approach paves the way for simultaneous differentiation and identification of chirotopically active semiconductor nanocrystals.
Keywords: quantum dots, chiral environment, mixed ligand shell, zinc oxide, Raman spectroscopy, principal component analysis
1. Introduction
Solution-processable semiconductor nanocrystals (NCs), known also as colloidal quantum dots (QDs),1 with a wide range of unique size-, shape-, and composition-dependent physicochemical properties, are fundamental to modern science and technology.2 Over three decades ago, Louis E. Brus—one of the pioneers of nanochemistry and colloidal QDs—stated that “the enormity of this project is obvious, yet an encouraging start has been made”.3 Indeed, QDs are an important research area in nanoscience and nanotechnology and while the research in the field is constantly moving forward, there are a number of challenges.4 For example, detailed characterization of the ligand shell composition is required to optimize NC properties and surface interactions for a vast array of applications.5−9 Transferring chirality from enantiomeric molecules to colloidal QDs represents another level of tailorability and has attracted immense attention across chemistry, materials, and biomedical science.10,11 Chiroptical properties of NCs arouse interest at the level of basic research,12,13 as well as in the context of various applications, including photonics, catalysis, sensing, and biomedicine.14−18 For instance, nanomaterials fabricated using chiral ligands have aroused substantial interest due to the special chirality-dependent biological effects, and a recent seminal study demonstrated that nanoscale chirality can be exploited to modulate immunological responses19 and various types of chiral nanoparticles have been explored in cancer therapy.20 Hence, the development of chiroptically active colloidal QDs and understanding of their optical activity have been a vital issue of nanoresearch over the past decade21,22 following the first observation of chiroptical activity in CdS QDs prepared by microwave-assisted synthesis in the presence of l- or d-penicillamine by Moloney et al. in 2007.23 This area of research has been dominated by heavy metal-based QDs.24−26 Commonly used protocol for the preparation of metal-based QDs involves postsynthetic ligand replacement by chiral molecules after the achiral pristine particle synthesis has been completed. Nevertheless, while adjusting the chirality of NCs, this approach involving ligand exchange reactions has many disadvantages and, for example, may induce uncontrollable changes to the NC surface upon ligand exchange and ultimately, in many cases, lead to the formation of mixed ligand shells.27,28
The chiroptical activity of QDs is typically tested using electronic circular dichroism,24,25 or circularly polarized luminescence.29,30 In turn, Raman spectroscopy has been used as a powerful method to investigate different properties of nanocrystalline materials (including ZnO) such as composition,31 crystallite size distribution,32,33 disorder and thickness of the ligand shell,34 and changes associated with doping35 or to calculate the surface and interface parameters.36,37 However, to the best of our knowledge, this technique has not been used to differentiate between QDs coated exclusively by single enantiomers and QDs possessing the organic shell composed of a racemic mixture of these enantiomers, even though number of studies of various chiral biologically important entities (e.g., sugars, DNA, proteins, molecules) have demonstrated that Raman spectroscopy (including surface-enhanced Raman spectroscopy,38,39 which provides a way to detect smaller quantities) is a very promising and powerful technique, offering rapid sample screening to distinguish the respective enantiomeric forms.40−42 A critical part of the differentiation strategy based on Raman spectroscopy is the identification of both significant bands and a proper algorithm that can analyze the measured data set.43−45 In this regard, principal component analysis (PCA), as a statistical method, is useful for finding a pattern in Raman data of high dimensions. The efficiency of PCA relies on the ability to transform high-complexity Raman data into a new coordinate principal component (PC) system using an orthogonal linear transformation with the axes oriented to show the maximal variation in the data set.46,47 A dozen scientific papers show the value of PCA, especially in hyperspectral mapping, characterization, detection, identification, and distribution approaches.48−50 As we have mentioned before, the introduction of chiral ligands has been regarded as an effective strategy to obtain nanoclusters with optical purity. Access to such a variety of NCs could be particularly useful in potential investigations on enantiomer-dependent immunological responses to chiral nanoparticles or studies directed to a better understanding of the origin of chiroptical activity in nanostructures.
Interfacing QDs with chiral-ligand-based surface functionalization, including racemic ligand systems, add another level of complexity, making it difficult to probe the combined system adequately using existing techniques. Herein, we identify specific Raman fingerprints and spectral variations for a model series of ZnO QDs coated with structurally diverse homochiral and heterochiral organic ligands and apply Raman spectroscopy combined with PCA to elaborate a method that allows differentiation between QDs with chiral and racemic shell as well as between QDs of different handedness.
Reports on chiral ZnO nanostructures include various structures like nanosprings, nanospirals, nanohelixes,51,52 or chiral films,53,54 whereas studies on chiroptically active colloidal ZnO QDs are still scarce. For example, l- and d-cysteine-55,56 and l- and d-arginine-coated ZnO QDs57 were prepared by a modified sol–gel method using chiral molecules as a surface stabilizer during synthesis. However, it should be noted that the conventional sol–gel procedure is an attractive synthetic approach yet uncontrollable process leading to QDs with an ill-passivated and unstable surface and a complicated heterogeneous coating shell composed.58−60 Significant progress to the field has been made thanks to the one-pot self-supporting organometallic (OSSOM) procedure, a general synthetic method based on the controlled exposure of [RZn(X)]n-type (X = monoanionic organic ligand) precursors to air at ambient temperature.58,59 The OSSOM approach allowed the preparation of a series of QDs with both a homochiral organic shell composed of strongly anchored enantiomerically pure aminoalcoholate capping ligands, and subnanometer control of size with diameters below 10 nm that are well suited for investigating size-dependent optical properties.61 The chiroptical responses originated from the multipoint interactions of aminoalcoholate ligands with the surface through the amine nitrogen and the alcoholate oxygen that can transmit an enantiomeric structural imprint on the ZnO surface. Herein, we selected a pool of enantiomerically pure aminoalcohols and racemic mixtures of those aminoalcohols and prepared a vast array of homo- and heterochiral ligand-coated QDs using the OSSOM procedure. Then, the resulting landscape of QDs was tested as a model system for discrimination of the homo- and heterochiral ligand-coated QDs using Raman spectroscopy combined with PCA as a direct probe.
2. Results and Discussion
2.1. Synthesis of ZnO QDs
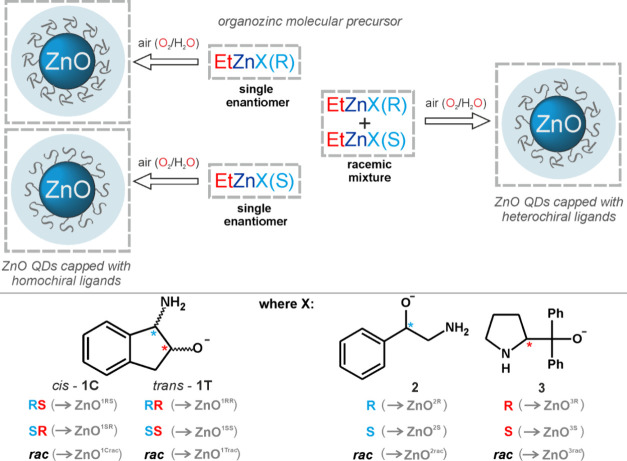
For the purpose of this study, we extended the pool of proligands from previously used enantiomerically pure (1S,2R)- and (1R,2S)-cis-1-amino-2-indanol, S- and R-amino-1-phenylethanol, S- and R-α,α-diphenyl-2-pyrrolidinemethanol to (1S,2S)- and (1R,2R)-trans-1-amino-2-indanol and additionally harnessed racemic mixtures of those aminoalcohols (Figure 1).
Figure 1.
Schematic representation of the self-supporting organometallic (OSSOM) procedure for the preparation of ZnO QDs capped with homochiral or heterochiral ligands.
Rational selection of alkyl zinc molecular precursors incorporating chiral aminoalcoholate ligands in the OSSOM procedure ensures both QDs with alkoxide ligands firmly anchored to the surface and chirality transfer from the ligands to the inorganic core–ligand interface during the QD synthesis.61 Thus, in the first step, [EtZn(X)]-type organozinc precursors were obtained in the reaction of Et2Zn with the respective amino alcohol as an X–H proligand. Then, in situ generated [EtZn(X)]-type precursors were exposed to air to afford a landscape of ZnO QDs coated with chiral or racemic organic shells, respectively (for details, see Section 4.2). In this vein, we prepared 12 series-connected colloidal QDs that can be divided into four families defined by the character of aminoalcoholate ligands: (i) cis-aminoindanolate-coated QDs (hereinafter denoted as ZnO1C)—this family includes QDs capped by (1R, 2S)-, (1S, 2R)-, and rac-cis-1-amino-2-indanolate (ZnO1RS, ZnO1SR, and ZnO1Crac, respectively); (ii) trans-aminoindanolate-coated ZnO1T: (1R, 2R)-, (1S, 2S)-, and rac-trans-1-amino-2-indanolate-capped ZnO1RR, ZnO1SS, and ZnO1Trac, respectively; (iii) aminophenylethanolate-coated ZnO2: R-, S-, and rac-amino-1-phenylethanolate-capped ZnO2R, ZnO2S, and ZnO2rac, respectively; and (iv) diphenylpyrrolidinemethanolate-coated ZnO3: R-, S-, and rac-diphenyl-2-pyrrolidinemethanolate-capped ZnO3R, ZnO3S, and ZnO3rac, respectively. The resulting QDs differ not only by the coating organic ligand but also by the inorganic core size determined by the character of aminoalcoholate ligands. A close relationship between the size of the core and the X-type ligand used is a typical feature of the OSSOM procedure.58,61,62 All nanomaterials exhibit relatively low polydispersity, and the average sizes of the inorganic cores of the resulting QDs are about 1.7 nm for ZnO1C and ZnO1T and about 3 and 7 nm for ZnO2 and ZnO3, respectively (Figures S1–S18). Interestingly, the inorganic core sizes of ZnO1T capped by trans-aminoindanolates are similar to that of ZnO1C capped by cis-aminoindanolates (Figures S1–S10).
2.2. Characterization of Homo- vs Heterochiral Ligand Shell of QDs Using Raman Spectroscopy
In the next step, the families of ZnO1C, ZnO1T, ZnO2, and ZnO3 QDs were characterized using Raman spectroscopy to identify specific Raman fingerprints and spectral variations for each family. ZnO QDs crystallize in the wurtzite structure with the hexagonal C6v4(P63mc) space group, and according to the group theory, the existence of the following optic modes is expected: Γ = A1 + 2B1 + E1 + 2E2. Both B1 (low) and B1 (high) modes are normally silent, while A and E modes are polar and split into transverse optical (TO) and longitudinal optical (LO) phonons.63−65 In relation to the selection rules, A1, E1, and E2 modes are Raman active while B1 is forbidden. All these Raman active phonon modes can be recognized as the characteristic bands of ZnO hexagonal wurtzite phase in the low wavenumber region (350–500 cm–1).66
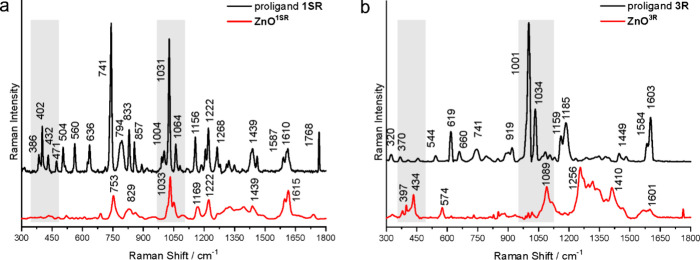
The spectra of both aminoalcoholate ligand-coated QDs and respective amino alcohol proligands (for comparison) were recorded in the 300–1800 cm–1 region (Figure 2 and Figure S21). The binding of aminoalcoholate ligands to the ZnO surface results in the substantial spectral differences due to the core–ligand interactions, and the most pronounced differences in the spectra of QDs and proligands are observed in the two regions, i.e., 350–500 and 950–1150 cm–1. The low wavenumber region is characteristic for the ZnO modes33,66,67 and thus is especially important for the analysis. The second region is dominated by the coating aminoalcoholate ligand vibrations68,69 and contains the most intensive bands observed for all studied ligands (Figure 2 and Figure S21), but in some instances, the ZnO combination modes and overtones are present.33 Generally, structurally diverse ligands bonded to the surface differently influence the force constants and vibrational amplitudes of the nearest-neighbor bonds, which directly implicates the changes in intensities of the bands related ligand bond vibrations. Thus, different spectral effects are expected for QDs with specific ligand shells. For example, for (1S,2R)-cis-1-amino-2-indanol, a large diversity of Raman bands in the region 350–500 cm–1 is observed (Figure 2a) and the analogous spectral features for other aminoindanols are noticed (Figure S21a,b). However, a different situation is noticed for the spectra of the respective QDs. In this spectral region, for ZnO1C and ZnO1T, either only a few low-intensity bands are observed (Figure S21a,b) or no bands, as it is in the case of the ZnO1SR (Figure 2a). This indicates that due to the core–ligand interactions, the overlapping of the less intense ZnO modes for ZnO1C and ZnO1T, a so-called screening effect, appeared. In turn, only a few low-intensity bands are observed in the spectra of diphenyl-2-pyrrolidinemethanols and aminophenylethanols. Thus, in this case, a specific spectral window appears for detecting vibrational modes of the ZnO inorganic core in the ZnO2 and ZnO3 families (Figure 2b and Figure S21b,c).
Figure 2.
Raman spectra of ZnO1SR and (1S,2R)-cis-1-amino-2-indanol (a) and ZnO3R and R-diphenyl-2-pyrrolidinemethanol (b).
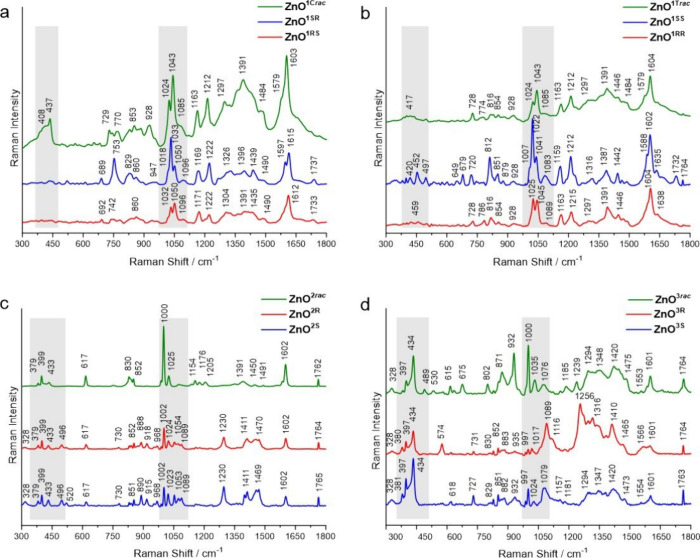
Analysis of the spectra recorded for ZnO1RS and ZnO1SR capped with homochiral cis-aminoindanolates demonstrates that the patterns in the low wavenumber region, due to the homochiral shell and ZnO QD interaction, are essentially featureless (Figure 3a and Figures S21a and S22a) whereas for ZnO1Crac with the heterochiral shell, two overlapping bands at 408 and 437 cm–1 are present (Figure 3a and Figure S22a). These bands are attributed to E1(TO) and E2H ZnO modes. Remarkably, differences in the band intensities for trans-aminoindanolate-coated ZnO1RR and ZnO1SS are observed (Figure 3b and Figure S22b). The spectrum of ZnO1RR is generally featureless with a few bands of very low intensities (slightly above the noise level), while for ZnO1SS, relatively sharp bands of low intensity at 420, 452, and 497 cm–1 are detected and assigned as E2 of ZnO (the first band) while two others are due to ligand vibration. For ZnO1Trac, only one weak broad band at 417 cm–1 is present (Figure 3b). Due to the broad shape of this band and its small intensity, the assignment of this band is not straightforward and, therefore, cannot be unambiguously recognized as vibration coming from the ligand or ZnO core. In contrast, in the case of ZnO2 and ZnO3 families, due to the spectral window for the respective proligands (Figures S21c,d and S22c,d), the observation of ZnO modes and their assignment is essentially simpler. For the aminophenylethanolate-coated ZnO2, in the low-wavenumber region, the band intensity is increasing, resulting in the appearance of bands characteristic for ZnO QDs with the hexagonal wurtzite structure (Figure 3c). Moreover, the intensity of these bands is strong enough to be observed in the Raman spectra recorded for ZnO2R, ZnO2S, and ZnO2rac. Thus, bands at 328, 379, 399, and 433 cm–1 are recognized as the respective E2H-E2L, A1 (TO), E1(TO), and E2H ZnO modes. What should be highlighted is the increased intensity of the E1(TO) mode at 399 cm–1 with respect to the intensities of three other modes. This is most probably due to the interaction with the ligand vibrations, especially in the case of ZnO2S (Figure S22c). Remarkably, for the diphenylpyrrolidinemethanolate-coated ZnO3 (Figure 3d), all observed bands for this region are due to the ZnO vibration, as no Raman bands are observed in the spectrum of the respective proligands (Figures S21d and S22d). Thus, bands at 328, 381, 397, and 434 cm–1 are related to E2H–E2L, A1(TO), E1(TO), and E2H ZnO modes (Figure 3d).
Figure 3.
Raman spectra of ZnO1SR, ZnO1RS, and ZnO1Crac (a); ZnO1SS, ZnO1RR, and ZnO1Trac(b); ZnO2R, ZnO2S, and ZnO2rac (c); and ZnO3R, ZnO3S, and ZnO3rac (d). Each spectrum is averaged from 40 origin spectra.
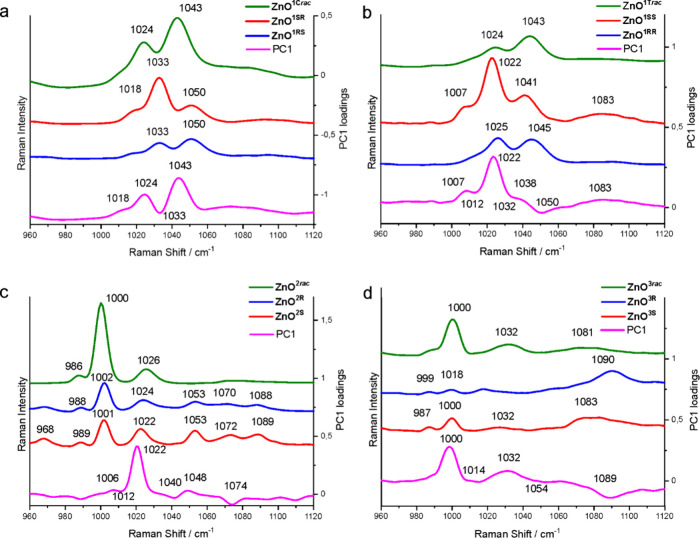
The second highlighted spectral region (950–1150 cm–1, Figure 3) is mostly dominated by the coating ligand vibrations; however, the observed bands are broadened due to the core–ligand interactions (Figures S21 and S23). In this area, ZnO combination modes and overtones are also present. Nevertheless, the assignment of these modes is complicated due to the bands overlapping; particularly, the high-intensity ligand bands often cause a screening effect of usually less intense ZnO combination modes. The spectra of ZnO1C and ZnO1T in this region are less informative, but the patterns recorded for ZnO2 and ZnO3 allow for deconvolution of the Raman bands and their detailed assignment (Figure S24). Thus, the bands at 968 and 997 cm–1 are typical for ZnO modes and are assigned to A1(LO) overtones and those at 1089 and 1157 cm–1 as E1 + A1 and E2 + A1 combination modes (Figure 3c,d and Figure S24). Further spectral analysis of ZnO1C and ZnO1T shows mutual changes of intensities of the two most remarkable bands above 1000 cm–1 (Figure 3a,b). Generally, for the heterochiral cis- and trans-aminoindanolate-capped QDs, the band at 1043 cm–1 dominates over the band at 1024 cm–1. The band at 1043 cm–1 is recognized as out-of-plane CH bending and CC stretching ligand vibrations; the band at 1024 cm–1 to the out-of-plane CH bending and mixed rocking vibrations of CH, NH2, and Zn–Oalkoxide.
In the spectra of ZnO1SR and ZnO1SS with homochiral 1S,2R- and 1S,2S-aminoindanolates, respectively, the bands at 1033 or 1022 cm–1 are dominating over the second band at a higher wavenumber (1050 or 1041 cm–1). However, in the case of ZnO1RS and ZnO1RR with the homochiral 1R,2S- and 1R,2R-aminoindanolate, respectively, two bands have comparable intensities (1032 and 1050 cm–1 or 1025 and 1045 cm–1, respectively). A different situation is observed in the spectra of ZnO2 and ZnO3 families. For the heterochiral ligand-capped ZnO2rac and ZnO3rac, the bands around 1000 cm–1 (which are attributed to the ligand skeletal mixing modes of out-of-plane bending CH and CCC) dominate over two other weak bands (1025 and 1072 cm–1 or 1035 and 1076 cm–1, respectively). The bands at 1072 and 1076 cm–1 are recognized as out-of-plane bending CH and stretching CO and in-plane bending CC ligand vibrations. At the same time, for the homochiral ligand-coated QDs (ZnO2R, ZnO2S and ZnO3R, ZnO3S), the intensities of the respective bands around 1000 cm–1 are remarkably reduced (Figure 3c,d). Interestingly, in the case of the spectra recorded for ZnO2R and ZnO2S (Figure 3c), two new bands at 968 cm–1 (attributed to the CC stretching of the five-membered ring and the out-of-plane NH and CCN bending vibrations) and at 1053 cm–1 (ZnO overtones) are detected. In turn, for ZnO3R and ZnO3S, increasing intensity and broadening of bands at 1079 or 1089 cm–1 are visible (Figure 3d). The tentative assignments of all vibrations of QDs observed in the Raman spectra are shown in Table S2.
The above analysis clearly demonstrates that it is very difficult to make definite recognition and identification between QDs coated with different chiral ligands based only on the differences of the respective Raman bands’ position shifts and their intensities. Generally, the characteristics of the obtained spectra are influenced by appearance of modes related to the inorganic core, the core–ligand interactions, and ligand vibrations. Therefore, an additional method is desired to enhance the Raman fingerprint recognition and get a more in-depth understanding of the vibrational spectra in relation to the chirality of the studied QDs. To tackle this challenge, PCA was applied.
2.3. PCA of the Raman Data
PCA transforms a large number of original correlated variables (Raman data) into a smaller number of uncorrelated variables called PCs. PCA can be described as uncorrelated linear combination of the original variables (X) as X = t1p′1 + t2p′2+ ... + tAp′A + E = TP + E, where A is the total number of extracted PCs, t (scores) and p (loadings) are the new latent variables, and E is the residual matrix. The scores show how the studied data are related to each other while the loadings reveal the importance of the original variables for the patterns seen in the scores. Thus, we examined the calculated scores and loadings for the most important PCs, as determined from percent variance plots, and used them to investigate changes in the spectral features of the Raman data and to indicate the most important variables (fingerprints) and regions related to the differences or similarities found in the Raman data set.
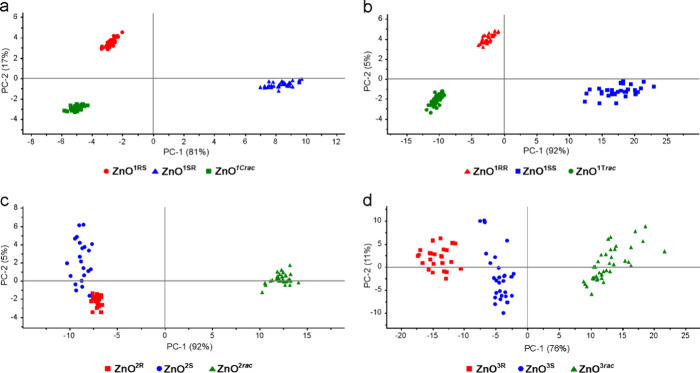
Initially, PCA calculations performed for the whole recorded spectral region (200–2000 cm–1) show that the first and second principal components (PC1 + PC2) carry 98, 94, 89, and 76% of the variation among cis- and trans-aminoindanolate-, aminophenylethanolate-, and diphenylpyrrolidinemethanolate-capped QDs (Figure S24). Then, the PCA performed for the data in the 960–1120 cm–1 spectral region (Figure 4) revealed that the first and the second principal components (PC1, PC2) are the most significant and explain 98, 97, 97, and 87% of the variance in the data of ZnO1C, ZnO1T, ZnO2, and ZnO3 families. The sums of PC1 and PC2 values for all QDs families are shown in Table S3. In the case of ZnO1C and ZnO1T, the scores calculated for homochiral ligand-capped ZnO1RS and ZnO1SR or ZnO1SS and ZnO1RR are separated from the scores of heterochiral ligand-capped ZnO1Crac and ZnO1Trac by the PC1 and PC2 axes (Figure 4a and b, respectively). Moreover, the scores of ZnO1RS and ZnO1SR as well as ZnO1SS and ZnO1RR are separated by the PC2 axis. For ZnO2 and ZnO3 families, the PC1 axis divided the calculated scores into two groups characteristic for QDs featuring the homochiral shell (ZnO2S, ZnO2R and ZnO3S, ZnO3R) and the heterochiral shell (ZnO2rac, ZnO3rac; Figure 4c,d). Regarding the data obtained for ZnO2 presented in Figure 4c, it seems that ZnO2S (blue) scores slightly cover ZnO2R (red) scores. However, in 3D plot projection (Figure S25), all scores presented for the ZnO2 family are nicely separated. Notably, the calculated scores for heterochiral ligand-capped ZnO2rac and ZnO3rac are located in close proximity to the PC2 axis, but at the same time on the positive side of the PC1 axis, while the scores of homochiral ligand-capped ZnO2 and ZnO3 are on the negative side of the PC1 axis. It should be mentioned that with the smaller differences between the spectra, the respective scores are closer to each other.
Figure 4.
PCA scores of ZnO1SR, ZnO1RS, and ZnO1Crac (a); ZnO1SS, ZnO1RR, and ZnO1Trac (b); ZnO2R, ZnO2S, and ZnO2rac (c); and ZnO3R, ZnO3S, and ZnO3rac (d) for the 960–1120 cm–1 region.
For all studied QDs, each group of scores is significantly separated, and the differentiation is straightforward and thus can be limited to the first and second PCs. The data proves that a combination of Raman spectroscopy and PCA can be successfully used for the qualitative assay of chiroptically active QDs. Further analysis concerning the loadings of obtained PCs was performed in order to provide information on the intermolecular interactions based on the loading contributions (weightings) onto individual PCs and the variables (wavenumber of the spectrum) that are important for differentiation. Such an approach may reveal the variables corresponding to the most variability among the bands observed in the Raman spectra and stress the importance of the given molecular interactions observed as Raman bands indicating the fingerprints. Figure 5 shows the Raman spectra of studied QDs together with the PC1 loadings. Additionally, Table S3 presents the weighted variables in the loading of PC1. For ZnO1SR, ZnO1SR, and ZnO1Crac, the variable at 1043 cm–1 has the largest weights (Figure 5a). Moreover, two other bands at 1024 and 1018 cm–1 have a small contribution to PC1 in the same direction as the most intensive one, while bands at 1033 and 1057 cm–1, both in the opposite direction, have much smaller influences on the PC1 value. The PC1 loadings of ZnO1SS, ZnO1RR, and ZnO1Trac show that the variable at 1022 cm–1 has the largest weight (Figure 5b). The variables at 1007, 1038, and 1083 cm–1 have a small contribution to PC1 in the same direction as the variable at 1022 cm–1, while bands at 1012, 1032, and 1050 cm–1 have a weight in the opposite direction. Taking into account the weight of each of these PC1 loadings (Table S3), it is obvious that within aminoindolate-capped QDs, there are two main bands in the Raman spectra that can work as fingerprints, i.e., the band at 1043 cm–1 for ZnO1C and the band at 1022 cm–1 for ZnO1T. For the ZnO2 family the variable at 1022 cm–1 and for the ZnO3 family at 1000 cm–1 have the largest weights on the calculated PC1 values (Figure 5c,d).
Figure 5.
Raman spectra and PC1 loadings for ZnO1SR, ZnO1RS, and ZnO1Crac (a); ZnO1SS, ZnO1RR, and ZnO1Trac (b); ZnO2R, ZnO2S, and ZnO2rac (c); and ZnO3R, ZnO3S, and ZnO3rac (d).
In the next step, we wondered if the elaborated method of differentiation can be applied to differentiate between QDs capped with homochiral cis- and trans-1-amino-2-indanolate ligands, i.e., ZnO1RS, ZnO1SR, ZnO1RR, and ZnO1SS. With this aim, the PCA calculations were performed based on the Raman spectra recorded in the whole 200–2000 cm–1 region (Figure S26) and for the 960–1120 cm–1 region, including the most prominent bands (Figure 6). The calculated sum of PC1 and PC2 values for the reduced region explained 96% of the total variance among the studied samples (Table S3). The calculated scores for ZnO1RS and ZnO1SR, both coated with cis-aminoindanolate ligands, are on the negative side of the PC1 axis, while the scores of both trans-isomer-coated ZnO1RR and ZnO1SS are gathered on the positive side of the PC1 axis. Interestingly, the calculated scores of ZnO1RS and ZnO1SR are gathered in two groups on the negative side of the PC1 and PC2 axes. Meanwhile, it is possible to make a differentiation between ZnO1RR and ZnO1SS based on the PC2 axis. Thus, the data strongly indicate the possibility of simultaneous classification among four ZnO QDs capped with different forms of chiral aminoindanolate ligands. Furthermore, to identify bands that are the most significant for differentiation purposes, the loadings of the first principal component (PC1) were plotted against the Raman data, indicating the 1022 cm–1 variable as the most important, and with the highest and positive weights on the finally calculated value of PC1 (Figure S27). Furthermore, the PC1 value is also influenced by three other lower-weighted bands at 1006, 1042, and 1082 cm–1. Variables with the opposite direction at 1012 and 1033 cm–1 are weighted almost zero (Table S3).
Figure 6.
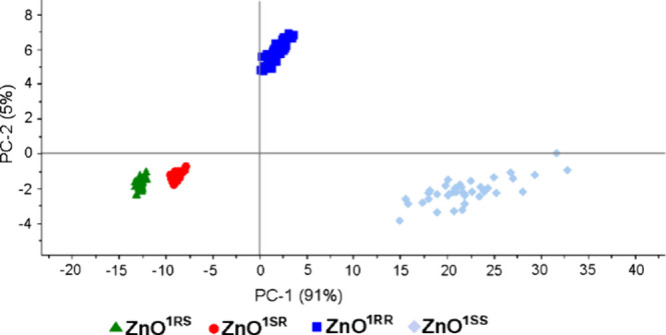
PCA scores of ZnO1RS, ZnO1SR, ZnO1RR, and ZnO1SS for the 960–1120 cm–1 region.
Finally, a control experiment was performed to check if it is possible to use PCA to differentiate between QDs with a heterochiral ligand shell (i.e., QDs coated with a racemic mixture of enantiomers) and the respective mixture of homochiral ligand-coated QDs. For this purpose, a solid–solid mixture of ZnO1RS and ZnO1SR in the 1:1 ratio was prepared by mechanical mixing. All bands observed in the Raman spectrum of the ZnO1RS and ZnO1SR mixture are comparable to that observed for ZnO1Crac as well as to that gathered independently for ZnO1RS and ZnO1SR (Figure S28). Nevertheless, PCA calculations based on the Raman spectra for the 200–2000 cm–1 (Figure S29) and 960–1120 cm–1 (Figure 7) regions enable to differentiate efficiently between ZnO1Crac and a mixture of ZnO1RS and ZnO1SR. The scores of ZnO1Crac and the scores of the ZnO1RS and ZnO1SR mixture are separated by the PC1 axis. The calculated sum of PC1 and PC2 values for the 960–1120 cm–1 region explained 92% of the total variance among the studied samples.
Figure 7.
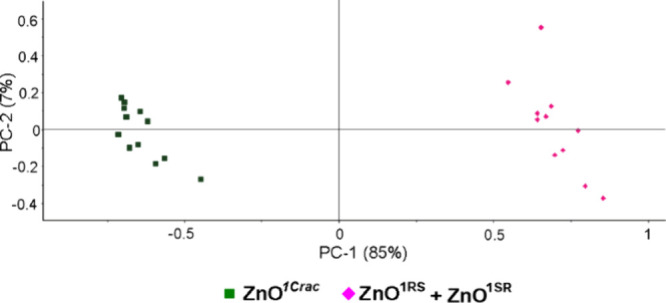
PCA scores of ZnO1rac and a mixture of ZnO1RS and ZnO1SR for the 960–1120 cm–1 region.
3. Conclusions
Characterization of NCs with ligand shells composed of mixed ligands remains a particularly great challenge, and interfacing QDs with optically active and racemic ligand systems introduces another level of entanglement. In this report, we combined an experimental analysis and PCA of the Raman spectra of ZnO QDs coated by structurally diverse homo- and heterochiral aminoalcoholate ligands. PCA significantly mitigates the Raman band analysis to the most important variables (fingerprints), with the highest weighting on the differentiation among the samples. For example, the analysis indicated that bands dominated by aminoalcoholate ligand vibrations at 1043 cm–1 (ZnO1C), 1022 cm–1 (ZnO1T), 1022 cm–1 (ZnO2), and 1000 cm–1 (ZnO3) play the most important role for the differentiation purposes. The calculated values of PC1 + PC2 explain 98, 97, 97, and 87% (ZnO1C, ZnO1T, ZnO2, and ZnO3, respectively) variance among studied samples. Holistically, this work demonstrates that the presented high-throughput screening method is a powerful technique for the fingerprint identification and allows efficient differentiation between QDs with homochiral ligand shells, and also QDs coated with a racemic mixture of enantiomers.
4. Methods
4.1. Materials
Diethylzinc (ABCR) was used as solution in dry hexane. (1S)-2-Amino-1-phenylethanol (ABCR), (1R)-2-amino-1-phenylethanol (ABCR), (1R,2S)-cis-1-amino-2-indanolate (Aldrich), (1S,2R)-cis-1-amino-2-indanolate (Aldrich), (1S,2S)-trans-1-amino-2-indanolate (Aldrich), (1R,2R)-trans-1-amino-2-indanolate (Aldrich), (R)-α,α-diphenyl-2-pyrrolidinemethanol (Aldrich), and (S)-α,α-diphenyl-2-pyrrolidinemethanol (Aldrich).
4.2. Zinc Oxide QD Synthesis
ZnO QDs were prepared using a previously reported procedure.61 To a THF solution of selected aminoalcohol (1.0 mmol), diethylzinc in hexane (0.5 mL, 1.0 mmol) was added dropwise and stirred at ca. −40 °C for several minutes. Then, the reaction mixture was allowed to warm to room temperature, stirred for 2 h, and exposed to oxygen and water from air for 5 days. Hexane was added to separate ZnO QDs (except for ZnO3) from the parent THF solution. To remove excess aminoalcohol liberated during ZnO synthesis, ZnO1C, ZnO1T, and ZnO2 were dissolved in THF participated by hexane three times and ZnO3 was washed several times with THF.
4.3. Raman Spectroscopy Measurements
Raman spectroscopy measurements were carried out in the mapping mode (1 μm × 1 μm). The spectra were taken in different places of the sample using the Renishaw inVia Raman system equipped with the 785 nm diode laser. The light from the laser was passed through a line filter and focused on a sample mounted on an X–Y–Z translation stage with a 50× microscope objective, NA = 0.25. The beam diameter was approximately 2.5 μm. The laser power at the sample was 5 mW or less. Raman data were collected from three different batches (three samples for each type of QDs) in at least 10 different places.
4.4. PCA
PCA was performed over the preprocessed Raman spectra. First, Raman spectra were smoothed with a Savitsky–Golay filter, the background was removed using baseline correction (10 AQitenary and 64 points), and then the spectra were normalized using a so-called min–max normalization using a built-in OPUS software package (Bruker Optic GmbH 2012 version). After that, the data were transferred to the Unscrambler software (CAMO software AS, version 10.3, Norway), where the PCA calculation was performed based onto the NIPALS algorithm, validation (random with 20 segments), significance 0.05, and the 90 number of samples (Raman spectra).
Acknowledgments
This research was supported by the National Science Centre (Grant MAESTRO 11, No. 2019/34/A/ST5/00416).
Supporting Information Available
The Supporting Information is available free of charge at https://pubs.acs.org/doi/10.1021/acsami.4c07648.
Additional QD characterization data: TEM, CD, Raman, and PCA (PDF)
Author Contributions
§ E.C. and A.A.K. contributed equally. E.C., A.A.K., and J.L. contributed to the conception and experiment design. E.C. carried out material synthesis and characterization. A.A.K. carried out Raman and PCA characterization. J.L. supervised the project. The manuscript was written through contributions of all authors. All authors have given approval to the final version of the manuscript.
The authors declare no competing financial interest.
Supplementary Material
References
- Efros A. L.; Brus L. E. Nanocrystal Quantum Dots: From Discovery to Modern Development. ACS Nano 2021, 15 (4), 6192–6210. 10.1021/acsnano.1c01399. [DOI] [PubMed] [Google Scholar]
- Montanarella F.; Kovalenko M. V. Three Millennia of Nanocrystals. ACS Nano 2022, 16 (4), 5085–5102. 10.1021/acsnano.1c11159. [DOI] [PMC free article] [PubMed] [Google Scholar]
- Steigerwald M. L.; Brus L. E. Semiconductor Crystallites: A Class of Large Molecules. Acc. Chem. Res. 1990, 23 (6), 183–188. 10.1021/ar00174a003. [DOI] [Google Scholar]
- Liz-Marzán L. M.; Artzi N.; Bals S.; Buriak J. M.; Chan W. C. W.; Chen X.; Hersam M. C.; Kim I. D.; Millstone J. E.; Mulvaney P.; Parak W. J.; Rogach A.; Schaak R. E. Celebrating a Nobel Prize to the “Discovery of Quantum Dots, an Essential Milestone in Nanoscience. ACS Nano 2023, 17 (20), 19474–19475. 10.1021/acsnano.3c09671. [DOI] [PubMed] [Google Scholar]
- Elimelech O.; Oded M.; Harries D.; Banin U. Spontaneous Patterning of Binary Ligand Mixtures on CdSe Nanocrystals: From Random to Janus Packing. ACS Nano 2023, 17 (6), 5852–5860. 10.1021/acsnano.2c12676. [DOI] [PMC free article] [PubMed] [Google Scholar]
- Pang Z.; Zhang J.; Cao W.; Kong X.; Peng X. Partitioning Surface Ligands on Nanocrystals for Maximal Solubility. Nat. Commun. 2019, 10 (1), 1–8. 10.1038/s41467-019-10389-5. [DOI] [PMC free article] [PubMed] [Google Scholar]; 2019 10:1
- Guzman-Juarez B.; Abdelaal A. B.; Reven L. NMR Characterization of Nanoscale Surface Patterning in Mixed Ligand Nanoparticles. ACS Nano 2022, 16 (12), 20116–20128. 10.1021/acsnano.2c03707. [DOI] [PubMed] [Google Scholar]
- Siek M.; Kandere-Grzybowska K.; Grzybowski B. A. Mixed-Charge, PH-Responsive Nanoparticles for Selective Interactions with Cells, Organelles, and Bacteria. Acc. Mater. Res. 2020, 1 (3), 188–200. 10.1021/accountsmr.0c00041. [DOI] [Google Scholar]
- Ong Q.; Luo Z.; Stellacci F. Characterization of Ligand Shell for Mixed-Ligand Coated Gold Nanoparticles. Acc. Chem. Res. 2017, 50 (8), 1911–1919. 10.1021/acs.accounts.7b00165. [DOI] [PubMed] [Google Scholar]
- Xiao L.; An T.; Wang L.; Xu X.; Sun H. Novel Properties and Applications of Chiral Inorganic Nanostructures. Nano Today 2020, 30, 100824 10.1016/j.nantod.2019.100824. [DOI] [Google Scholar]
- Zhao X.; Zang S. Q.; Chen X. Stereospecific Interactions between Chiral Inorganic Nanomaterials and Biological Systems. Chem. Soc. Rev. 2020, 49 (8), 2481–2503. 10.1039/D0CS00093K. [DOI] [PubMed] [Google Scholar]
- Ma W.; Xu L.; de Moura A. F.; Wu X.; Kuang H.; Xu C.; Kotov N. A. Chiral Inorganic Nanostructures. Chem. Rev. 2017, 117 (12), 8041–8093. 10.1021/acs.chemrev.6b00755. [DOI] [PubMed] [Google Scholar]
- Zhao Y.; Xie J.; Tian Y.; Mourdikoudis S.; Fiuza-Maneiro N.; Du Y.; Polavarapu L.; Zheng G. Colloidal Chiral Carbon Dots: An Emerging System for Chiroptical Applications. Advanced Science 2024, 11, 2305797. 10.1002/advs.202305797. [DOI] [PMC free article] [PubMed] [Google Scholar]
- Ma W.; Hao C.; Sun M.; Xu L.; Xu C.; Kuang H. Tuning of Chiral Construction, Structural Diversity, Scale Transformation and Chiroptical Applications. Mater. Horiz 2018, 5 (2), 141–161. 10.1039/C7MH00966F. [DOI] [Google Scholar]
- Fan J.; Kotov N. A. Chiral Nanoceramics. Adv. Mater. 2020, 32 (41), 1906738. 10.1002/adma.201906738. [DOI] [PubMed] [Google Scholar]
- Mondal P. C.; Asthana D.; Parashar R. K.; Jadhav S. Imprinting Chirality in Inorganic Nanomaterials for Optoelectronic and Bio-Applications: Strategies, Challenges, and Opportunities. Mater. Adv. 2021, 2 (23), 7620–7637. 10.1039/D1MA00846C. [DOI] [Google Scholar]
- Wang F.; Yue X.; Ding Q.; Lin H.; Xu C.; Li S. Chiral Inorganic Nanomaterials for Biological Applications. Nanoscale 2023, 15 (6), 2541–2552. 10.1039/D2NR05689E. [DOI] [PubMed] [Google Scholar]
- Wang G.; Zhang H.; Kuang H.; Xu C.; Xu L. Chiral Inorganic Nanomaterials for Bioapplications. Matter 2023, 6 (6), 1752–1781. 10.1016/j.matt.2023.04.002. [DOI] [Google Scholar]
- Xu L.; Wang X.; Wang W.; Sun M.; Choi W. J.; Kim J. Y.; Hao C.; Li S.; Qu A.; Lu M.; Wu X.; Colombari F. M.; Gomes W. R.; Blanco A. L.; de Moura A. F.; Guo X.; Kuang H.; Kotov N. A.; Xu C. Enantiomer-Dependent Immunological Response to Chiral Nanoparticles. Nature 2022, 601 (7893), 366–373. 10.1038/s41586-021-04243-2. [DOI] [PubMed] [Google Scholar]; 2022 601:7893
- Li G.; Zhang X.; Fei X.; Li J.; Liu H.; Liu W.; Yang Y.; Li B.; Liu M.; Yang G.; Zhang T. Chiral FA Conjugated CdTe/CdS Quantum Dots for Selective Cancer Ablation. ACS Nano 2022, 16 (8), 12991–13001. 10.1021/acsnano.2c05517. [DOI] [PubMed] [Google Scholar]
- Gao X.; Han B.; Yang X.; Tang Z. Perspective of Chiral Colloidal Semiconductor Nanocrystals: Opportunity and Challenge. J. Am. Chem. Soc. 2019, 141 (35), 13700–13707. 10.1021/jacs.9b05973. [DOI] [PubMed] [Google Scholar]
- Kuznetsova V.; Gromova Y.; Martinez-Carmona M.; Purcell-Milton F.; Ushakova E.; Cherevkov S.; Maslov V.; Gun’ko Y. K. Ligand-Induced Chirality and Optical Activity in Semiconductor Nanocrystals: Theory and Applications. Nanophotonics 2020, 10 (2), 797–824. 10.1515/nanoph-2020-0473. [DOI] [Google Scholar]
- Moloney M. P.; Gun’ko Y. K.; Kelly J. M. Chiral Highly Luminescent CdS Quantum Dots. Chem. Commun. 2007, 38, 3900–3902. 10.1039/b704636g. [DOI] [PubMed] [Google Scholar]
- Puri M.; Ferry V. E. Circular dichroism of CdSe Nanocrystals Bound by Chiral Carboxylic Acids. ACS Nano 2017, 11 (12), 12240–12246. 10.1021/acsnano.7b05690. [DOI] [PubMed] [Google Scholar]
- Varga K.; Tannir S.; Haynie B. E.; Leonard B. M.; Dzyuba S. V.; Kubelka J.; Balaz M. CdSe Quantum Dots Functionalized with Chiral, Thiol-Free Carboxylic Acids: Unraveling Structural Requirements for Ligand-Induced Chirality. ACS Nano 2017, 11 (10), 9846–9853. 10.1021/acsnano.7b03555. [DOI] [PubMed] [Google Scholar]
- Li G.; Fei X.; Liu H.; Gao J.; Nie J.; Wang Y.; Tian Z.; He C.; Wang J. L.; Ji C.; Oron D.; Yang G. Fluorescence and Optical Activity of Chiral CdTe Quantum Dots in Their Interaction with Amino Acids. ACS Nano 2020, 14 (4), 4196–4205. 10.1021/acsnano.9b09101. [DOI] [PMC free article] [PubMed] [Google Scholar]
- Elimelech O.; Oded M.; Harries D.; Banin U. Spontaneous Patterning of Binary Ligand Mixtures on CdSe Nanocrystals: From Random to Janus Packing. ACS Nano 2022, 17, 5852. 10.1021/acsnano.2c12676. [DOI] [PMC free article] [PubMed] [Google Scholar]
- Kessler M. L.; Kelm J. E.; Starr H. E.; Cook E. N.; Miller J. D.; Rivera N. A.; Hsu-Kim H.; Dempsey J. L. Unraveling Changes to PbS Nanocrystal Surfaces Induced by Thiols. Chem. Mater. 2022, 34 (4), 1710–1721. 10.1021/acs.chemmater.1c03888. [DOI] [Google Scholar]
- Ben-Moshe A.; Teitelboim A.; Oron D.; Markovich G. Probing the Interaction of Quantum Dots with Chiral Capping Molecules Using Circular dichroism Spectroscopy. Nano Lett. 2016, 16 (12), 7467–7473. 10.1021/acs.nanolett.6b03143. [DOI] [PMC free article] [PubMed] [Google Scholar]
- Huo S.; Duan P.; Jiao T.; Peng Q.; Liu M. Self-Assembled Luminescent Quantum Dots To Generate Full-Color and White Circularly Polarized Light. Angew. Chem., Int. Ed. 2017, 56 (40), 12174–12178. 10.1002/anie.201706308. [DOI] [PubMed] [Google Scholar]
- Azhniuk Y. M.; Lopushansky V. V.; Prymak M. V.; Gomonnai A. V.; Zahn D. R. T. Glass-Embedded Quaternary CdS1–x–ySexTey Nanocrystals: Chemical Composition Derived from the Raman Band Intensities. J. Raman Spectrosc. 2017, 48 (3), 485–493. 10.1002/jrs.5068. [DOI] [Google Scholar]
- Doǎan İ.; van de Sanden M. C. M. Direct Characterization of Nanocrystal Size Distribution Using Raman Spectroscopy. J. Appl. Phys. 2013, 114 (13), 134310 10.1063/1.4824178. [DOI] [Google Scholar]
- Yoshikawa M.; Inoue K.; Nakagawa T.; Ishida H.; Hasuike N.; Harima H. Characterization of ZnO Nanoparticles by Resonant Raman Scattering and Cathodoluminescence Spectroscopies. Appl. Phys. Lett. 2008, 92 (11), 113115 10.1063/1.2901159. [DOI] [Google Scholar]
- Lu L.; Xu X. L.; Liang W. T.; Lu H. F. Raman Analysis of CdSe/CdS Core–Shell Quantum Dots with Different CdS Shell. J. Phys.: Condens. Matter 2007, 19 (40), 406221 10.1088/0953-8984/19/40/406221. [DOI] [PubMed] [Google Scholar]
- Zeferino R. S.; Flores M. B.; Pal U. Photoluminescence and Raman Scattering in Ag-Doped Zno Nanoparticles. J. Appl. Phys. 2011, 109 (1), 014308 10.1063/1.3530631. [DOI] [Google Scholar]
- Dzhagan V.; Lokteva I.; Himcinschi C.; Jin X.; Kolny-Olesiak J.; Zahn D. R. Phonon Raman Spectra of Colloidal Cdte Nanocrystals: Effect of Size, Non-Stoichiometry and Ligand Exchange. Nanoscale Res. Lett. 2011, 6 (179), 1. 10.1186/1556-276X-6-79. [DOI] [PMC free article] [PubMed] [Google Scholar]
- Sahoo S.; Sharma G. L.; Katiyar R. S. Raman Spectroscopy to Probe Residual Stress in ZnO Nanowire. J. Raman Spectrosc. 2012, 43 (1), 72–75. 10.1002/jrs.3004. [DOI] [Google Scholar]
- Arabi M.; Ostovan A.; Wang Y.; Mei R.; Fu L.; Li J.; Wang X.; Chen L. Chiral Molecular Imprinting-Based SERS Detection Strategy for Absolute Enantiomeric Discrimination. Nat. Commun. 2022, 13 (1), 1–14. 10.1038/s41467-022-33448-w. [DOI] [PMC free article] [PubMed] [Google Scholar]; 2022 13:1
- Xu J.; Xue Y.; Jian X.; Zhao Y.; Dai Z.; Xu J.; Gao Z.; Mei Y.; Song Y. Y. Understanding of Chiral Site-Dependent Enantioselective Identification on a Plasmon-Free Semiconductor Based SERS Substrate. Chem. Sci. 2022, 13 (22), 6550–6557. 10.1039/D2SC01938H. [DOI] [PMC free article] [PubMed] [Google Scholar]
- Koch H.; Noack K.; Will S. Raman Excess Spectroscopy vs. Principal Component Analysis: Probing the Intermolecular Interactions between Chiral Molecules and Imidazolium-Based Ionic Liquids. Phys. Chem. Chem. Phys. 2016, 18 (40), 28370–28375. 10.1039/C6CP04372K. [DOI] [PubMed] [Google Scholar]
- Bonnier F.; Mehmood A.; Knief P.; Meade A. D.; Hornebeck W.; Lambkin H.; Flynn K.; McDonagh V.; Healy C.; Lee T. C.; Lyng F. M.; Byrne H. J. In Vitro Analysis of Immersed Human Tissues by Raman Microspectroscopy. J. Raman Spectrosc. 2011, 42 (5), 888–896. 10.1002/jrs.2825. [DOI] [Google Scholar]
- Bonnier F.; Byrne H. J. Understanding the Molecular Information Contained in Principal Component Analysis of Vibrational Spectra of Biological Systems. Analyst 2012, 137 (2), 322–332. 10.1039/C1AN15821J. [DOI] [PubMed] [Google Scholar]
- van de Sompel D.; Garai E.; Zavaleta C.; Gambhir S. S. A Hybrid Least Squares and Principal Component Analysis Algorithm for Raman Spectroscopy. PLoS One 2012, 7 (6), e38850 10.1371/journal.pone.0038850. [DOI] [PMC free article] [PubMed] [Google Scholar]
- Kiefer J.; Noack K. Universal Enantioselective Discrimination by Raman Spectroscopy. Analyst 2015, 140 (6), 1787–1790. 10.1039/C4AN02218A. [DOI] [PubMed] [Google Scholar]
- Matschulat A.; Drescher D.; Kneipp J. Surface-Enhanced Raman Scattering Hybrid Nanoprobe Multiplexing and Imaging in Biological Systems. ACS Nano 2010, 4 (6), 3259–3269. 10.1021/nn100280z. [DOI] [PubMed] [Google Scholar]
- Sato-Berrú R. Y.; Mejía-Uriarte E. V.; Frausto-Reyes C.; Villagrán-Muniz M.; S H. M.; Saniger J. M. Application of Principal Component Analysis and Raman Spectroscopy in the Analysis of Polycrystalline BaTiO3 at High Pressure. Spectrochim. Acta, Part A 2007, 66 (3), 557–560. 10.1016/j.saa.2006.03.032. [DOI] [PubMed] [Google Scholar]
- Bro R.; Smilde A. K. Principal Component Analysis. Analytical Methods 2014, 6 (9), 2812–2831. 10.1039/C3AY41907J. [DOI] [Google Scholar]
- Witkowska E.; Korsak D.; Kowalska A.; Księżopolska-Gocalska M.; Niedziółka-Jönsson J.; Roźniecka E.; Michałowicz W.; Albrycht P.; Podrażka M.; Hołyst R.; Waluk J.; Kamińska A. Surface-Enhanced Raman Spectroscopy Introduced into the International Standard Organization (ISO) Regulations as an Alternative Method for Detection and Identification of Pathogens in the Food Industry. Anal. Bioanal. Chem. 2017, 409 (6), 1555–1567. 10.1007/s00216-016-0090-z. [DOI] [PMC free article] [PubMed] [Google Scholar]
- Shi Z.; Castro C. E.; Arya G. Conformational Dynamics of Mechanically Compliant DNA Nanostructures from Coarse-Grained Molecular Dynamics Simulations. ACS Nano 2017, 11 (5), 4617–4630. 10.1021/acsnano.7b00242. [DOI] [PubMed] [Google Scholar]
- Fernandez M.; Wilson H. F.; Barnard A. S. Impact of Distributions on the Archetypes and Prototypes in Heterogeneous Nanoparticle Ensembles. Nanoscale 2017, 9 (2), 832–843. 10.1039/C6NR07102C. [DOI] [PubMed] [Google Scholar]
- Kong X. Y.; Wang Z. L. Polar-Surface Dominated ZnO Nanobelts and the Electrostatic Energy Induced nanohelixes, nanosprings, and Nanospirals. Appl. Phys. Lett. 2004, 84 (6), 975–977. 10.1063/1.1646453. [DOI] [Google Scholar]
- Gao P. X.; Ding Y.; Mai W.; Hughes W. L.; Lao C.; Wang Z. L. Materials Science: Conversion of Zinc Oxide Nanobelts into Superlattice-Structured Nanohelices. Science 2005, 309 (5741), 1700–1704. 10.1126/science.1116495. [DOI] [PubMed] [Google Scholar]
- Stefanelli M.; Magna G.; Zurlo F.; Caso F. M.; Di Bartolomeo E.; Antonaroli S.; Venanzi M.; Paolesse R.; Di Natale C.; Monti D. Chiral Selectivity of Porphyrin-ZnO Nanoparticle Conjugates. ACS Appl. Mater. Interfaces 2019, 11 (12), 12077–12087. 10.1021/acsami.8b22749. [DOI] [PubMed] [Google Scholar]
- Duan Y.; Han L.; Zhang J.; Asahina S.; Huang Z.; Shi L.; Wang B.; Cao Y.; Yao Y.; Ma L.; Wang C.; Dukor R. K.; Sun L.; Jiang C.; Tang Z.; Nafie L. A.; Che S. Optically Active Nanostructured ZnO Films. Angew. Chem., Int. Ed. 2015, 54 (50), 15170–15175. 10.1002/anie.201507502. [DOI] [PubMed] [Google Scholar]
- Lin J.; Huang B.; Dai Y.; Wei J.; Chen Y. Chiral ZnO Nanoparticles for Detection of Dopamine. Materials Science and Engineering: C 2018, 93, 739–745. 10.1016/j.msec.2018.08.036. [DOI] [PubMed] [Google Scholar]
- Fan X.; Ren C.; Ning K.; Shoala M. A.; Ke Q.; Zhou Y.; Wu Y.; Qiu R.; Liang J.; Xiao S. Enantioselective Antiviral Activities of Chiral Zinc Oxide Nanoparticles. ACS Appl. Mater. Interfaces 2023, 15 (50), 58251–58259. 10.1021/acsami.3c15463. [DOI] [PubMed] [Google Scholar]
- Fan Y.; Lin J.; Li Z.; Wang J.; Wei J. Optical and Antibacterial Properties of Chiral Arginine-Stabilized ZnO Nanoparticles. Langmuir 2023, 39 (11), 4161–4169. 10.1021/acs.langmuir.3c00114. [DOI] [PubMed] [Google Scholar]
- Lee D.; Wolska-Pietkiewicz M.; Badoni S.; Grala A.; Lewiński J.; De Paëpe G. Disclosing Interfaces of ZnO Nanocrystals Using Dynamic Nuclear Polarization: Sol-Gel versus Organometallic Approach. Angew. Chem., Int. Ed. 2019, 58 (48), 17163–17168. 10.1002/anie.201906726. [DOI] [PubMed] [Google Scholar]
- Grala A.; Wolska-Pietkiewicz M.; Danowski W.; Wróbel Z.; Grzonka J.; Lewiński J. ‘Clickable’ ZnO Nanocrystals: The Superiority of a Novel Organometallic Approach over the Inorganic Sol–Gel Procedure. Chem. Commun. 2016, 52 (46), 7340–7343. 10.1039/C6CC01430E. [DOI] [PubMed] [Google Scholar]
- Olejnik-Fehér N.; Jędrzejewska M.; Wolska-Pietkiewicz M.; Lee D.; De Paëpe G.; Lewiński J. On the Fate of Lithium Ions in Sol-Gel Derived Zinc Oxide Nanocrystals. Small 2024, 2309984. 10.1002/smll.202309984. [DOI] [PubMed] [Google Scholar]
- Chwojnowska E.; Wolska-Pietkiewicz M.; Grzonka J.; Lewiński J. An Organometallic Route to Chiroptically Active ZnO Nanocrystals. Nanoscale 2017, 9 (39), 14782–14786. 10.1039/C7NR02843A. [DOI] [PubMed] [Google Scholar]
- Wolska-Pietkiewicz M.; Tokarska K.; Wojewódzka A.; Wójcik K.; Chwojnowska E.; Grzonka J.; Cywiński P. J.; Chudy M.; Lewiński J. ZnO Nanocrystals Derived from Organometallic Approach: Delineating the Role of Organic Ligand Shell on Physicochemical Properties and Nano-Specific Toxicity. Sci. Rep. 2019, 9 (1), 1–14. 10.1038/s41598-019-54509-z. [DOI] [PMC free article] [PubMed] [Google Scholar]; 2019 9:1
- Calleja J. M.; Cardona M. Resonant Raman Scattering in ZnO. Phys. Rev. B 1977, 16, 3753–3761. 10.1103/PhysRevB.16.3753. [DOI] [Google Scholar]
- Zhang X.-H.; Xie S.-Y.; Jiang Z.-Y.; Zhang X.; Tian Z.-Q.; Xie Z.-X.; Huang R.-B.; Zheng L.-S. Rational Design and Fabrication of ZnO Nanotubes from Nanowire Templates in a Microwave Plasma System. J. Phys. Chem. B 2003, 107 (37), 10114–10118. 10.1021/jp034487k. [DOI] [Google Scholar]
- Cuscó R.; Alarcón-Lladó E.; Ibáñez J.; Artús L.; Jiménez J.; Wang B.; Callahan M. J. Temperature Dependence of Raman Scattering in ZnO. Phys. Rev. B 2007, 75, 165202–165211. 10.1103/PhysRevB.75.165202. [DOI] [Google Scholar]
- Zinc Oxide (ZnO) Phonon Wavenumbers: Combination Modes. In II-VI and I-VII Compounds; Semimagnetic Compounds; Springer-Verlag, 2005; pp 1–3. 10.1007/10681719_292. [DOI]
- Dusolle B.; Jubera V.; Ilin E. S.; Martin P.; Philippot G.; Suchomel M. R.; Iversen B. B.; Marre S.; Aymonier C. Formation Mechanism and Excitonic Luminescence of Supercritical-Fluid-Synthesized ZnO Nanoparticles. Chem. Mater. 2023, 35, 4057–4067. 10.1021/acs.chemmater.3c00493. [DOI] [Google Scholar]
- K. S.; Periandy S. Spectroscopic (FT-IR, FT-Raman, UV, NMR, NBO) Investigation and Molecular Docking Study of (R)-2-Amino-1-PhenylEthanol. J. Mol. Struct. 2016, 1117, 240–256. 10.1016/j.molstruc.2016.03.063. [DOI] [Google Scholar]
- Iga H.; Isozaki T.; Suzuki T.; Ichimura T. Conformations of 2-Aminoindan in a Supersonic Jet: The Role of Intramolecular N-H···π Hydrogen Bonding. J. Phys. Chem. A 2007, 111 (27), 5981–5987. 10.1021/jp072072j. [DOI] [PubMed] [Google Scholar]
Associated Data
This section collects any data citations, data availability statements, or supplementary materials included in this article.


