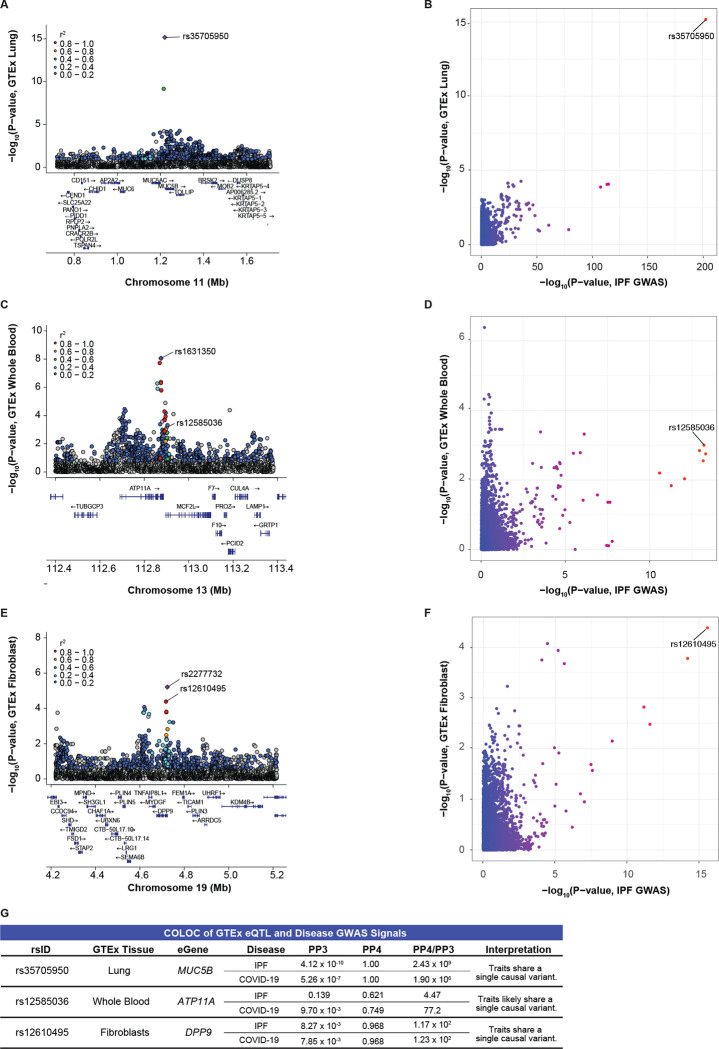
Figure 3: Colocalization of Disease GWAS and GTEx eQTL signals.
(A) LocusZoom plot shows rs35705950 is the lead eQTL (purple diamond) for MUC5B in GTEx lung tissue.
(B) Comparison of −log10(p-values) from the IPF GWAS and MUC5B-eQTLs in GTEx lung tissue shows rs35705950 as the shared lead SNP.
(C) rs12585036 is not the lead eQTL nor in LD with the lead eQTL (rs1631350) for ATP11A in GTEx whole blood.
(D) Comparison of −log10(p-values) from the IPF GWAS and ATP11A-eQTLs in GTEx lung tissue shows rs12585036 as the shared lead SNP.
(E) rs12610495 is in strong LD with the lead eQTL (rs2277732) for DPP9 in GTEx fibroblasts.
(F) Comparison of −log10(p-values) from the IPF GWAS and DPP9-eQTLs in GTEx fibroblasts show rs12610495 as the shared lead SNP.
(G) COLOC indicates strong colocalization between the disease GWAS and MUC5B- and DPP9-eQTL signals in lung and fibroblasts, respectively, with PP4 > 0.900 and PP4/PP3 > 5.00. COLOC suggests colocalization between the COVID-19 GWAS and ATP11A-eQTL signals in whole blood with PP4 > 0.700 and PP4/PP3 > 5.00.
P-values are −log10 transformed. Linkage disequilibrium information for European populations was obtained from LDlink and is relative to the lead variant in each plot.

