Fig. 1.
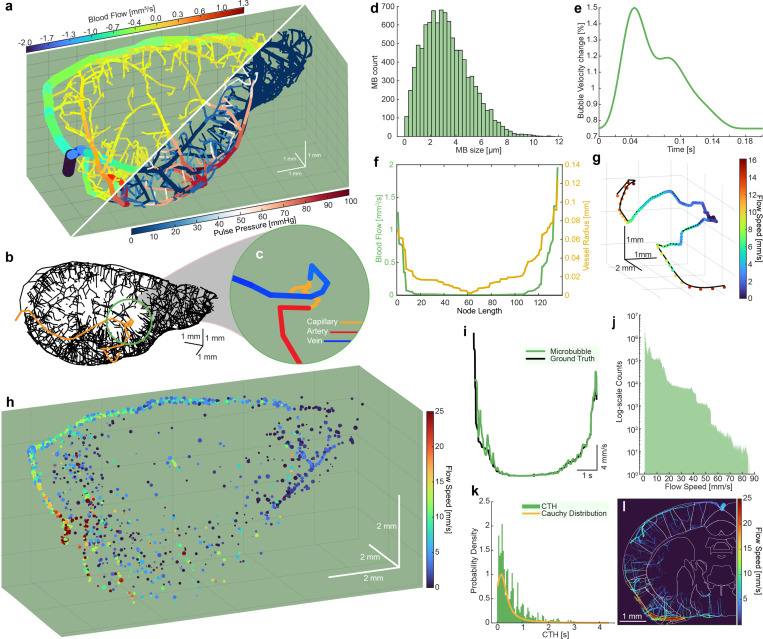
a. Synthetic mouse brain microvascular network with fully-connected capillary networks, blood flow (top), vessel diameter, and pulse pressure (bottom). b. Skeletonized vascular network with a single full vascular path identified. c. Zoomed color-coded image of a single vascular. d. Simulated Definity microbubble distribution from which simulated results are sampled. e. Sample pulsatile waveform calculated using pulse decomposition analysis. f. Sample blood flow and microvessel radius of the path depicted in b-c used to forward propagate simulated microbubbles. g. Resultant microbubble trajectory along path depicted in b-c using initial conditions in d-f. h. Representative fully populated microbubble dataset through the synthetic mouse brain (see Supplemental Video 1). i. Distinct U-shaped velocity profile of the path depicted in b-c,g. j. Log histogram of sampled microbubble velocities throughout the whole dataset in h. k. Sampled capillary heterogeneous transit-times, measured as time required for a microbubble to traverse a capillary network, fitted with a Cauchy distribution. l. Ground truth microbubble paths with the Allen Institute mouse brain atlas overlaid on top, showing regional differences in microbubble flow speed.

