

Abstract
Background
Pulmonary hypertension (PH) and secondary mitral regurgitation (MR) are associated with adverse outcomes after mitral transcatheter edge‐to‐edge repair. We aim to study the prognostic value of invasively measured right ventricular afterload in patients undergoing mitral transcatheter edge‐to‐edge repair.
Methods and Results
We identified patients who underwent right heart catheterization ≤1 month before transcatheter edge‐to‐edge repair. The end points were all‐cause mortality and a composite of mortality and heart failure hospitalization at 2 years. Using the receiver operating characteristic curve–derived threshold of 0.6 for pulmonary effective arterial elastance ([Ea], pulmonary artery systolic pressure/stroke volume), patients were stratified into 3 profiles based on PH severity (low elastance [HE]: Ea <0.6/mean pulmonary artery pressure (mPAP)) <35; High Elastance with No/Mild PH (HE−): Ea ≥0.6/mPAP <35; and HE with Moderate/Severe PH (HE+): Ea ≥0.6/mPAP ≥35) and MR pathogenesis (Primary MR [PMR])/low elastance, PMR/HE, and secondary MR). The association between this classification and clinical outcomes was examined using Cox regression. Among 114 patients included, 50.9% had PMR. Mean±SD age was 74.7±10.6 years. Patients with Ea ≥0.6 were more likely to have diabetes, atrial fibrillation, New York Heart Association III/IV status, and secondary MR (all P<0.05). Overall, 2‐year cumulative survival was 71.1% and was lower in patients with secondary MR and mPAP ≥35. Compared with patients with low elastance, cumulative 2‐year event‐free survival was significantly lower in HE− and HE+ patients (85.5% versus 50.4% versus 41.0%, respectively, P=0.001). Also, cumulative 2‐year event‐free survival was significantly higher in patients with PMR/low elastance when compared with PMR/HE and patients with secondary mitral regurgitation (85.5% versus 55.5% versus 46.1%, respectively, P=0.005).
Conclusions
Assessment of the preprocedural cardiopulmonary profile based on mPAP, MR pathogenesis, and Ea guides patient selection by identifying hemodynamic features that indicate likely benefit from mitral‐transcatheter edge‐to‐edge repair in PH or lack thereof.
Keywords: mitral regurgitation, mitral transcatheter edge‐to‐edge repair, pulmonary effective arterial elastance, pulmonary hypertension, right ventricular afterload
Subject Categories: Catheter-Based Coronary and Valvular Interventions
Nonstandard Abbreviations and Acronyms
- Ea
effective arterial elastance
- PH
pulmonary hypertension
- SMR
secondary mitral regurgitation
- TEER
transcatheter edge‐to‐edge repair
Clinical Perspective.
What Is New?
Pulmonary effective arterial elastance is an attractive hemodynamic parameter associated with worse outcomes after mitral transcatheter edge‐to‐edge repair.
Mitral transcatheter edge‐to‐edge repair in patients with pulmonary hypertension is feasible and improves symptoms irrespective of the degree of pulmonary hypertension.
What Are the Clinical Implications?
Assessment of the preprocedural cardiopulmonary profile based on mean pulmonary artery pressure, mitral regurgitation pathogenesis, and pulmonary arterial elastance allows the risk stratification of patients undergoing mitral transcatheter edge‐to‐edge repair.
Larger studies are needed to validate our results and explore how various types of pulmonary hypertension affect outcomes in this population.
Mitral regurgitation (MR) is a major cause of left‐sided heart disease–related pulmonary hypertension (LHD‐PH). It has a detrimental impact on the structure and hemodynamics of the left atrium and the function of the left ventricle, presumably by promoting the retrograde transmission of pressure to the pulmonary circulation. 1 , 2 LHD‐PH is present in ≈15% to 32% of patients undergoing mitral surgery for MR and is accounted for as a significant risk factor for adverse outcomes postoperatively. 3 , 4 Recently, mitral transcatheter edge‐to‐edge repair (M‐TEER) has emerged as an effective treatment for high‐risk patients with severe MR. 5 Patients with LHD‐PH who are considered at high surgical risk are now viewed as those who derive the greatest absolute benefit from M‐TEER. The cardiovascular outcomes assessment of the MitraClip percutaneous therapy for heart failure patients with functional mitral regurgitation trial showed that M‐TEER reduced 2‐year rates of death or heart failure hospitalization (HFH) compared with guideline‐directed medical therapy alone, irrespective of pulmonary artery systolic pressure (PASP). However, elevated echocardiographic PASP was associated with worse prognosis after M‐TEER. 4
There is increasing evidence that worse mortality in combined pre‐ and postcapillary PH is a result of higher total right ventricular (RV) load in patients with chronic heart failure. 6 Pulmonary effective arterial elastance (Ea), defined as PASP/RV stroke volume, provides a measurement of RV afterload (resistive and pulsatile) that is easily assessed on right heart catheterization and potentially provides more information than pulmonary artery (PA) pressure alone. 7 Ea has been shown to be more consistently associated with RV dysfunction and mortality in patients with LHD‐PH than measures of precapillary disease. 8 To date, only 1 study has evaluated the implications of invasively measured mean pulmonary artery pressure (mPAP) and found a graded association with adverse outcomes after M‐TEER. 9 However, when PH progresses to advanced stages, the RV can no longer compensate and its stroke volume declines, leading to lower PA pressures. 10 Therefore, this study was designed to examine the prognostic value of invasively measured Ea, a parameter that measures PASP and indexes it to the ventricular function, in patients undergoing M‐TEER.
Methods
The data that support the findings of this study are available from the corresponding author upon reasonable request.
Study Population
We reviewed the records of 298 consecutive patients with moderate–severe or severe MR who underwent M‐TEER with MitraClip (Abbott Vascular, Santa Clara, CA) at Houston Methodist Hospital (Houston, TX, USA) from March 2014 to June 2022. As determined by a multidisciplinary heart team based on current guidelines, patients with symptomatic primary MR at high surgical risk and those with secondary MR on maximally tolerated guideline‐directed medical therapy with feasible anatomy underwent the procedure. Patients without preprocedural right heart catheterization (RHC) or RHC >30 days before the procedure were excluded (Table S1). The final patient population included 114 patients. Patients with moderate/severe PH (mPAP ≥35 mm Hg) were compared with patients with none/mild PH (mPAP<35 mm Hg). The area under the curve for mPAP=35 mm Hg in predicting the composite end point was 0.56 (95% CI, 0.46–0.66).
Ea is defined as end systolic pulmonary pressure/stroke volume (SV) and was calculated as Ea=PASP/SV, since the end systolic pulmonary pressure is equivalent to PASP in the setting of PH. 7 Using receiver operating characteristic (ROC) curve–derived threshold of 0.6 for Ea, patients were stratified into 2 groups (Ea <0.6 mm Hg/mL and Ea ≥0.6 mm Hg/mL) that were compared with each other. The area under the curve for Ea in predicting the composite end point was 0.66 (95% CI, 0.56–0.76). Then, the ROC threshold of 0.6 for Ea was used to categorize patients into 3 hemodynamic profiles: low elastance (LE): mPAP <35 mm Hg, Ea <0.6 mm Hg/mL; high elastance with low mPAP (HE−): mPAP <35 mm Hg, and Ea ≥0.6 mm Hg/mL; high elastance with high mPAP (HE+): mPAP ≥35 mm Hg and Ea ≥0.6 mm Hg/mL. We also used the same Ea threshold to stratify and compare patients by MR pathogenesis: (1) PMR/LE; (2) PMR/HE; and (3) secondary mitral regurgitation (SMR). The study was approved by the Houston Methodist Institutional Review Board. All study participants gave written informed consent for the use of their medical records for research purposes. All study procedures were conducted in accordance with the Declaration of Helsinki.
Study Variables, Definitions, and Outcomes
All patients had preprocedural transthoracic echocardiography and transesophageal echocardiography using a standard echocardiography system (i33 instruments; Philips Technology, Amsterdam, Netherlands). American Society of Echocardiography guidelines were used to assess the mechanism and severity of MR as mild (1+), moderate (2+), moderate to severe (3+), and severe (4+). The pathophysiology of MR was classified as primary/degenerative, secondary, or mixed based on guidelines. 11 The following invasive variables were defined as follows: pulmonary artery compliance (PAC): SV/PASP‐PA diastolic pressure, transpulmonary pressure gradient: mean PA pressure‐pulmonary capillary wedge pressure, pulmonary vascular resistance (PVR): transpulmonary pressure gradient/cardiac output, and PA pulsatility index: PASP‐PA diastolic pressure/right atrial pressure. Cardiac output was calculated by using the Fick equation. SV was calculated by dividing the cardiac output by the heart rate at the time of the RHC. Threshold values for these parameters regarding clinical outcomes were determined using ROC curves.
TEER was performed with patients under general anesthesia with transesophageal echocardiography and fluoroscopic guidance. After transseptal puncture, a 24‐F transseptal sheath was used to measure left atrial pressure (LAP) and v‐wave at baseline before clip delivery system insertion. LAP and v‐wave were monitored continuously during the procedure. After the final clip deployment, direct LAP and v‐wave were measured before withdrawal of the sheath from the LA to the right atrium. All patients' medical records were manually reviewed.
The primary end points were defined as all‐cause mortality and a composite of all‐cause mortality and HFH at 2 years. Secondary end points were the degree of MR reduction after M‐TEER, and improvement in New York Heart Association (NYHA) functional class postprocedurally.
Patient Follow‐Up
Our institution is part of a network comprising 8 hospitals in the Houston Metropolitan area, all of which share the same electronic medical record system. Rigorous monitoring of patients undergoing structural interventions, such as M‐TEER, is conducted to meet both Society of Thoracic Surgeons/American College of Cardiology transcatheter valve therapy (STS/ACC TVT) registry requirements and uphold institutional quality and outcome initiatives. Outcome data were meticulously obtained through chart reviews during follow‐up visits with any provider within our health care system, emergency room visits, hospital admissions to any of our system hospitals, and direct communication via phone calls with patients or their next of kin in case of mortality.
Statistical Analysis
Clinical, procedural, hemodynamic, and echocardiographic characteristics were collected for all patients before and after the M‐TEER procedure. For categorical variables, frequencies and percentages were used to describe the data. Mean±SD or median with interquartile range were used to summarize continuous variables. The Kolmogorov–Smirnov test was used for assessment of normality for continuous data. A series of Student t tests was utilized to compare the group means for continuous, symmetrical variables. Nonparametric Wilcoxon rank‐sum tests were used for skewed continuous data. χ2 tests of association or Fisher exact tests (in the event of small counts <5) were used to compare categorical variables.
Univariate parameters associated with the primary end point all‐cause mortality were identified by using Cox regression analysis testing all hemodynamic variables assessed by RHC. The hazard ratios (HRs) of the hemodynamic parameters with 95% CIs were reported. Ea was subsequently included in a ROC analysis using the Youden index to identify thresholds for hemodynamic stratification of patients with prediction of all‐cause mortality and HFH. Kaplan–Meier analysis was used to assess survival estimates for the primary end point in the overall population. Since model building was limited by the relative number of events, variables with P <0.10 from univariate analysis in addition to clinically relevant variables chosen a priori and deemed likely to influence the outcomes of interest were considered for the multivariable Cox regression analysis. The proportional hazards model assumption was tested for all adjustment variables by including a covariate interaction with time in the model, and all covariate interactions with time were nonsignificant at the 0.05 level, indicating no violation of the proportionality assumption. Comparisons were made using the log‐rank test. A 2‐sided P <0.05 was considered statistically significant, and all statistical analyses were performed using SPSS version 24.0 (IBM, Armonk, NY).
Results
Baseline Clinical and Echocardiographic Characteristics
Of the 114 patients (mean±SD age 74.7±10.6 years, 35% female) included in our final analysis, 58 (50.9%) patients had primary MR (PMR), while 49 (43%) patients had SMR, and 7 (6.1%) patients had MR of mixed pathogenesis. All patients had MR grade ≥3+ with NYHA class III/IV present in 95 (86%) patients. Baseline clinical and echocardiographic characteristics are listed in Table 1.
Table 1.
Baseline Clinical, Echocardiographic, Invasive Hemodynamic, and Procedural Characteristics Based on Ea
| Baseline characteristics | Overall | Ea <0.6 | Ea ≥0.6 | P value |
|---|---|---|---|---|
| N=114 | N=35 | N=79 | ||
| Female | 40 (35.1) | 10 (28.6) | 30 (38.0) | 0.33 |
| Age, y | 74.7 [10.6] | 75.0 [11.5] | 74.6 [10.2] | 0.85 |
| Race (White) | 86 (75.4) | 33 (94.3) | 53 (67.1) | 0.02* |
| Diabetes | 35 (30.7) | 5 (14.3) | 30 (38.0) | 0.01* |
| Prior stroke | 19 (16.7) | 6 (17.1) | 13 (16.5) | 0.92 |
| Prior MI | 26 (22.8) | 8 (22.9) | 18 (22.8) | 0.99 |
| Dialysis | 7 (6.1) | 2 (5.7) | 5 (6.3) | 1.00 |
| Atrial fibrillation | 75 (66.4) | 17 (48.6) | 58 (74.4) | 0.007* |
| CAD | 43 (37.7) | 11 (31.4) | 32 (40.5) | 0.35 |
| Frail | 81 (71.1) | 27 (77.1) | 54 (68.4) | 0.34 |
| BMI, kg/m2 | 26.3 [5.2] | 24.6 [4.9] | 27.0 [5.1] | 0.02* |
| Hypertension | 84 (73.7) | 27 (77.1) | 57 (72.2) | 0.57 |
| Prior PPM | 17 (14.9) | 3 (8.6) | 14 (17.7) | 0.20 |
| Prior ICD | 25 (21.9) | 7 (20.0) | 18 (22.8) | 0.74 |
| Prior CABG | 27 (23.7) | 9 (25.7) | 18 (22.8) | 0.73 |
| Prior PCI | 25 (21.9) | 3 (8.6) | 22 (27.8) | 0.02* |
| Mitral annular calcification | 33 (28.9) | 7 (20.0) | 26 (32.9) | 0.16 |
| STS risk MV repair, % | 3.0 (1.5–5.3) | 3.9 (1.1–6.5) | 3.0 (1.7–4.7) | 0.96 |
| NYHA class III/IV | 95 (85.8) | 25 (75.8) | 70 (89.7) | 0.02* |
| Creatinine, mg/dL | 1.6 [1.3] | 1.3 [0.5] | 1.7 [1.5] | 0.13 |
| Hemoglobin, g/dL | 11.2 [2.2] | 11.7 [2.0] | 11.0 [2.3] | 0.14 |
| Echocardiographic characteristics | ||||
| MR severity (3+/4+) | 114 (100.0) | 35 (100.0) | 79 (100.0) | 0.99 |
| MR pathogenesis | ||||
| Primary | 58 (50.9) | 27 (77.1) | 31 (39.2) | <0.001* |
| Secondary | 49 (43.0) | 7 (20.0) | 42 (53.2) | |
| Mixed | 7 (6.1) | 1 (2.9) | 6 (7.6) | |
| PASP, mm Hg | 52.2 [19.4] | 41.7 [19.5] | 56.7 [17.7] | <0.001* |
| LVIDs, cm | 3.8 [1.1] | 3.3 [1.1] | 4.0 [1.0] | 0.003* |
| LVIDd, cm | 5.4 [0.8] | 5.3 [0.7] | 5.5 [0.8] | 0.25 |
| LA volume, mL | 118.8 [49.6] | 117.2 [51.4] | 119.4 [49.2] | 0.83 |
| Ejection fraction, % | 49.6 [14.0] | 55.5 [12.2] | 47.0 [13.9] | 0.002* |
| Mitral valve area, cm2 | 5.4 [1.8] | 5.3 [1.6] | 5.4 [1.8] | 0.83 |
| TR severity | ||||
| None/trace | 25 (21.9) | 12 (34.3) | 13 (16.5) | 0.07 |
| Mild | 49 (43.0) | 14 (40.0) | 35 (44.3) | |
| Moderate | 33 (28.9) | 9 (25.7) | 24 (30.4) | |
| Severe | 7 (6.1) | 0 (0) | 7 (8.9) | |
| Right heart catheterization | ||||
| RAP, mm Hg | 11.0 [6.0] | 7.1 [4.0] | 12.7 [6.0] | <0.001* |
| PCWP, mm Hg | 21.8 [9.1] | 14.3 [7.0] | 24.8 [8.1] | <0.001* |
| PASP, mm Hg | 51.0 [18.4] | 34.6 [9.3] | 58.2 [16.8] | <0.001* |
| PADP, mm Hg | 22.3 [8.7] | 15.0 [5.5] | 25.6 [8.0] | <0.001* |
| mPAP, mm Hg | 33.6 [11.5] | 22.8 [6.7] | 38.4 [9.9] | <0.001* |
| TPG, mm Hg | 12.1 [7.0] | 8.4 [3.5] | 13.6 [7.5] | <0.001* |
| PAPi | 3.4 [2.4] | 3.8 [3.0] | 3.2 [2.0] | 0.25 |
| PVR (WU) | 3.1 [2.2] | 1.6 [0.8] | 3.7 [2.3] | <0.001* |
| RA/PCW | 0.5 [0.2] | 0.5 [0.1] | 0.5 [0.3] | 0.66 |
| RVSP, mm Hg | 50.0 [17.8] | 33.8 [9.7] | 57.3 [15.7] | <0.001* |
| RVEDP, mm Hg | 11.1 [5.9] | 7.7 [4.8] | 12.7 [5.6] | <0.001* |
| Stroke volume, mL | 63.0 [23.9] | 86.8 [21.0] | 52.5 [16.4] | <0.001* |
| Cardiac index, mL/m2 | 2.3 [0.6] | 2.8 [0.5] | 2.0 [0.5] | <0.001* |
| Pulmonary artery compliance, mL/mm Hg | 2.7 [1.8] | 4.8 [1.8] | 1.8 [0.8] | <0.001* |
| Procedural characteristics | ||||
| Number of clips | 1.6 [0.6] | 1.5 [0.8] | 1.6 [0.6] | 0.64 |
| Baseline mean LAP, mm Hg | 20.0 [8.4] | 16.2 [6.3] | 21.7 [8.7] | <0.001* |
| Baseline V‐wave, mm Hg | 34.5 [18.2] | 28.0 [15.5] | 37.5 [18.7] | 0.01* |
| Postprocedural mean LAP, mm Hg | 15.0 [6.1] | 11.6 [3.5] | 16.6 [6.4] | <0.001* |
| Postprocedural V‐wave, mm Hg | 21.5 [9.7] | 16.0 [6.2] | 24.1 [10.0] | <0.001* |
Values are expressed as mean [SD] or N (%).
BMI indicates body mass index; CABG, coronary artery bypass graft; CAD, coronary artery disease; Ea, pulmonary effective arterial elastance; ICD, implantable cardioverter/defibrillator; LAP, left atrial pressure; LVIDd, left ventricle internal diameter (diastole); LVIDs, left ventricle internal diameter (systole); MI, myocardial infarction; mPAP, mean pulmonary artery pressure; MR, mitral regurgitation; NYHA, New York Heart Association; PADP, pulmonary artery diastolic pressure; PAPi, pulmonary artery pulsatility index; PASP, pulmonary artery systolic pressure; PASP, pulmonary artery systolic pressure; PCI, percutaneous coronary intervention; PCWP, pulmonary capillary wedge pressure; PH, pulmonary hypertension; PPM, permanent pacemaker; PVR, pulmonary vascular resistance; RA/PCW, right arterial/pulmonary capillary wedge; RAP, right atrial pressure; RVSP, right ventricle systolic pressure; RVDP, right ventricle diastolic pressure; RVEDP, right ventricle end diastolic pressure; STS, Society of Thoracic Surgeons; TPG, trans‐pulmonary gradient; TR, tricuspid regurgitation; and WU, wood units.
Significant if P‐value<0.05.
Ea <0.6 Versus Ea ≥0.6 mm Hg/mL
When stratified by Ea severity, 35 (30.7%) patients had low Ea, and 79 (69.3%) had high Ea. Compared with the low Ea group, the patients with high Ea had higher prevalence of diabetes, atrial fibrillation, NYHA class III/IV status, and prior percutaneous coronary intervention. Echocardiographically, MR and TR severity at baseline were comparable between groups. Patients with low Ea had a greater proportion of primary MR (77.1% versus 39.2%, P <0.001), lower PASP (41.7±19.5 versus 56.7±17.7, P <0.001), smaller left ventricle dimensions, and higher ejection fraction (55.5% versus 47.0%, P=0.002; Table 1) Hemodynamically, patients with low Ea had higher stroke volumes than those with high Ea. However, patients with high Ea had worse right atrial pressure, PA pressures, PVR, PAC, and pulmonary capillary wedge pressure than patients with low Ea (all P <0.05). Baseline and postprocedural mean LAP/V‐wave were higher in patients with high Ea when compared with patients with low Ea (Table 1).
In‐Hospital, 30‐Day, and 2‐Year Outcomes
At discharge, residual MR grade ≥moderate was comparable after clip placement in both groups. The median length of stay was greater in the high Ea group: 2 (1−7) days compared with 2 (1−2) days in patients with low Ea. At 2 years, patients with low Ea had lower mortality when compared with patients with high Ea (11.4% versus 36.7%, P=0.006) with less frequent HFHs (2.9% versus 21.5%, P=0.01) and composite end point rate (14.3% versus 49.4%, P<0.001) (Table 2). Kaplan–Meier analysis revealed significantly lower event‐free survival in patients with high Ea for all‐cause mortality (HR, 4.0 [95% CI, 1.4–11.3]; P=0.001) and the composite end point (HR, 4.6 [95% CI, 1.8–11.7]; P<0.001) (Figure 1).
Table 2.
In‐Hospital, 30‐Day, 1‐ and 2‐Year Outcomes Based on Ea
| Outcomes | Overall | Ea <0.6 | Ea ≥0.6 | P value |
|---|---|---|---|---|
| N=114 | N=35 | N=79 | ||
| In‐hospital outcomes | ||||
| LOS, d | 2 (1–4) | 2 (1−2) | 2 (1−7) | 0.02* |
| Discharge MR ≥moderate | 27 (23.6) | 9 (25.7) | 18 (22.7) | 0.75 |
| Discharge TMPG, mm Hg | 4.0 [1.8] | 3.4 [1.6] | 4.3 [1.8] | 0.02* |
| 30‐d Outcomes | ||||
| LAV, mL | 126.3 [51.1] | 117.4 [42.9] | 130.2 [54.3] | 0.30 |
| LAVI, mL/m2 | 69.5 [24.6] | 64.2 [20.4] | 71.9 [26.2] | 0.22 |
| LVIDs, cm | 4.0 [1.1] | 3.7 [1.1] | 4.1 [1.0] | 0.07 |
| LVIDd, cm | 5.3 [0.9] | 5.1 [0.9] | 5.4 [0.9] | 0.25 |
| LVEF, % | 46.9 [15.6] | 52.8 [13.8] | 43.9 [15.7] | 0.007* |
| PASP, mm Hg | 49.4 [14.0] | 43.6 [13.9] | 51.9 [13.4] | 0.01* |
| TR ≥moderate | 32 (32.7) | 3 (9.1) | 29 (44.6) | <0.001* |
| NYHA class III/IV | 11 (14.5) | 3 (11.1) | 8 (16.3) | 0.82 |
| MR ≥moderate | 62 (63.9) | 7 (21.9) | 31 (47.7) | 0.01* |
| TMPG, mm Hg | 4.2 [2.1] | 3.5 [2.1] | 4.5 [2.0] | 0.03* |
| 1‐y Outcomes | ||||
| Mortality | 22 (19.3) | 3 (8.6) | 19 (24.1) | 0.05 |
| HFH | 12 (10.5) | 1 (2.9) | 11 (13.9) | 0.10 |
| Composite | 31 (27.2) | 4 (11.4) | 27 (34.2) | 0.012* |
| 2‐y Outcomes | ||||
| Mortality | 33 (28.9) | 4 (11.4) | 29 (36.7) | 0.006* |
| HFH | 18 (15.8) | 1 (2.9) | 17 (21.5) | 0.012* |
| Composite | 44 (38.6) | 5 (14.3) | 39 (49.4) | <0.001* |
| Overall | ||||
| FU, mo | 28 [21] | 36.6 [21.7] | 24 [21] | 0.004* |
Values are expressed as mean [SD], median (interquartile range), or N (%).
FU indicates follow‐up; HFH, heart failure hospitalization; LAV, left atrium volume; LAVI, left atrial volume index; LOS, length of stay; LVEF, left ventricle ejection fraction; LVIDs/d, left ventricle internal diameter (systole/diastole); MR, mitral regurgitation; NYHA, New York Heart Association; PASP, pulmonary artery systolic pressure; TMPG, transmitral mean pressure gradient; and TR, tricuspid regurgitation.
Significant if P‐value<0.05.
Figure 1. Survival analysis according to elastance.
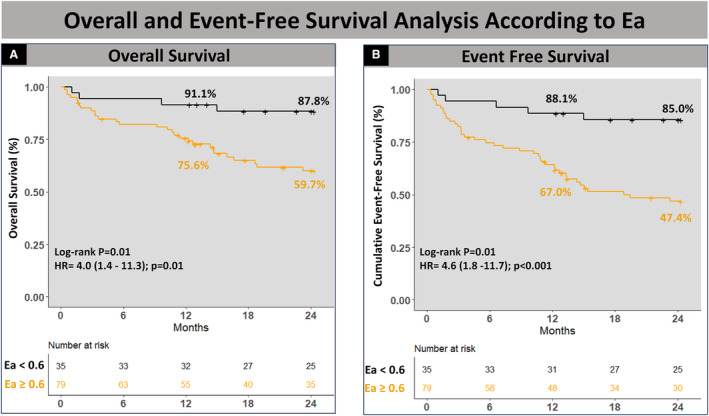
Kaplan–Meier analysis showing lower event‐free survival in patients with high Ea for all‐cause mortality (A) and the composite end point (B). Ea indicates elastance; and HR, hazard ratio.
Hemodynamic Parameters Associated With Outcomes After M‐TEER
We then studied the impact of invasively measured hemodynamic parameters on outcomes after M‐TEER. Cox regression analysis identified Ea and PAC as hemodynamic predictors associated with all‐cause mortality and with the composite end point at 2 years after M‐TEER (Figure 2). In contrast, mPAP, PASP, PA diastolic pressure, transpulmonary pressure gradient, PVR, and PA pulsatility index were not associated with all‐cause mortality or the composite end point after M‐TEER. Ea, entered as a continuous variable in this model, was found to be the most predictive hemodynamic parameter.
Figure 2. Forest plot of invasive hemodynamic univariate predictors associated with 2‐year outcomes after M‐TEER.
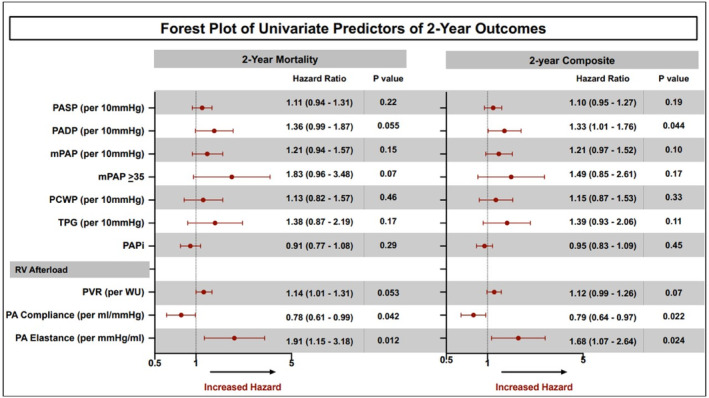
mPAP indicates mean pulmonary artery pressure; M‐TEER, mitral transcatheter edge‐to‐edge repair; PA, pulmonary artery; PADP, pulmonary artery diastolic pressure; PASP, pulmonary artery systolic pressure; PCWP, pulmonary capillary wedge pressure; PVR, pulmonary vascular resistance; RV, right ventricle; and TPG, transpulmonary pressure gradient.
None/Mild Versus Moderate/Severe PH
When stratified by PH severity, 66 (57.9%) patients had none/mild PH while 48 (42.1%) had moderate/severe PH. Baseline clinical, echocardiographic, hemodynamic, and procedural characteristics are listed in Tables S2 and S3.
In‐Hospital, 30‐Day, and 2‐Year Outcomes
The median length of stay was greater in the moderate/severe PH group: 2 days (interquartile range: 1–6.5) compared with patients with none/mild PH. At 30 days, both groups had comparable residual MR severity and prevalence of NYHA class III/IV. At 2 years, the moderate/severe PH group had significantly higher mortality when compared with the none/mild PH group (39.6% versus 21.2%, P=0.03; Table S3). Kaplan–Meier estimates demonstrated significantly lower event‐free survival in the presence of moderate/severe (mPAP ≥35 mm Hg; HR, 2.09 [95% CI, 1.04–4.17]; P=0.04) at 2‐year follow‐up (Figure S1).
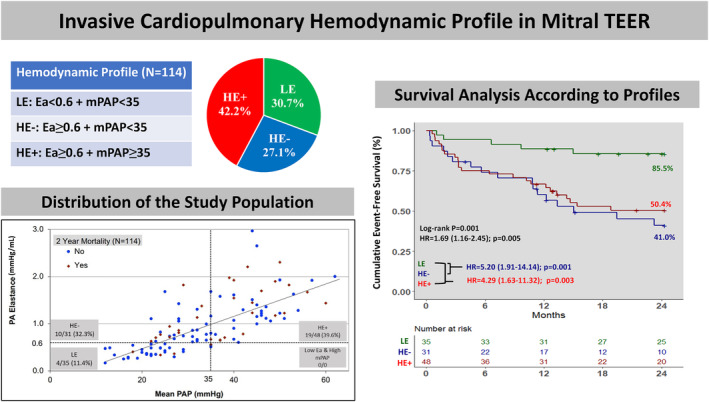
Clinical Characteristics Based on Invasive Cardiopulmonary Hemodynamic Profile
The combination of the thresholds for mPAP (35 mm Hg) and Ea (0.6 mm Hg/mL) allowed the stratification of the study population into 3 cardiopulmonary hemodynamic profiles: LE: mPAP <35, Ea <0.6 (N=35); HE−: mPAP <35, Ea ≥0.6 (N=31); and HE+: mPAP ≥35, Ea ≥0.6 (N=48). All patients with moderate/severe PH had high Ea (Figure 3). Clinical, echocardiographic characteristics, and outcomes of the 3 risk profiles are summarized in Tables S4–S6. Patients with HE+ were younger than patients with HE− (72.6±11.0 versus 77.7±8.1 years, P=0.03). Patients with HE−/HE+ had a higher prevalence of diabetes, atrial fibrillation, and prior percutaneous coronary intervention than patients with LE. Echocardiographically, MR and tricuspid regurgitation severity at baseline were comparable between groups. Patients with LE had a greater proportion of primary MR compared with patients with HE− or HE+ (77.1% versus 32.3% HE− versus 43.8% HE+, respectively, P=0.005), smaller left ventricle dimensions, and higher ejection fraction (55.5% versus 45.5% versus 48.0%, respectively, P=0.008). Hemodynamically, patients with HE− and HE+ had lower stroke volumes than patients with LE. Patients with HE+ had worse right atrial pressure, PA pressures, PVR, PAC, and pulmonary capillary wedge pressure than patients with HE− (all P <0.05). Also, these parameters were worse in patients with the HE− profile when compared with those with the LE profile (all P <0.05). Baseline and postprocedural mean LAP/V‐waves were higher in patients with the HE−/HE+ profile when compared with patients with LE profile (Table S5).
Figure 3. Stratification of the study population into 3 cardiopulmonary hemodynamic profiles.
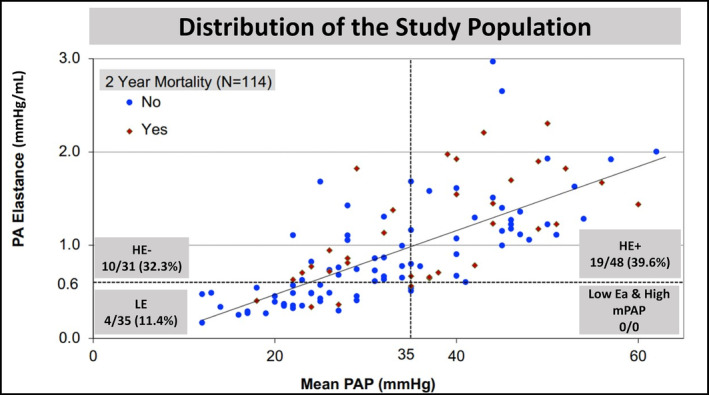
Scatter plot showing patient distribution based on the cutoffs set for mPAP (35 mm Hg) and Ea (0.6 mm Hg/mL). Ea indicates elastance; HE−, high elastance (>0.6) and low mPAP (<35 mm Hg); HE+, high elastance (>0.6) and high mPAP (>35 mm Hg); LE, low elastance (<0.6); mPAP, mean pulmonary artery pressure; and PA, pulmonary artery.
Outcomes Based on Ea and mPAP
At discharge, residual MR grade ≥moderate was comparable after Clip placement in all 3 profiles (Table S6). The median length of stay and discharge TMPG was similar among all groups.
At 30 days, patients in all 3 profiles had lower prevalence of NYHA class III/IV compared with baseline (11.1%, 14.3%, 17.9%, P=0.88). However, patients with HE−/HE+ had lower EF, and a greater proportion of MR ≥moderate compared with patients with LE (56% and 42.5% versus 21.9%, respectively P=0.02). Also, patients with HE− and HE+ had a greater proportion of TR ≥moderate compared with LE at 30 days (42.3% and 46.2% versus 9.1%, respectively, P=0.002) (Table S6).
At 30 days, no mortality was noted in patients with the LE profile while 2 patients died in the HE− and 2 in the HE+ profiles. At 2 years, patients with LE had lower mortality when compared with patients with HE−/HE+ (11.4% versus 32.3%, 39.6%, P=0.01) with less frequent HFHs (2.9% versus 16.7%, 32.3%, P=0.006) and composite end point rate (14.3% versus 54.8%, 47.9%, P=0.001) (Table S6). Kaplan–Meier analysis revealed significantly lower event‐free survival in patients with the HE−/HE+ profiles for all‐cause mortality (HR, 3.41 [95% CI, 1.06–10.88]; P=0.038 and HR, 4.23 [95% CI, 1.43–12.45]; P=0.008) and the composite end point (HR, 5.20 [95% CI, 1.91–14.14]; P=0.001 and HR, 4.29 [95% CI, 1.63–11.32]; P=0.003) (Figure 4).
Figure 4. Survival analysis according to the 3 cardiopulmonary hemodynamic profiles by PH severity.
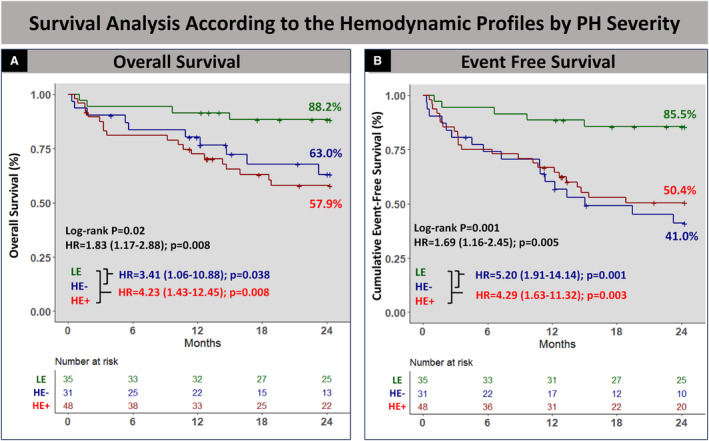
Kaplan–Meier analysis showed lower event‐free survival in patients with the HE−/HE+ profiles for all‐cause mortality (A) and the composite end point (B). HR, hazard ratio; HE−, high elastance (>0.6) and low mPAP (<35 mm Hg); HE+, high elastance (>0.6) and high mPAP (>35 mm Hg); LE, low elastance (<0.6); mPAP, mean pulmonary artery pressure; and PH, pulmonary hypertension.
Outcomes Based on Ea and MR Pathogenesis
Patients with SMR had higher mortality (41.7% versus 23.8%, P=0.06) and composite end point rates (53.8% versus 31.5%, P=0.02) than those with PMR at 2 years. Using the same ROC curve‐derived threshold of 0.6 for Ea, patients were stratified into 3 groups by MR pathogenesis: PMR/Ea <0.6 (PMR/LE; N=28), PMR/Ea ≥0.6 (PMR/HE; N=37), and SMR (N=49). Patients with PMR/LE had higher cumulative 2‐year survival when compared with PMR/HE and SMR patients (89.9% versus 66.3% versus 58.2%, P=0.04). Also, cumulative 2‐year event‐free survival was significantly higher in patients with PMR/LE when compared with patients with PMR/HE and SMR (85.5% versus 55.5% versus 46.1%, P=0.005) (Figure S2). There was no difference in mortality or the composite end point between patients with PMR/HE and SMR (32.45 versus 36.7%, P=0.67 and 43.2% versus 51.0%, P=0.47, respectively). Among 7 patients who had SMR with Ea <0.6, only 1 patient died, and none had HFH.
RV‐PA Coupling Versus Ea
Tricuspid annular plane systolic excursion (TAPSE) could be measured in 76% (87) of our patients. It was comparable between the 3 cardiopulmonary hemodynamic profiles (1.7 versus 1.62 versus 1.63 cm, P=0.83). Also, the RV‐PA coupling ratio, defined as TAPSE/PASP, was comparable between patients with LE and HE− (0.55±0.41 versus 0.41±0.15 cm/mm Hg, P=0.16), while Ea (PASP/SV) was significantly different (0.41±0.10 versus 0.94±0.35 mm Hg/mL, P<0.001) (Table S7).
Independent Predictors Associated With Outcomes After M‐TEER
Multivariable Cox regression analysis showed that Ea ≥0.6 was an independent predictor associated with the 2‐year composite end point of mortality and HFH (HR, 3.91 [95% CI, 1.52–10.08]; P=0.004), in addition to baseline left ventricular ejection fraction (HR, 0.97 [95% CI, 0.95–0.99]; P=0.012) (Figure 5).
Figure 5. Predictors of the composite outcome after mitral TEER.
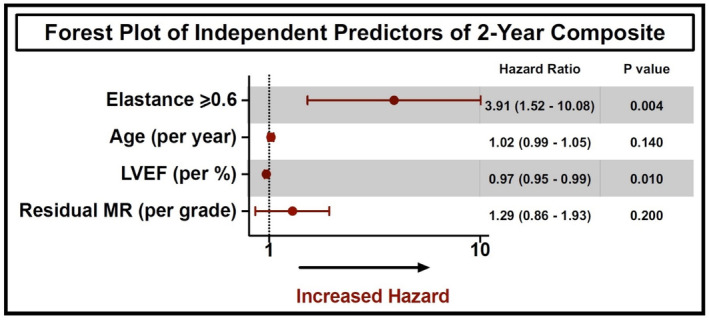
Forest plot showing multivariable predictors associated with the 2‐year composite end point of mortality and heart failure hospitalization after mitral TEER. LVEF indicates left ventricular ejection fraction; MR, mitral regurgitation; and TEER, transcatheter edge‐to‐edge repair.
Discussion
For the first time, the present study reports a comprehensive analysis of the impact of invasive cardiopulmonary hemodynamic parameters on outcomes after M‐TEER. The main findings of our study are as follows (Figure 6): first, Ea was identified as the most predictive hemodynamic parameter associated with all‐cause mortality and with the composite end point. Second, mPAP <35 mm Hg and PMR are associated with favorable outcomes after TEER. Third, Ea further stratifies patients with none/mild PH and PMR and provides insights into their risk profiles. Finally, Ea ≥0.6 was an independent predictor associated with the composite end point of 2‐year mortality and HFH after M‐TEER.
Figure 6. Three hemodynamic profiles were created based on Ea=0.6 and mPAP=35.
Patients with LE (mPAP <35, Ea <0.6) were compared with patients with HE− (mPAP <35, Ea ≥0.6) and HE+ (mPAP ≥35, Ea≥0.6). No patients had Ea <0.6 and mPAP ≥35 mm Hg. Compared with patients with the LE hemodynamic profile, event‐free survival for the composite end point was lower in those with the HE− (mPAP <35, Ea ≥0.6) and HE+ (mPAP ≥35, Ea ≥0.6) hemodynamic profiles at 1 and 2 years of follow‐up. Ea indicates elastance; HR, hazard ratio; HE−, high elastance (>0.6) and low mPAP (<35 mm Hg); HE+, high elastance (>0.6) and high mPAP (>35 mm Hg); LE, low elastance (<0.6); mPAP, mean pulmonary artery pressure; and PA, pulmonary artery.
Data regarding the prognostic value of preprocedural PH in patients with M‐TEER are limited. It is mostly based on retrospective analyses that evaluated the impact of PH on outcomes using different cut‐offs for PH definition. Echocardiographically, a PASP ≥50 mm Hg was associated with all‐cause mortality and HFH at 2 years. 4 , 12 , 13 In the German Transcatheter Mitral Valve Interventions (TRAMI) registry, 643 patients were stratified based on echocardiographically determined PASP (group 1 ≤36 mm Hg, group 2 37–50 mm Hg, group 3 >50 mm Hg). The former study showed that membership in groups 2 and 3 were independent predictors of mortality at 1 year. 14 However, PASP is not consistently obtained by echocardiography and Doppler PASP estimates only moderately correlate with catheterization. 15 Furthermore, PH cannot be characterized by PASP alone without considering other hemodynamic components such as mPAP and RV load parameters. To our knowledge, only 1 study analyzed the impact of invasively determined mPAP on outcomes after M‐TEER and reported a graded association between mPAP and HFH/mortality at 1 year. 9 In the present study, mPAP ≥35 mm Hg was associated with an increased risk of 2‐year mortality, validating the previous findings. Importantly, invasive RV load parameters (specifically Ea) allowed further stratification of patients with none/mild PH.
The RV is more sensitive to afterload than the left ventricle. 16 Right ventricular function is a strong predictor of outcomes in patients with left‐sided disease. 17 , 18 RV afterload consists of several different components: passive/resistive (PVR), pulsatile (LAP, PASP), and flow (SV). Ea is an attractive measure reflective of total RV afterload (SV, PVR, and LAP). 7 , 19 Ea was shown to be more consistently associated with RV dysfunction and outcomes than other measures of precapillary disease in LHD‐PH. 8 In patients with severe MR, LAP plays a major role in the pathophysiology of PH, and it is not surprising that LAP was associated with outcomes after M‐TEER. 20 As evidenced in our cohort, patients with elevated Ea had higher LAP (Table 1). We postulate that Ea was the most predictive hemodynamic marker since it incorporates LAP (pulsatile RV loading) along with other determinants of PH (SV, PVR) in patients with severe MR.
In our population, a cut‐off of 0.6 for Ea (PASP/SV) was used to further stratify patients with none to mild PH into 2 groups. Patients with mPAP <35+Ea ≥0.6 (HE−) had outcomes similar to those with mPAP ≥35+Ea ≥0.6 (HE+). This could be explained by 2 mechanisms: first, when PH progresses to advanced stages, the RV can no longer compensate and its stroke volume declines, leading to lower PA pressures and higher Ea. 10 Second, pulsatile RV loading (LAP) increases PASP more than mPAP and therefore leads to higher Ea and mildly elevated mPAP. 21 It is also important to note that all patients with moderate/severe PH had Ea ≥0.6, which further validates our patient stratification.
Despite comparable TR severity at baseline and residual MR at discharge, patients with high Ea had more severe TR and residual MR while patients with low Ea had improved TR severity and were more likely to sustain acceptable residual MR at 30 days. In this setting, high Ea may be considered a sign of advanced disease where despite mild residual MR, TR is not expected to improve despite M‐TEER, eventually leading to worse outcomes.
In the context of moderate to severe TR, the forward flow stroke volume measured by RHC fails to provide an accurate reflection of right ventricular function due to TR, causing the RV to eject into both the pulmonary artery and the right atrium. Therefore, caution is warranted in interpreting the forward flow stroke volume in the presence of ≥moderate TR. It would be inappropriate to infer that Ea is elevated solely due to compromised RV function in this setting. New studies on animal models propose a novel 2‐parallel compliance model, namely, the effective compliance of the TR and of the PA, which helps to better understand the pathophysiology of PH and associated right heart failure. 22 Nonetheless, in our study cohort, Ea remained significantly associated with the composite end point even after adjusting for ≥moderate TR in a separate multivariate model.
In terms of MR pathogenesis, it is well established that patients with SMR have worse outcomes than those with PMR. 4 , 23 In this study, Ea further stratified patients with PMR where those with PMR and Ea ≥0.6 had outcomes similar to those with SMR. Among 7 patients who had SMR with Ea <0.6, only 1 patient died, and none had HFH. This observation suggests that Ea may also prognosticate patients with SMR; however, the validation of this hypothesis requires a larger cohort.
We demonstrated that the evaluation of a cardiopulmonary profile using mPAP and Ea reliably allows the risk stratification of patients undergoing M‐TEER. In this setting, Ea is an attractive hemodynamic marker of advanced disease that measures total RV load and indexes it to the ventricular function. Recently, RV‐PA uncoupling emerged as a powerful predictor of outcomes after M‐TEER. 24 This measure takes into consideration PASP and indexes it to the RV function. It is calculated using echocardiography by dividing TAPSE by PASP. Advanced RV‐PA uncoupling was defined as a ratio of TAPSE/PASP ≤0.35 mm/mm Hg and was associated with worse outcomes. 24 , 25 Unlike TAPSE/PASP, which can be limited by the presence of RV windows and sufficient TR (obtainable in 75% of our population), Ea can be easily derived from standard RHC with minimal interoperator variability. Also, TAPSE/PASP was not significantly different in LE and HE− (Ea ≥0.6 and mPAP<35 mm Hg) and thus does not offer additive prognostic value in patients with none/mild PH.
It is important to note that the hemodynamic changes generated by M‐TEER occurred in all patients across the hemodynamic profile subgroups. In most patients, we observed significant and immediate reductions of the LAP/V‐wave postprocedurally. We also noted improvement of NYHA functional class symptoms in most patients across groups irrespective of the outcome.
Finally, Ea ≥0.6 was an independent predictor associated with the 2‐year composite end point of mortality and HFH after M‐TEER in addition to left ventricle ejection fraction. This highlights the prognostic value of invasively measured Ea in addition to well‐known predictors of outcomes in patients undergoing M‐TEER.
Future Prospects
Invasive RV adaptation parameters (PA pulsatility index, RA/pulmonary capillary wedge pressure, right atrial pressure) are important hemodynamic variables that may be related to outcomes after M‐TEER. While one study showed that PA pulsatility index ≤2.46 portends a worse prognosis, 26 our data did not show a significant association. Also, comparing outcomes based on the different types of PH would be of interest to further stratify patients and guide patient selection.
Study Limitations
Our study has some limitations. First, the retrospective nature of this study at a single institution has inherent limitations and biases, including time bias as different TEER device generations were included. Second, we excluded 62% of patients who underwent mitral TEER without prior RHC, since this was designed to be a study evaluating invasively measured hemodynamics. Those who underwent RHC were characterized by a younger age, a lower proportion of females, and a higher prevalence of NYHA class III/IV compared with patients who did not undergo RHC before the procedure. Although this exclusion may have introduced a selection bias, potentially impacting the overall generalizability of the study, it is noteworthy that outcomes in the excluded group (2‐year mortality 28.8%; 2‐year mortality/HFH 40.0%) were comparable to those in the primary study cohort (Table S1). Third, the number of patients in each of the hemodynamic profiles is relatively small, which may impact statistical power and generalizability of the findings. Fourth, because of the possible collinearity between the different hemodynamic parameters and the limited number of events, we were limited in the number of variables included in the multivariate model. However, we posit that Ea serves as a measurement of total RV load, identifying patients in the early stages of heart failure and guiding patient selection independently of mPAP and MR pathogenesis. Fifth, there is a lack of complete data on RV size and function, which could be a marker of advanced PH. Despite the limitations, it is noteworthy that this study represents the most extensive data set with comprehensive invasive hemodynamics before M‐TEER. The outcomes derived from this study should be considered as hypothesis‐generating, aiming to stimulate additional investigations that validate our findings and explore the integration of hemodynamic parameters in patient selection to optimize TEER outcomes.
Conclusions
M‐TEER in patients with PH is feasible and improves symptoms irrespective of the degree of PH. Ea is the most predictive hemodynamic parameter associated with all‐cause mortality and HFH at 2 years after M‐TEER. Assessment of the preprocedural cardiopulmonary profile based on mPAP, MR pathogenesis, and Ea allows the risk stratification of patients. It also guides patient selection by identifying hemodynamic features that indicate likely benefit from M‐TEER in PH or lack thereof. Additional studies are needed to determine whether intervening earlier in severe MR may lead to improved outcomes.
Sources of Funding
None.
Disclosures
Dr Reardon is a consultant for Medtronic, Boston Scientific, Abbott, and W L Gore & Associates. Dr Atkins is a consultant for W L Gore & Associates. Dr Kleiman is a local principal investigator in trials sponsored by Boston Scientific, Medtronic, Abbott, and Edwards Lifesciences. Dr Goel is a consultant for Medtronic, W L Gore & Associates and is on the Speakers Bureau for Abbott Structural Heart. The remaining authors have no disclosures to report.
Supporting information
Tables S1–S7
Figures S1–S2
R. G. Bou Chaaya and T. Hatab contributed equally.
This study was presented as a Moderated Abstract at the Transcatheter Cardiovascular Therapeutics (TCT) conference, October 23–26, 2023, in San Francisco, CA.
This manuscript was sent to Amgad Mentias, MD, Associate Editor, for review by expert referees, editorial decision, and final disposition.
Supplemental Material is available at https://www.ahajournals.org/doi/suppl/10.1161/JAHA.123.033510
For Sources of Funding and Disclosures, see page 13.
See Editorial by Ali et al.
References
- 1. Rosenkranz S, Gibbs JS, Wachter R, De Marco T, Vonk‐Noordegraaf A, Vachiéry JL. Left ventricular heart failure and pulmonary hypertension. Eur Heart J. 2016;37:942–954. doi: 10.1093/eurheartj/ehv512 [DOI] [PMC free article] [PubMed] [Google Scholar]
- 2. Bursi F, Barbieri A, Grigioni F, Reggianini L, Zanasi V, Leuzzi C, Ricci C, Piovaccari G, Branzi A, Modena MG. Prognostic implications of functional mitral regurgitation according to the severity of the underlying chronic heart failure: a long‐term outcome study. Eur J Heart Fail. 2010;12:382–388. doi: 10.1093/eurjhf/hfq014 [DOI] [PubMed] [Google Scholar]
- 3. Ghoreishi M, Evans CF, DeFilippi CR, Hobbs G, Young CA, Griffith BP, Gammie JS. Pulmonary hypertension adversely affects short‐ and long‐term survival after mitral valve operation for mitral regurgitation: implications for timing of surgery. J Thorac Cardiovasc Surg. 2011;142:1439–1452. doi: 10.1016/j.jtcvs.2011.08.030 [DOI] [PubMed] [Google Scholar]
- 4. Ben‐Yehuda O, Shahim B, Chen S, Liu M, Redfors B, Hahn RT, Asch FM, Weissman NJ, Medvedofsky D, Puri R, et al. Pulmonary hypertension in transcatheter mitral valve repair for secondary mitral regurgitation: the COAPT trial. J Am Coll Cardiol. 2020;76:2595–2606. doi: 10.1016/j.jacc.2020.09.609 [DOI] [PubMed] [Google Scholar]
- 5. Stone GW, Lindenfeld J, Abraham WT, Kar S, Lim DS, Mishell JM, Whisenant B, Grayburn PA, Rinaldi M, Kapadia SR, et al. Transcatheter mitral‐valve repair in patients with heart failure. N Engl J Med. 2018;379:2307–2318. doi: 10.1056/NEJMoa1806640 [DOI] [PubMed] [Google Scholar]
- 6. Miller WL, Grill DE, Borlaug BA. Clinical features, hemodynamics, and outcomes of pulmonary hypertension due to chronic heart failure with reduced ejection fraction: pulmonary hypertension and heart failure. JACC Heart Fail. 2013;1:290–299. doi: 10.1016/j.jchf.2013.05.001 [DOI] [PubMed] [Google Scholar]
- 7. Tedford RJ, Hsu S, Kass DA. Letter by Tedford et al regarding article, "Effective arterial Elastance in the pulmonary arterial circulation: derivation, assumptions, and clinical applications". Circ Heart Fail. 2020;13:e007081. doi: 10.1161/CIRCHEARTFAILURE.120.007081 [DOI] [PMC free article] [PubMed] [Google Scholar]
- 8. Tampakakis E, Shah SJ, Borlaug BA, Leary PJ, Patel HH, Miller WL, Kelemen BW, Houston BA, Kolb TM, Damico R, et al. Pulmonary effective arterial elastance as a measure of right ventricular afterload and its prognostic value in pulmonary hypertension due to left heart disease. Circ Heart Fail. 2018;11:e004436. doi: 10.1161/CIRCHEARTFAILURE.117.004436 [DOI] [PMC free article] [PubMed] [Google Scholar]
- 9. Al‐Bawardy R, Vemulapalli S, Thourani VH, Mack M, Dai D, Stebbins A, Palacios I, Inglessis I, Sakhuja R, Ben‐Assa E, et al. Association of pulmonary hypertension with clinical outcomes of transcatheter mitral valve repair. JAMA Cardiol. 2020;5:47–56. doi: 10.1001/jamacardio.2019.4428 [DOI] [PMC free article] [PubMed] [Google Scholar]
- 10. Bhatnagar A, Wiesen J, Dweik R, Chaisson NF. Evaluating suspected pulmonary hypertension: a structured approach. Cleve Clin J Med. 2018;85:468–480. doi: 10.3949/ccjm.85a.17065 [DOI] [PubMed] [Google Scholar]
- 11. Zoghbi WA, Enriquez‐Sarano M, Foster E, Grayburn PA, Kraft CD, Levine RA, Nihoyannopoulos P, Otto CM, Quinones MA, Rakowski H, et al. Recommendations for evaluation of the severity of native valvular regurgitation with two‐dimensional and Doppler echocardiography. J Am Soc Echocardiogr. 2003;16:777–802. doi: 10.1016/S0894-7317(03)00335-3 [DOI] [PubMed] [Google Scholar]
- 12. Meijerink F, de Witte SM, Limpens J, de Winter RJ, Bouma BJ, Baan J. Prognostic value of pulmonary hypertension, right ventricular function and tricuspid regurgitation on mortality after transcatheter mitral valve repair: a systematic review and meta‐analysis. Heart Lung Circ. 2022;31:696–704. doi: 10.1016/j.hlc.2021.11.017 [DOI] [PubMed] [Google Scholar]
- 13. Matsumoto T, Nakamura M, Yeow WL, Hussaini A, Ram V, Makar M, Gurudevan SV, Trento A, Siegel RJ, Kar S. Impact of pulmonary hypertension on outcomes in patients with functional mitral regurgitation undergoing percutaneous edge‐to‐edge repair. Am J Cardiol. 2014;114:1735–1739. doi: 10.1016/j.amjcard.2014.08.044 [DOI] [PubMed] [Google Scholar]
- 14. Tigges E, Blankenberg S, von Bardeleben RS, Zürn C, Bekeredjian R, Ouarrak T, Sievert H, Nickenig G, Boekstegers P, Senges J, et al. Implication of pulmonary hypertension in patients undergoing MitraClip therapy: results from the German Transcatheter Mitral Valve Interventions (TRAMI) registry. Eur J Heart Fail. 2018;20:585–594. doi: 10.1002/ejhf.864 [DOI] [PubMed] [Google Scholar]
- 15. Janda S, Shahidi N, Gin K, Swiston J. Diagnostic accuracy of echocardiography for pulmonary hypertension: a systematic review and meta‐analysis. Heart. 2011;97:612–622. doi: 10.1136/hrt.2010.212084 [DOI] [PubMed] [Google Scholar]
- 16. Tedford RJ. Determinants of right ventricular afterload (2013 Grover Conference series). Pulmonary Circ. 2014;4:211–219. doi: 10.1086/676020 [DOI] [PMC free article] [PubMed] [Google Scholar]
- 17. Ghio S, Gavazzi A, Campana C, Inserra C, Klersy C, Sebastiani R, Arbustini E, Recusani F, Tavazzi L. Independent and additive prognostic value of right ventricular systolic function and pulmonary artery pressure in patients with chronic heart failure. J Am Coll Cardiol. 2001;37:183–188. doi: 10.1016/S0735-1097(00)01102-5 [DOI] [PubMed] [Google Scholar]
- 18. Melenovsky V, Hwang SJ, Lin G, Redfield MM, Borlaug BA. Right heart dysfunction in heart failure with preserved ejection fraction. Eur Heart J. 2014;35:3452–3462. doi: 10.1093/eurheartj/ehu193 [DOI] [PMC free article] [PubMed] [Google Scholar]
- 19. Tedford RJ, Hassoun PM, Mathai SC, Girgis RE, Russell SD, Thiemann DR, Cingolani OH, Mudd JO, Borlaug BA, Redfield MM, et al. Pulmonary capillary wedge pressure augments right ventricular pulsatile loading. Circulation. 2012;125:289–297. doi: 10.1161/CIRCULATIONAHA.111.051540 [DOI] [PMC free article] [PubMed] [Google Scholar]
- 20. Sato H, Cavalcante JL, Bae R, Enriquez‐Sarano M, Bapat VN, Gössl M, Fukui M, Sorajja P. Hemodynamic profiles and clinical response to transcatheter mitral repair. JACC Cardiovasc Interv. 2022;15:1697–1707. doi: 10.1016/j.jcin.2022.06.020 [DOI] [PubMed] [Google Scholar]
- 21. Brener MI, Burkhoff D, Sunagawa K. Effective arterial elastance in the pulmonary arterial circulation: derivation, assumptions, and clinical applications. Circ Heart Fail. 2020;13:e006591. doi: 10.1161/CIRCHEARTFAILURE.119.006591 [DOI] [PubMed] [Google Scholar]
- 22. Yoshida K, Axelsen JB, Saku K, Andersen A, de Man FS, Sunagawa K, Vonk Noordegraaf A, Bogaard HJ. How to incorporate tricuspid regurgitation in right ventricular‐pulmonary arterial coupling. J Appl Physiol (1985). 2023;135:53–59. doi: 10.1152/japplphysiol.00081.2023 [DOI] [PubMed] [Google Scholar]
- 23. Athappan G, Raza MQ, Kapadia SR. MitraClip therapy for mitral regurgitation: primary mitral regurgitation. Interv Cardiol Clin. 2016;5:71–82. doi: 10.1016/j.iccl.2015.08.006 [DOI] [PubMed] [Google Scholar]
- 24. Trejo‐Velasco B, Estevez‐Loureiro R, Carrasco‐Chinchilla F, Fernández‐Vázquez F, Arzamendi D, Pan M, Pascual I, Nombela‐Franco L, Amat‐Santos IJ, Freixa X, et al. Prognostic role of TAPSE to PASP ratio in patients undergoing MitraClip procedure. J Clin Med. 2021;10:1006. doi: 10.3390/jcm10051006 [DOI] [PMC free article] [PubMed] [Google Scholar]
- 25. Adamo M, Inciardi RM, Tomasoni D, Dallapellegrina L, Estévez‐Loureiro R, Stolfo D, Lupi L, Pancaldi E, Popolo Rubbio A, Giannini C, et al. Changes in right ventricular‐to‐pulmonary artery coupling after transcatheter edge‐to‐edge repair in secondary mitral regurgitation. JACC Cardiovasc Imaging. 2022;15:2038–2047. doi: 10.1016/j.jcmg.2022.08.012 [DOI] [PubMed] [Google Scholar]
- 26. Osteresch R, Diehl K, Schmucker J, Ben Ammar A, Solyom O, Dierks P, Fach A, Wienbergen H, Hambrecht R. Prognostic impact of the pulmonary artery pulsatility index in patients with chronic heart failure and severe mitral regurgitation undergoing percutaneous edge‐to‐edge repair. Cardiology. 2021;146:74–84. doi: 10.1159/000510283 [DOI] [PubMed] [Google Scholar]
Associated Data
This section collects any data citations, data availability statements, or supplementary materials included in this article.
Supplementary Materials
Tables S1–S7
Figures S1–S2