

Abstract
This paper presents a thorough evaluation of health outcomes linked to water-related challenges in Islamic nations across East Asia and Central Asia from 2020 to 2030. It has been examined carefully that the trajectory of deaths and disability-adjusted life years associated with unsafe water sources, lack of sanitation, and absence of handwashing facilities is showing a potential rise in negative health impacts due to water pollution. The direct health influences of water-related problems are thoughtful. The increase in deaths and DALYs due to poor water quality and sanitation leads to a higher occurrence of waterborne diseases such as cholera, diarrhea, and dysentery. These conditions not only cause instant health disasters but also subsidize to long-term health issues which include chronic gastrointestinal disorders and malnutrition that is particularly among susceptible populations like children and the elderly. Employing various predictive models including autoregressive integrated moving average, exponential smoothing, support vector machines, and neural networks. The study evaluates their predictive capabilities by using mean absolute percentage error. Support vector machines is found to be the most accurate in forecasting deaths and disability-adjusted life years which is outperforming autoregressive integrated moving average, exponential smoothing, and neural networks. This research aims to inform stakeholders by providing insights into effective strategies for improving water resource management and public health interventions in the targeted regions.
Keywords: Death, DALYs, USWS, LOS, AHWF
Subject terms: Health care, Mathematics and computing
Introduction
The study utilizes state-of-the-art integrated forecasting models to predict and analyze water-related challenges in the Islamic nations of East Asia and Central Asia with a focus on the central decade from 2020 to 2030. The research explores the multifaceted dimensions of this issue by considering numerous water problems, their sources, and the diverse socio-economic factors influencing the vulnerability of populations in the region. Water problems encompass issues such as Unsafe Water Sources (USWS), Lack of Sanitation (LOS), and Absence of Handwashing Facilities (AHWF), which have detrimental effects on the environment. These effects include threats to human health, damage to living organisms, and disturbance to environmental facilities and other lawful uses. By investigating these challenges comprehensively and employing advanced forecasting models, the study aims to provide insights and recommendations for addressing water-related issues and improving the overall well-being of communities in the region. Water resources both on the surface and underground play a critical role as a limiting factor in the economic activities of the Central Asian region. These resources serve as crucial components for development but often compete with environmental conditions for utilization.
Amid increasing global concerns regarding sustainable development planners responsible for managing natural resources are directing their focus toward understanding the vulnerability associated with the availability and utilization of water resources and previous examinations of water resource vulnerability have tended to either oversimplify the issue or concentrate solely on one aspect of these multifaceted challenges1. The prevalence of water shortage, pollution, and various other environmental and ecological issues related to water, has been on the rise in numerous regions around the globe2. In the foreseeable future, the former Soviet Central Asia may face resource-driven conflicts with some experts even speculating about the potential for a water-related conflict3. In recent times, headlines and discussions in Pakistan's media have consistently highlighted the alarming reality of an incessant water shortage, affecting irrigation, industrial operations, and human consumption4. The combination of rising water demand and diminishing supplies has been exacerbated by heightened nationalism and competition among the five Central Asian states and this situation has hindered the potential for establishing a feasible regional approach to replace the Soviet-era water management system5. Uzbekistan relies significantly on transboundary water sources with an average of only 9.52 km3 of water resources originating within the country, while 94.8 km3 is sourced from external locations6. The scarcity of water poses a threat to the livelihoods of populations both locally and in transboundary areas due to increasing competition for a limited resource. Central Asia's water resources have a lengthy history of mismanagement as evidenced by the significant scale of the Aral Sea disaster and at the start of the 1990s, foreign aid through development projects has been directed towards improving water resource management in the region7. While Central Asia is naturally endowed with water resources and the need for effective and equitable water management is crucial given the projected population growth and climate change. Water and natural resource development are fundamental across all Central Asian republics with shared water resources necessitating a collective approach to water-sharing agreements8. The availability and accessibility of water directly impact various economic sectors, including agriculture, industry, and energy production9. The United States Intelligence Community conducted an assessment on global water security in 2012. According to the assessment, it warned that by 2040, global demand for water will outstrip supply by 40 percent10. In the rural areas of Khama Doni District of Tajikistan there were 42 villages were equipped with water supply facilities out of 57. However, due to inadequate maintenance and management, only 16 deep wells were operational out of 47. Results showed more than 70% of the residents were compelled to use water from rivers or irrigation canals, a situation similar to that experienced by the residents of Moscow Town11. The Lesser Caucasus Mountains which are characterized by a dense river network, play a crucial role in shaping the water resources of the Republic of Azerbaijan12. Many regions in Kazakhstan have relied predominantly on surface water sources for their water needs. However, with the limitations and constraints on surkhhface water availability, the groundwater resources have been increasingly utilized over the last few decades13. It is imperative to prioritize water conservation efforts and earnestly implement the national water-saving action plan. To achieve this, it is crucial to expedite the establishment of water-saving irrigation areas, water-saving enterprises, water-saving organizations, and water-saving societies14. The world's freshwater resources are limited, accounting for less than 1% of the total water available on the planet and if freshwater sources become contaminated, it can lead to water scarcity issues which can have severe consequences for communities and ecosystems15.
Water and water infrastructure have unfortunately been used as intentional 'weapons' during conflicts. In some instances, water has been weaponized to poison or cut off the water supply to vulnerable populations or to flood areas for strategic military purposes. These actions have devastating consequences such as impacting human health, livelihoods, and infrastructure. For example, more than 30 people were reported killed in Somalia in 2017 due to water poisoning16. ARIMA forecasting model has been used for challenges associated with COVID-19 data in Brazil, such as under-reporting and data recording delays17. The ARIMA model is found to be suitable and ideal for forecasting confirmed infected cases of COVID-19 in Afghanistan, Bangladesh, India, Maldives, and Sri Lanka, the ARIMA model is superior to the other models18. The Holt Winter Exponential Smoothing algorithm can be well implemented to drug supplies prediction application19. For accurate forecasting, it is necessary to examine the error data, specifically the MAE and MAPE20. The study presents the application of various exponential smoothing methods to metal spot price forecasting included Aluminum, copper, lead, iron, nickel, tin, and zinc prices were analyzed by using yearly data from 1990 to 202121. Water quality assessment is indeed crucial for safeguarding the well-being of communities, as the presence of pollutants in water can pose serious health risks. In many developing countries such as India, proper assessment of water quality is often lacking which is leading to potential health hazards for the population22. The research presented in this study about connected change in a variety of water quality indicators that are caused by the mixing of the pollutants, Support vector machines and Neural network implemented as solutions to identify anomalies and estimate the severity of irregularities23.
In this paper, there is a comprehensive evaluation of water-related health challenges and the utilization of advanced predictive models to forecast adverse health outcomes in Islamic nations across East Asia and Central Asia. By engaging several machine learning techniques which is including ARIMA, ES, SVM, and ANN, the study delivers a robust comparison of model performance in predicting deaths and DALYs associated with unsafe water sources, lack of sanitation, and absence of handwashing facilities. This research provides critical visions into effective strategies for improving water resource management and public health involvements in the targeted regions. The comprehensive analysis takes into account numerous socio-economic factors which are ensuring the flexibility and relevance of the findings across different contexts. The paper not only advances theoretical understanding but also presents practical recommendations for policymakers and stakeholders to address water-related health issues which will ultimately contributing to the sustainable development goals and enhancing the well-being of communities in these regions.
Data source and methodology
This study utilized data extracted from the websites of "the Institute of Health Metrics and Evaluation GBD" covering the period 1990–2019, focusing on ten Islamic nations in East Asia and Central Asia: Tajikistan, Armenia, Azerbaijan, Central Asia, Kazakhstan, Kyrgyzstan, Mongolia, Turkmenistan, and Uzbekistan. In this study, we have counted in data from Central Asia considering it as a region composed of multiple countries rather than a single entity. This regional tactic permits for a comprehensive analysis of water-related health impacts diagonally varied socio-economic, environmental, and cultural contexts within Central Asia.
By addressing water-related health issues in these specific nations the study aims to underwrite to their sustainable development goals and improve the well-being of their populations. Islamic nations in East Asia and Central Asia share exclusive geopolitical and socio-economic characteristics that may stimulus water resource management and health outcomes differently compared to non-Islamic nations.
The information from the mentioned source was employed to create a dataset spanning the years 1990 to 2019 for the Islamic nations of East Asia and Central Asia, comprising 300 observations, with each country contributing 30 values. In the application of machine learning techniques, 80% of the data (covering 1990–2013) was utilized for training the models, while the remaining 20% (spanning 2013–2019) was set aside for testing the models. Model validation was conducted using the MAPE. Both traditional statistical methods and machine learning algorithms, including ARIMA, ES, SVM, and NN, were employed in constructing these forecasting models.
Time series plot
Time series plots were created to analyze data patterns across the period from 1990 to 2019.
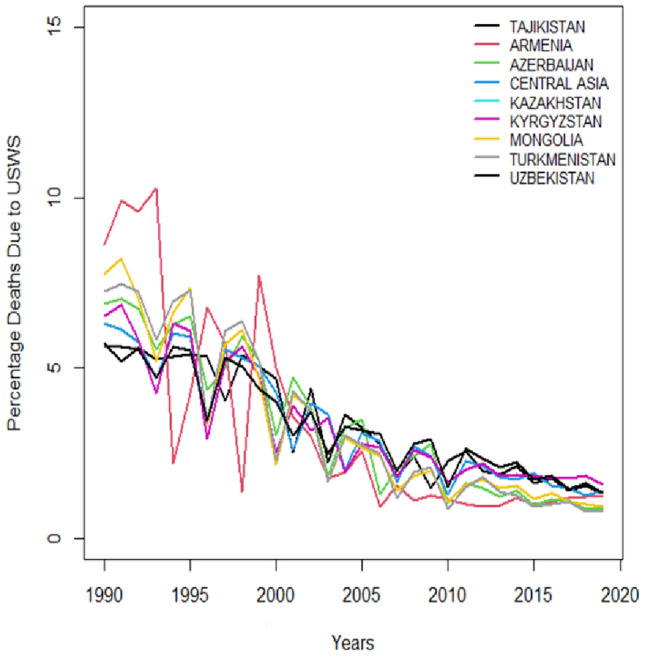
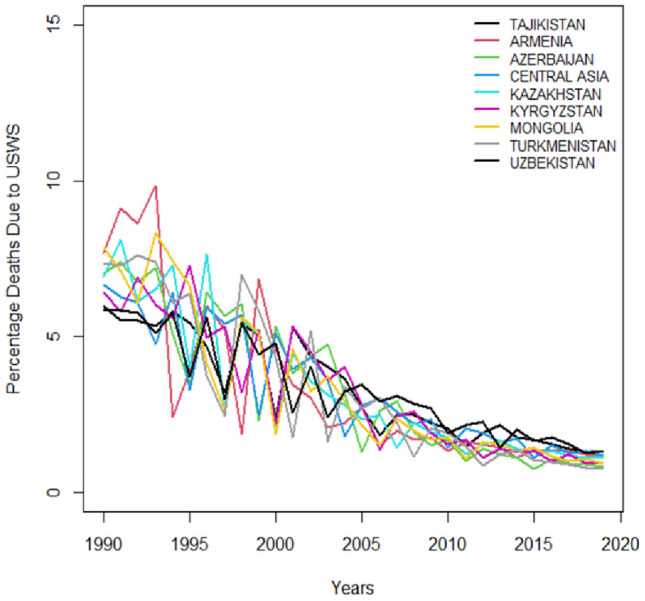
Time series plots portray trends in public health outcomes for several Central Asian countries which is measuring the impact of water-related challenges factors from 1990 to just before 2020. Figures 1 and 2 pathway deaths and DALYs resulting from USWS. Figures 3 and 4 illustrate deaths and DALYs resulting from LOS, and Figs. 5 and 6 show the impact of water-related challenges with deaths and DALYs resulting from AHWF. Across all metrics and countries there's a downward trend that is suggesting improvements in public health which is possibly due to better healthcare services, sanitation, disease prevention, and environmental policies. Despite different rates and occasional fluctuations, the overall reduction in deaths and DALYs indicates progress in combating these risk factors over the three decades.
Figure 1.
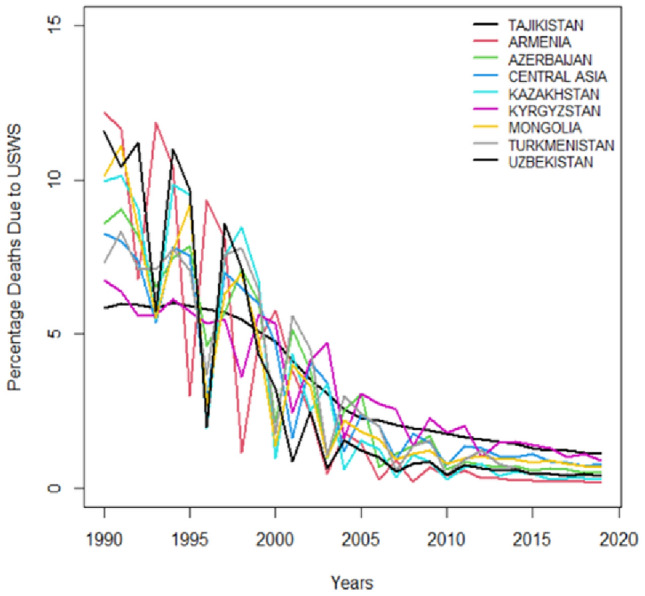
Death resulting from USWS.
Figure 2.
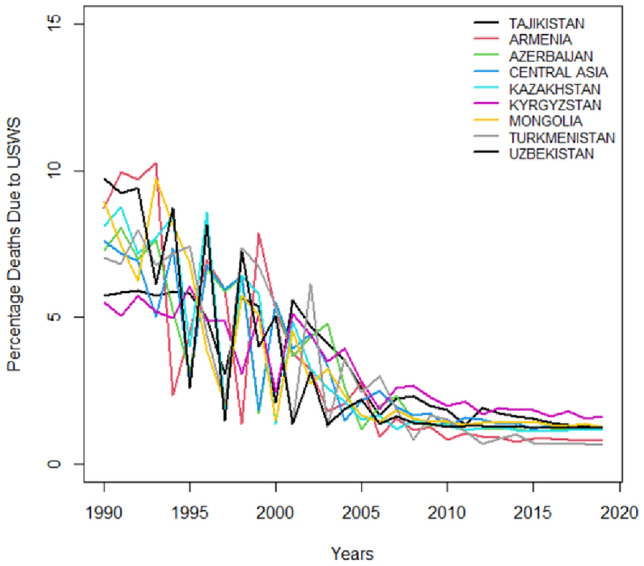
DALYs resulting from USWS.
Figure 3.
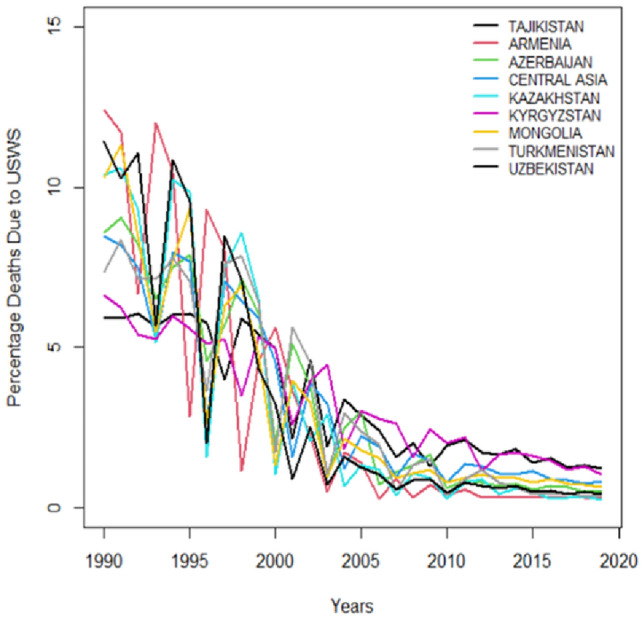
Death resulting from LOS.
Figure 4.
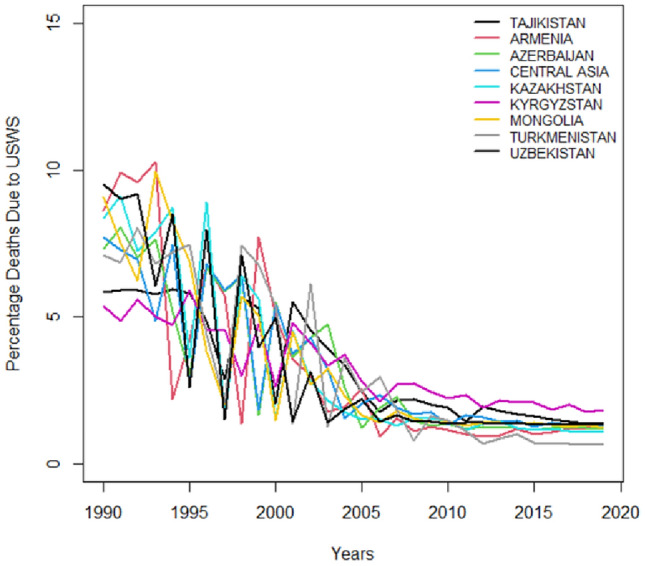
DALYs resulting from LOS.
Figure 5.
Death resulting from no AHWF.
Figure 6.
DALYs resulting from no AHWF.
The Supplementary Appendix Table A presents a comprehensive summary of descriptive statistics for time-series variables pertaining to water-related issues in diverse Islamic nations of East Asia and Central Asia. The variables under consideration include Death and DALYs associated with USWS, LOS, and AHWF. The descriptive statistics offer a detailed overview of the distribution and characteristics of these variables across the specified regions, providing insights into the magnitude and nature of the water-related challenges in the studied nations.
Upon analyzing the data, distinctive patterns emerge across these countries. In Tajikistan, the mean Death resulting from USWS is 1620.0, with a standard deviation of 942.75, indicating a relatively moderate level of variability. The minimum value of 549.8 represents the least observed mortalities, while the maximum value of 2929.9 highlights the highest recorded instances in this country. These statistics provide insights into the central tendency, variability, and range of mortalities associated with Unsaved Water Sources in Tajikistan. Moving to Armenia, we observe a mean of 51.162 deaths resulting from LOS with a standard deviation of 63.35. The variability in this case is significantly higher, as indicated by the larger standard deviation. The minimum value of 21.46 and the maximum value of 105.85 delineate the range of deaths resulting from LOS in Armenia. These statistics provide insights into the central tendency, variability, and range of mortality associated with Lack of Sanitation in Armenia. In Azerbaijan, the mean values for Death resulting from USWS, LOP and AHWF stand at 401.80, 331.90 and 359.07 respectively. The standard deviation values for Death resulting from USWS, LOS and AHWF stand at 362.37, 299.53 and 231.66. Azerbaijan exhibits a relatively moderate level of variability in these statistics. These insights provide a summary of the central tendency and variability of mortality associated with water-related issues in Azerbaijan. Central Asia is characterized by a mean of 3993.6 Death resulting from USWS exhibiting a lower level of variability of 3259.4. For Kazakhstan, the mean is 20,176 DALYs resulting from AHWF with a standard deviation of 13,649.96.
The variability in this case is significantly lower as indicated by the lower standard deviation. The minimum of 6678 and maximum of 49,097 delineate the range of DALYs resulting from AHWF. While Kyrgyzstan, shows lover mean values across all categories such as 210.41, 183.51 and 130.48 for Death resulting from USWS, LOS and AHWF respectively. In Mongolia, the mean values for Death resulting from USWS, LOP and AHWF stand at 176.85, 146.90 and 181.71 respectively. The standard deviation values for Death resulting from USWS, LOS and AHWF stand at 173.04, 145.74 and 127.75. Turkmenistan, the mean values for DALYs resulting from USWS, LOP and AHWF stand at 37,865, 29,684 and 23,312 respectively. On other hand the mean value for Death resulting from USWS, LOS and AHWF stand at 403.23, 316.4 and 275.84. For last year Uzbekistan, minimum value for Death resulting from USWS, LOS and AHWF stand at 86.29, 89.04 and 500 respectively. The maximum values for Death resulting from USWS, LOS and AHWF are 2583.53, 2404.17 and 2086.6.
Models
The research utilizes various forecasting models to predict the adverse health impacts including unsafe water sources, lack of sanitation, and absence of handwashing facilities. By using multiple models the robustness and reliability of the findings can be improved. Different models may capture several aspects of the data and use of multiple approaches make sure that the results are not dependent on the assumptions or limitations of a single model. Each model has exclusive strengths in handling different types of data and patterns. For example, ARIMA is well-suited for time series data with linear trends. Exponential Smoothing is effective for data without clear trends or seasonal patterns. SVM handles high-dimensional data well and Neural Networks are powerful for capturing complex and non-linear relationships. Using multiple models allows for a more comprehensive analysis of the data.
In this study, researcher focuses on forecasting the direction of stock movements and stock price indices for 23 Indian stock markets. The researcher has used four prediction models including (ANN), (SVM), Random Forest, and Naive Bayes24. They have established two nonlinear time-series models for predicting groundwater level (GWL) variations using (ANNs) and (SVMs)25. Their analysis is based on hourly water demand data in a hydraulic area in a city in south-eastern Spain. Several Mediterranean regions such as south-eastern Spain is suffering from large rises in the use of ground-water from its major aquifers. They have used multiple models including ANN, PPR, MARS, SVR, Random Forest and Weighted pattern-based model for water demand forecasting for predictive analysis in their research26.
Autoregressive integrated moving average
The Autoregressive Integrated Moving Average modeling approach, employing the Box-Jenkins Methodology, provides a sturdy and automated framework for conducting time series analysis. Its advantages include a high degree of flexibility and automatic model selection facilitated by functions such as auto. Arima () in R. The interpretability of its components is another key strength. However, it is important to note that the model is sensitive to assumptions of linearity, the presence of outliers, and structural changes in the data. This technique is portrayed in Fig. 7.
Figure 7.

Box–Jenkin methodology27.
Stage 1: identification
In identification the time series data is analyzed to identify any patterns, trends, or seasonality. The data may need to be transformed to obtain stationarity which means that statistical properties remain constant over time. The autocorrelation function (ACF) plots are often used to identify potential ARIMA model parameters.
Stage 2: estimation
After identifying potential models, parameters are estimated using statistical techniques. The parameters include autoregressive (AR) coefficients, moving average (MA) coefficients and differencing orders. The estimation process consists on fitting the model to the historical data.
Stage 3: diagnostic checking
This step is based on checking the model's residuals to make sure that they exhibit white noise behavior. Residuals should not show any systematic patterns indicating that the model adequately captures the underlying patterns in the data.
Stage 4: forecasting
In last stage of Box Jenkin methodology, once a satisfactory model is obtained and validated and it can be used for forecasting future values of the time series.
The ARIMA is denoted as “ARIMA(p,d,q)”. The expression is as follows:
| 1 |
where, : the integrated value,: the order of autoregressive process, : mean, : the order of moving average process,: the autoregressive operator, : the time series, : the random error, : the first derivative of time series, :the moving average operator.
ARIMA is mainly suited for analyzing time series data which involves data points collected or recorded at specific time intervals. The study spans from 1990 to 2019, making it an ideal choice to model and forecast the trends over these years. It is effective in capturing linear relationships in the data which helps in identifying trends and seasonal patterns in health impacts related to water issues and the model needs the data to be stationary. This model is useful for datasets where trends and seasonal patterns are to be identified and differencing can be applied to achieve stationarity.
Exponential smoothing method
The Single Exponential Smoothing (Single ES) method was utilized to generate forecasts for a time series dataset characterized by the absence of a seasonal pattern and the lack of a discernible increasing or decreasing trend. This approach provides a way to estimate the current level at a specific time point, utilizing a single parameter denoted as α. This parameter, ranging between 0 and 1, determines the weight assigned to the current data point.
By employing exponentially decreasing weights, the Single ES method incorporates a weighted moving average scheme. The calculation of this method is expressed as follows:
| 2 |
In our analysis, we chose Holt's exponential smoothing method as there were no discernible seasonal patterns evident in the observed data. This particular method is valuable for estimating the current slope and level which is introducing two essential parameters: α and β. The parameter α plays a crucial role in evaluating the present level, while β is instrumental in assessing the slope of the trend component at the current time point. Both α and β are restricted to values between 0 and 1.
These parameters essentially act as tuning knobs, enabling us to refine our model for a more precise interpretation of data trends. The goal is to capture and comprehend the underlying patterns in the data using Holt's exponential smoothing method in our analysis. This method facilitates more accurate predictions and supports informed decision-making. The formula for Holt's exponential smoothing method is expressed as:
and for ,
| 3 |
| 4 |
here, :the time, : the smoothed statistic, : the smoothing factor, : the previous smoothed statistic, : the trend best estimate at time , : the trend smoothing factor; .
ES methods, such as Holt's exponential, are simple yet powerful techniques that can adapt to data with trends and seasonality. This makes ES useful for forecasting short to medium-term health impacts. The techniques of this model help in smoothing out the noise in the data which is providing clearer vision into the underlying trend and patterns in the health impacts related to water problems. When the data does not display clear seasonal patterns then single exponential smoothing can efficiently capture the level and trend gears of the data which is making it suitable for forecasting in this study.
Model summaries
The comparison between ARIMA and Exponential Smoothing involved the use of the Bayesian Information Criterion (BIC) for all the countries listed in Table 2. The BIC serves as a model selection metric which is favoring simpler models with lower complexity and good data fit and particularly in time series analysis. This comparison using BIC provides insights into the relative performance of ARIMA and ES models for the specified countries which is guiding the selection of the most appropriate and effective forecasting approach based on model simplicity and data fit.
Table 2.
Comparison of models from MAPE.
| Countries | Measure | Variables | MAPE | |||
|---|---|---|---|---|---|---|
| ARIMA | ES | SVM | NN | |||
| TAJIKISTAN | Deaths | USWS | 2.46 | 2.80 | 97.48 | 160,540.3 |
| LOS | 20.35 | 20.35 | 97.17 | 132,667.9 | ||
| AHWF | 17.77 | 16.29 | 93.17 | 92,691.37 | ||
| DALYs | USWS | 22.10 | 21.38 | 99.77 | 12,167,253 | |
| LOS | 21.66 | 22.62 | 99.77 | 9,681,494 | ||
| AHWF | 17.80 | 17.46 | 99.61 | 5,464,367 | ||
| ARMENIA | Deaths | USWS | 132.77 | 80.40 | 472.59 | 34,570.48 |
| LOS | 112.10 | 85.57 | 247.16 | 34,572.1 | ||
| AHWF | 20.91 | 18.28 | 150.95 | 33,168.81 | ||
| DALYs | USWS | 68.02 | 49.84 | 98.55 | 517,887.5 | |
| LOS | 61.65 | 49.31 | 99.13 | 539,325.8 | ||
| AHWF | 42.15 | 30.02 | 97.60 | 284,805.4 | ||
| AZERBAIJAN | Deaths | USWS | 43.39 | 47.17 | 91.06 | 61,326.1 |
| LOS | 42.38 | 46.25 | 89.07 | 55,815.57 | ||
| AHWF | 21.38 | 27.86 | 85.34 | 57,649.07 | ||
| DALYs | USWS | 42.24 | 33.86 | 99.70 | 3,548,338 | |
| LOS | 42.30 | 33.88 | 99.70 | 2,982,028 | ||
| AHWF | 32.08 | 27.35 | 99.43 | 2,544,064 | ||
| CENTRAL ASIA | Deaths | USWS | 48.04 | 39.22 | 98.61 | 351,821 |
| LOS | 47.53 | 38.69 | 98.59 | 306,256.6 | ||
| AHWF | 14.97 | 18.47 | 97.94 | 310,278.2 | ||
| DALYs | USWS | 34.98 | 26.86 | 99.80 | 32,508,754 | |
| LOS | 34.87 | 26.60 | 99.80 | 28,223,310 | ||
| AHWF | 21.51 | 19.69 | 99.67 | 22,867,620 | ||
| KAZAKHSTAN | Deaths | USWS | 106.20 | 85.99 | 89.79 | 56,842.36 |
| LOS | 105.37 | 86.16 | 85.95 | 53,377.18 | ||
| AHWF | 17.45 | 20.46 | 83.18 | 51,799.18 | ||
| DALYs | USWS | 42.27 | 34.28 | 99.68 | 3,255,550 | |
| LOS | 32.15 | 42.52 | 99.69 | 2,880,369 | ||
| AHWF | 25.66 | 20.39 | 99.36 | 1,731,589 | ||
| KYRGYZSTAN | Deaths | USWS | 17.48 | 21.03 | 84.56 | 44,281.48 |
| LOS | 16.40 | 18.02 | 84.22 | 42,332.84 | ||
| AHWF | 21.99 | 20.45 | 88.62 | 38,612.72 | ||
| DALYs | USWS | 17.56 | 16.66 | 99.66 | 1,833,421 | |
| LOS | 13.84 | 13.81 | 99.67 | 1,656,675 | ||
| AHWF | 27.79 | 23.08 | 99.09 | 922,364.4 | ||
| MONGOLIA | Deaths | USWS | 42.30 | 43.12 | 85.81 | 44,525.81 |
| LOS | 42.80 | 43.88 | 87.08 | 41,813.73 | ||
| AHWF | 20.54 | 28.76 | 84.59 | 42,351.07 | ||
| DALYs | USWS | 40.16 | 29.01 | 99.58 | 1,753,492 | |
| LOS | 41.07 | 29.73 | 99.54 | 1,450,607 | ||
| AHWF | 31.79 | 24.02 | 99.24 | 1,305,470 | ||
| TURKAMENISTAN | Deaths | USWS | 76.72 | 57.99 | 86.71 | 59,804.89 |
| LOS | 78.60 | 58.91 | 84.97 | 53,404.84 | ||
| AHWF | 29.39 | 32.70 | 85.11 | 49,780.85 | ||
| DALYs | USWS | 55.45 | 43.49 | 99.64 | 3,140,953 | |
| LOS | 56.63 | 44.55 | 99.62 | 2,524,525 | ||
| AHWF | 35.58 | 28.95 | 99.35 | 1,995,966 | ||
| UZBEKISTAN | Deaths | USWS | 104.86 | 59.11 | 87.41 | 86,321.67 |
| LOS | 96.66 | 56.26 | 89.02 | 84,842.66 | ||
| AHWF | 14.33 | 12.54 | 94.99 | 130,121.9 | ||
| DALYs | USWS | 38.44 | 40.34 | 99.73 | 6,679,510 | |
| LOS | 35.84 | 38.41 | 99.74 | 6,598,389 | ||
| AHWF | 16.05 | 14.70 | 99.63 | 8,638,147 | ||
In the Box–Jenkins methodology, the ARIMA (p, d, q) model was chosen based on smaller Bayesian Information Criterion (BIC) scores. However, upon comparison it was observed that Exponential Smoothing outperformed ARIMA as evidenced by its lower BIC score (as shown in Table 1). The selection of Exponential Smoothing over ARIMA suggests that according to the BIC metric the former provides a better balance between model simplicity and data fit for the given time series data in the specified context.
Table 1.
Comparison with BIC.
| BIC score | Deaths | DALYs | ||||
|---|---|---|---|---|---|---|
| USWS | LOS | AHWF | USWS | LOS | AHWF | |
| TAJIKISTAN | ||||||
| ARIMA | 326.96 | 447.259 | 384.27 | 705.57 | 691.5 | 680.117 |
| ES | 354.560 | 447.259 | 412.490 | 735.826 | 720.8985 | 680.117 |
| ARMENIA | ||||||
| ARIMA | 277.45 | 279.06 | 226.61 | 561.27 | 564.45 | 514.99 |
| ES | 255.814 | 256.499 | 241.708 | 558.477 | 562.597 | 514.293 |
| AZERBAIJAN | ||||||
| ARIMA | 370.45 | 359.75 | 341.2 | 652.51 | 642.05 | 626.26 |
| ES | 383.315 | 371.7164 | 374.191 | 666.842 | 655.762 | 643.451 |
| CENTRAL ASIA | ||||||
| ARIMA | 517.31 | 508.77 | 473.41 | 781.17 | 772.13 | 738.27 |
| ES | 525.6883 | 514.641 | 503.875 | 802.280 | 792.911 | 770.154 |
| KAZAKHSTAN | ||||||
| ARIMA | 402.11 | 396.65 | 340.9 | 646.05 | 641.94 | 584.63 |
| ES | 381.591 | 375.293 | 357.038 | 665.287 | 657.341 | 613.491 |
| KYRGYZSTAN | ||||||
| ARIMA | 312.75 | 299.81 | 286.22 | 584.19 | 567.48 | 555.36 |
| ES | 342.762 | 329.073 | 311.496 | 614.434 | 598.192 | 580.795 |
| MONGOLIA | ||||||
| ARIMA | 338.59 | 328.49 | 315.41 | 611.59 | 602 | 585.9 |
| ES | 333.356 | 322.291 | 334.292 | 618.585 | 607.948 | 601.366 |
| TURKAMENISTAN | ||||||
| ARIMA | 389.12 | 375.63 | 344.77 | 660.25 | 646.74 | 622.52 |
| ES | 390.873 | 376.284 | 362.495 | 671.407 | 657.559 | 634.196 |
| UZBEKISTAN | ||||||
| ARIMA | 443.17 | 438.68 | 404.36 | 688.33 | 683.51 | 662.04 |
| ES | 418.025 | 415.194 | 429.506 | 715.480 | 712.617 | 700.496 |
Support vector machine
Support vector machine (SVM) regression stands as a powerful tool in the realm of machine learning, particularly in the analysis of time series data. SVMs distinguish themselves with their ability to handle complex, high-dimensional information, allowing them to discern subtle patterns over time.
Notably, SVMs exhibit resilience against overfitting, meaning they can prioritize crucial support points and are less susceptible to being unduly influenced by outliers. The flexibility of SVMs is underscored by their capacity to generalize effectively to new data, making them a versatile and robust choice for analyzing time series data.
In this research paper, SVM was initiated with a linear kernel setting the regularization parameter to 1.0. This configuration enhances the model's ability to identify linear patterns within the data. Predictions were executed on the test set to assess the model's performance, and a forward-looking forecasting loop was integrated. This loop forecasts values for future years based on the last three observations in the processed data as depicted in Fig. 8. This forecasting mechanism not only provides insights into upcoming trends but also serves as a valuable component for additional analysis. These steps within the SVM regression framework contribute to a comprehensive and robust time series analysis. They facilitate a nuanced understanding of model performance and assist in visualizing predictions in their original context, offering a glimpse into future trends for more informed decision-making.
Figure 8.
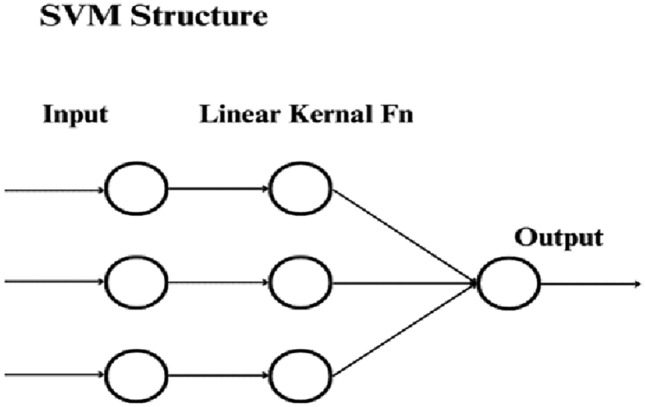
SVM model structure.
SVM is proficient of managing and analyzing high-dimensional data which is making it appropriate for complex datasets involving multiple variables related to water and health impacts. It can handle non-linear relationships through the use of kernel functions which is beneficial when the relationship between water-related issues and health impacts is not purely linear. This model is is known for its robustness against overfitting, especially in high-dimensional spaces which warrants reliable forecasts even with complex connections among the variables.
Artificial neural networks
Artificial neural networks (ANNs) is a series of algorithms inspired by the cognitive processes of the human brain which are leading the way in the predictive revolution. These networks demonstrate an impressive ability to approximate all functions without requiring in-depth knowledge about the specifics of the data. ANNs find widespread application in time series forecasting and playing a pivotal role in shaping the future of predictions.
They serve as the foundation of deep learning which is a subfield of machine learning inspired by the intricate structure of the human brain. These networks, as illustrated in Fig. 9, ingest data and autonomously undergo training to recognize patterns. This unique capability empowers them to forecast outputs for new sets of similar data that mirroring the complex workings of the human brain in processing and predicting information. The versatility and power of ANNs contribute significantly to advancing the field of predictive analytics.
Figure 9.
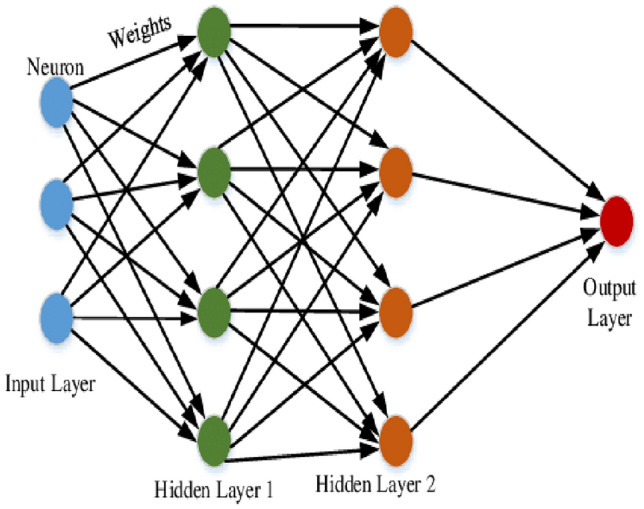
Neural network nodes28.
The paper introduces a versatile and systematic methodology for conducting time series analysis using ANN that providing valuable insights for researchers working with diverse datasets. The iterative exploration of combinations involving geographical locations, health measures, and risk factors ensures the adaptability of the model to various contexts. The model dynamically adjusts the time steps parameter that enhancing its flexibility to the unique characteristics of each dataset. The robustness of the analysis is reinforced by rigorous data preprocessing steps including chronological sorting and normalization using Standard Scaler. For each combination of factors, the program intelligently partitions the data into training and testing sets. The ANN is meticulously configured, featuring input and output layers, followed by compilation, training and incorporating early stopping to prevent overfitting.
The MAPE is computed to offer a comprehensive assessment of the model's predictive accuracy. The employed ANN is structured with distinct layers that collectively contribute to its predictive capabilities forming a comprehensive architecture designed for effective time series analysis. The methodology presented in the paper is characterized by its adaptability, robustness, and systematic approach, making it a valuable tool for researchers working across different domains and datasets.
Input layer
The input layer acts as the initial stage of the NN which is responsible for receiving the features or input data. It defines the number of neurons or nodes in this layer which are accommodating the flattened input features derived from the time series dataset. The input layer serves as the point of entry for the network where information from the time series dataset is ingested and processed in preparation for further analysis and learning by the subsequent layers of the neural network.
Hidden layers
Hidden layers play a crucial role in enhancing the NN capacity to learn complex patterns within the data. In this study, two hidden layers are incorporated to boost the model's ability to capture intricate relationships. Each hidden layer is configured using the Dense function, specifying the number of neurons and the activation function such as 'relu' (Rectified Linear Unit). The 'relu' activation function introduces non-linearity to the model that enabling it to approximate complex mappings in the data. This configuration is illustrated in Fig. 3, showcasing the architecture of the hidden layers and their role in facilitating the NN's capacity for learning complex patterns.
Output layer
The output layer, serving as the final layer of the NN, produces a single regression result. The activation function for the output layer is configured as 'linear' to generate continuous output values. To quantify the difference between predicted and actual values during model training, the “mean squared error” loss function is employed. This multi-layered architecture empowers the NN to learn and adapt to the patterns inherent in the time series data, rendering it a powerful computational framework for accurate predictions and a robust tool for forecasting within the domain of time series analysis. The mathematical representation of the NN model can be expressed as follows:
| 5 |
where, comprises a vector that includes past values of the series, and f represents ANN featuring 2 hidden nodes. The error sequence {ϵt} is presumed to exhibit homoscedasticity. ϵT + 1 is a stochastic draw from the error distribution at time T + 1, then represents a potential realization from the predicted distribution. For .
| 6 |
This approach enables a scholar to iteratively simulate upcoming sample paths. By repetitively simulating these paths, the researcher gains an understanding of the distribution for all forthcoming values, leveraging the information provided by the fitted ANN. This iterative simulation process allows for a dynamic exploration of potential future scenarios based on the patterns learned by the ANN, providing valuable insights into the distribution of anticipated values in the context of time series analysis.
ANNs are powerful in capturing complex and non-linear patterns in data. This makes them highly applicable for modeling the complicated relationships between various water-related issues and health outcomes. ANNs perform sound with large datasets, leveraging their capacity to learn from huge amounts of data to advance forecast accuracy. The dataset covering multiple countries over nearly three decades provides a rich source for ANN training. This model has the skill to adaptively learn and progress their performance as more data becomes available and making them suitable for continuing analysis and updating of health impact predictions.
Comparison of models
ARIMA, ES, SVM, and ANN were analyzed, and their performance was evaluated in relation to MAPE. It serves as a simple and intuitive measure of forecasting accuracy which is providing insights into the percentage deviation between predicted and actual values in time series analysis. This metric offers a comprehensive assessment of the models' accuracy and making it a valuable tool for comparing the forecasting performance of different methodologies across the studied time series data.
In Table 2, the forecasting performance of diverse models including ARIMA, ES, SVM and ANN is assessed using the MAPE metric. SVM, a machine learning model and NN, deep learning model outperforms statistical models ARIMA and ES. Comparing the performance of SVM and NN, the results showcase SVM's consistent outperformance across various pollution variables in East Asia and Central Asia, it's crucial to acknowledge the potential of NN to excel especially in scenarios with more extensive datasets.
For the KAZAKHSTAN, SVM notably outperforms ARIMA, ES and ANN achieving lower MAPE values across different pollution categories. In predicting Death resulting from LOS, SVM demonstrates exceptional accuracy with a MAPE of 85.9 surpassing ARIMA (105.3), ES (86.1) and NN (53,377.18).
SVM currently exhibits superior performance in this context and it's important to recognize that ANN possesses the potential to outperform SVM under different circumstances, particularly when faced with more extensive datasets. The current findings provide valuable insights into SVM's reliability for water-related health predictions in the East Asia and Central Asia. However, researchers should consider the scalability and adaptability of ANN suggesting that its performance may further improve with increased data points. This perspective underscores the importance of selecting the most suitable model based on the specific characteristics of the dataset and the forecasting task at hand.
The forecasting results from this study disclose critical visions into the health impacts of water-related issues in Islamic nations of East Asia and Central Asia from 2020 to 2030. For instance, the data for Tajikistan indicate a rising trend in water-related deaths and DALYs which is suggesting that current dealings are deficient to address the continuing water challenges. Equally, in Kazakhstan, there is a noticeable improvement which is reflecting successful involvements and policies that could help as models for other nations.
In Tajikistan, the forecast shows an increasing trend in water-related deaths which is highlighting the urgent need for better water infrastructure and sanitation facilities. Applying wide-ranging water management policies can lessen these health risks and improve public health outcomes.
Discussion
The study provides a comprehensive analysis of the health impacts of water-related challenges in the Islamic nations of East Asia and Central Asia with a focus on the period from 2020 to 2030. By analyzing data from multiple countries within Central Asia and the research offers a detailed understanding of regional health dynamics related to water quality and sanitation. The research utilizes various forecasting models to predict the adverse health impacts including unsafe water sources, lack of sanitation, and absence of handwashing facilities. The models compared in the study include the ARIMA, ES, SVM, and NN. Each model has its strengths and weaknesses and their performance is evaluated based on the MAPE for predicting deaths and DALYs related to water-related issues.
ARIMA is appreciated for its flexibility and interpretability but it is sensitive to linearity assumptions, outliers, and structural changes in the data. ES is simpler and performs well when there is no clear trend or seasonal pattern in the data. SVM is highlighted for its ability to handle complex high-dimensional data and its robustness against overfitting. While NN, particularly deep learning models are praised for their ability to approximate any function and their application in time series forecasting. The comparison of models based on MAPE reveals that SVM generally exhibits superior accuracy in predicting deaths and DALYs related to water-related issues. However, it is noted that the performance of each model can vary depending on the specific characteristics of the data and the context of the study.
To lessen the adverse health impacts which are identified in the forecasts, it is imperative to implement targeted policy interventions including investment in water infrastructure, public health campaigns and applying stricter environmental regulations to avoid industrial and agricultural pollutants from contaminating water sources. Formation of long-term monitoring and assessment frameworks is critical for tracking the efficiency of executed policies and involvements. Regular valuation of health outcomes and water quality can notify necessary changes and make sure that strategies remain effective over time. Forecasting models should be used as continuing tools to evaluate the influence of interventions and guide future policy decisions. These measures will not only decrease death rates but also improve the long-term health and economic burdens associated with waterborne diseases.
Policy suggested
Country-specific policy suggestions founded on the analysis of water-related health impacts in the Islamic nations of East Asia and Central Asia: For Tajikistan upgrade and enlarge water sanitization facilities to make sure safe drinking water for all communities and implement stricter controls on industrial and agricultural pollutants to keep safe water sources. In Armenia they should work on early warning systems for waterborne disease outbursts and deliver training for local health workers to diagnose and address water-related health issues. There should be quick water-saving technologies and practices in agriculture in Azerbaijan. Kazakhstan should strengthen collaboration with neighboring countries on the management of shared water resources. In Kyrgyzstan there should be an enlarge access to clean water in rural areas through targeted investment in water supply infrastructure. A suggestion of execution of sustainable groundwater management practices to make sure long-term water availability in Mongolia. The water management of Turkmenistan should ensure that all urban residents have access to safe drinking water and satisfactory sanitation. For Uzbekistan there should be a promote system of recycling and reuse of water in industrial procedures to decrease overall water demand.
Conclusion
In conclusion, the research emphasizes the importance of using a combination of different forecasting models to capture the complexity of water-related health impacts in the studied regions. The findings provide valuable insights for policymakers and stakeholders to take proactive measures in addressing water resource depletion and improving public health outcomes. The findings indicate that SVM generally exhibits superior accuracy in predicting health impacts compared to other models. However, the performance of each model varies based on the specific data and context. The research underscores the importance of using a combination of forecasting models to effectively capture the complexity of water-related health impacts.
Overall, the study provides valuable insights for policymakers and stakeholders to address water resource consumption and improve public health outcomes in the Islamic nations of East Asia and Central Asia. An amalgamation of different forecasting models should be used to effectively catch the complexity of water-related health impacts in the studied regions. It can offer a more thoroughly understanding of the potential health outcomes and guide targeted interventions. There should be continuous monitoring and investigation of water-related challenges and their health impacts to inform timely and effective policy and intervention strategies. Investing in water infrastructure to make sure that sources of water are safe, the sanitation is adequate, and accessible handwashing facilities is crucial to reduce the adverse health impacts associated with water-related challenges. Another recommendation from this research is increasing public awareness and offering education on the importance of safe water practices, sanitation, and hygiene can contribute to reducing the health risks associated with water-related challenges.
Supplementary Information
Acknowledgements
The authors extend their appreciation to Taif University, Saudi Arabia, for supporting this work through project number (TU-DSPP-2024-94).
Author contributions
M.A.C. and M.H. wrote the main manuscript text and conducted the literature review. O.A. contributed to time series models, including Autoregressive Integrated Moving Average, Exponential Smoothing, Support Vector Machines, and Neural Networks. E.E.M. contributed to the comparative analysis and M.N. revised the main draft. M.N. also prepared figures. All authors reviewed and approved the final manuscript.
Data availability
All data analyzed in the course of this research were sourced from the “Institute of Health Metrics and Evaluation GBD” website, covering the years 1990 to 2019. The data can be accessed through the following link: https://ghdx.healthdata.org/gbd-2019.
Competing interests
The authors declare no competing interests.
Footnotes
Publisher's note
Springer Nature remains neutral with regard to jurisdictional claims in published maps and institutional affiliations.
Supplementary Information
The online version contains supplementary material available at 10.1038/s41598-024-67775-3.
References
- 1.Kulshreshtha, S. N. A global outlook for water resources to the year 2025. Water Resour. Manage12, 167–184 (1998). 10.1023/A:1007957229865 [DOI] [Google Scholar]
- 2.Cai, X., McKinney, D. C. & Rosegrant, M. W. Sustainability Analysis for Irrigation Water Management: Concepts, Methodology, and Application to the Aral Sea Region (2001).
- 3.Spoor, M. & Krutov, A. The’power of water’in a divided Central Asia. Perspect. Glob. Dev. Technol.2(3), 593–614 (2003). 10.1163/156915003322986415 [DOI] [Google Scholar]
- 4.Winiger, M. G. H. Y., Gumpert, M. & Yamout, H. Karakorum–Hindukush–western Himalaya: Assessing high-altitude water resources. Hydrol. Process. Int. J.19(12), 2329–2338 (2005). 10.1002/hyp.5887 [DOI] [Google Scholar]
- 5.Mosello, B. Water in Central Asia: A prospect of conflict or cooperation? J. Public Int. Affairs. (2008).
- 6.Rakhmatullaev, S., Huneau, F., Le Coustumer, P. & Motelica-Heino, M. Sustainable irrigated agricultural production of countries in economic transition: Challenges and opportunities (a case study of Uzbekistan, Central Asia). Agric. Prod.1, 139–161 (2011). [Google Scholar]
- 7.Karthe, D., Chalov, S. & Borchardt, D. Water resources and their management in central Asia in the early twenty first century: Status, challenges and future prospects. Environ. Earth Sci.73, 487–499 (2015). 10.1007/s12665-014-3789-1 [DOI] [Google Scholar]
- 8.Berndtsson, R. & Tussupova, K. The future of water management in Central Asia. Water12(8), 2241 (2020). 10.3390/w12082241 [DOI] [Google Scholar]
- 9.Duzdaban, E. Water issue in Central Asia: Challenges and opportunities. Euras. Res. J.3(1), 45–62 (2021). [Google Scholar]
- 10.Suleimenova, Z. Water security in Central Asia and Southern Caucasus. Asia-Pac. Sustain. Dev. J.27(1), 75–93 (2021). 10.18356/26178419-27-1-4 [DOI] [Google Scholar]
- 11.Ogata, R., Matsuda, K., Avzal, T. J. & Abe, K. Improvement of water utility management in Tajikistan: Reduction in water wastage using a metered tariff system. AQUA Water Infrastruct. Ecosyst. Soc.72(3), 221–229 (2023). [Google Scholar]
- 12.Ahmadi, S. A. et al. The hydropolitics of Upper Karabakh, with emphasis on the border conflicts and wars between Azerbaijan and Armenia. GeoJournal88(2), 1873–1888 (2023). 10.1007/s10708-022-10714-4 [DOI] [Google Scholar]
- 13.Absametov, M., Sagin, J., Adenova, D., Smolyar, V. & Murtazin, E. Assessment of the groundwater for household and drinking purposes in central Kazakhstan. Groundw. Sustain. Dev.21, 100907 (2023). 10.1016/j.gsd.2023.100907 [DOI] [Google Scholar]
- 14.Gao, L., Zhao, Q., Bu, F. & Yan, L. Practice and prospect of water right reform in Inner Mongolia. J. Phys. Conf. Ser.2468(1), 012128 (2023). 10.1088/1742-6596/2468/1/012128 [DOI] [Google Scholar]
- 15.Zahoor, I. & Mushtaq, A. Water pollution from agricultural activities: A critical global review. Int. J. Chem. Biochem. Sci23(1), 164–176 (2023). [Google Scholar]
- 16.Gleick, P. H. & Shimabuku, M. Water-related conflicts: Definitions, data, and trends from the water conflict chronology. Environ. Res. Lett.18(3), 034022 (2023). 10.1088/1748-9326/acbb8f [DOI] [Google Scholar]
- 17.Ospina, R., Gondim, J. A., Leiva, V. & Castro, C. An overview of forecast analysis with ARIMA models during the COVID-19 pandemic: Methodology and case study in Brazil. Mathematics11(14), 3069 (2023). 10.3390/math11143069 [DOI] [Google Scholar]
- 18.Sardar, I., Akbar, M. A., Leiva, V., Alsanad, A. & Mishra, P. Machine learning and automatic ARIMA/Prophet models-based forecasting of COVID-19: Methodology, evaluation, and case study in SAARC countries. Stoch. Environ. Res. Risk Assess.37(1), 345–359 (2023). 10.1007/s00477-022-02307-x [DOI] [PMC free article] [PubMed] [Google Scholar]
- 19.Octiva, C. S., Nuryanto, U. W., Eldo, H. & Tahir, A. Application of holt-winter exponential smoothing method to design a drug inventory prediction application in private health units. J. Inf. Teknol.464, 1–6 (2024). [Google Scholar]
- 20.Wiguna, I. K. A. G., Utami, N. L. P. A. C., Parwita, W. G. S., Udayana, I. P. A. E. D. & Sudipa, I. G. I. Rainfall forecasting using the Holt-Winters exponential smoothing method. J. Inf. Sains13(01), 15–23 (2023). [Google Scholar]
- 21.Kahraman, E. & Akay, O. Comparison of exponential smoothing methods in forecasting global prices of main metals. Miner. Econ.36(3), 427–435 (2023). 10.1007/s13563-022-00354-y [DOI] [Google Scholar]
- 22.Ainapure, B. et al. Drinking water potability prediction using machine learning approaches: A case study of Indian rivers. Water Pract. Technol.18(12), 3004–3020 (2023). 10.2166/wpt.2023.202 [DOI] [Google Scholar]
- 23.William, P. et al. Artificial intelligence based models to support water quality prediction using machine learning approach. In 2023 International Conference on Circuit Power and Computing Technologies (ICCPCT), 1496–1501. (2023).
- 24.Patel, J., Shah, S., Thakkar, P. & Kotecha, K. Predicting stock and stock price index movement using trend deterministic data preparation and machine learning techniques. Expert Syst. Appl.42(1), 259–268 (2015). 10.1016/j.eswa.2014.07.040 [DOI] [Google Scholar]
- 25.Yoon, H., Jun, S. C., Hyun, Y., Bae, G. O. & Lee, K. K. A comparative study of artificial neural networks and support vector machines for predicting groundwater levels in a coastal aquifer. J. Hydrol.396(1–2), 128–138 (2011). 10.1016/j.jhydrol.2010.11.002 [DOI] [Google Scholar]
- 26.Herrera, M., Torgo, L., Izquierdo, J. & Pérez-García, R. Predictive models for forecasting hourly urban water demand. J. Hydrol.387(1–2), 141–150 (2010). 10.1016/j.jhydrol.2010.04.005 [DOI] [Google Scholar]
- 27.Abonazel, M. R. & Abd-Elftah, A. I. Forecasting Egyptian GDP using ARIMA models. Rep. Econ. Financ.5(1), 35–47 (2019). 10.12988/ref.2019.81023 [DOI] [Google Scholar]
- 28.Nti, I. K., Samuel, A. A. & Michael, A. Predicting monthly electricity demand using soft-computing. Rep. Econ. Financ.6, 1967–1973 (2019). [Google Scholar]
Associated Data
This section collects any data citations, data availability statements, or supplementary materials included in this article.
Supplementary Materials
Data Availability Statement
All data analyzed in the course of this research were sourced from the “Institute of Health Metrics and Evaluation GBD” website, covering the years 1990 to 2019. The data can be accessed through the following link: https://ghdx.healthdata.org/gbd-2019.