

ABSTRACT
Background
N7‐methylguanosine (m7G) modification is one of the most prevalent RNA modifications in humans. Dysregulated m7G modifications caused by aberrant expression of m7G writers contribute to cancer progression and result in worse patient survival in several human cancers. However, studies that systematically assess the frequency and clinical relevance of aberrant m7G writer expression in a pan‐cancer cohort remain to be performed.
Aims
This study aims to systematically investigate the molecular alteration and clinical relevance of m7G methyltransferase in human cancers.
Methods
We analysed genome, transcriptome and clinical data from the Cancer Genome Atlas Research Network spanning 33 types of human cancers for aberrant changes in genes encoding m7G writers.
Result
We demonstrate that m7G writers are dysregulated in human cancers and are associated predominantly with poorer survival. By dividing patients into those with high and low m7G scores, we show that a lower m7G score is generally associated with immune infiltration and better response to immunotherapy.
Conclusion
Our analyses indicate the genetic alterations, expression patterns and clinical relevance of m7G writers across various cancers. This study provides insights into the potential utility of m7G writer expression as a cancer biomarker and proposes the possibility of targeting m7G writers for cancer therapy.
1. Introduction
N7‐methylguanosine (m7G) modification is one of the most prevalent RNA modifications in humans that regulates RNA metabolism [1]. m7G is deposited at 5′ cap and internal sites of messenger RNA (mRNA), transfer RNA (tRNA), ribosomal RNA (rRNA) and microRNA (miRNA) [1, 2]. So far, the understanding of m7G regulators remains preliminary. Several m7G writers have been identified. Methyltransferase like 1 (METTL1)/WD repeat domain 4 (WDR4) instals m7G on internal mRNA, tRNA and miRNA [3, 4]. The RNA guanine‐7 methyltransferase (RNMT)/family with sequence similarity 103 member A1 (FAM103A1) complex regulates the 5′ cap m7G modification [5]. Williams–Beuren syndrome chromosome region 22 protein (WBSCR22)/multifunctional methyltransferase subunit TRM112‐like protein (TRMT112) mediates rRNA m7G methylation [6]. However, the lack of reported m7G erasers and readers underscores a significant gap in the current knowledge [2, 7, 8]. Recently, the first internal m7G reader protein, quaking, has been identified [9]. This protein has been shown to regulate the stability and translational efficiency of a subset of internal m7G‐modified transcripts under stress conditions [9]. Although the understanding of m7G regulators is not sufficient, more and more evidence suggests that dysregulated m7G modification mediated by aberrant expression of m7G writers contributes to cancer development [1]. Overexpression of m7G writers METTL1/WDR4 results in an increased abundance of m7G‐methylated tRNA, which in turn upregulates the translational efficiency of cell cycle‐regulating transcripts to drive cancer progression [10]. In addition, METTL1/WDR4 regulates miRNA maturation in an m7G‐dependent manner, further contributing to cancer progression in lung and bladder cancer [4, 11]. Furthermore, another m7G writer WBSCR22 has been reported as an oncogene in glioma, as it promotes the proliferation, migration and invasion of glioma cells [12]. RNMT has been found to play an oncogenic role in PIK3CA mutant breast cancer [13]. These findings highlight the importance of understanding the role of m7G writers in cancer and their potential implications for therapy. However, few studies have comprehensively evaluated the genetic alteration and clinical relevance of m7G writers in pan‐cancer cohorts. Here, we systematically investigated the molecular alteration and clinical relevance of m7G writers across 33 human cancers.
2. Methods
2.1. Data Collection and Processing
All datasets including gene expression, clinical characteristics, somatic mutation and copy number alteration were downloaded from the Cancer Genome Atlas (TCGA, https://portal.gdc.cancer.gov/). The m7G writers (METTL1, WDR4, RNMT, FAM103A1, WBSCR22 and TRMT112) were sourced from the previous literature [1]. All data processing steps and statistical analyses were performed in the R v4.2.2 statistical environment (http://www.r‐project.org).
2.2. Description of 33 Types of Cancer From TCGA
In this study 33 different types of cancer from TCGA were analysed, including ACC, adrenocortical carcinoma (n = 79 primary tumour [TP]); BRCA, breast cancer (n = 113 normal tissue [NT], 1111 TP); BLCA, bladder urothelial carcinoma (n = 19 NT, 412 TP); CESC, cervical squamous cell carcinoma and endocervical adenocarcinoma (n = 3 NT, 304 TP); CHOL, cholangiocarcinoma (n = 9 NT, 35 TP); COAD, colon adenocarcinoma (n = 41 NT, 481 TP); DLBC, lymphoid neoplasm diffuse large B‐cell lymphoma (n = 48 TP); ESCA, oesophageal carcinoma (n = 13 NT, 184 TP); GBM, glioblastoma multiforme (n = 5 NT, 157 TP); HNSC, head and neck squamous carcinoma (n = 44 NT, 520 TP); KICH, kidney chromophobe (n = 25 NT, 66 TP); KIRC, kidney renal clear cell carcinoma (n = 72 NT, 541 TP); KIRP, kidney renal papillary cell carcinoma (n = 32 NT, 290 TP); LAML, acute myeloid leukaemia (n = 151 TP); LGG, brain lower grade glioma (n = 516 TP); LIHC, liver hepatocellular carcinoma (n = 50 NT, 371 TP); LUAD, lung adenocarcinoma (n = 59 NT, 539 TP); LUSC, lung squamous cell carcinoma (n = 51 NT, 502 TP); MESO, mesothelioma (n = 87 TP); OV, ovarian serous cystadenocarcinoma (n = 422 TP); PAAD, pancreatic adenocarcinoma (n = 4 NT, 178 TP); PCPG, pheochromocytoma and paraganglioma (n = 3 NT, 179 TP); PRAD, prostate adenocarcinoma (n = 51 NT, 501 TP); READ, rectum adenocarcinoma (n = 10 NT, 166 TP); SARC, sarcoma (n = 2 NT, 259 TP); SKCM, skin cutaneous melanoma (n = 1NT, 103TP); STAD, stomach adenocarcinoma (n = 36 NT, 412 TP); TGCT, testicular germ cell tumours (n = 150 TP); THCA, thyroid carcinoma (n = 59 NT, 505 TP); THYM, thymoma (n = 2 NT, 120 TP); UCEC, uterine corpus endometrial carcinoma(n = 25 NT, 553 TP); UCS, uterine carcinosarcoma (n = 57 TP) and UVM, uveal melanoma (n = 80 TP).
2.3. Analysis of Copy Number Alteration and Somatic Mutation Frequency
CNA data for patients of 33 cancer types were downloaded from TCGA Gistic2 Level 4 datasets via getData() R‐package ‘RTCGAToolbox’ from Broad GDAC Firehose (https://gdac.broadinstitute.org/) [14]. Genes with copy number >2 were defined as amplified and genes with copy number <−2 were defined as deleted.
The mutation data for patients of 33 cancer types were downloaded from TCGA Gistic2 Level 3 data sets via getData() R‐package ‘RTCGAToolbox’ with mutation = TRUE.
2.4. Analysis of Differential Gene Expression Across Cancer Types
The RNA‐seq dataset, Fragments per kilobase of transcript per million mapped reads upper quartile (FPKM‐UQ)‐based gene expression for 33 types of cancer were obtained from TCGA via the R package ‘TCGAbiolinks’. The log2 fold‐change was calculated based on the formula.
Comparisons of expression data between tumour and normal tissues were conducted only in cancers with at least five tumour‐normal pairs. The statistical differences are calculated by using the Wilcoxon rank‐sum test. p value <0.05 was considered statistically significant.
The expression correlations among METTL1, WDR4, RNMT, FAM103A1, WBSCR22 and TRMT112 among TCGA tumours were conducted by using the Pearson correlation coefficient. The protein–protein interaction among m7G writers is based on the STRING interaction database [15].
2.5. Survival Analysis
The clinical information for patients of 33 cancers type was downloaded via ‘TCGAbiolinks’ including vital status, days to death and days to last follow‐up. The prognosis of patients' overall survival (OS) was compared based on the median expression levels of each m7G writer. The log‐rank test was used to test the different OS rates between two groups by R‐package ‘survival’ (https://CRAN.R‐project.org/package=survival). Kaplan–Meier curves were generated to visualise the differences in the OS of patients by ‘survminer’ R‐packages (https://rpkgs.datanovia.com/survminer/index.html). The univariate and multivariate Cox proportional hazards regression models for different cancers were analysed by the ‘survival’ and ‘survminer’ R‐packages. p value <0.05 were considered significant.
2.6. Analysis of Correlation Between m7G Writer Gene Expression and Hallmark Pathway
Hallmark gene sets were obtained from MSigDB. Gene Set Variation Analysis (GSVA) was performed to elucidate the underlying biological pathway and function differences associated with the altered gene signature [16]. GSVA was performed using the ‘GSVA’ R package. To identify the m7G writers that were correlated with activation or inhibition of a cancer‐related‐hallmark pathway, the Pearson Correlation Coefficient (PCC) between the expression of m7G writers and pathway activity was calculated by ‘Hmisc’ R‐package (https://cran.r‐project.org/web/packages/Hmisc/index.html). The |PCC| >0.5 and adjusted p value <0.05 were set as thresholds to identify a significant correlation between m7G writers and hallmark‐related pathways.
2.7. m7G Score
To quantify the m7G modification pattern in each cancer patient, the m7G scoring system was generated by principal component analysis (PCA). Principal components 1 and 2 were used as scoring coefficients. The following formula was used to calculate the score for each sample, where i represents the expression of the m7G writer gene.
The patients were divided into high and low m7G score groups by ‘surMisc’ R‐package (https://cran.r‐project.org/web/packages/survMisc/index.html). To investigate the prognostic significance of the m7G score, Kaplan–Meier analysis was performed on the high and low m7G score group with the ‘survival’ and ‘survminer’ R package.
2.8. Immune Cell Infiltration
Tumour microenvironment immune cell infiltration was determined by single‐sample Gene Set Enrichment analysis (ssGESA). The 46 integrated immune gene sets were obtained from the published studies [17]. The ssGSEA scores of each gene were calculated across 10 079 samples in the pan‐cancer cohort. The correlation between immune cells and m7G writers' expression was calculated by Pearson's method by ‘Hmisc’ R‐package.
The CIBERSORT algorithm is a method to characterise the cell composition of tumour tissues based on their gene expression profiles [18]. LM22 is an expression data for 22 common immune cells obtained from CIBERSORT. The proportion of 22 immune cells in the high and low m7G expression group was calculated by CIBERSORT.
3. Result
We first investigated the somatic mutation of m7G writers in cancers. Although the average mutation frequency of m7G writers was low (0.1%–3.5%), cancers with higher global mutation burden [19], including UCEC, STAD and SKCM, exhibited a higher mutation frequency of m7G writers (Figure 1A and Table S1). There was a uniquely higher mutation frequency of RNMT in different cancer types, particularly in UCEC, STAD, SKCM and LUAD (Figure 1A).
FIGURE 1.

Genetic alteration and expression changes of m7G writers in 33 human cancers. (A) Mutation frequency of m7G writers across 33 cancer types. The upper bar plot indicates the overall m7G mutation frequency in individual cancers. The right bar plot represents the overall m7G mutation frequency in 33 cancer types. A total of 33 types of human cancer are categorised based on their sites of occurrence and indicated by the same colour in the annotated bar. (B) The CNA alteration frequency of m7G writer genes across 33 cancer types. The upper part of each grid represents amplification frequency and the lower part represents the frequency of deletion. (C) Copy number alteration frequency of METTL1 in 33 cancer types. The red and blue bars represent the frequency of amplification and deletion, respectively. (D) Differential gene expression of m7G writer genes in 18 cancer types. The heatmap represents log2 fold‐change (tumour/normal) with red and blue representing upregulated and downregulated genes, respectively. For (B and D), the site of occurrence for each cancer is annotated in the coloured bar as in (A). The Wilcoxon rank test was used to compare the two groups. Significance was denoted by *p < 0.05; **p < 0.01; ***p < 0.001 and ****p < 0.0001. (E) Gene expression correlation between the m7G writers. Genes that belong to the same m7G writer complex are printed in the same colour. (F) The protein–protein interaction map of m7G writers.
We then determined the frequency of copy number alteration (CNA) in m7G writer genes across 33 cancer types. We observed a generally low frequency of amplification and deletion in m7G writer genes across 33 cancer types (<10%) (Figures 1B and S1; Table S2), apart from METTL1, which showed amplification across various cancer types, particularly in SARC and GBM (~15%) (Figure 1B,C).
We explored the expression patterns of m7G writers in cancers by comparing their expression levels between primary tumours and normal tissues in 18 cancer types. We observed an overall higher expression of m7G writers in tumours compared with normal tissues regardless of the site of origin (Figures 1D, S2 and S3). Notably, lung cancer (LUSC and LUAD) exhibited upregulation of all m7G writers, implying a potential role of m7G modification in lung cancer. Consistent with the prevalence of METTL1 amplification, METTL1 was significantly upregulated in GBM tumours (Figure 1D). Notably, METTL1 and WDR4 are downregulated in cancers that originate from the endocrine system (Figures 1D and S3). For the m7G cap writers, we observed an opposing expression pattern of RNMT and FAM103A1 in cancer (Figure 1D). RNMT was downregulated in GBM and UCEC tumours, consistent with the overall downregulation of RNMT in brain and gynaecological cancers (Figure S3), whereas the expression of FAM103A1 increased in these cancers (Figure 1D). Our results demonstrated that m7G writers were dysregulated in human cancer indicating their potential roles in tumourigenesis.
We further investigated the correlation of expression levels between m7G writer genes. In general, there was a positive correlation among writers' genes that belonged to the same protein complex, except RNMT. Notably, RNMT negatively correlated with all other m7G writers including its cofactor, FAM103A1 (Figure 1E). m7G writers interacted with each other based on the protein–protein interaction network (Figure 1F). Overall, our result indicates a synergistic expression of METTL1/WDR4 genes in cancers, consistent with their functions as a complex. This observation holds true for WBSCR22/TRMT112 genes that form another m7G writer complex targeting rRNA. The negative correlation of expression levels between RNMT and FAM103A1 is surprising given their role as a complex that regulates 5′ cap m7G. It is conceivable that FAM103A1 may have another binding partner that acts in place of RNMT. RNMT may also have a role in tumourigenesis that is independent of FAM103A1. Our data provides information regarding the types of cancers that may be suitable for future investigations into these possibilities (Figure 1D).
When examining clinical relevance, our findings revealed that higher expression of m7G writers was associated with the overall survival of patients in 15 cancer types (Figures 2A and S4). Higher expression of m7G writers, METTL1, WDR4, FAM103A1, WBSCR22 and TRMT112, was significantly associated with poor overall survival of KIRC patients. In contrast, RNMT overexpression conferred better overall survival in KIRC (Figure 2A and S5). Higher expression of METTL1 and its cofactor WDR4 were significantly associated with poorer overall survival in LGG and LIHC, indicating an oncogenic role of the METTL1/WDR4 methyltransferase in these cancers (Figure 2A). WBSCR22 displayed potential oncogenic features in brain cancers (LGG and GBM). Higher expression of TRMT112 was associated with poorer overall survival in kidney cancers (KIRC and KIRP) (Figure 2A). Collectively, these results suggest that m7G writers have the potential to predict survival outcomes in a cancer‐type‐specific manner.
FIGURE 2.
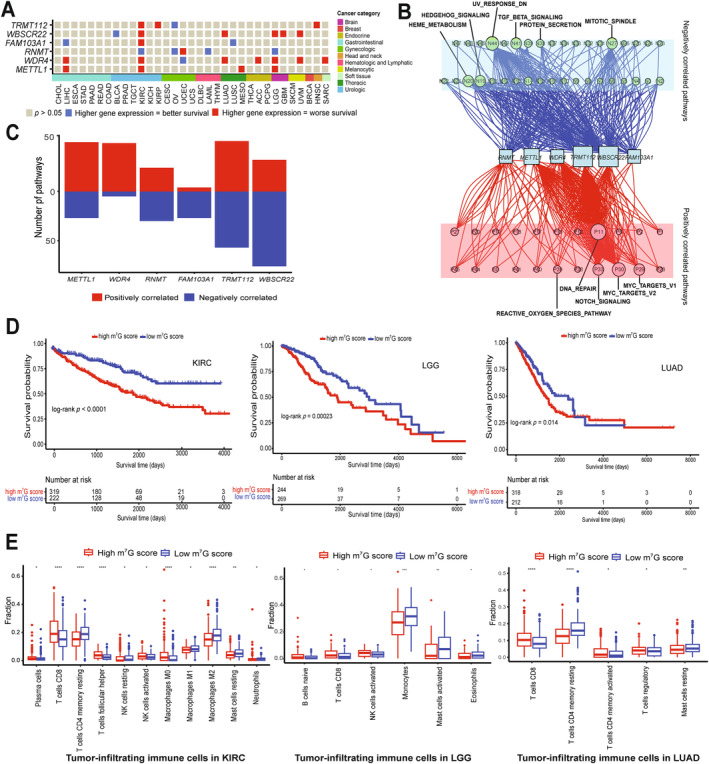
Clinical relevance of m7G writers in human cancer. (A) An Association between expression of m7G writers and overall patient survival in 33 cancer types. Red represents higher gene expression associated with worse overall survival. Blue represents higher gene expression associated with better overall survival. A total of 33 types of human cancer are categorised based on their sites of occurrence and indicated by the same colour in the annotated colour bar. (B) The network diagram indicates the correlation between m7G writers and cancer pathways. Red nodes show positively‐correlated pathways and green nodes show negatively‐correlated pathways. The size of nodes represents the number of links. (C) The number of pathways correlated with individual m7G writers. The upper red panel shows positively correlated pathways, and the bottom blue panel shows negatively correlated pathways. (D) Kaplan–Meier survival plot in KIRC (left), LGG (middle) and LUAD (right) grouped by m7G score. (E) Box plot shows immune cell infiltration composition of tumour microenvironment in m7G‐high and ‐low groups in KIRC (left), LGG (middle) and LUAD (right). Red and blue represent the m7G‐high and ‐low groups. The Wilcoxon rank test was used to compare the two groups. Significance was denoted by *p < 0.05; **p < 0.01; ***p < 0.001 and ****p < 0.0001.
We investigated the molecular mechanisms by which m7G writers contribute to cancer pathogenesis by correlating the expression of m7G writers with the activity of 50 cancer hallmark‐related pathways. The expression of m7G writers was significantly correlated with the activation of pathways including DNA repair, MYC and Notch signalling (Figure 2B and Table S3). Conversely, m7G writer expression correlated with the inhibition of pathways, including downregulation of genes under UV radiation, mitotic spindle assembly, TGF beta signalling pathways and heme metabolism (Figure 2B and Table S3). Furthermore, the expression of WBSCR22 and TRMT112 showed correlations with a higher number of both activated and inhibited pathways (Figure 2C). Our data indicate that m7G writers may play a role in the activation and inhibition of cancer‐related pathways.
We further explored the infiltration of immune cells in cancers based on the overall expression of m7G writers. Given that our analysis revealed higher expression of nearly all m7G writers in KIRC, LGG and LUAD patients with poorer overall survival (Figure 2A) and emerging evidence that immunotherapy improves prognosis in KIRC, LGG and LUAD patients [20, 21, 22], we analysed immune cell infiltration in KIRC, LGG and LUAD patients. We divided these into two groups: the m7G‐high group and the m7G‐low score group. We observed that patients with high m7G scores showed poor prognosis (Figure 2D). Furthermore, we performed multivariate Cox regression analysis including the m7G score and main clinicopathological features (gender, age, race, grade, stage, tumour, node and metastasis). We subsequently stratified these main clinicopathologic features to investigate whether the m7G score affects prognosis within these groups (Figures [Link], [Link]). The analysis showed that the m7G score was significantly associated with poor prognosis in KIRC, LGG and LUAD, suggesting it is an independent prognostic factor in these cancers. This indicates that the m7G score is an effective marker for evaluating the survival outcome of KIRC, LGG and LUAD patients. We conducted gene enrichment analysis based on the m7G score, which showed higher enrichment of immune cell infiltration in the m7G‐low score group (Figure S9). Using CIBERSORT algorithms, we found significantly higher infiltration of resting T cells CD4 memory, resting NK cells, macrophage M1, macrophage M2, resting mast cells and neutrophils in the m7G‐low score group in KIRC. Similarly, the m7G‐low score group in LGG exhibited higher infiltration of monocytes, activated mast cells and eosinophils. In LUAD, the m7G‐low score group showed higher infiltration of resting T cells CD4 memory and resting mast cells (Figure 2E). Our findings suggest that m7G score is associated with immune cell infiltration in tumours, indicating a potential link between m7G writer expression and immunotherapy response in cancer patients.
4. Discussion
Our study comprehensively evaluated the molecular alteration and clinical relevance of m7G writers across the pan‐cancer cohort. We observed dysregulated expressions of m7G writers across various human cancers, indicating their potential significance in tumourigenesis. Intriguingly, these dysregulations were significantly associated with the prognosis of specific cancer types, suggesting that m7G writers may serve as prognostic marker for these cancers. Furthermore, the expression of m7G writers were strongly associated with the activation and inhibition of cancer‐related hallmark pathways, showing the multifaceted roles of m7G writers in cancer progression. Our results also revealed that the expression of m7G writers played a crucial role in influencing immune cell infiltration within the tumour microenvironment, particularly in cancers such as KIRC, LGG and LUAD.
In the context of our study, we emphasise the importance of m7G writers in human cancers as they deposit m7G modification on RNA, thereby mediating a variety of critical RNA metabolism processes [1]. The current understanding of m7G erasers and readers is in its nascent stages, making it challenging to comprehensively explore their roles and implications in human cancers [2, 7, 8]. Recent studies that included proteins involved in downstream processes relevant to m7G modification in their analyses need to be interpreted with caution, as there is no evidence suggesting that these ‘m7G‐related proteins’ directly recognise m7G [23, 24]. These m7G‐related proteins are primarily binding to the structure of the m7G‐cap of mRNA rather than directly recognising the m7G modification itself [25]. Our results clearly demonstrate that changes in m7G writers alone are sufficient to predict clinical outcomes across diverse cancers and the inclusion of other controversial m7G‐related regulators may not be necessary.
Our data underscores the significance of m7G writers in KIRC, the most prevalent and aggressive subtype of kidney cancer [26]. We found that aberrant expression of all m7G writers is associated with overall survival in KIRC patients, indicating that m7G writers may serve as prognostic markers and therapeutic targets in KIRC.
Immunotherapy has emerged as a promising treatment approach for KIRC [22]. However, the immunotherapy response varies among patients. Tumour‐infiltrating immune cells play a critical role in determining sensitivity of immunotherapy in KIRC. Our data demonstrate an association between the m7G score, developed based on the expression of m7G writers, and immune cell infiltration in KIRC. Higher infiltration of various types of immune cells was observed in the m7G score low group in KIRC. This result suggests that KIRC tumours with low m7G score are potentially ‘hot’ tumours associated with better response to immunotherapy [27]. We also found that low m7G score was positively associated with infiltration of anti‐tumourigenic M1 macrophage and pro‐tumourigenic M2 macrophage in KIRC, indicating the complexity of infiltrated immune cells within tumour and heterogeneity of tumour [28, 29]. Our findings reveal the association between m7G writers and immune cell infiltration within the tumour microenvironment and suggest their potential as targets for improving immunotherapy outcomes for KIRC patients.
However, there are some limitations in our study. Firstly, we only investigate the m7G writer expression by using the data from the TCGA database, without validation across multiple databases. The TCGA database remains the only source of multi‐omic data for more than 10 000 cancer genomes and matched normal samples across 33 cancer types [30], making it difficult to validate our pan‐cancer analysis using other resources. Second, there is a lack of experimental validation of the function of m7G writers in human cancer. Although our study addressed the association between the expression of m7G writers and human cancers, the underlying mechanisms remain unclear. Experimental studies are needed to elucidate RNAs that are affected by aberrant expression of m7G writers, leading to cancer development and progression.
5. Conclusion
In conclusion, our study indicates that m7G writers are dysregulated in various human cancers. These dysregulations are associated with the prognosis of specific cancers. Additionally, the expression of m7G writers is linked to the activation and inhibition of the cancer‐oncogenic pathways and significantly affects immune cell infiltration in the tumour microenvironment in cancers like KIRC, LGG and LUAD. Overall, our study provides a resource to infer the role of m7G writers in cancer and provides insights into the role of m7G writers as cancer biomarkers and therapeutic targets.
Author Contributions
Anni Su: data curation (lead), formal analysis (lead), writing–original draft (lead), writing–review and editing (equal). Renhua Song: formal analysis (equal), supervision (supporting). Justin J.‐L. Wong: conceptualization (lead), funding acquisition (lead), project administration (lead), resources (lead), supervision (lead), writing–original draft (equal), writing–review and editing (equal).
Ethics Statement
The authors have nothing to report.
Conflicts of Interest
The authors declare no competing financial interest.
Supporting information
Figure S1. Frequency of genetic alteration of individual m7G writer genes in human cancers. The bars represent the frequency of deep deletion (blue) and amplification (red) of m7G writer genes in each of the 33 cancer types.
Figure S2. Gene expression level of the individual m7G writer gene in human cancers. The red and blue boxes represent tumour and normal samples, respectively. The Wilcoxon test was used to compare the two groups. Significance is denoted by *p < 0.5; **p < 0.01; ***p < 0.001; ****p < 0.0001.
Figure S3. Gene expression level of the individual m7G writer gene in human cancers based on the sites of occurrence. The red and blue boxes represent tumour and normal samples, respectively. The Wilcoxon test was used to compare the two groups. Significance is denoted by *p < 0.05; **p < 0.01; ***p < 0.001; ****p < 0.0001.
Figure S4. Overall survival for patients with different types of cancer‐based on the expression of m7G writers. The forest map shows the overall survival risk ratio of six m7G writer genes in 33 TCGA cancer types. Significance is denoted by p < 0.05 by the log‐rank test.
Figure S5. Kaplan–Meier survival curves of KIRC patients based on the expression of m7G writers. Red and blue represent higher (>median) and lower (<median) levels of gene expression respectively. Significance is denoted by p < 0.05 log‐rank test.
Figure S6. Multivariate analysis of m7G score and main clinicopathological features in KIRC and Kaplan–Meier survival curves stratified by main clinicopathological features in KIRC. Significance is denoted by p < 0.05 log‐rank test.
Figure S7. Multivariate analysis of m7G score and main clinicopathological features in LGG and Kaplan–Meier survival curves stratified by main clinicopathological features in LGG. Significance is denoted by p < 0.05 log‐rank test.
Figure S8. Multivariate analysis of m7G score and main clinicopathological features in LUAD and Kaplan–Meier survival curves stratified by main clinicopathological features in LUAD. Significance is denoted by p < 0.05 log‐rank test.
Figure S9. Heatmap demonstrates the normalised enrichment scores of 46 immune cell infiltrates in KIRC, LGG and LUAD patients using the single‐sample Gene set Enrichment analysis (ssGESA) scores. Rows represent tumour infiltrating immune cells and columns represent samples, red and blue indicate the m7G‐high and ‐low groups, respectively.
Table S1. Frequency of mutations of m7G regulatory genes in 33 types of cancers.
Table S2. Frequency of copy number alteration of m7G writer genes in human cancer.
Table S3. The correlation between the expression of m7G writer genes and cancer‐related hallmark pathways.
Acknowledgements
The results shown here are in part based on data generated by the TCGA Research Network (https://cancergenome.nih.gov/).
Funding: Justin J.‐L. Wong is funded by the National Health and Medical Research Council (Grant # 2010647), the NSW Health (Grant # 46014) and the Australian Research Council (Grant # DP230102041).
Data Availability Statement
These data were derived from the following resources available in the public domain: the TCGA Research Network (https://cancergenome.nih.gov/).
References
- 1. Luo Y., Yao Y., Wu P., Zi X., Sun N., and He J., “The Potential Role of N7‐Methylguanosine (m7G) in Cancer,” Journal of Hematology & Oncology 15, no. 1 (2022): 63. [DOI] [PMC free article] [PubMed] [Google Scholar]
- 2. Xia X., Wang Y., and Zheng J. C., “Internal m7G Methylation: A Novel Epitranscriptomic Contributor in Brain Development and Diseases,” Molecular Therapy–Nucleic Acids 31 (2023): 295–308. [DOI] [PMC free article] [PubMed] [Google Scholar]
- 3. Alexandrov A., Martzen M. R., and Phizicky E. M., “Two Proteins That Form a Complex Are Required for 7‐Methylguanosine Modification of Yeast tRNA,” RNA 8, no. 10 (2002): 1253–1266. [DOI] [PMC free article] [PubMed] [Google Scholar]
- 4. Pandolfini L., Barbieri I., Bannister A. J., et al., “METTL1 Promotes let‐7 MicroRNA Processing via m7G Methylation,” Molecular Cell 74, no. 6 (2019): 1278–1290.e9. [DOI] [PMC free article] [PubMed] [Google Scholar]
- 5. Trotman J. B., Giltmier A. J., Mukherjee C., and Schoenberg D. R., “RNA Guanine‐7 Methyltransferase Catalyzes the Methylation of Cytoplasmically Recapped RNAs,” Nucleic Acids Research 45, no. 18 (2017): 10726–10739. [DOI] [PMC free article] [PubMed] [Google Scholar]
- 6. Haag S., Kretschmer J., and Bohnsack M. T., “WBSCR22/Merm1 Is Required for Late Nuclear Pre‐Ribosomal RNA Processing and Mediates N7‐Methylation of G1639 in Human 18S rRNA,” RNA 21, no. 2 (2015): 180–187. [DOI] [PMC free article] [PubMed] [Google Scholar]
- 7. Zhang X., Zhu W. Y., Shen S. Y., Shen J. H., and Chen X. D., “Biological Roles of RNA m7G Modification and Its Implications in Cancer,” Biology Direct 18, no. 1 (2023): 58. [DOI] [PMC free article] [PubMed] [Google Scholar]
- 8. Du D., He J., Ju C., et al., “When N7‐Methyladenosine Modification Meets Cancer: Emerging Frontiers and Promising Therapeutic Opportunities,” Cancer Letters 562 (2023): 216165. [DOI] [PubMed] [Google Scholar]
- 9. Zhao Z., Qing Y., Dong L., et al., “QKI Shuttles Internal m7G‐Modified Transcripts Into Stress Granules and Modulates mRNA Metabolism,” Cell 186, no. 15 (2023): 3208–3226.e27. [DOI] [PMC free article] [PubMed] [Google Scholar]
- 10. Orellana E. A., Liu Q., Yankova E., et al., “METTL1‐Mediated m7G Modification of Arg‐TCT tRNA Drives Oncogenic Transformation,” Molecular Cell 81, no. 16 (2021): 3323–3338.e14. [DOI] [PMC free article] [PubMed] [Google Scholar]
- 11. Xie H., Wang M., Yu H., et al., “METTL1 Drives Tumor Progression of Bladder Cancer via Degrading ATF3 mRNA in an m7G‐Modified miR‐760‐Dependent Manner,” Cell Death Discovery 8, no. 1 (2022): 458. [DOI] [PMC free article] [PubMed] [Google Scholar]
- 12. Chi Y., Liang Z., Guo Y., et al., “WBSCR22 Confers Cell Survival and Predicts Poor Prognosis in Glioma,” Brain Research Bulletin 161 (2020): 1–12. [DOI] [PubMed] [Google Scholar]
- 13. Dunn S., Lombardi O., Lukoszek R., and Cowling V. H., “Oncogenic PIK3CA Mutations Increase Dependency on the mRNA cap Methyltransferase, RNMT, in Breast Cancer Cells,” Open Biology 9, no. 4 (2019): 190052. [DOI] [PMC free article] [PubMed] [Google Scholar]
- 14. Mermel C. H., Schumacher S. E., Hill B., Meyerson M. L., Beroukhim R., and Getz G., “GISTIC2.0 Facilitates Sensitive and Confident Localization of the Targets of Focal Somatic Copy‐Number Alteration in Human Cancers,” Genome Biology 12, no. 4 (2011): R41. [DOI] [PMC free article] [PubMed] [Google Scholar]
- 15. Szklarczyk D., Franceschini A., Wyder S., et al., “STRING v10: Protein–Protein Interaction Networks, Integrated Over the Tree of Life,” Nucleic Acids Research 43, no. Database issue (2015): D447–D452. [DOI] [PMC free article] [PubMed] [Google Scholar]
- 16. Hänzelmann S., Castelo R., and Guinney J., “GSVA: Gene set Variation Analysis for Microarray and RNA‐Seq Data,” BMC Bioinformatics 14, no. 1 (2013): 7. [DOI] [PMC free article] [PubMed] [Google Scholar]
- 17. Zuo S., Wei M., Wang S., Dong J., and Wei J., “Pan‐Cancer Analysis of Immune Cell Infiltration Identifies a Prognostic Immune‐Cell Characteristic Score (ICCS) in Lung Adenocarcinoma,” Frontiers in Immunology 11 (2020): 1218. [DOI] [PMC free article] [PubMed] [Google Scholar]
- 18. Newman A. M., Liu C. L., Green M. R., et al., “Robust Enumeration of Cell Subsets From Tissue Expression Profiles,” Nature Methods 12, no. 5 (2015): 453–457. [DOI] [PMC free article] [PubMed] [Google Scholar]
- 19. Sha D., Jin Z., Budczies J., Kluck K., Stenzinger A., and Sinicrope F. A., “Tumor Mutational Burden as a Predictive Biomarker in Solid Tumors,” Cancer Discovery 10, no. 12 (2020): 1808–1825. [DOI] [PMC free article] [PubMed] [Google Scholar]
- 20. Lahiri A., Maji A., Potdar P. D., et al., “Lung Cancer Immunotherapy: Progress, Pitfalls, and Promises,” Molecular Cancer 22, no. 1 (2023): 40. [DOI] [PMC free article] [PubMed] [Google Scholar]
- 21. Haddad A. F., Young J. S., Oh J. Y., Okada H., and Aghi M. K., “The Immunology of Low‐Grade Gliomas,” Neurosurgical Focus 52, no. 2 (2022): E2. [DOI] [PMC free article] [PubMed] [Google Scholar]
- 22. Rini B. I., Plimack E. R., Stus V., et al., “Pembrolizumab Plus Axitinib Versus Sunitinib for Advanced Renal‐Cell Carcinoma,” New England Journal of Medicine 380, no. 12 (2019): 1116–1127. [DOI] [PubMed] [Google Scholar]
- 23. Tomikawa C., “7‐Methylguanosine Modifications in Transfer RNA (tRNA),” International Journal of Molecular Sciences 19, no. 12 (2018): 4080. [DOI] [PMC free article] [PubMed] [Google Scholar]
- 24. Li Z., Li Y., Shen L., Shen L., and Li N., “Molecular Characterization, Clinical Relevance and Immune Feature of m7G Regulator Genes Across 33 Cancer Types,” Frontiers in Genetics 13 (2022): 981567. [DOI] [PMC free article] [PubMed] [Google Scholar]
- 25. Kataoka N., “The Nuclear Cap‐Binding Complex, a Multitasking Binding Partner of RNA Polymerase II Transcripts,” Journal of Biochemistry 175, no. 1 (2023): 9–15. [DOI] [PMC free article] [PubMed] [Google Scholar]
- 26. Sanchez D. J. and Simon M. C., “Genetic and Metabolic Hallmarks of Clear Cell Renal Cell Carcinoma,” Biochimica et Biophysica Acta: Reviews on Cancer 1870, no. 1 (2018): 23–31. [DOI] [PMC free article] [PubMed] [Google Scholar]
- 27. Galon J. and Bruni D., “Approaches to Treat Immune hot, Altered and Cold Tumours With Combination Immunotherapies,” Nature Reviews Drug Discovery 18, no. 3 (2019): 197–218. [DOI] [PubMed] [Google Scholar]
- 28. Liu J., Geng X., Hou J., and Wu G., “New Insights Into M1/M2 Macrophages: Key Modulators in Cancer Progression,” Cancer Cell International 21, no. 1 (2021): 389. [DOI] [PMC free article] [PubMed] [Google Scholar]
- 29. El‐Sayes N., Vito A., and Mossman K., “Tumor Heterogeneity: A Great Barrier in the Age of Cancer Immunotherapy,” Cancers 13, no. 4 (2021): 806. [DOI] [PMC free article] [PubMed] [Google Scholar]
- 30. Jiang P., Sinha S., Aldape K., Hannenhalli S., Sahinalp C., and Ruppin E., “Big Data in Basic and Translational Cancer Research,” Nature Reviews Cancer 22, no. 11 (2022): 625–639. [DOI] [PMC free article] [PubMed] [Google Scholar]
Associated Data
This section collects any data citations, data availability statements, or supplementary materials included in this article.
Supplementary Materials
Figure S1. Frequency of genetic alteration of individual m7G writer genes in human cancers. The bars represent the frequency of deep deletion (blue) and amplification (red) of m7G writer genes in each of the 33 cancer types.
Figure S2. Gene expression level of the individual m7G writer gene in human cancers. The red and blue boxes represent tumour and normal samples, respectively. The Wilcoxon test was used to compare the two groups. Significance is denoted by *p < 0.5; **p < 0.01; ***p < 0.001; ****p < 0.0001.
Figure S3. Gene expression level of the individual m7G writer gene in human cancers based on the sites of occurrence. The red and blue boxes represent tumour and normal samples, respectively. The Wilcoxon test was used to compare the two groups. Significance is denoted by *p < 0.05; **p < 0.01; ***p < 0.001; ****p < 0.0001.
Figure S4. Overall survival for patients with different types of cancer‐based on the expression of m7G writers. The forest map shows the overall survival risk ratio of six m7G writer genes in 33 TCGA cancer types. Significance is denoted by p < 0.05 by the log‐rank test.
Figure S5. Kaplan–Meier survival curves of KIRC patients based on the expression of m7G writers. Red and blue represent higher (>median) and lower (<median) levels of gene expression respectively. Significance is denoted by p < 0.05 log‐rank test.
Figure S6. Multivariate analysis of m7G score and main clinicopathological features in KIRC and Kaplan–Meier survival curves stratified by main clinicopathological features in KIRC. Significance is denoted by p < 0.05 log‐rank test.
Figure S7. Multivariate analysis of m7G score and main clinicopathological features in LGG and Kaplan–Meier survival curves stratified by main clinicopathological features in LGG. Significance is denoted by p < 0.05 log‐rank test.
Figure S8. Multivariate analysis of m7G score and main clinicopathological features in LUAD and Kaplan–Meier survival curves stratified by main clinicopathological features in LUAD. Significance is denoted by p < 0.05 log‐rank test.
Figure S9. Heatmap demonstrates the normalised enrichment scores of 46 immune cell infiltrates in KIRC, LGG and LUAD patients using the single‐sample Gene set Enrichment analysis (ssGESA) scores. Rows represent tumour infiltrating immune cells and columns represent samples, red and blue indicate the m7G‐high and ‐low groups, respectively.
Table S1. Frequency of mutations of m7G regulatory genes in 33 types of cancers.
Table S2. Frequency of copy number alteration of m7G writer genes in human cancer.
Table S3. The correlation between the expression of m7G writer genes and cancer‐related hallmark pathways.
Data Availability Statement
These data were derived from the following resources available in the public domain: the TCGA Research Network (https://cancergenome.nih.gov/).