Abstract
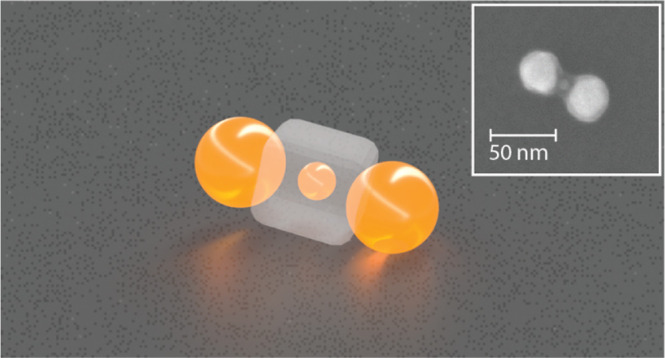
The fabrication of complex assemblies with interesting collective properties from plasmonic nanoparticles (NPs) is often challenging. While DNA-directed self-assembly has emerged as one of the most promising approaches to forming such complex assemblies, the resulting structures tend to have large variability in gap sizes and shapes, as the DNA strands used to organize these particles are flexible, and the polydispersity of the NPs leads to variability in these critical structural features. Here, we use a new strategy termed docking to DNA origami cages (D-DOC) to organize spherical NPs into a linear heterotrimer with a precisely defined geometrical arrangement. Instead of binding NPs to the exterior of the DNA templates, D-DOC binds the NPs to either the interior or the opening of a 3D cage, which significantly reduces the variability of critical structural features by incorporating multiple diametrically arranged capture strands to tether NPs. Additionally, such a spatial arrangement of the capture strand can work synergistically with shape complementarity to achieve tighter confinement. To assemble NPs via D-DOC, we developed a multistep assembly process that first encapsulates an NP inside a cage and then binds two other NPs to the openings. Microscopic characterization shows low variability in the bond angles and gap sizes. Both UV–vis absorption and surface-enhanced Raman scattering (SERS) measurements showed strong plasmonic coupling that aligned with predictions by electrodynamic simulations, further confirming the precision of the assembly. These results suggest D-DOC could open new opportunities in biomolecular sensing, SERS and fluorescence spectroscopies, and energy harvesting through the self-assembly of NPs into more complex 3D assemblies.
Introduction
Within assemblies of plasmonic metal nanoparticles (NPs), the surface plasmons of these NPs can interact and hybridize, forming collective modes in a fashion that is analogous to how electronic wave functions in atoms create molecular orbitals.1,2 These molecule-like collective modes give rise to numerous properties unavailable in individual particles,3 such as strong local field enhancement,4 Fano resonances,5 magnetic resonances,6,7 and chiral optical properties.8,9 Consequently, these assemblies hold significant potential for applications in biomolecular sensing,10,11 surface-enhanced Raman scattering (SERS) and fluorescence spectroscopy,12,13 and energy harvesting.14,15
Strong plasmonic coupling, crucial for these collective properties, depends heavily on geometric features like gap sizes and “bond angles”. However, precisely defining these parameters, especially in more complex assemblies comprising NPs of different sizes, remains a formidable challenge. In particular, Li et al.16 predicted that a linear chain of spherical NPs with progressively decreasing diameters and interparticle gaps can serve as plasmonic lenses that focus EM fields within the gap(s) near the smallest particle(s), producing substantially higher local fields than dimers. To achieve high SERS enhancement factors (EFs), the gap of a dimer typically needs to be a nanometer or less,17 which is too small to fit many biomarkers; these heteromultimeric structures have the potential to achieve high EFs within relatively large gaps (>3 nm), which are more readily realized and facilitate the reproducible binding of biomarkers for detection.18 However, with current lithographic techniques and bottom-up approaches,19,20 it remains difficult to define gaps and bond angles with the level of precision needed to achieve the theoretically predicted plasmonic properties.
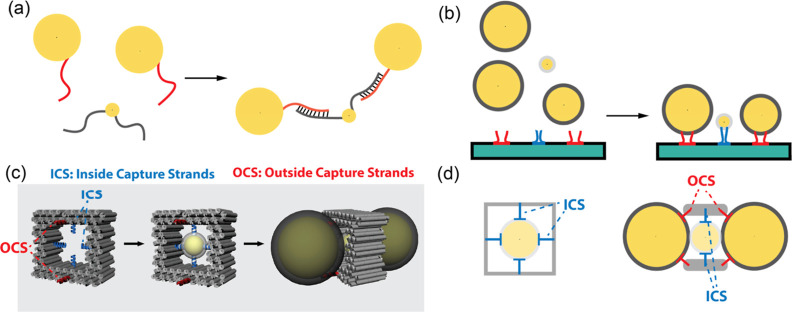
On the other hand, DNA-directed self-assembly, employing specific and programmable base-pairing interactions, has formed discrete NP assemblies with greater structural complexity.21−25 The direct linkage strategy first isolates NPs with a discrete number of DNA ligands and then links these NPs through hybridization (Figure 1a). Although the strategy has been widely used to form various molecule-like assemblies,26−29 it is difficult to achieve strong plasmonic coupling due to the intrinsic flexibility of the linkers, leading to large variability in bond angles and gap sizes.30−32 Additionally, this approach is, in general, incompatible with larger NPs (>20 nm) that possess distinct plasmonic properties33 as the mobility of a larger NP does not change significantly when DNA ligands are attached, making it difficult to obtain NPs with a discrete number of DNA ligands via purification methods such as gel electrophoresis and HPLC.34
Figure 1.
Illustration of DNA-directed assembly strategies. (a) Direct linkage: where DNA linkers’ flexibility introduces variability in overall shape and gap size differences. (b) Traditional template-driven self-assembly, where polydispersity in NP sizes leads to gap size variability. (c) D-DOC: a central gold NP (AuNP) is enclosed within a 3D DNA origami cage via base pairing with thiolated DNA ligands and ICS (blue helices). Terminal AuNPs are captured by OCS (red helices) at the cage’s openings, forming a linear heterotrimer. (d) Cross-sectional views show diametrically arranged multiple capture strands confining each NP stabilized by shape complementarity with the cage. Gap size is controlled by the thickness of the ligand shells, minimizing the effect of NP polydispersity.
Another strategy in DNA-directed NP self-assembly is site-specific binding of the DNA functionalized NPs to closely spaced capture strands displayed on a self-assembled template (such as DNA origami, Figure 1b).21−25 Although such template-directed self-assembly has been successful in forming many 2D assemblies of similar-sized NPs, the precise assembly of more complex assemblies comprising NPs of dissimilar sizes remains challenging.35 The precise arrangement of such NPs requires the precise adjustment of lateral positions and heights of binding sites depending on the sizes, a task not easily achieved using common 2D templates. Furthermore, polydispersity in NP sizes leads to variation in the gap sizes and bond angles that cannot be compensated by merely adjusting the positions of binding sites (Figure S1).
In this work, we demonstrate a new method, termed docking to DNA origami cage (D-DOC), to organize spherical NPs of dissimilar sizes into a heterotrimer with a precise linear arrangement. Unlike traditional template-driven self-assembly, where NPs are bound to capture strands on the exterior of the DNA template, D-DOC binds the NPs to multiple capture strands inside a 3D cage or at its openings (Figure 1c,d). This approach allows diametrically arranged capture strands and shape complementarity to work synergistically to arrange these NPs such that the gaps and angles are no longer significantly impacted by the polydispersity of the constituent NPs. Moreover, the synergetic use of these interactions may greatly improve the confinement of NPs and reduce the variability caused by the flexibility of DNA linkers.26−28,36 We developed a multistep assembly process that involves first encapsulating a central NP within the cage and then binding two NPs to the openings, forming a linear heterotrimer. Purification steps were optimized to improve the overall yield. Microscopy characterization shows a low variability in bond angles and gap sizes. Both UV–vis absorption and SERS measurements demonstrated strong plasmonic coupling consistent with electrodynamic simulations, further confirming precise control over critical geometrical features.
Materials and Methods
Materials
M13mp18 ssDNA (scaffold) was purchased from New England Biolabs (NEB), resuspended in ultrapure water, and used without further purification. All staple DNA strands were purchased from Integrated DNA Technologies (IDT), diluted with 1× Tris–EDTA (TE) buffer without further purification. Regular 3′ and 5′ thiol-modified and carboxytetramethylrhodamine (TAMRA)-labeled 3′ thiol-modified DNAs were purchased from IDT, resuspended in ultrapure water without further purification. DNA loading dye was purchased from Fischer Scientific. SYBR green (I) DNA stain and TAMRA mixed isomers were purchased from Thermo Fisher. Agarose and Tris–borate–EDTA (TBE), EDTA (ethylenediaminetetraacetic acid), and TE buffers, Tris, sodium dodecyl sulfate (SDS), sodium chloride (NaCl), magnesium chloride (MgCl2), tri(carboxyethyl)phosphine hydrochloride (TCEP), polyethylene glycol, and dithiothreitol (DTT) were purchased from MilliporeSigma, USA. Colloidal solutions of unfunctionalized (bare) 10, 30, and 50 nm AuNPs were purchased from Ted Pella. All staple DNAs and thiolated DNA sequences are summarized in Tables S1–S4.
Functionalization of AuNPs with Thiolated DNA
The protective disulfide bond of thiolated DNAs was cleaved to form monothiol using TCEP (stock concentration of 100 mM) at room temperature (RT) in water, and the molar ratio of thiolated DNA to TCEP was 1:1000. The reduced thiolated DNAs were purified using Amicon ultra centrifugal filters (MilliporeSigma) with a molecular weight cutoff (MWCO) value of 3 kDa at 14,000g for 20 min twice to remove the small molecules. The purified monothiolated DNAs were added to bare AuNPs with a DNA to AuNP molar ratio of 660:1 for 10 nm AuNPs, and 9090:1 for 30 nm AuNPs, in ultrapure water containing 0.1% (w/v) SDS and then incubated with gentle shaking on a vortex mixer overnight at RT. To functionalize 50 nm AuNPs, there are two other requirements: (1) the total volume for each batch needs to be ≤ 0.2 mL and (2) the final DNA concentration needs to be > 3.0 μM. After overnight incubation, a slow salt-aging method was used to promote the attachment of thiolated DNA to AuNP surfaces. A concentrated NaCl stock solution (5.0 M) was added to AuNP and thiolated DNA mixture to increase the [NaCl] by 0.050 M. The mixture was then backfilled with N2, sonicated for 5 s, and incubated at least 1 h with gentle shaking at RT. Such salt-additions were repeated until reaching a final NaCl concentration of 0.30 M for 10 nm AuNP and 30 nm AuNP, 0.50 M for 50 nm AuNP and then the mixture was left at RT to incubate overnight with gentle shaking. The 10 nm functionalized AuNPs (fAuNPs) were washed with ultrapure water in 100 kDa Amicon filters eight times to remove excess thiolated DNAs. The 30 and 50 nm fAuNPs were purified by centrifugation at 14,000g for 3 min in a 2.0 mL Eppendorf Microcentrifuge tube three times. After each centrifugation, the supernatant was removed and then resuspended in ultrapure water. Purified fAuNPs were backfilled with N2 and stored in a refrigerator at 4 °C before use. The concentrations of fAuNPs were determined from the optical absorbances at 520 nm (10 nm AuNP), 528 nm (30 nm AuNP), and 530 nm (50 nm AuNP) assuming no change in molar extinction coefficients after DNA functionalization. For the SERS detection, a mixture of TAMRA-labeled monothiolated DNA and 5× regular monothiolated DNA was used, and the molar ratio of total thiolated DNA to 10 nm AuNP was 660:1, all other steps remained unchanged. All fAuNPs were stable in the heterotrimer assembly buffer (TAB) containing 1.0 mM EDTA, 5.0 mM Tris, 12.0 mM MgCl2, and 0.30 M NaCl at RT or subjected to prolonged thermal annealing, which is ideal for the directed assembly by DNA origami.
Self-Assembly of Heterotrimers Using D-DOC
Our 3D origami cage with a cuboid cavity (20 nm × 20 nm × 17 nm) was designed with honeycomb lattice using caDNAno (http://cadnano.com/). The software generated 196 staple strand sequences that are complementary to that of single-stranded M13mp18 scaffold DNA. The cage has 124 DNA helices and an overall dimension of 37 × 34 × 17 nm (Figure S2) estimated by using 0.34 nm per base pair and 2.2 nm DNA helix width. To avoid blunt-end stacking between the cages, either two bases are left unpaired, or two extra thymine (T) are added at the ends of each helix.
To bind the small NP in the cavity, four inside capture strands (ICS) all have 5′ end extensions protruding from the centers of helices 31,41,96,73, respectively (Figure S3). There are two outside capture strand (OCS) designs: the first design is for 30–10–30 and 50–10–50 nm trimers, where the four capture strands are extended from helices #39, 105, 38, and 106, respectively, and all extensions are on the 3′ end (Figure S3); the second design is for the 30–10–50 nm heterotrimer, where the four OCS protrude from two ends of helix 38 and helix 106, respectively, and each of two openings has two capture strands (Figure S3) from 3′ and 5′ ends, respectively.
The molar ratio of the scaffold to capture strands was 1:1, while 10× other staples with respect to scaffold were used. The mixture of the scaffold (10 nM) and staples was placed in a folding buffer (1 mM EDTA, 5 mM Tris, 12 mM MgCl2) and slowly cooled from 90 to 25 °C over 2 days in a thermal cycler. The cooling rate at effective folding temperatures 60 to 40 °C was reduced to −0.2 °C/h. The concentration of unpurified origami was estimated by assuming a 100% folding yield. The purified or unpurified origami cages were mixed with purified 10 nm fAuNPs in TAB with 0.05% SDS, backfilled with N2. The mixture was first slowly heated from 20 to 42 °C and then annealed from 42 to 20 °C over 34 h in total to encapsulate 10 nm fAuNP in the origami cage cavity. The cage-encapsulated 10 nm fAuNPs were used without purification. Then, the purified 30 nm/50 nm fAuNP and cage-encapsulated 10 nm fAuNPs were mixed in the TAB with 0.05% SDS, backfilled with N2, and incubated at RT in the dark for ∼4 h to form the target trimers, the synthesized heterotrimers were stored at 4 °C prior to purification.
Purification of Heterotrimers
After overnight incubation at RT, the mixture of cage-encapsulated 10 nm fAuNPs and 30 nm/50 nm fAuNPs was loaded with the help of a DNA loading dye in an agarose double gel layer system (running buffer: 0.5× TBE) at constant 65 V for 1 h over ice. The bottom gel layer was a 4% agarose gel to prevent leakage of the sample from the top layer, and a 0.8 or 1% top layer was poured directly on the bottom layer. After band separation appeared, the unwanted band was cut out, and a small pocket in front of the band of interest was dug through the top layer and filled with TAB. Then, the band of interest was electroeluted to the pocket and collected by a micropipette. If needed, the purified heterotrimers could be concentrated by centrifugation (14,000g, 5 min) in a 2 mL microcentrifuge tube (Eppendorf).
DLS Measurements
All dynamic light scattering (DLS) experiments were performed using a ZETASIZER NANO series S90 (Malvern Panalytical) to measure Dh. Samples were loaded in a micro volume quartz cuvette (50 μL) and measured using 632.8 nm laser with 90° scattering angle at 20 °C. The Multiple Narrow Mode (MNM) algorithm was used for data analyses.
UV–Vis Measurements
Concentrations of DNA origami, thiolated DNA, and bare unfunctionalized AuNP were determined using the NanoDrop ND-1000 Spectrophotometer (Thermo Fisher Scientific). All UV–vis spectra of heterotrimer and fAuNPs were collected by using a PerkinElmer LAMBDA 35 UV–vis spectrophotometer and a 100 μL quartz cuvette.
Determination of TAMRA Concentration on Heterotrimers
TAMRA solutions of known concentrations were measured using a HORIBA Jobin Yvon Fluorolog-3 fluorometer to construct a standard calibration curve of TAMRA (Figure S4). The solution containing heterotrimers was mixed with 0.5 M DTT (final DTT concentration of 0.1 M) overnight at RT to break the Au–S bond and desorb TAMRA labeled thiol-DNA from the heterotrimers. After overnight incubation, the sample was centrifuged to precipitate the AuNPs, and the supernatant was collected for fluorescence measurements to determine the TAMRA concentration with the help of a standard calibration curve.
SEM Characterization of Heterotrimers
3.0 μL of the purified heterotrimer was deposited onto Argon (Ar) plasma-treated silicon wafers for ∼2 min and then washed with 20 μL of water and dried in a vacuum chamber for 24 h before scanning electron microscopy (SEM) characterizations. The sample was imaged by Zeiss Gemini 500 FEG-SEM system with EHT 5.0 to 10 kV. The statistical analysis of gap sizes and bond angles was conducted using AutoCAD 2019 (Figure S5).
SERS Measurements
All the Raman and SERS spectra were measured using a Renishaw inVia Raman spectrometer with both 633 and 785 nm excitation wavelengths. The laser was focused onto the sample using a 20× objective for all samples. The average power at the sample surface was 2.8 mW, and the samples were collected at 633 nm. For the samples collected at 785 nm, the power used for TAMRA was 55 mW and the power for the heterotrimer sample was 11 mW. The integration time was 30 s for the pure TAMRA measurements at both laser wavelengths. For SERS measurement of heterotrimeric chain with TAMRA tagged in the central particle, integration times were 30 s at 633 nm laser and 10 s at 785 nm laser. Each sample was prepared for Raman and SERS measurements by drying 10 μL of the solution on a stainless-steel substrate for 10 min.
Finite Difference-Time Domain Simulations
All electrodynamics simulations were performed by using Lumerical FDTD Solutions software (Ansys, Inc.). The mesh size was set to 0.5 nm for all electric field simulation and 1 nm for absorption simulation. Trimeric structures (including DNA origami and ligand shell) were modeled in AutoCAD 2019 as a .stl file and exported to FDTD Solutions. The frequency-dependent optical constants of gold NPs were adapted from those of Johnson and Christy. The DNA ligands were depicted as a 2.5 nm thick shell (wireframe) with a refractive index of 1.7. The DNA hollow origami cage (wireframe) had a refractive index of 2.2. The background refractive index was set as 1.3 for the electric field simulation and 1.333 for the absorption simulation.
Results and Discussion
Design of the 3D Cage Template
The use of multiple capture strands to encapsulate a DNA functionalized gold NP (fAuNP) to a cage cavity was demonstrated by Yan et al.37 and used to grow shape-controlled nanostructures inside a 3D mold.38 Here, the NP encapsulation is used as a starting point to organize NPs of dissimilar sizes into more complex assemblies. Our DNA origami cage, designed with a cuboid cavity, features four ssDNA strands (inside capture strands) extending from the side walls (Figure 1c,d). These strands can capture the 10 nm AuNP by hybridizing with the complementary ssDNA ligands on the AuNP. In addition, we incorporated OCS at the two cage openings to capture and align larger fAuNPs. The cavity’s dimensions (∼20 nm × 20 nm × 17 nm) were specifically tailored to accommodate the small fAuNP in the middle as well as align two larger fAuNPs in a collinear fashion via shape complementarity.
Self-Assembly and Purification of Heterotrimers
While D-DOC offers enhanced control over critical geometrical features within NP assemblies, the multistep self-assembly process—folding of the DNA origami cage, encapsulation of the central small gold NP within the cage, and the binding of the terminal large NPs to the two openings—poses challenges as the overall yield tends to decline with additional steps. Moreover, each of the steps often necessitates a separate purification, further reducing the overall yield. Therefore, we characterized and optimized the individual assembly steps and sought strategies to circumvent the purification requirements.
Typically, folding DNA origami requires a stoichiometric excess of oligonucleotides (staple strands).39 To reduce the inference from excess capture strands during NP encapsulation while ensuring the integrity of the folded cage, we reduced the concentration of the capture strands to 1–2× of the concentration of the scaffold (10 nM) while maintaining other staples at a 10× concentration. Agarose gel electrophoresis confirmed proper formation of the cage structure under these conditions (Figure S6). The folded cages were then mixed with 10 nm fAuNPs and annealed from 40 °C to RT over 17 h. Gel electrophoresis of the annealed mixture of 6.5 nM cages and 26 nM (4×) 10 nm fAuNPs displayed two pink bands: a fast-moving band corresponds to unbound fAuNPs and a slow-moving band, which also displayed fluorescence from the DNA origami cage, corresponding to fAuNPs bound inside a cage (Figure 2). 10 nm fAuNPs do not display a visible band in gel electrophoresis unless the concentration exceeds 4 nM. As it is difficult to achieve a high concentration of purified cages, this complicates the characterization of the encapsulation process when the concentration of fAuNPs is reduced to achieve a 1:1 molar ratio. To address this challenge, we employed DLS, which can detect fAuNPs at lower concentrations, as a complementary technique. DLS of fAuNPs and cages mixed at RT with a molar ratio of 1:1 detected three species with distinct hydrodynamic sizes: fAuNPs (22 nm, blue curve, Figure 2b), free cages (57 nm, red curve, Figure 2b), and cages with an encapsulated fAuNP (solid black, Figure 2b). After annealing from 42 to 20 °C, the peaks associated with fAuNPs and free cages disappeared, leaving a single, narrow peak at 44 nm (dotted black, Figure 2b). Diluting the solution by 4× with water caused the emergence of separate peaks that are consistent with the fAuNPs and free cages, suggesting that a reduced ionic strength prevents the capture strands from stabilizing the AuNPs (Figure S7). This control provides additional evidence that the narrow peak at 44 nm corresponds to cages with an encapsulated fAuNP. A plausible explanation for the decrease in the hydrodynamic size after AuNP encapsulation is the confinement by the four ICS. The free cage undergoes thermal fluctuations that may increase its hydrodynamic size. Once the 10 nm AuNP is encapsulated, the four ICS bound to the AuNP may pull the four sides of the cage closer to the AuNP, reducing the fluctuations.
Figure 2.
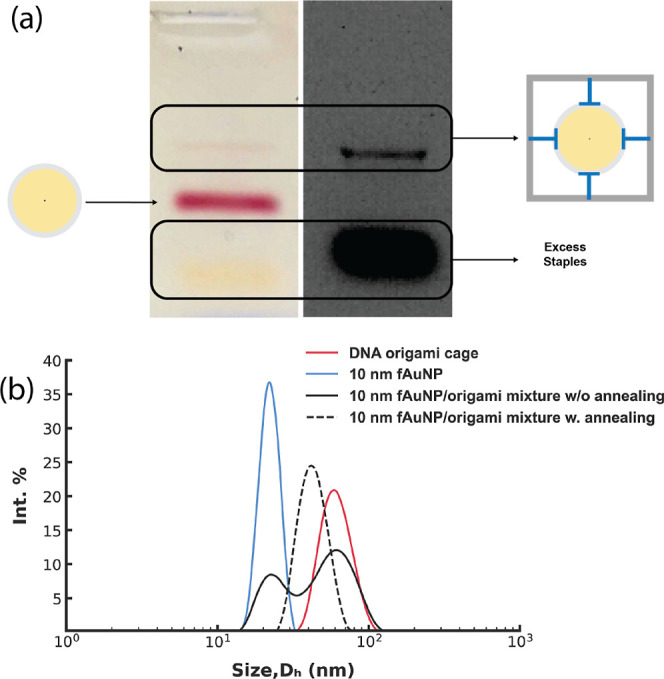
(a) Agarose gel results of the encapsulation step. Thermally annealed unpurified cages and 4 × 10 nm fAuNPs at a molar ratio of 1:4 showed two well-separated pink bands (left) that correspond to bound and unbound fAuNPs and a broad yellow band at bottom (left). The faint pink band on top lined up with the fluorescence signal of the cage (right). (b) DLS analysis of encapsulation of 10 nm fAuNP in DNA origami cage at a molar ratio of 1:1. The hydrodynamic size distribution of the mixture without annealing (at RT) displays two peaks matching the hydrodynamic diameter (Dh) of the 10 nm fAuNP and DNA origami cage, respectively. The annealed mixture displays a single peak at ∼44 nm.
Overall, these results demonstrate that a 1:1 molar ratio and annealing lead to encapsulation of fAuNPs with low amounts of free fAuNPs or cages, facilitating the progression to the heterotrimer assembly step without needing to purify encapsulated products.
To form the heterotrimer, the cage-encapsulated 10 nm fAuNPs were mixed with 30 nm fAuNPs and incubated at RT for ∼4 h. The resulting gel, as shown in Figure 3a, reveals a fast-moving band corresponding to unbound 30 nm fAuNPs and a slower pink band that exhibits a fluorescence signal, indicating the presence of the DNA cage. In lane 1, the mobility of the free 30 nm fAuNPs is slightly reduced compared to that for neat 30 nm fAuNP in lane 2, likely due to excess OCS in the mixture hybridizing with ligands on the AuNPs (Figure S8). The slow-moving band indicates the formation of the designed heterotrimer, in which two 30 nm fAuNPs are bound to a cage containing an encapsulated 10 nm fAuNP.
Figure 3.
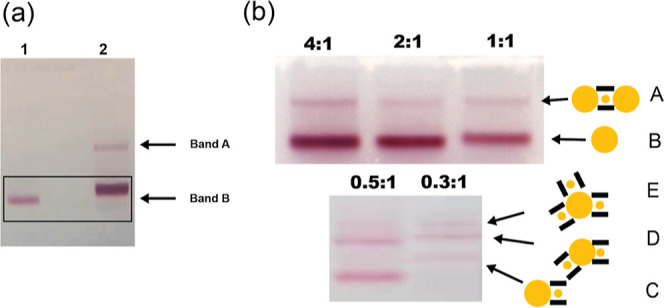
Gel electrophoresis of a 30–10–30 nm trimer assembly. (a) Agarose gel results of assembly. Lane 1: neat 30 nm fAuNPs. Lane 2: mixture of 30 nm fAuNPs and cage-encapsulated 10 nm fAuNPs after incubation at RT. (b) Effect of the stoichiometric ratio on the heterotrimer assembly. The concentration of the encapsulated 10 nm fAuNP was 6.5 nM and the stoichiometric ratio between 30 nm fAuNPs and the cage-encapsulated 10 nm fAuNPs varied between 4:1 and 0.3:1. The total amount of 30 nm fAuNPs is held constant in each lane. The likely structures associated with the gel bands are included alongside the gel images.
To delve deeper into the assembly process, we varied the nominal molar ratio of the 30 nm fAuNPs to the cage-encapsulated 10 nm fAuNPs from 0.3:1 to 4:1 with the concentration of encapsulated 10 nm fAuNPs held constant at ∼6.5 nM. Gel bands from mixtures at higher molar ratios, 4:1, 2:1, and 1:1 displayed similar patterns, with the lower moving band intensifying as more 30 nm fAuNPs were added (Figure 3b). This trend aligns with the thermodynamic and kinetic predispositions favoring heterotrimer formation at elevated molar ratios. In contrast, the mixture with a molar ratio of 0.3:1 exhibited a substantially different band pattern (Figure 3b): the band associated with free 30 nm AuNPs vanished, and a variety of new bands emerged, suggesting the formation of different structures (Figure 3b). Plausible structures associated with these new bands are proposed in Figure 3b. Definitive structural identification will require future systematic SEM characterization of samples extracted from these individual gel bands.
To further ascertain the origin of the slow-moving band, we conducted gel electrophoresis of two controls: (1) a mixture of 30 nm fAuNPs with 10 nm fAuNPs and (2) a mixture of 30 nm fAuNPs to 10 nm fAuNPs encapsulated in cages with noncomplementary OCS (Figure S9). Both controls yielded a singular gel band indicative of free 30 nm fAuNPs. The 10 nm fAuNPs did not exhibit a visible band due to their low extinction coefficient. These findings affirm that band A in Figure 3a represents heterotrimer assemblies composed of two 30 nm fAuNPs bound to a cage encapsulating a 10 nm AuNP. It is notable that fAuNPs readily bind to the cage openings even at RT, as thermal annealing of the mixture yielded a similar gel band pattern (Figure S10). In contrast to the encapsulation process, which requires annealing for the AuNP to access the interior of the cage and become captured, the fAuNPs can readily bind to the capture strands at the cage openings without the need for annealing. Together, these results show that the molar ratio controls speciation in the self-assembly process, and a stoichiometric excess of 30 nm AuNPs promotes the formation of the designed trimers.
To purify the product for structural and optical characterizations, the product within band A was isolated by electroelution into a pocket within the gel that was filled with the assembly buffer and subsequently concentrated by centrifugation.40 To determine the yield, the amount of the purified trimers is estimated from the UV−vis spectrum, assuming that the peak extinction coefficient is twice that for 30 nm fAuNPs. By dividing the amount of the purified trimers by the amount of the encapsulated 10 nm fAuNPs added, the yield is estimated to be 20%. While the yield was modest, it is sufficient for detailed microscopy and spectroscopy analyses. Future efforts to gain mechanistic insights and refinement of both the self-assembly and purification processes can improve the yield, making this method suitable for larger-scale studies and applications.
Structural Analysis of Heterotrimers
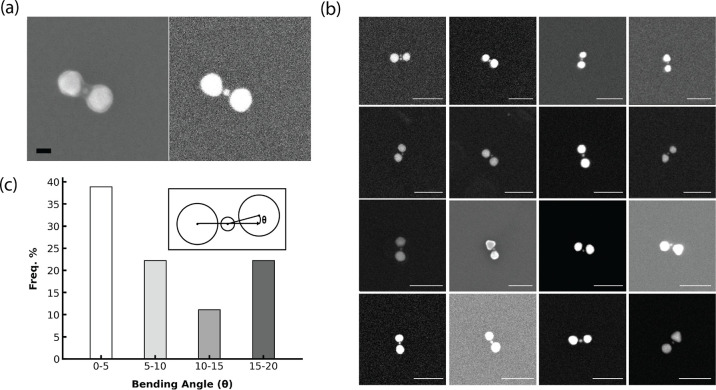
SEM images of a representative structure revealed two large AuNPs (∼30 nm) flanking a smaller central AuNP (9 nm) (Figure 4a). The surface-sensitive secondary electron imaging revealed a shell around the heterotrimer structure, while the backscattered electron imaging provided enhanced contrast of the central AuNP, owing to its greater sensitivity to heavy elements. Additional images are shown in Figure S11. An analysis of over 20 heterotrimers found an average 2D projected bending angle (θ, as defined in the inset of Figure 4c) of 9.7 ± 6.9° (Table 1). It is important to note that the actual bending angles, θ3D, may differ from the observed 2D projections (θ). According to (1), θ is identical to θ3D only when φ, the dihedral angle between the plane of the three particles and the plane of the solid support is zero, i.e., the two planes are parallel.
| 1 |
Figure 4.
(a) SEM images of 30–10–30 nm trimers. Left: SE (secondary electron) detector. Right: BSE (backscattered electron) detector. Scale bar: 20 nm. (b) Additional heterotrimer images using the BSE mode. All scale bars: 100 nm. (c) Bending angle analysis. Inset: schematic of the bending angle θ.
Table 1. Size Measurements of the 30–10–30 nm Heterotrimer.
| mean value | standard deviation | |
|---|---|---|
| diameter of terminal AuNP | 29.4 nm | 2.8 nm |
| diameter of central AuNP | 7.9 nm | 0.9 nm |
| gap size | 3.7 nm | 1.5 nm |
| bending angle | 9.7° | 6.9° |
Because the plane of the particles is largely perpendicular to the solid support, i.e., φ = 90°, θ may register as zero if the AuNP centers are positioned at different heights above the template.21,35 This complication makes it challenging to confirm the linearity of the NP chains assembled on a 2D DNA origami template.
However, the small bending angles observed for our 3D template suggest genuine linearity, as the structures likely land on the solid support with a random φ value, and the nonlinearity is not obscured by a fixed adsorption orientation of the template. Indeed, numerical simulation based on (1), assuming random φ and two populations of θ3D, one centered at 6° and the other at 18°, reproduced the observed θ distribution (Figure S12). Finite-difference time-domain (FDTD) simulations show that such small bending angles only modestly reduce field enhancement (Figures S13–S17).
In addition to the angles, the gap size is another key parameter that determines plasmonic coupling within NP multimers. Therefore, we analyzed the variability of the gap size and how the gap depends on the size of the AuNPs. Our DLS results (Figure S19) and previous simulations22 suggested the DNA ligand shells of fAuNPs were ∼2.5 nm thick. Consequently, we expected ligand shell-to-ligand shell contact to result in a ∼5 nm interparticle gap size. The measured interparticle gap was 3.7 ± 1.5 nm, which is statistically smaller than the expected value according to the one-sample Student t-test (p < 0.0001). The difference suggests that the ligand shells may partially interdigitate. Correlation analyses were also performed to investigate how bending angles and sizes of fAuNPs affect the interparticle gap.41 The spearman’s correlation coefficients (ρ) are −0.273, −0.0159, −0.218, and −0.130 for bending angle, diameter of the terminal AuNP, diameter of the central AuNP, as well as the ratio between terminal AuNP diameter and central AuNP diameter, respectively (Figure 5).
Figure 5.
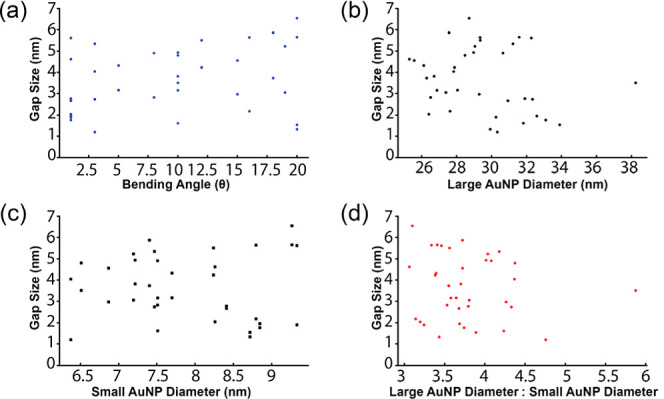
Correlation analyses of 30–10–30 nm heterotrimer gap sizes. (a) Gap size vs bending angle. (b) Gap size vs large AuNP diameter. (c) Gap size vs small AuNP diameter. (d) Gap size vs the ratio between large AuNP diameter and small AuNP diameter. All values were extracted from heterotrimer SEM images.
The small absolute ρ values here suggested the gap size was either weakly correlated (0.2 < |ρ| < 0.3) or uncorrelated (0.01 < |ρ| < 0.2) to the bending angle or the diameter of fAuNPs. The gap dimension suggests that the thicknesses of ligand shells control the interparticle gap distance. It should be noted that the actual variability in the gap size may be smaller than the measured one due to the limited resolution of the SEM (∼1 nm) and deformation by surface deposition in our measurement. Future cryo-electron tomography studies42 are expected to provide more accurate measurements of gap sizes and bending angles, which can help further improve the precision of NP assembly. The limitations of SEM measurement notwithstanding, these findings confirm the successful production of heterotrimeric structures with designed bond angles and gap sizes via D-DOC.
Spectroscopic Characterization of 30–10–30 nm Heterotrimers
The UV–vis absorption spectrum of the purified heterotrimers in a buffer solution features a peak at ∼540 nm and a shoulder at ∼604 nm. FDTD simulations of the heterotrimer structures showed that the 540 nm peak originates from the transverse mode and the shoulder peak originates from a longitudinal mode due to strong interparticle dipolar coupling (Figure 6a). As the trimers assume random orientations in solution, with only a small fraction of them oriented for selective excitation of the longitudinal mode, the experimental spectrum exhibited a weaker longitudinal LSPR peak in comparison to that in the simulated spectrum with selective excitation of the longitudinal mode (Figure 6a). Nevertheless, the distinct shoulder peak, which is significantly shifted from the SPR wavelength of isolated AuNP (∼530 nm), underscores strong plasmonic coupling2,43 within these heterotrimer structures. This contrasts with previous studies that assembled similar plasmonic nanolenses using DNA directed self-assembly and other related techniques20,21,35 as those studies only observed modest SPR red shifts, on the order of a few nanometers, due to large variability in gap sizes and bending angles. Hence these spectroscopy and simulation results corroborate microscopy results, indicating that D-DOC has successfully formed heterotrimers with the designed geometry.
Figure 6.
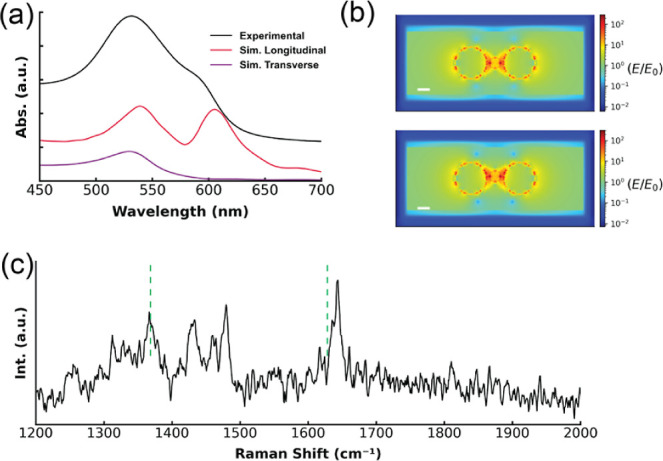
Plasmonic properties of the 30–10–30 nm heterotrimer. (a) UV–vis absorbance spectra of experimental and simulated heterotrimer. (b) FDTD simulations showing the distributions of the local electric field enhancement (E/E0) of trimers at 633 nm. Top: Trimer with a bending angle θ = 0°, average SERS EF about 2 nm away from the central particle is 5.9 × 10⁵. Bottom: Trimer with bending angle θ = 10°, average SERS EF about 2 nm away from central particle is 8.5 × 10⁵. Scale bars: 10 nm. (c) SERS spectrum of TAMRA on a heterotrimer using 633 nm excitation.
To determine SERS EF of the heterotrimers, the 10 nm AuNP was functionalized with DNA ligands that are tagged with a Raman reporter carboxy tetramethyl rhodamine.44 The TAMRA label is attached to the seventh nucleotide within the thiolated DNA ligand. As the DNA ligands form a packed ligand shell on the AuNP, TAMRA is approximately 2 nm away from the AuNP, a distance with weak chemical enhancement (Figure S18).45 It is well-established that molecules in the gaps typically experience the most intense field and SERS enhancements.12,46,47 Hence, TAMRA molecules in the gap dominate the SERS spectrum. Figure 4b shows a typical SERS spectrum of heterotrimers deposited on a solid support by using a 633 nm excitation laser. Two characteristic TAMRA peaks, 1642 and 1366 cm–1, can be observed, as highlighted by dashed green lines in Figure 6c (detailed mode assignments are in Table S5). A number of lower intensity peaks were attributed to the Raman modes of DNA,48 which have smaller cross sections than peaks associated with TAMRA. After Raman measurements, the amount of TAMRA on the heterotrimers was determined by fluorimetry.35,49 The EFs were calculated using (2), where ISERS is the SERS intensity of the TAMRA mode, IRaman is the corresponding Raman intensity of unenhanced bare TAMRA, CSERS is the TAMRA concentration on heterotrimers, and CRaman is the concentration of unenhanced TAMRA.
| 2 |
The average heterotrimer SERS EF was 3.5 × 10⁵, in agreement with the EF simulated by FDTD (2.3 × 10⁵) at 633 nm (Figure 6c). While the EF at 633 nm is modest, the FDTD simulation predicts a much higher average EF (up to 1010) (Figure S17) if the laser wavelength is tuned to the LSPR λmax near 613 nm. This contrasts with findings by Kleiman et al., who noted no correlation between the maximum EFs and LSPR spectral position of dimers and multimers consisting of similarly sized AuNPs.50 Hence, these results indicate intriguing avenues for future theoretical and experimental investigations into the plasmonic properties of heteromultimers.
Assembly of other Heterotrimers
In principle, D-DOC can produce a variety of other multimeric structures as DNA nanotechnology allows the size, shape of the cage, and capture strand sequences to be programmed.25,37,39 Therefore, we explored the assembly of 50 nm fAuNPs with cage-encapsulated 10 nm fAuNPs to form 50–10–50 nm trimers. Gel electrophoresis results (Figure 7a) of the mixture revealed a distinct slow-migrating pink band that is aligned with the fluorescence signal of the DNA origami cage, confirming the successful assembly of the 50-10-50 nm heterotrimer. SEM images of the gel purified product from the slow-migrating pink band40 displayed the presence of two large AuNPs with a diameter of 46.3 ± 3.8 nm, flanking a central AuNP with a diameter of 7.7 ± 1.4 nm (Figure 7b). Additional images can be found in Figure S20. These findings demonstrate the ability of the capture strands at the cage openings to bind 50 nm fAuNPs. However, in contrast with the highly linear 30-10-30 nm trimers, many of the 50-10-50 nm trimers have substantially larger bending angles, with an average of 60.7 ± 20.0°. This suggests that van der Waals attractions between the larger NPs, more pronounced due to the increased size, could distort the heterotrimer structures.
Figure 7.
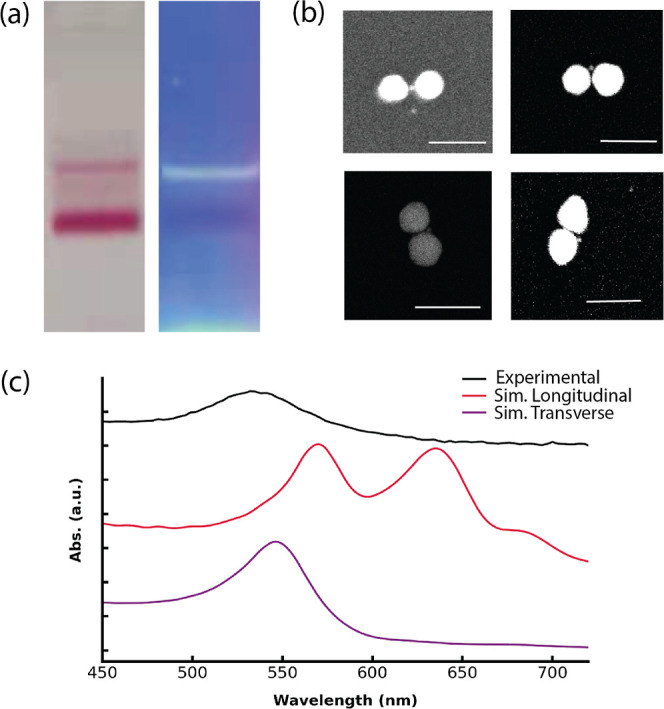
(a) Agarose gel characterization of 50–10–50 nm trimers. Left: Mixture of 50 nm fAuNPs and the cage-encapsulated 10 nm fAuNPs, the fast-migrating band is unreacted 50 nm fAuNP and the slow-moving band the assembled heterotrimer. Right: Same as left but under UV excitation, the fluorescence signal (yellow-green band) of cage on the right lined up with the slow-moving pink band on the left. (b) SEM images of 50-10-50 nm trimers. Backscattering detector was used. Scale bar: 100 nm. (c) Top: UV–vis absorbance spectra of experimental and simulated heterotrimer. (d) Bottom: FDTD simulations showing the distributions of the local electric field enhancement (E/E0) of trimers at 633 nm. Trimer with a bending angle θ = 0°, average SERS EF about 2 nm away from the central particle is ∼109. Scale bars: 10 nm.
The structure distortion was further confirmed by spectroscopy results. The measured SERS EF was only ∼104, over 5 magnitudes lower than the simulated EF (Figure 7d). Although drying and deposition onto a Si substrate for SEM imaging might contribute to this distortion, the UV–vis absorption spectrum of the trimers in buffer solution revealed a lack of strong plasmonic coupling expected from FDTD simulations (Figure 7c), indicating that structural distortion occurs in solution as well. These results are in marked contrast with the observed linearity of the 30-10-30 nm trimers (Figure 4).
Two factors are likely responsible for the differences between the 30–10–30 and 50–10–50 nm trimers. First, the 50 nm NPs have stronger van der Waals attractions, as their volume is notably larger. Second, although the cage can accommodate modest size variations of the terminal AuNPs, the 50 nm AuNPs have a substantially larger radius of curvature that makes them a poor fit for the 20 nm cage opening, making the heterotrimer more susceptible to distortion. With the reduction in shape complementarity coupled with stronger van der Waals attractions, the cage can no longer effectively constrain the AuNPs in a linear geometry. These results underscore the need to optimize DNA origami structures to accommodate NPs of different sizes. Future Cyro-EM studies that can characterize both the DNA cage and the AuNPs with nanometer resolution are expected to shed more light on the structural fits.
Beyond symmetric heterotrimers, our investigation extended to forming asymmetric 30–10–50 nm heterotrimers. By functionalizing 30 nm and 50 nm AuNPs with different DNA ligands, we enabled these dissimilar sizes to selectively bind to capture specific strands at the cage openings. Although the assembly process was not fully optimized as indicated by the gel image (Figure S21), the preliminary SEM images indeed show a 30 nm AuNP and a 50 nm AuNP flanking a 10 nm AuNP (Figure 8). However, these structures exhibited noticeable bending, indicating that incorporating a single 50 nm fAuNP can result in significant distortion (Table 2). Implementing a cage that better complements the larger NPs’ shapes could facilitate their arrangement into the intended geometric configurations.
Figure 8.
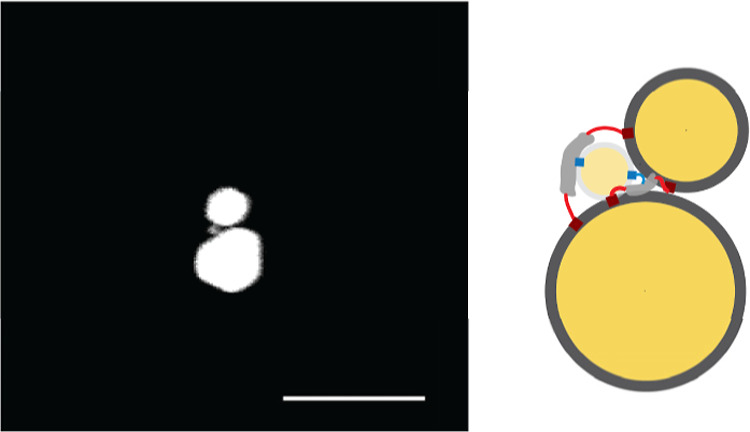
SEM image of a 30–10–50 nm heterotrimer. Backscattering detector was used. Scale bar: 100 nm.
Table 2. Size Measurements of the 50–10–50 nm Heterotrimer.
| mean value | standard deviation | |
|---|---|---|
| diameter of terminal AuNP | 46.3 nm | 3.8 nm |
| diameter of central AuNP | 7.7 nm | 1.4 nm |
| gap size | 3.5 nm | 1.8 nm |
| bending angle | 60.7° | 20.0° |
Conclusions
In summary, the D-DOC strategy introduced here enables precise control of bond angles and gaps in heterotrimers that consist of 10 and 30 nm AuNPs. Furthermore, the heterotrimers displayed plasmonic properties matching predictions from FDTD simulations. While our initial demonstrations focused on spherical gold NPs, our approach is adaptable to NPs of various morphologies and chemical compositions, such as hollow gold spheres,51 silver NPs,52 quantum dots,53 and magnetic NPs,54 provided that they can be conjugated with DNA. Moreover, by leveraging the ability of DNA origami to form 3D templates with arbitrary shapes, D-DOC may open avenues for organizing NPs into diverse geometries.39 Therefore, D-DOC represents a versatile platform for precise organization of NPs of different compositions and sizes into novel 3D superstructures, unlocking new collective properties that may pave the way for applications ranging from biomolecular sensing,10 quantum optics,55 to energy harvesting.14
Acknowledgments
All authors acknowledge support from NASA (NNX15AQ01) for the formation and characterization of 30 nm-10 nm-30 nm trimers. A.A. and J.Z. acknowledge support from NSF (CHE-1808213). Y.Z. and T.Y. acknowledge support from DOE (DE-SC0020961) for the formation of trimers containing 50 nm AuNPs. Z.P. acknowledges support by a NASA MUREP Fellowship (80NSSC18K1748). M.G. acknowledges fellowship support from the Center for Cellular and Biomolecular Machines, which is funded by the NSF CREST program (NSF-HRD-2112675).
Supporting Information Available
The Supporting Information is available free of charge at https://pubs.acs.org/doi/10.1021/acs.jpcc.4c02229.
Additional data and discussion of DNA origami cage folding and heterotrimer assembly; additional details of DNA origami cage design; additional data and discussion of plasmonic properties of heterotrimers; and additional data and discussion of SERS (PDF)
Author Contributions
The experiments were conceived by Y.Z. and T.Y. Y.Z., Z.P., H.C., D.K., M.G., V.M., and J.S. made, simulated, and characterized the trimers. A.A. and J.Z. performed SERS measurements. The manuscript was written through contributions of all authors. All authors have given approval to the final version of the manuscript.
The authors declare no competing financial interest.
Supplementary Material
References
- Prodan E.; Radloff C.; Halas N. J.; Nordlander P. A Hybridization Model for the Plasmon Response of Complex Nanostructures. Science 2003, 302 (5644), 419–422. 10.1126/science.1089171. [DOI] [PubMed] [Google Scholar]
- Jain P. K.; El-Sayed M. A. Plasmonic Coupling in Noble Metal Nanostructures. Chem. Phys. Lett. 2010, 487 (4–6), 153–164. 10.1016/j.cplett.2010.01.062. [DOI] [Google Scholar]
- Haran G.; Chuntonov L. Artificial Plasmonic Molecules and Their Interaction with Real Molecules. Chem. Rev. 2018, 118 (11), 5539–5580. 10.1021/acs.chemrev.7b00647. [DOI] [PubMed] [Google Scholar]
- Willets K.; Van Duyne R. Localized Surface Plasmon Resonance Spectroscopy and Sensing. Annu. Rev. Phys. Chem. 2007, 58, 267–297. 10.1146/annurev.physchem.58.032806.104607. [DOI] [PubMed] [Google Scholar]
- Brown L. V.; Sobhani H.; Lassiter J. B.; Nordlander P.; Halas N. J. Heterodimers: Plasmonic Properties of Mismatched Nanoparticle Pairs. ACS Nano 2010, 4 (2), 819–832. 10.1021/nn9017312. [DOI] [PubMed] [Google Scholar]
- Liu N.; Mukherjee S.; Bao K.; Brown L. V.; Dorfmuller J.; Nordlander P.; Halas N. J. Magnetic Plasmon Formation and Propagation in Artificial Aromatic Molecules. Nano Lett. 2012, 12 (1), 364–369. 10.1021/nl203641z. [DOI] [PubMed] [Google Scholar]
- Kim W. G.; Kim H.; Ko B. Y. S.; Jeon N.; Park C.; Oh J. W.; Rho J. Freestanding, Freeform Metamolecule Fibers Tailoring Artificial Optical Magnetism. Small 2023, 19 (47), 2303749. 10.1002/smll.202303749. [DOI] [PubMed] [Google Scholar]
- Merg A. D.; Boatz J. C.; Mandal A.; Zhao G. P.; Mokashi-Punekar S.; Liu C.; Wang X. T.; Zhang P. J.; van der Wel P. C. A.; Rosi N. L. Peptide-Directed Assembly of Single-Helical Gold Nanoparticle Superstructures Exhibiting Intense Chiroptical Activity. J. Am. Chem. Soc. 2016, 138 (41), 13655–13663. 10.1021/jacs.6b07322. [DOI] [PMC free article] [PubMed] [Google Scholar]
- Lee Y. H.; Won Y.; Mun J.; Lee S.; Kim Y.; Yeom B.; Dou L.; Rho J.; Oh J. H. Hierarchically Manufactured Chiral Plasmonic Nanostructures with Gigantic Chirality for Polarized Emission and Information Encryption. Nat. Commun. 2023, 14 (1), 7298. 10.1038/s41467-023-43112-6. [DOI] [PMC free article] [PubMed] [Google Scholar]
- Unser S.; Bruzas I.; He J.; Sagle L. Localized Surface Plasmon Resonance Biosensing: Current Challenges and Approaches. Sensors 2015, 15 (7), 15684–15716. 10.3390/s150715684. [DOI] [PMC free article] [PubMed] [Google Scholar]
- Kim W. G.; Lee J. M.; Yang Y.; Kim H.; Devaraj V.; Kim M.; Jeong H.; Choi E. J.; Yang J.; Jang Y.; et al. Three-Dimensional Plasmonic Nanocluster-Driven Light-Matter Interaction for Photoluminescence Enhancement and Picomolar-Level Biosensing. Nano Lett. 2022, 22 (12), 4702–4711. 10.1021/acs.nanolett.2c00790. [DOI] [PubMed] [Google Scholar]
- Stranahan S. M.; Willets K. A. Super-Resolution Optical Imaging of Single-Molecule Sers Hot Spots. Nano Lett. 2010, 10 (9), 3777–3784. 10.1021/nl102559d. [DOI] [PubMed] [Google Scholar]
- Cheng Y.; Stakenborg T.; Van Dorpe P.; Lagae L.; Wang M.; Chen H.; Borghs G. Fluorescence near Gold Nanoparticles for DNA Sensing. Anal. Chem. 2011, 83 (4), 1307–1314. 10.1021/ac102463c. [DOI] [PubMed] [Google Scholar]
- Giannini V.; Fernandez-Dominguez A. I.; Heck S. C.; Maier S. A. Plasmonic Nanoantennas: Fundamentals and Their Use in Controlling the Radiative Properties of Nanoemitters. Chem. Rev. 2011, 111 (6), 3888–3912. 10.1021/cr1002672. [DOI] [PubMed] [Google Scholar]
- Lee Y. H.; Lee S. H.; Won Y.; Kim H.; Yang S. J.; Ahn J.; Mun J.; Lee J. H.; Dou L. T.; Rho J.; et al. Boosting the Performance of Flexible Perovskite Photodetectors Using Hierarchical Plasmonic Nanostructures. Small Struct. 2024, 2300546. 10.1002/sstr.202300546. [DOI] [Google Scholar]
- Li K.; Stockman M.; Bergman D. Self-Similar Chain of Metal Nanospheres as an Efficient Nanolens. Phys. Rev. Lett. 2003, 91 (22), 227402. 10.1103/PhysRevLett.91.227402. [DOI] [PubMed] [Google Scholar]
- Wustholz K. L.; Henry A. I.; McMahon J. M.; Freeman R. G.; Valley N.; Piotti M. E.; Natan M. J.; Schatz G. C.; Van Duyne R. P. Structure-Activity Relationships in Gold Nanoparticle Dimers and Trimers for Surface-Enhanced Raman Spectroscopy. J. Am. Chem. Soc. 2010, 132 (31), 10903–10910. 10.1021/ja104174m. [DOI] [PubMed] [Google Scholar]
- Mertens J.; Eiden A.; Sigle D.; Huang F.; Lombardo A.; Sun Z.; Sundaram R.; Colli A.; Tserkezis C.; Aizpurua J.; et al. Controlling Subnanometer Gaps in Plasmonic Dimers Using Graphene. Nano Lett. 2013, 13 (11), 5033–5038. 10.1021/nl4018463. [DOI] [PubMed] [Google Scholar]
- Fan J. A.; Wu C. H.; Bao K.; Bao J. M.; Bardhan R.; Halas N. J.; Manoharan V. N.; Nordlander P.; Shvets G.; Capasso F. Self-Assembled Plasmonic Nanoparticle Clusters. Science 2010, 328 (5982), 1135–1138. 10.1126/science.1187949. [DOI] [PubMed] [Google Scholar]
- Lloyd J. A.; Ng S. H.; Liu A. C. Y.; Zhu Y.; Chao W.; Coenen T.; Etheridge J.; Gomez D. E.; Bach U. Plasmonic Nanolenses: Electrostatic Self-Assembly of Hierarchical Nanoparticle Trimers and Their Response to Optical and Electron Beam Stimuli. ACS Nano 2017, 11 (2), 1604–1612. 10.1021/acsnano.6b07336. [DOI] [PubMed] [Google Scholar]
- Ding B.; Deng Z.; Yan H.; Cabrini S.; Zuckermann R.; Bokor J. Gold Nanoparticle Self-Similar Chain Structure Organized by DNA Origami. J. Am. Chem. Soc. 2010, 132 (10), 3248–3249. 10.1021/ja9101198. [DOI] [PubMed] [Google Scholar]
- Thacker V. V.; Herrmann L. O.; Sigle D. O.; Zhang T.; Liedl T.; Baumberg J. J.; Keyser U. F. DNA Origami Based Assembly of Gold Nanoparticle Dimers for Surface-Enhanced Raman Scattering. Nat. Commun. 2014, 5, 3448. 10.1038/ncomms4448. [DOI] [PubMed] [Google Scholar]
- Jiang Q.; Liu Q.; Shi Y. F.; Wang Z. G.; Zhan P. F.; Liu J. B.; Liu C.; Wang H.; Shi X. H.; Zhang L.; et al. Stimulus-Responsive Plasmonic Chiral Signals of Gold Nanorods Organized on DNA Origami. Nano Lett. 2017, 17 (11), 7125–7130. 10.1021/acs.nanolett.7b03946. [DOI] [PubMed] [Google Scholar]
- Heck C.; Kanehira Y.; Kneipp J.; Bald I. Placement of Single Proteins within the Sers Hot Spots of Self-Assembled Silver Nanolenses. Angew. Chem., Int. Ed. 2018, 57 (25), 7444–7447. 10.1002/anie.201801748. [DOI] [PubMed] [Google Scholar]
- Hong F.; Zhang F.; Liu Y.; Yan H. DNA Origami: Scaffolds for Creating Higher Order Structures. Chem. Rev. 2017, 117 (20), 12584–12640. 10.1021/acs.chemrev.6b00825. [DOI] [PubMed] [Google Scholar]
- Alivisatos A. P.; Johnsson K. P.; Peng X. G.; Wilson T. E.; Loweth C. J.; Bruchez M. P.; Schultz P. G. Organization of ’Nanocrystal Molecules’ Using DNA. Nature 1996, 382 (6592), 609–611. 10.1038/382609a0. [DOI] [PubMed] [Google Scholar]
- Lim D. K.; Jeon K. S.; Kim H. M.; Nam J. M.; Suh Y. D. Nanogap-Engineerable Raman-Active Nanodumbbells for Single-Molecule Detection. Nat. Mater. 2010, 9 (1), 60–67. 10.1038/nmat2596. [DOI] [PubMed] [Google Scholar]
- Edwardson T. G. W.; Lau K. L.; Bousmail D.; Serpell C. J.; Sleiman H. F. Transfer of Molecular Recognition Information from DNA Nanostructures to Gold Nanoparticles. Nat. Chem. 2016, 8 (2), 162–170. 10.1038/nchem.2420. [DOI] [PubMed] [Google Scholar]
- Yao G.; Li J.; Li Q.; Chen X.; Liu X.; Wang F.; Qu Z.; Ge Z.; Narayanan R. P.; Williams D.; et al. Programming Nanoparticle Valence Bonds with Single-Stranded DNA Encoders. Nat. Mater. 2020, 19 (7), 781–788. 10.1038/s41563-019-0549-3. [DOI] [PubMed] [Google Scholar]
- Lim D. K.; Jeon K. S.; Hwang J. H.; Kim H.; Kwon S.; Suh Y. D.; Nam J. M. Highly Uniform and Reproducible Surface-Enhanced Raman Scattering from DNA-Tailorable Nanoparticles with 1-Nm Interior Gap. Nat. Nanotechnol. 2011, 6 (7), 452–460. 10.1038/nnano.2011.79. [DOI] [PubMed] [Google Scholar]
- Lee H.; Kim G. H.; Lee J. H.; Kim N. H.; Nam J. M.; Suh Y. D. Quantitative Plasmon Mode and Surface-Enhanced Raman Scattering Analyses of Strongly Coupled Plasmonic Nanotrimers with Diverse Geometries. Nano Lett. 2015, 15 (7), 4628–4636. 10.1021/acs.nanolett.5b01322. [DOI] [PubMed] [Google Scholar]
- Nicoli F.; Zhang T.; Hubner K.; Jin B. Y.; Selbach F.; Acuna G.; Argyropoulos C.; Liedl T.; Pilo-Pais M. DNA-Mediated Self-Assembly of Plasmonic Antennas with a Single Quantum Dot in the Hot Spot. Small 2019, 15 (26), 1804418. 10.1002/smll.201804418. [DOI] [PubMed] [Google Scholar]
- Kelly K.; Coronado E.; Zhao L.; Schatz G. The Optical Properties of Metal Nanoparticles: The Influence of Size, Shape, and Dielectric Environment. J. Phys. Chem. B 2003, 107 (3), 668–677. 10.1021/jp026731y. [DOI] [Google Scholar]
- Claridge S. A.; Liang H. W.; Basu S. R.; Frechet J. M. J.; Alivisatos A. P. Isolation of Discrete Nanoparticle - DNA Conjugates for Plasmonic Applications. Nano Lett. 2008, 8 (4), 1202–1206. 10.1021/nl0802032. [DOI] [PubMed] [Google Scholar]
- Heck C.; Prinz J.; Dathe A.; Merk V.; Stranik O.; Fritzsche W.; Kneipp J.; Bald I. Gold Nanolenses Self-Assembled by DNA Origami. ACS Photonics 2017, 4 (5), 1123–1130. 10.1021/acsphotonics.6b00946. [DOI] [Google Scholar]
- Yao G. B.; Li J.; Li Q.; Chen X. L.; Liu X. G.; Wang F.; Qu Z. B.; Ge Z. L.; Narayanan R. P.; Williams D.; et al. Programming Nanoparticle Valence Bonds with Single-Stranded DNA Encoders. Nat. Mater. 2020, 19 (7), 781–788. 10.1038/s41563-019-0549-3. [DOI] [PubMed] [Google Scholar]
- Zhao Z.; Jacovetty E. L.; Liu Y.; Yan H. Encapsulation of Gold Nanoparticles in a DNA Origami Cage. Angew. Chem., Int. Ed. 2011, 50 (9), 2041–2044. 10.1002/anie.201006818. [DOI] [PMC free article] [PubMed] [Google Scholar]
- Helmi S.; Ziegler C.; Kauert D. J.; Seidel R. Shape-Controlled Synthesis of Gold Nanostructures Using DNA Origami Molds. Nano Lett. 2014, 14 (11), 6693–6698. 10.1021/nl503441v. [DOI] [PubMed] [Google Scholar]
- Castro C. E.; Kilchherr F.; Kim D. N.; Shiao E. L.; Wauer T.; Wortmann P.; Bathe M.; Dietz H. A Primer to Scaffolded DNA Origami. Nat. Methods 2011, 8 (3), 221–229. 10.1038/nmeth.1570. [DOI] [PubMed] [Google Scholar]
- Bellot G.; McClintock M.; Lin C.; Shih W. Recovery of Intact DNA Nanostructures after Agarose Gel-Based Separation. Nat. Methods 2011, 8 (3), 192–194. 10.1038/nmeth0311-192. [DOI] [PMC free article] [PubMed] [Google Scholar]
- Daniel W. W.Applied Nonparametric Statistics; PWS-KENT, 1990. [Google Scholar]
- Zhang L.; Lei D.; Smith J.; Zhang M.; Tong H.; Zhang X.; Lu Z.; Liu J.; Alivisatos A.; Ren G. Three-Dimensional Structural Dynamics and Fluctuations of DNA-Nanogold Conjugates by Individual-Particle Electron Tomography. Nat. Commun. 2016, 7, 11083. 10.1038/ncomms11083. [DOI] [PMC free article] [PubMed] [Google Scholar]
- Halas N. J.; Lal S.; Chang W. S.; Link S.; Nordlander P. Plasmons in Strongly Coupled Metallic Nanostructures. Chem. Rev. 2011, 111 (6), 3913–3961. 10.1021/cr200061k. [DOI] [PubMed] [Google Scholar]
- Kim W. G.; Devaraj V.; Yang Y.; Lee J. M.; Kim J. T.; Oh J. W.; Rho J. Three-Dimensional Plasmonic Nanoclusters Driven by Co-Assembly of Thermo-Plasmonic Nanoparticles and Colloidal Quantum Dots. Nanoscale 2022, 14 (44), 16450–16457. 10.1039/D2NR03737H. [DOI] [PubMed] [Google Scholar]
- Le Ru E. C.; Etchegoin P. G. Single-Molecule Surface-Enhanced Raman Spectroscopy. Annu. Rev. Phys. Chem. 2012, 63, 65–87. 10.1146/annurev-physchem-032511-143757. [DOI] [PubMed] [Google Scholar]
- Jiang; Bosnick K.; Maillard M.; Brus L. Single Molecule Raman Spectroscopy at the Junctions of Large Ag Nanocrystals. J. Phys. Chem. B 2003, 107 (37), 9964–9972. 10.1021/jp034632u. [DOI] [Google Scholar]
- Langer J.; Jimenez de Aberasturi D.; Aizpurua J.; Alvarez-Puebla R.; Auguie B.; Baumberg J.; Bazan G.; Bell S.; Boisen A.; Brolo A.; et al. Present and Future of Surface-Enhanced Raman Scattering. ACS Nano 2020, 14 (1), 28–117. 10.1021/acsnano.9b04224. [DOI] [PMC free article] [PubMed] [Google Scholar]
- Barhoumi A.; Zhang D.; Tam F.; Halas N. J. Surface-Enhanced Raman Spectroscopy of DNA. J. Am. Chem. Soc. 2008, 130 (16), 5523–5529. 10.1021/ja800023j. [DOI] [PubMed] [Google Scholar]
- Hurst S.; Lytton-Jean A.; Mirkin C. Maximizing DNA Loading on a Range of Gold Nanoparticle Sizes. Anal. Chem. 2006, 78 (24), 8313–8318. 10.1021/ac0613582. [DOI] [PMC free article] [PubMed] [Google Scholar]
- Kleinman S.; Sharma B.; Blaber M.; Henry A.; Valley N.; Freeman R.; Natan M.; Schatz G.; Van Duyne R. Structure Enhancement Factor Relationships in Single Gold Nanoantennas by Surface-Enhanced Raman Excitation Spectroscopy. J. Am. Chem. Soc. 2013, 135 (1), 301–308. 10.1021/ja309300d. [DOI] [PubMed] [Google Scholar]
- Adams S.; Zhang J. Z. Unique Optical Properties and Applications of Hollow Gold Nanospheres (Hgns). Coord. Chem. Rev. 2016, 320–321, 18–37. 10.1016/j.ccr.2016.01.014. [DOI] [Google Scholar]
- Bastús N. G.; Merkoçi F.; Piella J.; Puntes V. Synthesis of Highly Monodisperse Citrate-Stabilized Silver Nanoparticles of up to 200 nm: Kinetic Control and Catalytic Properties. Chem. Mater. 2014, 26 (9), 2836–2846. 10.1021/cm500316k. [DOI] [Google Scholar]
- Rahmani P.; Goodlad M.; Zhang Y. H.; Li Y. C.; Ye T. One-Step Ligand-Exchange Method to Produce Quantum Dot-DNA Conjugates for DNA-Directed Self-Assembly. ACS Appl. Mater. Inter 2022, 14 (42), 47359–47368. 10.1021/acsami.2c10580. [DOI] [PubMed] [Google Scholar]
- Park S. S.; Urbach Z. J.; Brisbois C. A.; Parker K. A.; Partridge B. E.; Oh T.; Dravid V. P.; Olvera de la Cruz M.; Mirkin C. A. DNA- and Field-Mediated Assembly of Magnetic Nanoparticles into High-Aspect Ratio Crystals. Adv. Mater. 2020, 32 (4), 19066626. 10.1002/adma.201906626. [DOI] [PubMed] [Google Scholar]
- Bitton O.; Gupta S. N.; Houben L.; Kvapil M.; Krapek V.; Sikola T.; Haran G. Vacuum Rabi Splitting of a Dark Plasmonic Cavity Mode Revealed by Fast Electrons. Nat. Commun. 2020, 11 (1), 487. 10.1038/s41467-020-14364-3. [DOI] [PMC free article] [PubMed] [Google Scholar]
Associated Data
This section collects any data citations, data availability statements, or supplementary materials included in this article.


