

Abstract
Objective:
Responsive neurostimulation is an effective therapy for patients with refractory mesial temporal lobe epilepsy. However, clinical outcomes are variable, few patients become seizure-free, and the optimal stimulation location is currently undefined. The aim of this study was to quantify responsive neurostimulation in the mesial temporal lobe, identify stimulation-dependent networks associated with seizure reduction, and determine if stimulation location or stimulation-dependent networks inform outcomes.
Methods:
We modeled patient-specific volumes of tissue activated and created probabilistic stimulation maps of local regions of stimulation across a retrospective cohort of 22 patients with mesial temporal lobe epilepsy. We then mapped the network stimulation effects by seeding tractography from the volume of tissue activated with both patient-specific and normative diffusion-weighted imaging. We identified networks associated with seizure reduction across patients using the patient-specific tractography maps and then predicted seizure reduction across the cohort.
Results:
Patient-specific stimulation-dependent connectivity was correlated with responsive neurostimulation effectiveness after cross-validation (P=0.03); however, normative connectivity derived from healthy subjects was not (P=0.44). Increased connectivity from the volume of tissue activated to the medial prefrontal cortex, cingulate cortex, and precuneus was associated with greater seizure reduction.
Significance:
Overall, our results suggest that the therapeutic effect of responsive neurostimulation may be mediated by specific networks connected to the volume of tissue activated. Additionally, patient-specific tractography was required to identify structural networks correlated with outcomes. It is therefore likely that altered connectivity in epilepsy patients may be associated with the therapeutic effect and utilizing patient-specific imaging could be important for future studies. The structural networks identified here may be utilized to target stimulation in the mesial temporal lobe and improve seizure reduction for patients treated with responsive neurostimulation.
Keywords: tractography, volume of tissue activated, connectivity
Introduction
Neuromodulation is an effective adjunctive therapy for patients with intractable epilepsy who may not be suitable resection candidates. The responsive neurostimulation (RNS®) System (NeuroPace, Mountain View, CA) has been approved by the United States Food and Drug Administration to treat adults with disabling refractory focal seizures. The closed-loop RNS System electrically stimulates seizure foci through two intracranial depth or subdural strip leads in response to patient-specific detection of electrographic epileptic activity. Three clinical trials—an open-label feasibility study, a double-blinded randomized controlled pivotal study,1 and a 7-year open-label long-term treatment study2–4—have demonstrated an increase in median seizure reduction over time: 44% at year one, improving progressively to 75% at year nine.4 However, the clinical response to RNS is variable across patients. Approximately 27% of patients are non-responders with less than 50% seizure reduction, and only 28% of patients experience long-term periods of seizure freedom.3,4
The variability in seizure reduction across patients has not been explained by clinical features such as the age at epilepsy onset or intervention,4,5 seizure onset location,4–6 presence of a lesion,4,6 prior surgical intervention,4–7 or by stimulation features such as the charge density delivered.8 Although the ideal stimulation parameters remain unspecified, a general approach has been suggested for the RNS system.9 The guidelines recommend a pulse width of 160 μs, frequency of 200 Hz, and burst duration of 100 ms. The main parameter adjusted is charge density; the guidelines suggest an initial low charge density of 0.5 μC/cm2 be increased by 0.5 μC/cm2 steps at subsequent programming visits if the clinical response is unsatisfactory. However, currently, little evidence supports a relationship between charge density and seizure outcomes.8
Recent work has suggested that the variability in seizure outcomes may be explained by more complex phenomena, such as pre-implant network synchronizability,10 the interaction between high and low excitatory brain states and stimulation parameters,11 or long-term neuromodulatory effects resulting in brain-network reorganization.12,13 The mechanism by which neurostimulation reduces seizure frequency is poorly understood, and the ideal stimulation parameters, frequency of stimulation programming, and stimulation location that result in seizure freedom are still unknown.
The RNS System is often used as a therapy for temporal lobe epilepsy, the most common type of refractory epilepsy.14,15 Of the patients in the RNS feasibility and pivotal clinical trials, 43% had mesial temporal lobe seizure onset.4 For these cases, RNS depth electrodes are typically implanted along the long axis of mesial temporal structures such as the hippocampus and amygdala.3,6 However, whether stimulation of specific mesial temporal regions or their associated networks improves seizure reduction is currently unknown. Previous work has found no correlation between the location of stimulation in the hippocampus and seizure outcomes.6,16 Mesial temporal lobe epilepsy is a network disorder involving nodes of the limbic circuit, including the amygdala, hippocampal complex, entorhinal cortex, cingulate cortex, thalamus, and hypothalamus.17–21 Widespread alterations in these networks in patients with epilepsy have been reported.22–27 However, few studies have investigated the structural networks modulated with mesial temporal RNS and their associated seizure outcomes.28 Stimulation location has been reported as an important predictor of response for other disorders treated with neurostimulation, but currently no consensus has been reached concerning the optimal target within the mesial temporal lobe or which networks need to be modulated to reduce seizures.
The objectives of this study were to quantify how RNS System therapy is applied in the mesial temporal lobe and to identify specific regions or networks correlated with seizure reduction to better predict clinical outcomes. In this retrospective study, we determined the patient-specific volume of tissue activated and the associated networks across a cohort of patients implanted with mesial temporal RNS depth electrodes. We hypothesized that modulation of distributed brain networks, rather than specific nuclei, may predict seizure reduction for mesial temporal lobe epilepsy. Additionally, given the network reorganization experienced in epilepsy, we hypothesized that structural connectivity derived from patient-specific diffusion imaging—and not connectivity derived from healthy subjects—is associated with seizure outcomes. The findings of this study have the potential to identify network targets to guide future applications of RNS for mesial temporal lobe epilepsy.
Materials and methods
Patient cohort
We collected retrospective data from patients with mesial temporal lobe epilepsy implanted with the RNS System between 2016 and 2021 at the University of Utah. All patients were reviewed in a multidisciplinary epilepsy case conference before deciding to move forward with implantation of the RNS System. Patients were implanted with two leads (a combination of depth leads with 3.5 mm or 10 mm interelectrode spacing or cortical strip arrays with 10 mm interelectrode spacing, NeuroPace Inc, Mountain View, CA) placed stereotactically with a CRW frame (Integra LifeSciences, Princeton, NJ). Patients were included in this study if they were implanted with at least one depth electrode in the mesial temporal lobe, had been implanted for at least five months, stimulation was on for at least four months,5 and clinical preoperative MRI and postoperative CT were available. Board-certified epileptologists, BJN, AYP, and AMA, reported preoperative baseline and most recent follow-up seizure frequencies based on patient-reported seizure diaries and clinical notes. Patients with concurrent psychogenic non-epileptic seizures were excluded to ensure accurate seizure reporting. Retrospective data collection and analysis was approved by the University of Utah Institutional Review Board.
Preprocessing of patient imaging
Electrode reconstruction and tissue segmentation
We reconstructed electrode locations by linearly coregistering each patient’s preoperative MRI and postoperative CT and identifying the electrodes from the CT artifact with the LeGUI software package (Localize Electrodes GUI, https://github.com/Rolston-Lab/LeGUI).29 Interelectrode spacing was corrected using the electrode alignment algorithm in LeGUI to enforce interelectrode distances of 3.5 mm or 10 mm, based on lead geometry. A patient-specific surface mesh of each lead was then created. We generated segmentations of the skull, cerebrospinal fluid (CSF), gray matter, white matter, and ventricles using the output of the SimNIBS pipeline (https://simnibs.github.io/simnibs),30 which generates nonoverlapping triangular surface meshes from FreeSurfer (http://surfer.nmr.mgh.harvard.edu/) segmentations. Additional mesh corrections were necessary to ensure the hippocampal regions were included in the gray matter segmentation, as these regions were frequently excluded in the automated SimNIBS pipeline. We then performed a nonlinear registration of each patient’s skull-stripped preoperative MRI to the Montreal Neurological Institute (MNI) 2009b Nonlinear Asymmetric Atlas, implemented with Advanced Normalization Tools software (https://github.com/ANTsX/ANTs).31 We used the resulting transformations to warp each patient’s contact location and simulation results to the MNI atlas space to compare stimulation across the cohort.
Diffusion preprocessing
Diffusion-weighted imaging (DWI), acquired as part of standard clinical practice, was processed using the FMRIB Software Library (FSL) pipeline.32 Given that the clinical DWI acquisition parameters have improved in recent years, our cohort had a range of imaging quality: b-values ranged from 10 directions at b = 1000 S/mm2 to multi-shell data at b = 1000 S/mm2 and b = 2000 S/mm2 in 64 directions each. Eddy correction was completed in FSL, and the probabilistic diffusion model was run on corrected data through the probtractx function in FSL. A DWI-derived scalar image calculated via the anisotropic power metric (DIPY python package) was nonlinearly registered to the preoperative MRI space using the Advanced Normalization Tools SyN algorithm.33,34 Ultimately, probabilistic maps generated in diffusion space were nonlinearly warped into patient-space and then MNI space using the respective transformation matrices.
Patient-specific models of neural activation
We calculated the volume of tissue activated (VTA) to estimate of the spatial extent of neural activation. We implemented a sophisticated patient-specific VTA modeling approach to accurately model the effects of stimulation. These models were based on each patient’s stimulation waveform, lead geometry and location, and tissue geometry, additionally incorporating patient-specific anisotropy from DWI when available.35 Anisotropic conductivity improves the accuracy of the VTA model by producing a non-uniform voltage distribution dependent on the patient-specific diffusion properties near the electrode.35–37
We first generated a tetrahedral finite element mesh for each patient with the TetGen38 module in SCIRun5 (www.scirun.org); each mesh was approximately 17 million elements. The tissue compartments were defined by the skull, CSF, gray matter, and ventricle tissue surfaces acquired from the SimNIBS pipeline and the patient-specific lead model described above. Including the ventricles in our bioelectric field models was critical due to the proximity of the RNS leads to the lateral ventricle. We set isotropic conductivities to the skull (0.0064 S/m39) and CSF/ventricle (1.79 S/m40) tissue compartments. For patients with preoperative DWI, anisotropic conductivities were set to the mesh elements representing the brain tissue using the volume-normalization approach, as described in Anderson et al.41 An isotropic brain tissue conductivity (0.2 S/m) was used for patients without DWI.42,43 The lead shaft was modeled as a perfect insulator by clipping the inside of the lead out of the volumetric mesh. The contacts were modeled as perfect conductors. The bioelectric field solution was solved for each lead at the patient’s current amplitude at the most recent follow-up with Dirichlet boundary conditions (0 V) on the nodes in the top 5% of the skull, representing the cranially implanted pulse generator, and Neumann boundary conditions at the mesh boundary.
To model the extent of neural activation, we used the Hessian matrix of second derivatives of the electric potential.41 Of the many models of the VTA, we selected the Hessian-based VTA for several reasons: it is unbiased to fiber orientation, it is computationally faster than 2D axon models, especially when incorporating anisotropic tissue conductivities; and unlike the electric field norm, it is based on a biophysical model of neural activation, the cable model.44,45 The Hessian of the electric potential was calculated with 0.4 mm resolution on a 30 × 80 × 30 mm grid. The VTA was then defined by thresholding the max eigenvalue of the Hessian with an activating function threshold based on multi-compartment axon models specific to the lead geometry, stimulation amplitude, stimulation frequency, and pulse width simulated with a symmetric biphasic waveform in NEURON.41,45,46 The VTAs were clipped by the ventricle segmentation to ensure no estimation of neural activation occurred within the ventricles. The VTA for each lead was then nonlinearly transformed to MNI space using the previously described transformations. All VTAs were then warped to a single (left) hemisphere of MNI space and treated independently for all further analysis.
Probabilistic stimulation maps (PSMs)
We next generated probabilistic stimulation maps (PSMs) to quantify the variability of stimulation across the cohort and associated stimulation location with seizure outcomes.47–49 VTA surfaces were resampled onto a (0.5 × 0.5 × 0.5 mm) grid in MNI space, representing binary voxels of neural activation. To identify regions frequently stimulated, we generated a map of the voxelwise sum of the overlapping VTA, referred to as the N-map. To evaluate whether seizure reduction was associated with stimulation of a voxel, we created PSMs using a two-sample t-test.50 At each voxel, the two samples consisted of seizure-reduction scores for patients stimulated at that voxel and for patients not stimulated at that voxel. The resulting PSMs were the t-statistic and p-values at each voxel. The PSMs were masked for N-map values greater than two. The t-statistic PSM was visualized to identify regions associated with greater seizure reduction (positive t-statistic) or less seizure reduction (negative t-statistic) if stimulated at that voxel.
Structural networks connected to the VTA
Normative tract probability maps
Normative connectomes average brain connectivity values from diffusion-weighted imaging over a large cohort of subjects. Using normative connectomes to estimate connectivity is advantageous because they use high-quality, high-resolution imaging that is not routinely acquired for clinical applications and can be used when no patient-specific DWI is acquired clinically.51 Normative connectomes have previously been used to identify networks predictive of clinical outcomes for deep brain stimulation.52–55 We created a normative tract probability map for each VTA using methods previously described.53 Briefly, each VTA was resampled onto a 1 mm3/voxel volume, and used as the seed for probabilistic tractography in 40 Human Connectome Project (HCP) patients.56 To control for VTA size, each HCP tract probability map was normalized by the total number of generated fibers meeting tracking criteria. For each VTA, a single tract probability map was generated by averaging across the 40 normalized HCP tract probability maps.
Patient-specific tract probability maps
Although normative connectomes have proven to be useful when DWI is not acquired, patient-specific imaging remains the goal when moving toward personalized brain stimulation.57 Normative connectivity is based on healthy subjects and may not capture disease-specific structural reorganization important to identifying therapeutic networks associated with stimulation.52 We, therefore, generated tract probability maps for the subset of patients for whom preoperative DWI was acquired. Patient-specific VTAs were warped to diffusion space and seeded for probabilistic tractography using the same parameters used for the normative approach. Tract probability maps were normalized by the total number of generated fibers that met the tracking criteria and then warped to MNI space.
Statistical analysis
Statistical analysis of cohort characteristics
The Pearson correlation was used to test for significant relationships between continuous clinical characteristics and seizure reduction. The Welch’s two-sample t-test was used to test for statistical seizure reduction differences between two groups. The threshold for statistical significance was p < 0.05 for all analyses.
VTA-based correlation with seizure reduction
To associate seizure outcomes with the VTA, a linear model was generated based on the spatial overlap of the patient-specific VTA with a PSM using the procedure described by Reich et al.50 We multiplied the sign of the t-statistic with the P-value at each voxel, creating a signed P-map PSM, to quantify both the deviation of the distribution from the mean and the direction of deviation. The frequency distribution of the signed P-map values that overlapped with the VTA were used as the independent variables in a multivariate linear model to predict seizure reduction. The linear model was trained on all the VTAs, and the predicted seizure reduction was compared to the clinically measured seizure reduction using a Pearson correlation. We then performed a leave-one-out cross-validation, where n linear models were generated for n=22 patients, to determine if the model was generalizable to out-of-sample data. For each iteration in the leave-one-out cross-validation, all VTAs for a single patient were removed from the training set, a new signed P-map was created without that patient’s data, and a new linear model was used to predict the left out VTA’s (one for unilateral patients, two for bilateral patients) corresponding seizure reduction. To determine the model’s generalizability to independent data, we computed the correlation coefficient between the measured and predicted seizure reductions resulting from cross-validation.
Network-based correlation with seizure reduction
To identify networks associated with seizure reduction, a voxelwise correlation of tract probability and the corresponding seizure reduction was performed across all VTAs, referred to as an R-map. Due to different DWI acquisition qualities, only voxels with greater than five positive tract probabilities were included in the voxelwise correlation. The resulting R-map was used to create an ‘ideal’ connectivity map using methods described in Johnson et al.53 Briefly, the positively correlated voxels were assigned the maximum voxelwise tract probability value, and the negatively correlated voxels were assigned the minimum voxelwise tract probability. The tract probability map from each VTA was then correlated to the ideal connectivity map, resulting in a single connectivity correlation coefficient. This connectivity correlation coefficient was then correlated with the respective patient’s seizure reduction to determine whether the similarity between the individual tract probability and the ideal connectivity map correlated with seizure reduction. We validated this model using the same leave-one-out cross-validation as the signed P-map prediction. The ideal connectivity map was recalculated, leaving out the test patient’s tract probability map, and new connectivity correlation values were calculated. To assess the model’s predictive performance, we calculated the correlation coefficient between the cross-validation connectivity correlations and their associated seizure reduction score.
To interpret and visualize the structural networks that were associated with seizure reduction, we set the threshold of the R-map for voxels with large effect sizes (R > 0.5 or R < −0.5).58 We then parcellated the brain using the cortical and subcortical areas from the Brainnetome atlas59 and the cerebellum, brainstem, and basal forebrain from the Mindboggle atlas60. The top ten positively correlated regions and top ten negatively correlated regions were identified based on the percentage of positively or negatively correlated voxels in each parcellated region.
Data availability
The data that support the findings in this study are available on request from the corresponding author.
Results
Cohort characteristics
We studied 22 patients implanted with the RNS System in the mesial temporal lobe (n=15 with bilateral depth leads in the mesial temporal lobe, n=7 with a unilateral depth lead in the mesial temporal lobe, and a cortical strip lead on the temporal lobe). All patients implanted with bilateral depth leads had evidence for bilateral independent seizure foci during presurgical evaluation; n=4 patients with unilateral leads were presumed to have mesial foci and n=3 patients were presumed to have neocortical foci. The study design and the methodological overview are shown in Fig. 1, and cohort characteristics are available in Supplementary Table 1. Median stimulation duration at follow-up was 23 months (range 4–50 months), and median seizure reduction from baseline was 58.6% (range −62.5–100%). However, seizure reduction was variable across the cohort: n=6 were super responders (seizure reduction > 90%), n=7 were intermediate responders (seizure reduction between 50% and 90%), and n=9 were nonresponders (seizure reduction < 50%) (Fig. 2B). Seizure outcomes were not significantly different between patients with bilateral depth leads and unilateral depth and strip leads (t=0.22, P=0.83), with invasive monitoring (n=17, t=1.06, P=0.33), or with mesial temporal pathology (n=5, t=−0.88, P=0.40). The median age at last follow-up was 41 years old (range 21–64 years), and the median epilepsy duration was 16.5 years (range 3–43 years). Age (R=0.06, P=0.78), epilepsy duration (R=0.02, P=0.91), and baseline seizure frequency (R=0.06, P=0.78) were not significantly correlated with seizure reduction. Response to RNS is reported to improve over time; however, we found no significant correlation between seizure reduction and duration of stimulation (R=0.06, P=0.78) (Fig. 2C).
Figure 1. Study design and workflow of the local stimulation and network stimulation analysis.
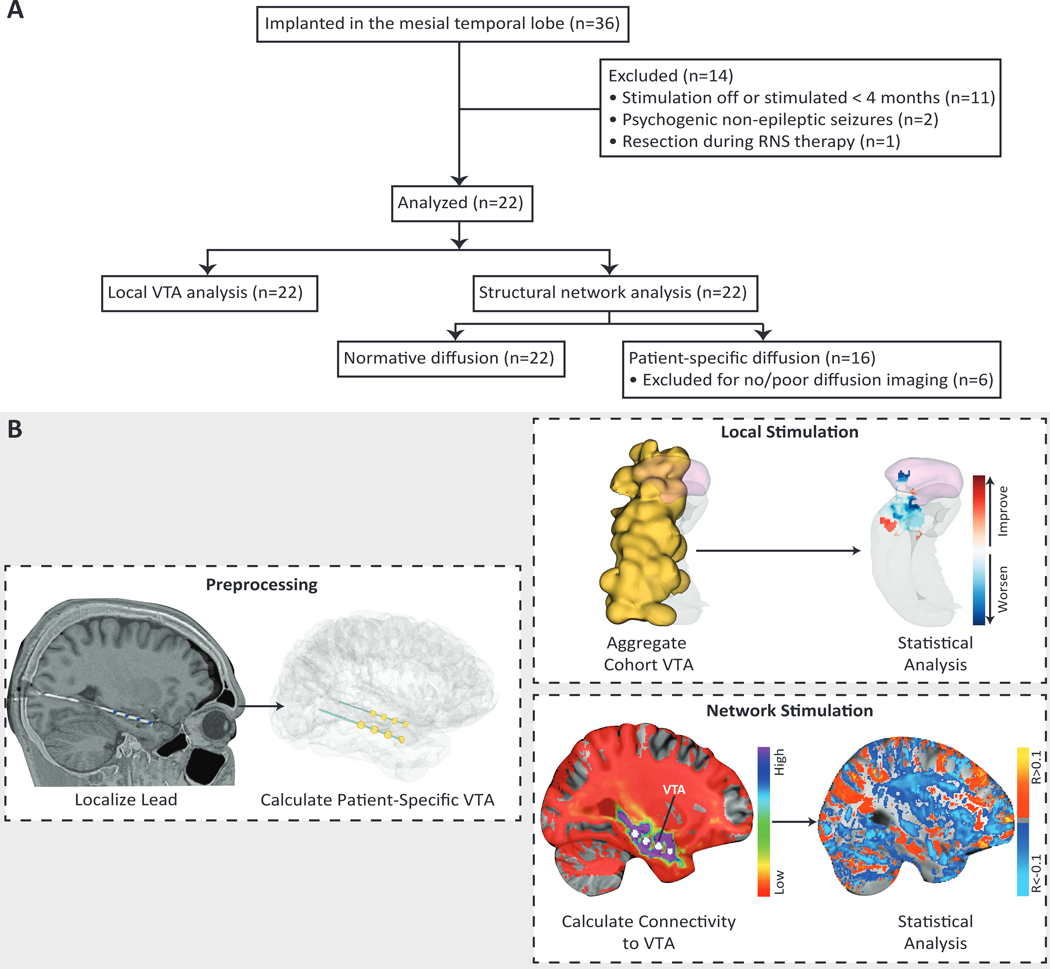
(A) Flow diagram for the retrospective study and analysis. (B) We coregistered each patient’s preoperative MRI and postoperative CT and localized the RNS leads using the LeGUI software package. We then created patient-specific finite element models using each patient’s anatomy and lead locations and incorporated anisotropic conductivities when available. A Hessian-based VTA (yellow) was calculated for each lead using patient-specific stimulation parameters. VTAs were characterized by a sphere-like volume on each of the four contacts per lead. For the local stimulation analysis, all VTAs (n=37) were nonlinearly warped from patient-space to a single hemisphere in MNI atlas space. The aggregated VTA for the entire cohort is shown in yellow. Statistical analysis was then performed on the aggregated data by incorporating clinical outcomes and identifying local regions corresponding to improved (red) or worsened (blue) seizure reduction, if stimulated at that region. Here we show a representative axial slice through the amygdala in pink and hippocampus in gray. For the network stimulation analysis, VTAs (n=26) were used to generate probabilistic tractography maps in both patient-space and an average tractography map across 40 HCP subjects (normative). Then a voxelwise regression of connectivity and seizure reduction was performed across all VTAs. Positively correlated voxels (orange/yellow) and negatively correlated voxels (blue) were used to predict seizure reduction based on their similarity with each patient’s connectivity map.
Figure 2. Clinical features of the mesial temporal lobe epilepsy cohort.
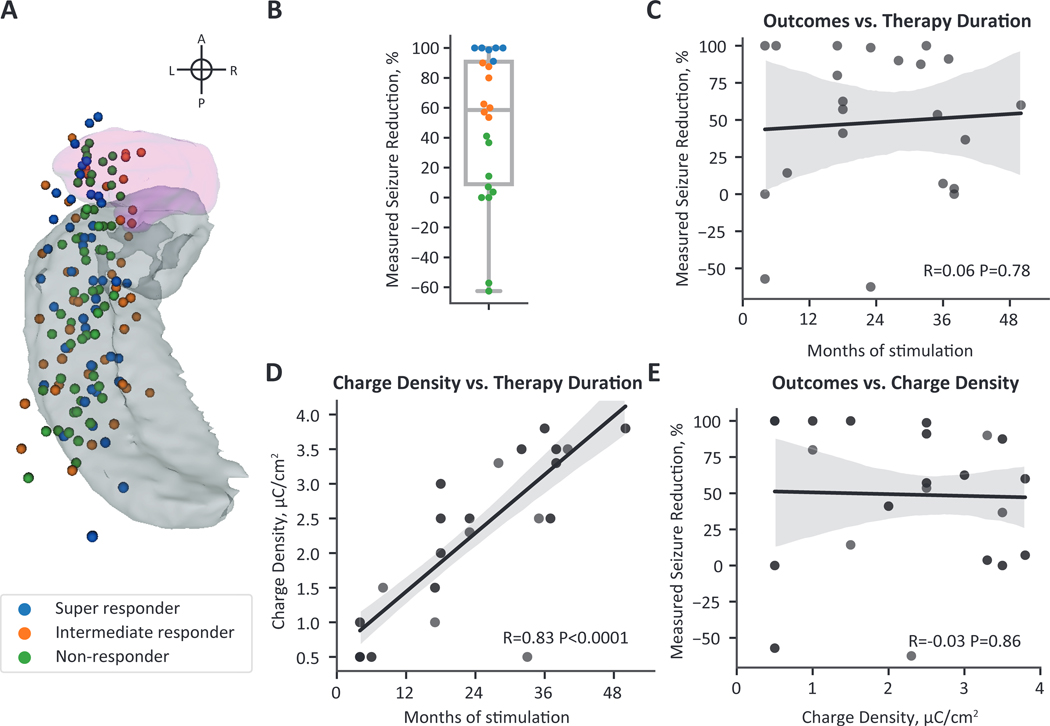
(A) A superior view of active RNS contact locations mapped to a single hemisphere. The amygdala is shown in pink and the hippocampus in gray. Each lead has four active contacts (n=37 leads, 148 contacts). Contacts are colored by the responder type shown in the legend and in (B). (B) Seizure reduction at last clinical follow-up was variable across the cohort. Super-responders (seizure reduction between 90 and 100%) are shown in blue, intermediate responders (seizure reduction between 90 and 50%) are shown in orange, and non-responders (seizure reduction less than 50%) are shown in green. (C) Seizure reduction was not significantly correlated with duration of stimulation. (D) Charge density was strongly correlated with stimulation duration, demonstrating an increase in delivered current over the duration of therapy. (E) Although charge density was strongly correlated with stimulation duration, an increase in charge density did not correspond to improved seizure reduction. (C-E) Black lines show the linear regression fit line, and the gray shading represents the 95% confidence interval.
We next investigated whether stimulation programming features were associated with seizure reduction. The centroid locations of the active mesial temporal lobe depth contacts (n=148 contacts, i.e., four contacts on each of 37 leads) are shown in Fig. 2A. We found a significant correlation between stimulation duration and charge density (R=0.83, P<0.0001) (Fig. 2D). This relationship is likely because the cohort was programmed using the recommended stimulation guidelines, which suggest an increase in current density at subsequent programming visits if a satisfactory seizure reduction was not achieved. Strikingly, although these are the current best practices for stimulation programming, we found no significant correlation between charge density and seizure reduction (R=−0.03, P=0.86) (Fig. 2E). We also found no statistically significant difference in seizure outcomes for leads programmed with monopolar (all four contacts are anodes or cathodes) versus bipolar stimulation (two contacts are anodes and two contacts are cathodes) (t=0.74, P=0.74).
Probabilistic stimulation maps
Since clinical and stimulation features did not explain the variability in seizure outcomes, we hypothesized that stimulation location in the mesial temporal lobe may explain this variability. We used the Hessian-based VTA model to estimate neural activation by incorporating patient-specific stimulation parameters, lead locations, and geometries. Due to the large interelectrode spacing (10 mm for n=35 and 3.5 mm for n=2 leads), VTAs were characterized by four sphere-like volumes centered at each contact. When comparing stimulation across the cohort in MNI template space, the regions most frequently stimulated across patients (n=22 patients, 37 VTAs) were the lateral amygdala and hippocampus (Fig. 3) with a maximum of 12/37 overlapping VTAs. There was a large amount of variability in VTA location throughout the mesial temporal lobe, extending beyond the mesial temporal structures.
Figure 3. Local regions of stimulation across the cohort.
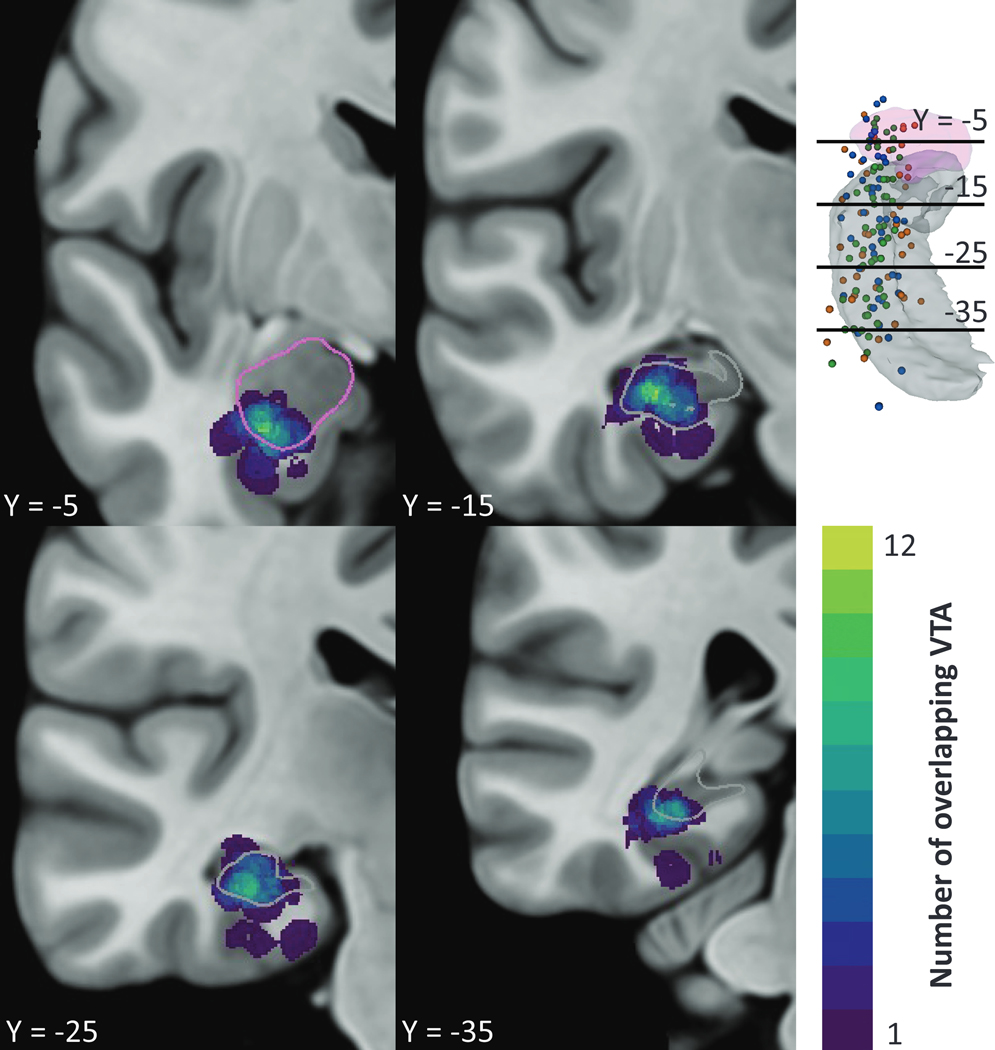
The total number of overlapping VTAs (n=37) at each voxel are shown in a single hemisphere of MNI atlas space. Stimulation was variable across the mesial temporal structures with a maximum overlap of 12 VTAs in the inferior amygdala and medial hippocampus. Four coronal slices are visualized relative to the amygdala in pink and hippocampus in gray in the top right and segmentation outlines in the slice views.
We then created PSMs associating VTA location with seizure reduction (Fig. 4A). We observed interspersed clusters associated with better seizure reduction scores (red) and worse seizure reduction scores (blue). These clusters were spaced around 10 mm apart, the interelectrode distance, and likely appeared due to minimal overlap at a voxel. Although no clear topographical patterns were observed, the PSM showed a trend where stimulation in the amygdala was associated with reduced efficacy.
Figure 4. Local stimulation in the mesial temporal lobe was associated with seizure reduction but not predictive.
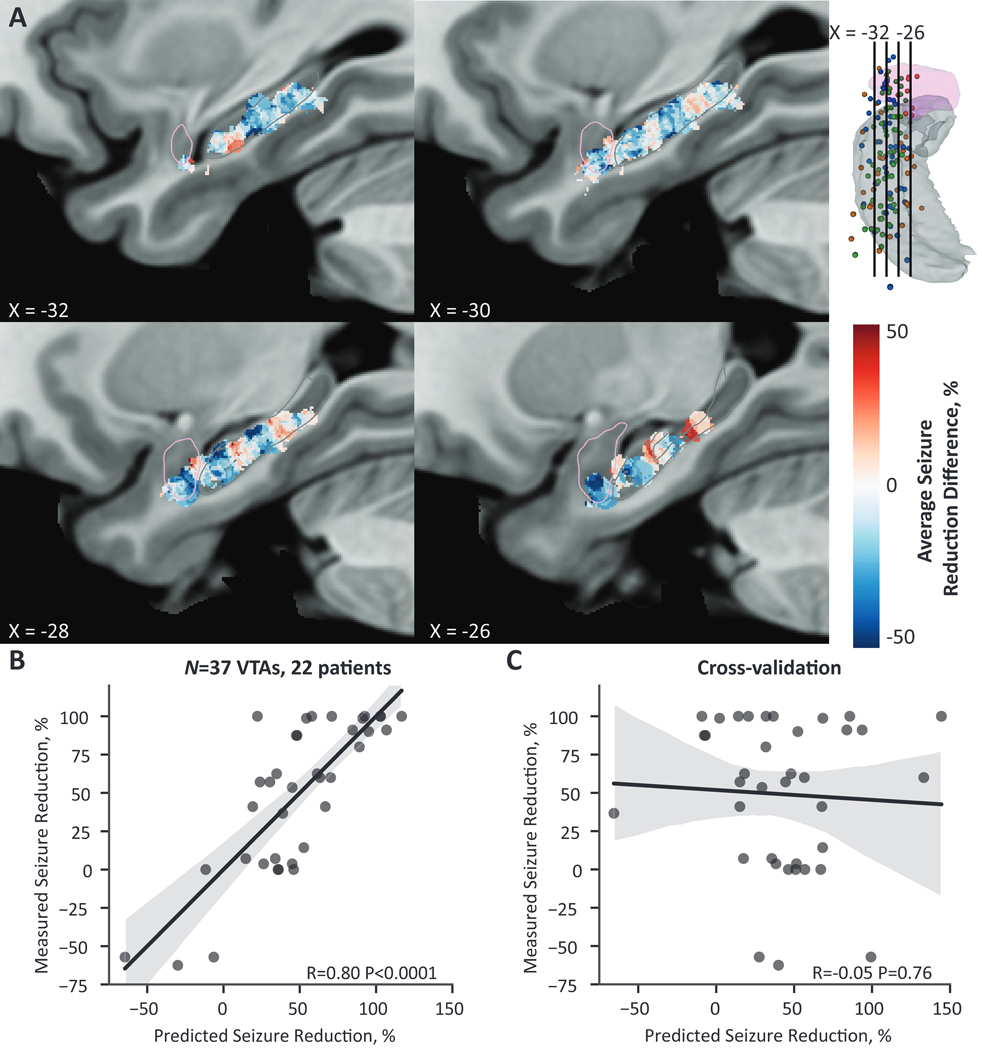
(A) A probabilistic stimulation map of average seizure reduction difference between patients stimulated at that voxel and patients not stimulated at that voxel in a single hemisphere of MNI cohort space. Regions in red correspond to greater seizure reduction if stimulated at that voxel, whereas regions in blue correspond to less seizure reduction if stimulated at that voxel. Clusters of improved (red) and worsening (blue) clinical outcomes are interspersed along the long axis of the hippocampus, with no clear topographic pattern. Overall, regions within the amygdala trended toward worse seizure reduction. PSMs are masked for voxels with greater than two overlapping VTAs. The visualized sagittal slices are shown in the top right relative to the amygdala in pink and hippocampus in gray; segmentation outlines are additionally shown in the slice views. (B) Across the entire cohort, the predicted seizure-reduction score based on VTA overlap with the PSM was significantly correlated with the measured seizure reduction. (C) This relationship was not robust to leave-one-out cross-validation. (B-C) Black lines show the linear regression fit line, and the gray shading represents the 95% confidence interval.
We next asked whether the VTA location was associated with seizure reduction using the linear model based on VTA overlap with the PSM. Across the entire cohort (n=37 VTAs, 22 patients), we found a strong correlation between predicted and measured seizure reduction (R=0.80, P<0.0001) (Fig. 4B). However, the linear model was not robust to cross-validation (R=−0.05, P=0.76) (Fig. 4C).
Structural networks associated with seizure reduction
Normative structural connectivity correlated with seizure reduction
We next examined whether stimulation-dependent connectivity was associated with seizure reduction using normative structural connectivity. To directly compare the normative analysis to the patient-specific connectivity analysis, we first report the results for the subset of patients with DWI (n=26 VTAs, 16 patients). The similarity between a VTA’s normative tract probability map and the ideal map was significantly correlated with seizure reduction across the entire cohort (R=0.46, P=0.02) (Fig. 5B). However, this relationship was not robust to leave-one-out cross-validation (R=−0.16, P=0.44) (Fig. 5C). Maps of the voxelwise regression correlation coefficient of normative connectivity and seizure reduction showed widespread weak positive correlations in cortical and subcortical regions and weak negative correlations in cerebellar and brainstem regions (Fig. 5A). Thus, we were not able to identify specific anatomical regions associated with seizure reduction since correlation maps were uniform within the cortex, cerebellum, and brainstem. We additionally performed the normative analysis across the entire cohort (n=37 VTAs, 22 patients). The connectivity correlation was not significantly correlated to seizure reduction across the entire cohort (R=0.28, P=0.09).
Figure 5. Normative stimulation-dependent connectivity to structural networks are not predictive of seizure reduction.
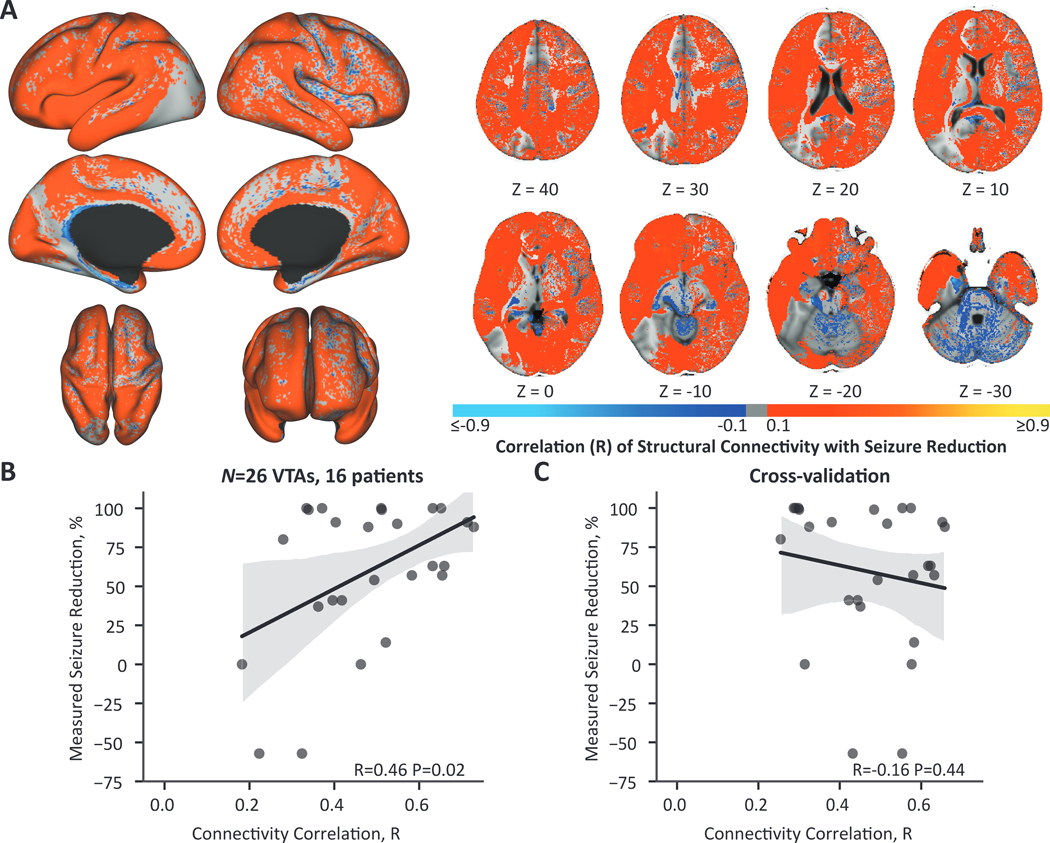
(A) Across patients (N = 16), cortical regions were weakly positively correlated with seizure reduction and cerebellar and brainstem regions were weakly negatively correlated with seizure reduction. The color map shows the correlation coefficient from the voxelwise regression of normative connectivity averaged across 40 HCP subjects and seizure reduction across VTAs (n = 26 VTAs, 16 patients). Regions ipsilateral to stimulation are shown on the left and contralateral regions on the right. (B) The correlation of each VTA’s connectivity map to the ‘ideal’ map was significantly correlated with seizure reduction. (C) This relationship was not robust to leave-one-out cross-validation.
Patient-specific structural connectivity correlated with seizure reduction
The normative analysis may average out patient-specific or disease-specific connectivity patterns associated with the therapeutic response. Therefore, we performed the same connectivity analysis with patient-specific tract probability maps (n=26 VTAs, 16 patients). Maps of the voxelwise regression correlation coefficients are shown in Fig. 6A. The connectivity correlation between the patient-specific tract probability maps and ideal connectivity maps was significantly correlated to seizure reduction across the cohort (R=0.74, P<0.0001) (Fig 6B). Additionally, this model was robust to leave-one-out cross-validation, with a significant correlation between connectivity correlation and seizure reduction (R=0.42, P=0.03) (Fig 6C). Two patients had prior resections years before RNS therapy. Excluding these patients from the network analysis still resulted in significant correlations across the cohort (R=0.81, P<0.0001) and after cross-validation (R=0.47, P=0.03). The top brain regions with stimulation-dependent connectivity associated with seizure reduction are visualized in Fig. 6D. Connectivity to the following regions was positively correlated with seizure reduction: the medial prefrontal regions both ipsilateral and contralateral to stimulation, the ipsilateral anterior cingulate, and the contralateral precuneus. In contrast, negative correlations were observed for connectivity to the ipsilateral lateral inferior temporal regions, the ipsilateral temporal agranular insular cortex (area TI), the ipsilateral amygdala, the ipsilateral thalamus, the ipsilateral lateral prefrontal region, and the contralateral cuneus.
Figure 6. Patient-specific stimulation-dependent connectivity to structural networks is predictive of seizure reduction.
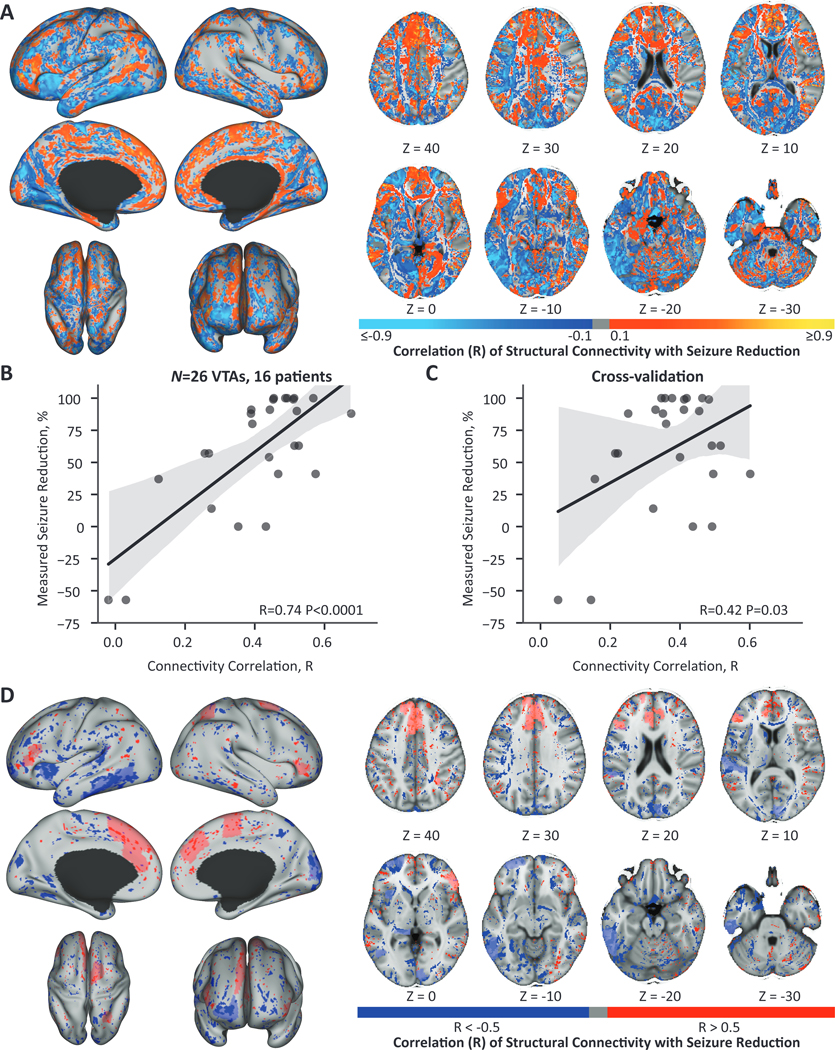
(A) The correlation coefficient from the voxelwise regression of patient-specific connectivity and seizure reduction across VTAs (n=26 VTAs, 16 patients). Regions ipsilateral to stimulation are shown on the left and contralateral regions on the right. (B) The correlation of each VTA’s connectivity map to the ideal map was significantly correlated with seizure reduction. (C) This relationship was robust to leave-one-out cross-validation and resulted in a significant correlation between patient and ideal connectivity and seizure reduction. (D) The ten regions with the greatest percentage of positively correlated voxels (R > 0.5) and the ten regions with the greatest percentage of negatively correlated voxels (R < −0.5) are shown in light red and light blue respectively. The voxels with R > 0.5 are overlaid across the entire brain in dark red and R < −0.5 in dark blue. Connectivity to the ipsilateral and contralateral medial prefrontal areas, the ipsilateral anterior cingulate, and the contralateral precuneus were associated with improved seizure reduction. Connectivity to the ipsilateral lateral inferior temporal regions, the ipsilateral amygdala, ipsilateral thalamus, the ipsilateral lateral prefrontal region, and the contralateral cuneus were associated with worse seizure reduction. Regions ipsilateral to stimulation are shown on the left and contralateral regions on the right. (B-C) Black lines show the linear regression fit line, and the gray shading represents the 95% confidence interval.
Discussion
Our study provides evidence that patient-specific structural connectivity to the VTA is correlated with seizure reduction for mesial temporal RNS. Stimulation-dependent structural networks involving the medial prefrontal areas, the anterior cingulate, and the precuneus may mediate the therapeutic response to RNS. Interestingly, normative connectivity to the VTA was significantly correlated, although less strongly than the patient-specific analysis, but was not robust to leave-one-out cross-validation or useful for identifying specific anatomical regions associated with clinical response. This finding suggests that patient-specific imaging may be necessary to identify associations between RNS therapy and clinical outcomes. Overall, we found the clinical response to RNS was associated with network-level effects based on patient-specific connectivity to the VTA and not the local region of stimulation alone.
Efficacy of RNS for mesial temporal lobe epilepsy
RNS has proven to be an effective adjunctive therapy for refractory focal epilepsy; however, clinical outcomes are variable and patients rarely become seizure-free.2–4 The RNS patient population is heterogeneous, and, to date, no clinical features have explained the variance in clinical outcomes. In accordance with previous work, we found no statistically significant relationship between seizure outcome and clinical features including lead type, age, epilepsy duration, baseline seizure frequency, charge density, or polarity of stimulation.4–8
Although we did not find a statistically significant relationship between charge density and seizure outcomes, we did find a significant correlation between time since implant and charge density (Fig. 2D). This relationship was not surprising, based on the current generalized stimulation programming approach, where most stimulation parameters are held constant (pulse width, burst duration, and frequency) and current density is slowly increased over months to years. We currently lack data-driven approaches to programming stimulation for epilepsy, likely because there is no immediate readout of efficacy during the clinical programming session. Moreover, it may take up to four months to observe the effect of stimulation adjustments.5 There is increasing evidence of a long-term neuromodulatory mechanism of seizure reduction for RNS, further complicating the decision of how frequently stimulation parameters should be adjusted.12,13 A previous study has shown that the efficacy of stimulation parameters may depend on the current seizure risk state; higher charge densities were associated with improved seizure outcomes in both high- and low-risk seizure states, but stimulation frequency depended on the initial seizure risk state.11 Little is known about optimal stimulation strategies for RNS, motivating us to investigate whether stimulation of specific mesial temporal regions or their associated networks was associated with seizure reduction.
Stimulation location in the mesial temporal lobe
To our knowledge, our results are the first to quantify stimulation in the mesial temporal lobe using sophisticated patient-specific models of the VTA. The VTA location, dependent on electrode location and stimulation parameters, was variable throughout and extended beyond the mesial temporal structures across the cohort (Fig. 3). The VTA location was correlated with seizure reduction in our cohort but did not generalize to out-of-sample data; thus, its predictive power is limited. These results are consistent with previous studies on deep brain stimulation of the hippocampus that found stimulation location was not significantly correlated with seizure reduction.6,16 The current study improves on these previous studies by quantifying stimulation with sophisticated patient-specific models of the VTA that incorporate more detail than using contact location6 or more simplified models of the VTA (i.e., a sphere with a single radius).16
Networks associated with seizure reduction
Structural and functional changes to distributed brain networks have been associated with mesial temporal lobe epilepsy.61–63 We therefore hypothesized that the networks modulated with RNS were associated with seizure reduction rather than stimulation location alone. We found that patient-specific connectivity to the VTA was correlated with seizure reduction (Fig. 6), but normative connectivity was not (Fig. 5). Our results suggest that seizure reduction may be mediated by stimulation of regions connected to the medial prefrontal cortex, ipsilateral anterior cingulate, and contralateral precuneus (Fig. 6D).
These results are the first to report structural networks correlated with seizure reduction for RNS in the mesial temporal lobe. A previous study investigating anterior nucleus of the thalamus (ANT) stimulation-dependent functional connectivity identified increased connectivity to the default mode network in responders compared to non-responders.64 Specifically, they found a positive correlation between responders and increased connectivity to the posterior cingulate, medial prefrontal cortex, inferior parietal lobule, and precuneus. The top positively correlated regions in our study, including the medial prefrontal regions, cingulate cortex, and the precuneus, overlap largely with those in the ANT study. Moreover, structural and functional network involvement of these regions was predictive of seizure outcome postsurgery in temporal lobe epilepsy.65,66 These results may provide support for a common therapeutic mechanism between hippocampal and ANT stimulation for refractory focal epilepsy.
Based on this evidence, we propose that modulation of hippocampal regions connected to medial prefrontal regions, cingulate cortex, and the precuneus may underpin the therapeutic mechanism of RNS and could be targeted in future studies. Structural and functional connections of the hippocampus may help us further identify an optimal target for hippocampal RNS based on hippocampal regions connected to the networks positively correlated with seizure reduction. A functional connectivity study of the hippocampus identified two main resting-state networks associated with the anterior and posterior region of the hippocampus.67 The posterior network was associated with the default mode network and aligns with the positively correlated regions identified in the current study. Interestingly, regions in the second network, associated with the anterior hippocampus, correspond with somatomotor networks and the negatively correlated regions in the present study, including the amygdala, lateral temporal regions, and the cuneus. This finding suggests that the posterior hippocampal RNS contacts may be responsible for modulating the default mode network and the anterior contacts may be associated with modulation of the negatively correlated somatomotor network. This may also explain why the VTA voxels in the amygdala trended toward reduced benefit. Further investigation of anterior versus posterior hippocampal RNS would be necessary to differentiate these effects. In addition, RNS of temporal stem white matter has been an effective therapy for temporal lobe epilepsy and could be further explored as a network target for mesial temporal RNS.68
Baseline structural changes are known to be present in mesial temporal lobe epilepsy, including connectivity increases to the ipsilateral temporal lobe and decreases to the frontal lobes.23 Incorporating these baseline changes by utilizing patient-specific DWI was necessary to identify connectivity to specific regions associated with clinical outcomes in this study. This finding has important implications for future studies examining the networks associated with the therapeutic response to stimulation, and we recommend acquiring patient-specific DWI. Baseline connectivity, before RNS, may also be associated with clinical outcomes following RNS. Baseline connectivity has previously been associated with epilepsy severity and postsurgical outcomes. For example, increased hippocampal connectivity may indicate more refractory epilepsy,69 and connectivity distance features to the hippocampus were predictive of postsurgical seizure outcome.23 However, the relationship between baseline connectivity and RNS outcomes is currently unknown.
Methodological considerations
These results should be interpreted with caution because this is a retrospective study with a sample size of 22 patients, and only a subset of our patients (n=16) had whole-brain DWI. Additionally, we analyzed the outcome and stimulation setting at the latest clinical follow-up to maximize the time of stimulation analyzed for this retrospective dataset. A prospective study of a larger cohort at multiple time points will be needed to confirm the networks identified in the present study. However, this study is a first step to characterizing stimulation in the mesial temporal lobe and identifying structural networks that may underlie the therapeutic mechanism of RNS for mesial temporal lobe epilepsy. Moreover, we implemented a cross-validation approach suitable for small sample sizes, leave-one-out, to determine if our model was robust to out-of-sample data. Cross-validation with data from another center in a future study would further ensure the generalizability of our model.
Another limitation of our study is the uncertainty of patient-reported outcomes. Seizure diaries are currently the gold standard for outcomes in epilepsy studies; however, this approach has many inherent limitations, such as underreporting due to postictal amnesia, sleep-associated seizures, and noncompliance.70–72 We excluded patients with concurrent psychogenic non-epileptic seizures to maintain accurate clinical outcomes. The future of continuous closed-loop stimulation devices shows promise for electrographic counts of seizures that do not rely on patient reporting.73
An additional limitation of this cohort is the redundancy in stimulation programming across patients. For our probabilistic approach, large variance in contact position and seizure reduction was necessary. However, the seizure reduction score was mapped to the entire VTA (i.e., all four volumes for a single depth lead and eight volumes for two depth leads). This mapping may average out the regional effect for voxels that may not have been associated with the therapeutic response. Additionally, patients with worse outcomes were more likely to be stimulated with a higher current density, based on recommended programming strategies. This method of programming would result in a larger VTA for non-responders and may mask regional effects when VTAs of non-responders overlap with responder VTA. Additionally, the clusters of variable clinical outcomes (Fig. 4A) may be the result of low sampling, as the maximum VTA overlap was 12, and the clusters were generally spaced 10 mm apart (i.e., the interelectrode spacing). Future studies with larger cohorts and more variable stimulation settings (e.g., fewer active contacts, different frequencies, pulse widths, or burst durations) would improve VTA sampling and may identify a statistically significant region associated with seizure reduction.
Furthermore, this study investigated only the local and network effects of RNS from depth electrodes implanted in the mesial temporal lobe and not the effects of strip electrodes on the surface of the temporal lobe. Identifying the lead or interaction of leads that are responsible for the therapeutic effect remains a significant challenge for RNS research. For patients implanted with both a depth electrode and a strip electrode, stimulation from the strip electrode may be responsible for aspects of the therapeutic effect. However, we found no significant difference in clinical outcomes for patients with bilateral depth leads versus those with a depth lead and a strip lead. We determined the lead (depth or strip) where the majority of detections occurred for the unilateral patients. For the six patients included in the patient-specific connectivity analysis, four had a majority of detections on the depth lead. This suggests that, even if the strip lead plays a role, the depth lead is at least equally involved in network activation associated with seizure reduction. Moreover, all VTAs were treated independently for patients with bilateral hippocampal stimulation. The network analysis was advantageous to the VTA analysis because it no longer required overlapping sampling of VTAs. Instead, connectivity values were sampled across the entire brain. Our network model accounted for only some of the variance in seizure reduction, and a multitude of other factors and interaction of factors likely contribute to seizure reduction over time such as detection settings, stimulation settings, brain-state, neuroplasticity, and epilepsy subtype.
Implications for future improvements to RNS
We report novel patient-specific networks associated with seizure reduction for patients with mesial temporal lobe epilepsy following RNS. Future models could utilize our ‘ideal’ connectivity map to optimize lead placement or stimulation parameters that maximize stimulation of the positively correlated networks. A framework that currently exists to model distant cortical activation based on white matter tracts for RNS74 could be combined with deep brain stimulation optimization algorithms.41,75 Optimizing stimulation to specific networks may provide a data-driven framework for patient-specific stimulation programming that could be advantageous to the current general programming approach. This optimization approach would potentially benefit the quarter of patients who do not respond to RNS therapy and may decrease the time to response by reaching effective stimulation parameters sooner.4
We additionally identified stimulation-dependent connectivity to specific brain regions we posit may be associated with the therapeutic mechanism of stimulation for epilepsy. These regions are part of the default mode network (e.g., medial prefrontal cortex, cingulate cortex, and precuneus) and have additionally been associated with the therapeutic mechanism for ANT stimulation for epilepsy.64 Physiological measures of network modulation due to RNS are necessary to confirm that functional changes are present in the structural networks and connected brain regions identified here.76 Next generation epilepsy systems are interfacing with both the ANT and the hippocampus.73,77,78 Measuring evoked potentials from the ANT to the hippocampus could help identify specific regions of the hippocampus (e.g., anterior or posterior contacts) that modulate the default mode network and tailor stimulation parameters to modulate the default mode network. The methods laid out in this study could additionally be used to investigate the networks associated with other targets for deep brain stimulation for epilepsy such as ANT, centromedian thalamus, and cerebellum.79–82
Beyond identifying an optimal stimulation location, exploring stimulation parameters (e.g., frequency, pulse width, burst duration, and current density) is another challenge toward improving RNS therapy. Until a biomarker is identified that provides an immediate readout of stimulation efficacy in a clinical visit, stimulation parameters could be explored through evoked potentials or fMRI studies. Prospective fMRI acquired in Parkinson’s disease patients receiving deep brain stimulation was used to predict ‘optimal’ deep brain stimulation parameters that preferentially engaged the motor circuit.83 Our results suggest that increasing charge density does not correspond to improved seizure reduction, and contemporary practice shows a more gradual increase of the current density compared to early clinical trials data.5 We suggest that exploring changes to stimulation parameters other than charge density may better inform optimal stimulation in the future.
Conclusion
Patient-specific stimulation-dependent structural connectivity was correlated with seizure reduction following RNS. These results shed light on the networks that may mediate the therapeutic response to RNS and highlight the importance of acquiring patient-specific imaging to rigorously study the effects of neurostimulation for epilepsy. Identification of these structural networks represents a step toward a better understanding of the mechanism of action of RNS in the mesial temporal lobe. A data-driven approach could be used to explore lead locations and stimulation parameters that maximize activation of these regions in order to improve seizure reduction for patients with mesial temporal lobe epilepsy.
Supplementary Material
Key Points:
Patient-specific connectivity to the volume of tissue activated is correlated with seizure reduction after mesial temporal responsive neurostimulation.
The local region of stimulation and normative connectivity to the volume of tissue activated are not predictive of seizure reduction.
Acquisition of patient-specific diffusion-weighted imaging is suggested for future studies associating connectivity and clinical outcomes of neuromodulation for epilepsy.
Acknowledgements
This work was supported by NSF Graduate Research Fellowship 1747505 (CMC), NIH NINDS F32 NS 114322 (DNA), NIH NINDS K23 NS 114178 (JDR), NIH P41 GM103545 (CMC and CRB).
Abbreviations:
- ANT
anterior nucleus of thalamus
- CSF
cerebrospinal fluid
- DWI
diffusion-weighted imaging
- FSL
FMRIB Software Library
- HCP
Human Connectome Project
- MNI
Montreal Neurological Institute
- PSM
probabilistic stimulation map
- RNS
responsive neurostimulation
- TLE
temporal lobe epilepsy
- VTA
volume of tissue activated
Footnotes
Conflicts of Interest
AMA has served as a consultant for NeuroPace. JDR has served as a consultant for Medtronic, NeuroPace, and Corlieve Therapeutics. CRB has recently served as a consultant for NeuraModix and Abbott and holds intellectual property related to neuromodulation therapy. The remaining authors have no conflicts of interest.
References
- 1.Morrell MJ. Responsive cortical stimulation for the treatment of medically intractable partial epilepsy. Neurology. 2011. doi: 10.1212/WNL.0b013e3182302056 [DOI] [PubMed] [Google Scholar]
- 2.Heck CN, King-Stephens D, Massey AD, et al. Two-year seizure reduction in adults with medically intractable partial onset epilepsy treated with responsive neurostimulation: Final results of the RNS System Pivotal trial. Epilepsia. 2014. doi: 10.1111/epi.12534 [DOI] [PMC free article] [PubMed] [Google Scholar]
- 3.Bergey GK, Morrell MJ, Mizrahi EM, et al. Long-term treatment with responsive brain stimulation in adults with refractory partial seizures. Neurology. 2015. doi: 10.1212/WNL.0000000000001280 [DOI] [PMC free article] [PubMed] [Google Scholar]
- 4.Nair DR, Laxer KD, Weber PB, et al. Nine-year prospective efficacy and safety of brain-responsive neurostimulation for focal epilepsy. Neurology. July 2020. doi: 10.1212/WNL.0000000000010154 [DOI] [PMC free article] [PubMed] [Google Scholar]
- 5.Razavi B, Rao VR, Lin C, et al. Real-world experience with direct brain-responsive neurostimulation for focal onset seizures. Epilepsia. 2020;61(8):1749–1757. doi: 10.1111/epi.16593 [DOI] [PMC free article] [PubMed] [Google Scholar]
- 6.Geller EB, Skarpaas TL, Gross RE, et al. Brain-responsive neurostimulation in patients with medically intractable mesial temporal lobe epilepsy. Epilepsia. 2017. doi: 10.1111/epi.13740 [DOI] [PubMed] [Google Scholar]
- 7.Jobst BC, Kapur R, Barkley GL, et al. Brain-responsive neurostimulation in patients with medically intractable seizures arising from eloquent and other neocortical areas. Epilepsia. 2017. doi: 10.1111/epi.13739 [DOI] [PubMed] [Google Scholar]
- 8.Ma BB, Fields MC, Knowlton RC, et al. Responsive neurostimulation for regional neocortical epilepsy. Epilepsia. 2019;n/a(n/a). doi: 10.1111/epi.16409 [DOI] [PubMed] [Google Scholar]
- 9.RNS® System Programming Manual.; 2021. https://www.neuropace.com/wp-content/uploads/2021/02/neuropace-rns-system-programming-manual.pdf.
- 10.Scheid BH, Bernabei JM, Khambhati AN, et al. Intracranial electroencephalographic biomarker predicts effective responsive neurostimulation for epilepsy prior to treatment. Epilepsia. January 2022. doi: 10.1111/epi.17163 [DOI] [PMC free article] [PubMed] [Google Scholar]
- 11.Chiang S, Khambhati AN, Wang ET, Vannucci M, Chang EF, Rao VR. Evidence of state-dependence in the effectiveness of responsive neurostimulation for seizure modulation. Brain Stimul. February 2021. doi: 10.1016/j.brs.2021.01.023 [DOI] [PMC free article] [PubMed] [Google Scholar]
- 12.Khambhati AN, Shafi A, Rao VR, Chang EF. Long-term brain network reorganization predicts responsive neurostimulation outcomes for focal epilepsy. Sci Transl Med. 2021;13(608). doi: 10.1126/scitranslmed.abf6588 [DOI] [PubMed] [Google Scholar]
- 13.Kokkinos V, Sisterson ND, Wozny TA, Richardson RM. Association of Closed-Loop Brain Stimulation Neurophysiological Features with Seizure Control among Patients with Focal Epilepsy. JAMA Neurol. 2019. doi: 10.1001/jamaneurol.2019.0658 [DOI] [PMC free article] [PubMed] [Google Scholar]
- 14.Sander JWAS Hart YM, Shorvon SD Johnson AL. MEDICAL SCIENCE. National General Practice Study of Epilepsy: newly diagnosed epileptic seizures in a general population. Lancet. 1990. doi: 10.1016/0140-6736(90)92959-L [DOI] [PubMed] [Google Scholar]
- 15.Téllez-Zenteno JF, Hernández-Ronquillo L. A Review of the Epidemiology of Temporal Lobe Epilepsy. Epilepsy Res Treat. 2012. doi: 10.1155/2012/630853 [DOI] [PMC free article] [PubMed] [Google Scholar]
- 16.Bondallaz P, Boëx C, Rossetti AO, et al. Electrode location and clinical outcome in hippocampal electrical stimulation for mesial temporal lobe epilepsy. Seizure. 2013;22(5):390–395. doi: 10.1016/J.SEIZURE.2013.02.007 [DOI] [PubMed] [Google Scholar]
- 17.Wozny C Comment on “On the Origin of Interictal Activity in Human Temporal Lobe Epilepsy in Vitro.” Science (80- ). 2003. doi: 10.1126/science.1084237 [DOI] [PubMed] [Google Scholar]
- 18.Jo HJ, Kenny-Jung DL, Balzekas I, et al. Nuclei-specific thalamic connectivity predicts seizure frequency in drug-resistant medial temporal lobe epilepsy. NeuroImage Clin. 2019. doi: 10.1016/j.nicl.2019.101671 [DOI] [PMC free article] [PubMed] [Google Scholar]
- 19.Travers RF. Limbic epilepsy. J R Soc Med. 1991. doi: 10.1177/014107689108400804 [DOI] [PMC free article] [PubMed] [Google Scholar]
- 20.Blumenfeld H Impaired consciousness in epilepsy. Lancet Neurol. 2012. doi: 10.1016/S1474-4422(12)70188-6 [DOI] [PMC free article] [PubMed] [Google Scholar]
- 21.Jefferys JGR, Jiruska P, de Curtis M, Avoli M. Limbic Network Synchronization and Temporal Lobe Epilepsy. In: Jasper’s Basic Mechanisms of the Epilepsies.; 2013. doi: 10.1093/med/9780199746545.003.0014 [DOI] [Google Scholar]
- 22.Bernhardt BC, Bernasconi N, Kim H, Bernasconi A. Mapping thalamocortical network pathology in temporal lobe epilepsy. Neurology. 2012;78(2):129–136. doi: 10.1212/WNL.0b013e31823efd0d [DOI] [PubMed] [Google Scholar]
- 23.Larivière S, Weng Y, Vos de Wael R, et al. Functional connectome contractions in temporal lobe epilepsy: Microstructural underpinnings and predictors of surgical outcome. Epilepsia. 2020;61(6):1221–1233. doi: 10.1111/epi.16540 [DOI] [PubMed] [Google Scholar]
- 24.McDonald CR, Hagler DJJ, Ahmadi ME, et al. Regional neocortical thinning in mesial temporal lobe epilepsy. Epilepsia. 2008;49(5):794–803. doi: 10.1111/j.1528-1167.2008.01539.x [DOI] [PubMed] [Google Scholar]
- 25.Liu M, Bernhardt BC, Hong S-J, Caldairou B, Bernasconi A, Bernasconi N. The superficial white matter in temporal lobe epilepsy: a key link between structural and functional network disruptions. Brain. 2016;139(Pt 9):2431–2440. doi: 10.1093/brain/aww167 [DOI] [PMC free article] [PubMed] [Google Scholar]
- 26.Bernhardt BC, Bernasconi A, Liu M, et al. The spectrum of structural and functional imaging abnormalities in temporal lobe epilepsy. Ann Neurol. 2016;80(1):142–153. doi: 10.1002/ana.24691 [DOI] [PubMed] [Google Scholar]
- 27.Morgan VL, Johnson GW, Cai LY, et al. MRI network progression in mesial temporal lobe epilepsy related to healthy brain architecture. Netw Neurosci (Cambridge, Mass). 2021;5(2):434–450. doi: 10.1162/netn_a_00184 [DOI] [PMC free article] [PubMed] [Google Scholar]
- 28.Rossi MA, Stebbins G, Murphy C, et al. Predicting white matter targets for direct neurostimulation therapy. Epilepsy Res. 2010. doi: 10.1016/j.eplepsyres.2010.07.010 [DOI] [PubMed] [Google Scholar]
- 29.Davis TS, Caston RM, Philip B, et al. LeGUI: A Fast and Accurate Graphical User Interface for Automated Detection and Anatomical Localization of Intracranial Electrodes. Front Neurosci. 2021;15:1693. https://www.frontiersin.org/article/10.3389/fnins.2021.769872. [DOI] [PMC free article] [PubMed] [Google Scholar]
- 30.Thielscher A, Antunes A, Saturnino GB. Field modeling for transcranial magnetic stimulation: A useful tool to understand the physiological effects of TMS? In: Proceedings of the Annual International Conference of the IEEE Engineering in Medicine and Biology Society, EMBS.; 2015. doi: 10.1109/EMBC.2015.7318340 [DOI] [PubMed] [Google Scholar]
- 31.Avants BB, Epstein CL, Grossman M, Gee JC. Symmetric diffeomorphic image registration with cross-correlation: Evaluating automated labeling of elderly and neurodegenerative brain. Med Image Anal. 2008. doi: 10.1016/j.media.2007.06.004 [DOI] [PMC free article] [PubMed] [Google Scholar]
- 32.Jenkinson M, Beckmann CF, Behrens TEJ, Woolrich MW, Smith SM. FSL. Neuroimage. 2012;62(2):782–790. doi: 10.1016/j.neuroimage.2011.09.015 [DOI] [PubMed] [Google Scholar]
- 33.Chen DQ, Dell’Acqua F, Rokem A, et al. Diffusion Weighted Image Co-registration: Investigation of Best Practices. bioRxiv. January 2019:864108. doi: 10.1101/864108 [DOI] [Google Scholar]
- 34.Dell’Acqua F, Lacerda LM, Catani M, Simmons A. Anisotropic Power Maps : A diffusion contrast to reveal low anisotropy tissues from HARDI data. In: Proc Intl Soc Mag Reson Med.; 2014:29960–29967. [Google Scholar]
- 35.Butson CR, Cooper SE, Henderson JM, McIntyre CC. Patient-specific analysis of the volume of tissue activated during deep brain stimulation. Neuroimage. 2007;34(2):661–670. doi: 10.1016/j.neuroimage.2006.09.034 [DOI] [PMC free article] [PubMed] [Google Scholar]
- 36.Howell B, McIntyre CC. Analyzing the tradeoff between electrical complexity and accuracy in patient-specific computational models of deep brain stimulation. J Neural Eng. 2016. doi: 10.1088/1741-2560/13/3/036023 [DOI] [PMC free article] [PubMed] [Google Scholar]
- 37.Malaga KA, Costello JT, Chou KL, Patil PG. Atlas-independent, N-of-1 tissue activation modeling to map optimal regions of subthalamic deep brain stimulation for Parkinson disease. NeuroImage Clin. 2021;29:102518. doi: 10.1016/j.nicl.2020.102518 [DOI] [PMC free article] [PubMed] [Google Scholar]
- 38.Si H TetGen, a Delaunay-Based Quality Tetrahedral Mesh Generator. ACM Trans Math Softw. 2015. doi: 10.1145/2629697 [DOI] [Google Scholar]
- 39.Akhtari M, Bryant HC, Mamelak AN, et al. Conductivities of three-layer live human skull. Brain Topogr. 2002;14(3):151–167. doi: 10.1023/a:1014590923185 [DOI] [PubMed] [Google Scholar]
- 40.Baumann SB, Wozny DR, Kelly SK, Meno FM. The electrical conductivity of human cerebrospinal fluid at body temperature. IEEE Trans Biomed Eng. 1997. doi: 10.1109/10.554770 [DOI] [PubMed] [Google Scholar]
- 41.Anderson DN, Osting B, Vorwerk J, Dorval AD, Butson CR. Optimized programming algorithm for cylindrical and directional deep brain stimulation electrodes. J Neural Eng. 2018. doi: 10.1088/1741-2552/aaa14b [DOI] [PubMed] [Google Scholar]
- 42.Wei XF, Grill WM. Current density distributions, field distributions and impedance analysis of segmented deep brain stimulation electrodes. J Neural Eng. 2005. doi: 10.1088/1741-2560/2/4/010 [DOI] [PubMed] [Google Scholar]
- 43.Zhang TC, Grill WM. Modeling deep brain stimulation: Point source approximation versus realistic representation of the electrode. J Neural Eng. 2010;7(6). doi: 10.1088/1741-2560/7/6/066009 [DOI] [PMC free article] [PubMed] [Google Scholar]
- 44.Rattay F Analysis of Models for External Stimulation of Axons. IEEE Trans Biomed Eng. 1986;BME-33(10):974–977. doi: 10.1109/TBME.1986.325670 [DOI] [PubMed] [Google Scholar]
- 45.Duffley G, Anderson DN, Vorwerk J, Dorval AD, Butson CR. Evaluation of methodologies for computing the deep brain stimulation volume of tissue activated. J Neural Eng. 2019. doi: 10.1088/1741-2552/ab3c95 [DOI] [PMC free article] [PubMed] [Google Scholar]
- 46.Anderson DN, Duffley G, Vorwerk J, Dorval AD, Butson CR. Anodic stimulation misunderstood: Preferential activation of fiber orientations with anodic waveforms in deep brain stimulation. J Neural Eng. 2019. doi: 10.1088/1741-2552/aae590 [DOI] [PMC free article] [PubMed] [Google Scholar]
- 47.Butson CR, Cooper SE, Henderson JM, Wolgamuth B, McIntyre CC. Probabilistic analysis of activation volumes generated during deep brain stimulation. Neuroimage. 2011. doi: 10.1016/j.neuroimage.2010.10.059 [DOI] [PMC free article] [PubMed] [Google Scholar]
- 48.Johnson KA, Fletcher PT, Servello D, et al. Image-based analysis and long-term clinical outcomes of deep brain stimulation for Tourette syndrome: A multisite study. J Neurol Neurosurg Psychiatry. 2019. doi: 10.1136/jnnp-2019-320379 [DOI] [PMC free article] [PubMed] [Google Scholar]
- 49.Cooper SE, Driesslein KG, Noecker AM, McIntyre CC, Machado AM, Butson CR. Anatomical targets associated with abrupt versus gradual washout of subthalamic deep brain stimulation effects on bradykinesia. PLoS One. 2014;9(8):e99663. doi: 10.1371/journal.pone.0099663 [DOI] [PMC free article] [PubMed] [Google Scholar]
- 50.Reich MM, Horn A, Lange F, et al. Probabilistic mapping of the antidystonic effect of pallidal neurostimulation: a multicentre imaging study. Brain. 2019;142(5):1386–1398. doi: 10.1093/brain/awz046 [DOI] [PubMed] [Google Scholar]
- 51.Wang Q, Akram H, Muthuraman M, et al. Normative vs. patient-specific brain connectivity in deep brain stimulation. Neuroimage. 2021;224:117307. doi: 10.1016/j.neuroimage.2020.117307 [DOI] [PubMed] [Google Scholar]
- 52.Horn A, Reich M, Vorwerk J, et al. Connectivity Predicts deep brain stimulation outcome in Parkinson disease. Ann Neurol. 2017. doi: 10.1002/ana.24974 [DOI] [PMC free article] [PubMed] [Google Scholar]
- 53.Johnson KA, Duffley G, Anderson DN, et al. Structural connectivity predicts clinical outcomes of deep brain stimulation for Tourette syndrome. Brain. 2020. doi: 10.1093/brain/awaa188 [DOI] [PMC free article] [PubMed] [Google Scholar]
- 54.Baldermann JC, Melzer C, Zapf A, et al. Connectivity Profile Predictive of Effective Deep Brain Stimulation in Obsessive-Compulsive Disorder. Biol Psychiatry. 2019. doi: 10.1016/j.biopsych.2018.12.019 [DOI] [PubMed] [Google Scholar]
- 55.Al-Fatly B, Ewert S, Kübler D, Kroneberg D, Horn A, Kühn AA. Connectivity profile of thalamic deep brain stimulation to effectively treat essential tremor. Brain. 2019;142(10):3086–3098. doi: 10.1093/brain/awz236 [DOI] [PubMed] [Google Scholar]
- 56.Van Essen DC, Smith SM, Barch DM, Behrens TEJ, Yacoub E, Ugurbil K. The WU-Minn Human Connectome Project: an overview. Neuroimage. 2013;80:62–79. doi: 10.1016/j.neuroimage.2013.05.041 [DOI] [PMC free article] [PubMed] [Google Scholar]
- 57.Riva-Posse P, Choi KS, Holtzheimer PE, et al. Defining critical white matter pathways mediating successful subcallosal cingulate deep brain stimulation for treatment-resistant depression. Biol Psychiatry. 2014;76(12):963–969. doi: 10.1016/j.biopsych.2014.03.029 [DOI] [PMC free article] [PubMed] [Google Scholar]
- 58.Cohen J Statistical Power Analysis for the Behavioral Sciences. 2nd ed.; 1988. doi: 10.4324/9780203771587 [DOI]
- 59.Fan L, Li H, Zhuo J, et al. The Human Brainnetome Atlas: A New Brain Atlas Based on Connectional Architecture. Cereb Cortex. 2016;26(8):3508–3526. doi: 10.1093/cercor/bhw157 [DOI] [PMC free article] [PubMed] [Google Scholar]
- 60.Klein A, Tourville J. 101 labeled brain images and a consistent human cortical labeling protocol. Front Neurosci. 2012;6:171. doi: 10.3389/fnins.2012.00171 [DOI] [PMC free article] [PubMed] [Google Scholar]
- 61.Tavakol S, Royer J, Lowe AJ, et al. Neuroimaging and connectomics of drug-resistant epilepsy at multiple scales: From focal lesions to macroscale networks. Epilepsia. 2019;60(4):593–604. doi: 10.1111/epi.14688 [DOI] [PMC free article] [PubMed] [Google Scholar]
- 62.Gleichgerrcht E, Kocher M, Bonilha L. Connectomics and graph theory analyses: Novel insights into network abnormalities in epilepsy. Epilepsia. 2015;56(11):1660–1668. doi: 10.1111/epi.13133 [DOI] [PubMed] [Google Scholar]
- 63.Jo HJ, Kenney-Jung DL, Balzekas I, et al. Relationship between seizure frequency and functional abnormalities in limbic network of medial temporal lobe epilepsy. Front Neurol. 2019. doi: 10.3389/fneur.2019.00488 [DOI] [PMC free article] [PubMed] [Google Scholar]
- 64.Middlebrooks EH, Grewal SS, Stead M, Lundstrom BN, Worrell GA, Van Gompel JJ. Differences in functional connectivity profiles as a predictor of response to anterior thalamic nucleus deep brain stimulation for epilepsy: a hypothesis for the mechanism of action and a potential biomarker for outcomes. Neurosurg Focus. 2018. doi: 10.3171/2018.5.focus18151 [DOI] [PubMed] [Google Scholar]
- 65.Morgan VL, Englot DJ, Rogers BP, et al. Magnetic resonance imaging connectivity for the prediction of seizure outcome in temporal lobe epilepsy. Epilepsia. 2017;58(7):1251–1260. doi: 10.1111/epi.13762 [DOI] [PMC free article] [PubMed] [Google Scholar]
- 66.Morgan VL, Rogers BP, González HFJ, Goodale SE, Englot DJ. Characterization of postsurgical functional connectivity changes in temporal lobe epilepsy. J Neurosurg. June 2019:1–11. doi: 10.3171/2019.3.JNS19350 [DOI] [PMC free article] [PubMed] [Google Scholar]
- 67.Ezama L, Hernández-Cabrera JA, Seoane S, Pereda E, Janssen N. Functional connectivity of the hippocampus and its subfields in resting-state networks. Eur J Neurosci. 2021;53(10):3378–3393. doi: 10.1111/ejn.15213 [DOI] [PMC free article] [PubMed] [Google Scholar]
- 68.Nunna RS, Borghei A, Brahimaj BC, et al. Responsive Neurostimulation of the Mesial Temporal White Matter in Bilateral Temporal Lobe Epilepsy. Neurosurgery. 2021;88(2):261–267. doi: 10.1093/neuros/nyaa381 [DOI] [PubMed] [Google Scholar]
- 69.Bharath RD, Sinha S, Panda R, et al. Seizure Frequency Can Alter Brain Connectivity: Evidence from Resting-State fMRI. AJNR Am J Neuroradiol. 2015;36(10):1890–1898. doi: 10.3174/ajnr.A4373 [DOI] [PMC free article] [PubMed] [Google Scholar]
- 70.Quigg M, Skarpaas TL, Spencer DC, Fountain NB, Jarosiewicz B, Morrell MJ. Electrocorticographic events from long-term ambulatory brain recordings can potentially supplement seizure diaries. Epilepsy Res. 2020;161:106302. doi: 10.1016/j.eplepsyres.2020.106302 [DOI] [PubMed] [Google Scholar]
- 71.Hoppe C, Poepel A, Elger CE. Epilepsy: Accuracy of patient seizure counts. Arch Neurol. 2007. doi: 10.1001/archneur.64.11.1595 [DOI] [PubMed] [Google Scholar]
- 72.Kerling F, Mueller S, Pauli E, Stefan H. When do patients forget their seizures? An electroclinical study. Epilepsy Behav. 2006;9(2):281–285. doi: 10.1016/j.yebeh.2006.05.010 [DOI] [PubMed] [Google Scholar]
- 73.Gregg NM, Marks VS, Sladky V, et al. Anterior nucleus of the thalamus seizure detection in ambulatory humans. Epilepsia. August 2021. doi: 10.1111/epi.17047 [DOI] [PMC free article] [PubMed] [Google Scholar]
- 74.Cendejas Zaragoza L, Byrne RW, Rossi MA. Pre-implant modeling of depth lead placement in white matter for maximizing the extent of cortical activation during direct neurostimulation therapy. Neurol Res. 2017. doi: 10.1080/01616412.2016.1266429 [DOI] [PubMed] [Google Scholar]
- 75.Peña E, Zhang S, Deyo S, Xiao Y, Johnson MD. Particle swarm optimization for programming deep brain stimulation arrays. J Neural Eng. 2017;14(1):16014. doi: 10.1088/1741-2552/aa52d1 [DOI] [PMC free article] [PubMed] [Google Scholar]
- 76.Adkinson JA, Tsolaki E, Sheth SA, et al. Imaging versus electrographic connectivity in human mood-related fronto-temporal networks. Brain Stimul. 2022;15(3):554–565. doi: 10.1016/j.brs.2022.03.002 [DOI] [PMC free article] [PubMed] [Google Scholar]
- 77.Wang YC, Kremen V, Brinkmann BH, et al. Probing circuit of Papez with stimulation of anterior nucleus of the thalamus and hippocampal evoked potentials. Epilepsy Res. 2020;159(November 2019):106248. doi: 10.1016/j.eplepsyres.2019.106248 [DOI] [PubMed] [Google Scholar]
- 78.Silva AB, Khambhati AN, Speidel BA, Chang EF, Rao VR. Effects of anterior thalamic nuclei stimulation on hippocampal activity: Chronic recording in a patient with drug-resistant focal epilepsy. Epilepsy Behav Reports. 2021;16:100467. doi: 10.1016/j.ebr.2021.100467 [DOI] [PMC free article] [PubMed] [Google Scholar]
- 79.Fisher R, Salanova V, Witt T, et al. Electrical stimulation of the anterior nucleus of thalamus for treatment of refractory epilepsy. Epilepsia. 2010;51(5):899–908. doi: 10.1111/j.1528-1167.2010.02536.x [DOI] [PubMed] [Google Scholar]
- 80.Velasco F, Velasco M, Jiménez F, et al. Predictors in the treatment of difficult-to-control seizures by electrical stimulation of the centromedian thalamic nucleus. Neurosurgery. 2000;47(2):295. doi: 10.1097/00006123-200008000-00007 [DOI] [PubMed] [Google Scholar]
- 81.Cooper IS, Amin I, Riklan M, Waltz JM, Poon TP. Chronic cerebellar stimulation in epilepsy. Clinical and anatomical studies. Arch Neurol. 1976;33(8):559–570. doi: 10.1001/archneur.1976.00500080037006 [DOI] [PubMed] [Google Scholar]
- 82.Velasco F, Carrillo-Ruiz JD, Brito F, et al. Double-blind, randomized controlled pilot study of bilateral cerebellar stimulation for treatment of intractable motor seizures. Epilepsia. 2005;46(7):1071–1081. doi: 10.1111/j.1528-1167.2005.70504.x [DOI] [PubMed] [Google Scholar]
- 83.Boutet A, Madhavan R, Elias GJB, et al. Predicting optimal deep brain stimulation parameters for Parkinson’s disease using functional MRI and machine learning. Nat Commun. 2021;12(1):3043. doi: 10.1038/s41467-021-23311-9 [DOI] [PMC free article] [PubMed] [Google Scholar]
Associated Data
This section collects any data citations, data availability statements, or supplementary materials included in this article.
Supplementary Materials
Data Availability Statement
The data that support the findings in this study are available on request from the corresponding author.