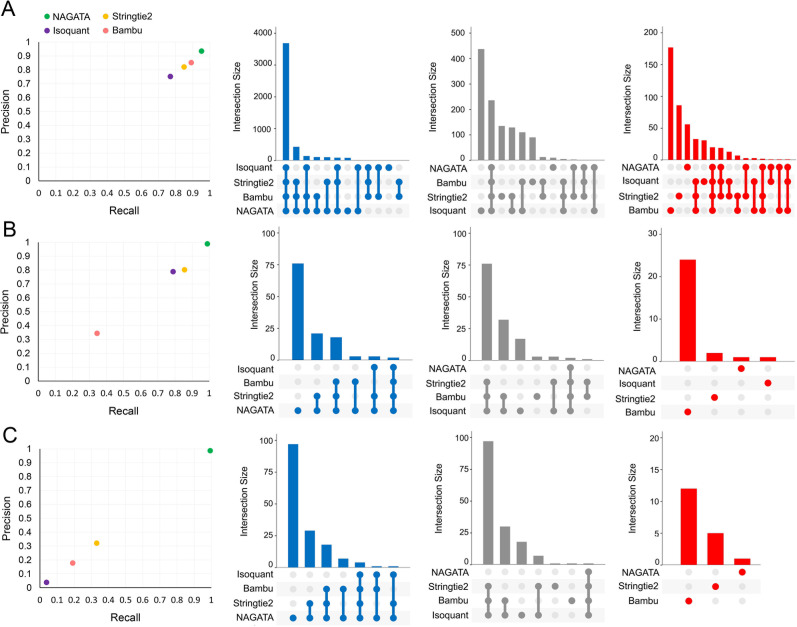
Fig 4.
Benchmarking NAGATA using synthetic data sets. Scatter plots comparing precision and recall values for NAGATA and three additional softwares [StringTie2 (18), Isoquant (20), and Bambu (19)] capable of de novo transcriptome annotation are supported by UpSet plots denoting the breakdown of true-positives (blue), false-negatives (gray), and false-positives (red) are shown for (A) H. sapiens HG38 assembly chromosome 1, (B) Adenovirus type 5 (HAdV-C5), and (C) VZV data sets.

